Oaktree Strategic Income Corporation
Oaktree Strategic Income — Merger or Acquisition (October 2020)
17 slides from Oaktree Strategic Income's merger presentation, Oct 29, 2020
Slide 1: Merger of OCSL & OCSI Investor Presentation
Merger of OCSL & OCSI October 29, 2020 Investor Presentation Exhibit 99.2
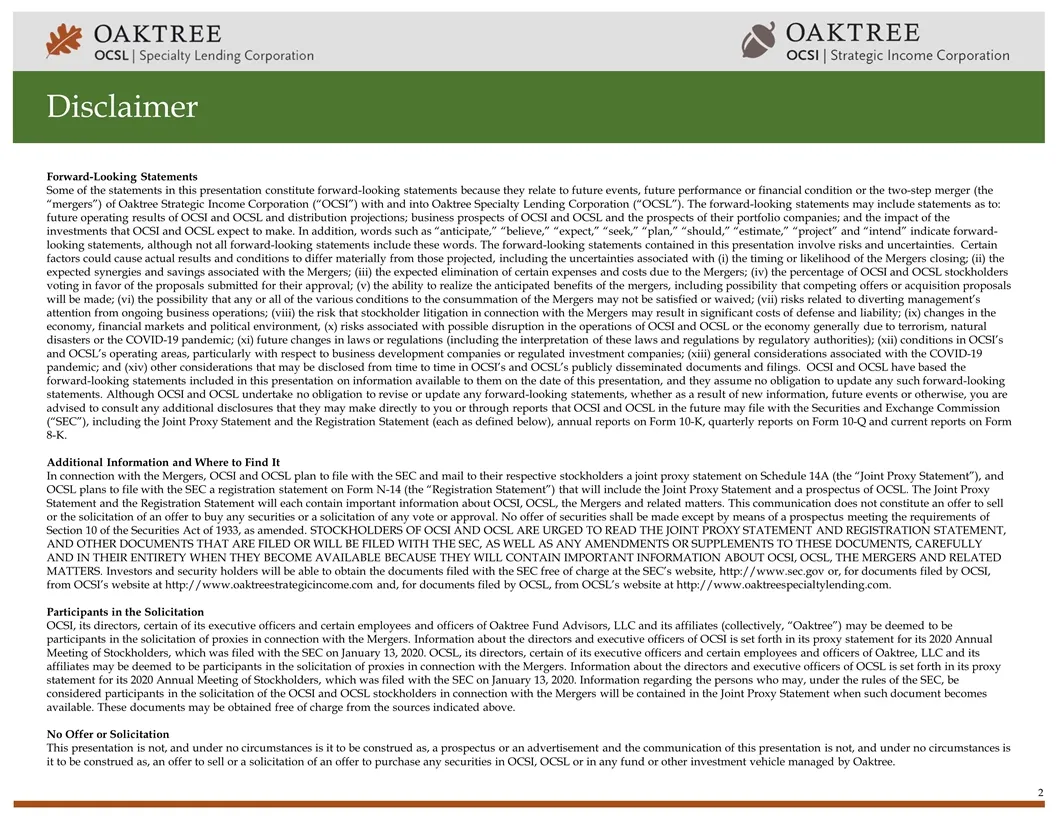
Slide 2: Disclaimer: Forward-Looking Statements
Disclaimer Forward-Looking Statements Some of the statements in this presentation constitute forward-looking statements because they relate to future events, future performance or financial condition or the two-step merger (the “mergers”) of Oaktree Strategic Income Corporation (“OCSI”) with and int
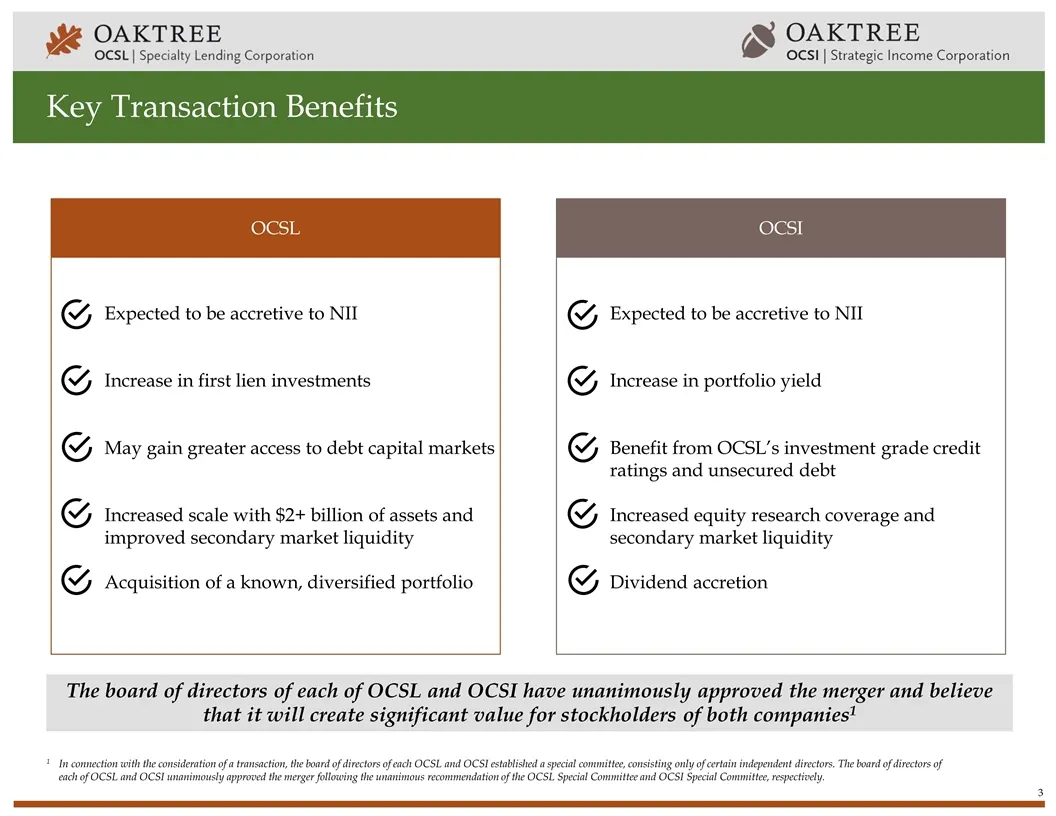
Slide 3: Key Transaction Benefits
Key Transaction Benefits 1In connection with the consideration of a transaction, the board of directors of each OCSL and OCSI established a special committee, consisting only of certain independent directors. The board of directors of each of OCSL and OCSI unanimously approved the merger following t
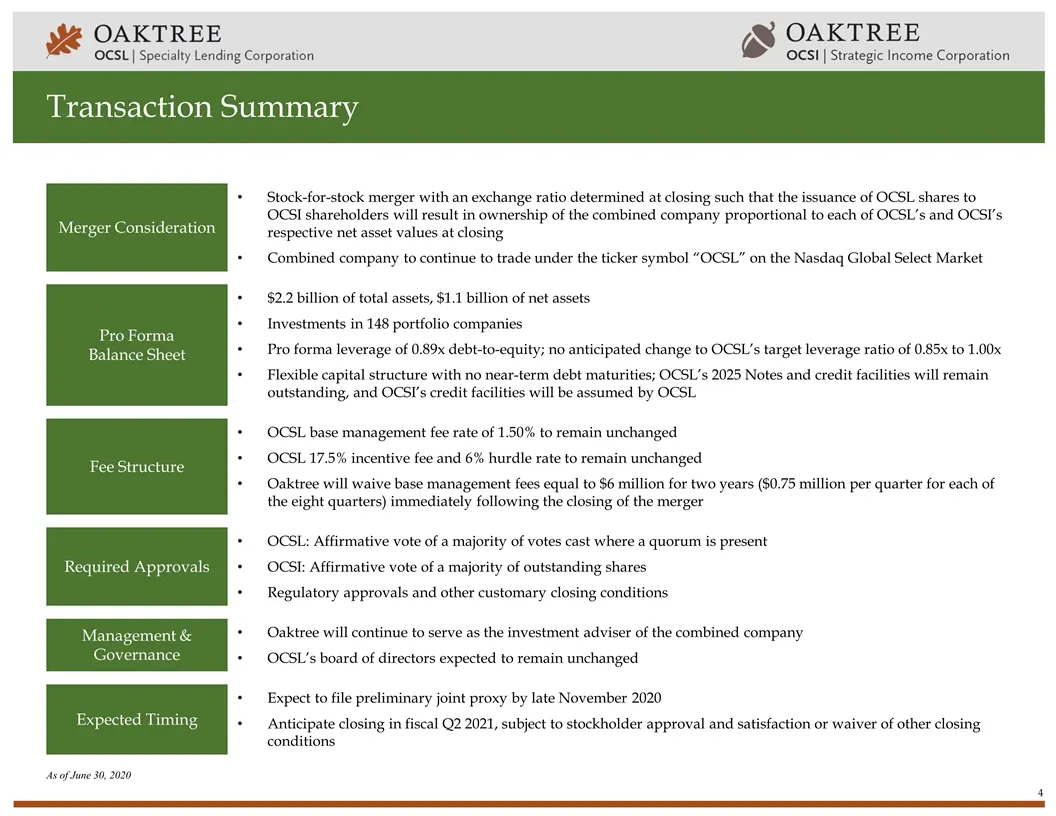
Slide 4: Transaction Summary
Transaction Summary Merger Consideration Stock-for-stock merger with an exchange ratio determined at closing such that the issuance of OCSL shares to OCSI shareholders will result in ownership of the combined company proportional to each of OCSL’s and OCSI’s respective net asset values at closing Co
Slide 5: Strategic Rationale
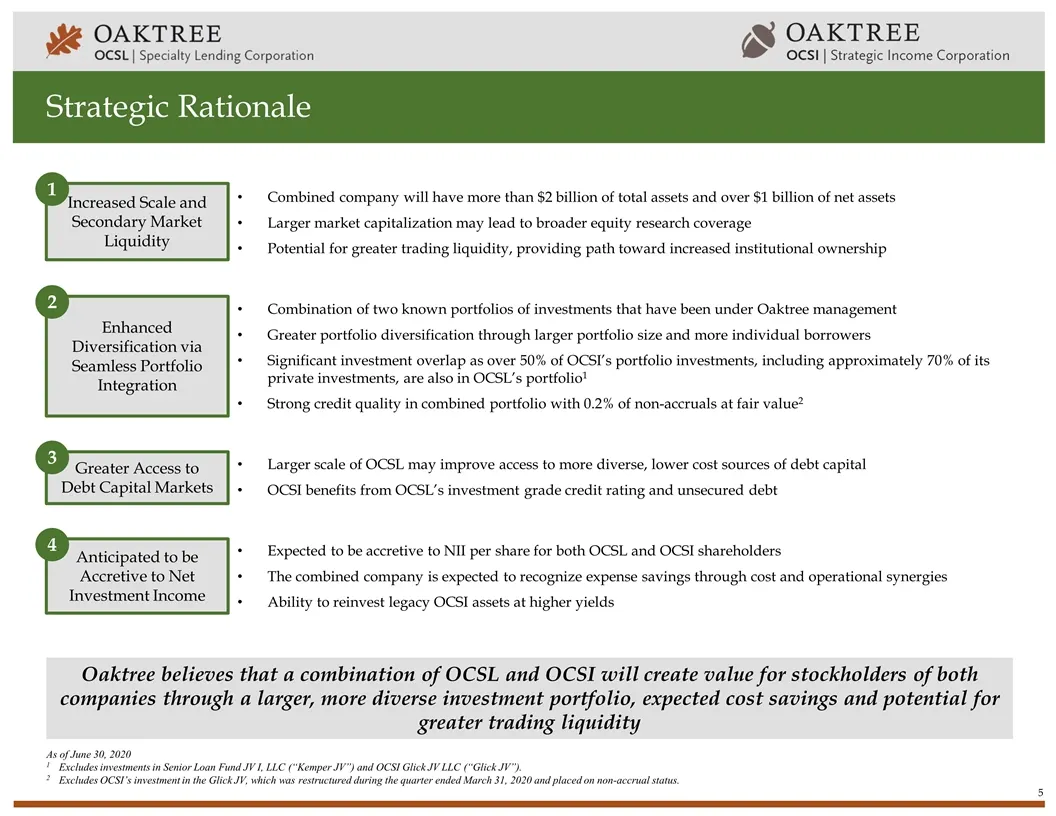
Strategic Rationale Increased Scale and Secondary Market Liquidity Combined company will have more than $2 billion of total assets and over $1 billion of net assets Larger market capitalization may lead to broader equity research coverage Potential for greater trading liquidity, providing path towar
Slide 6: OCSL at a Glance
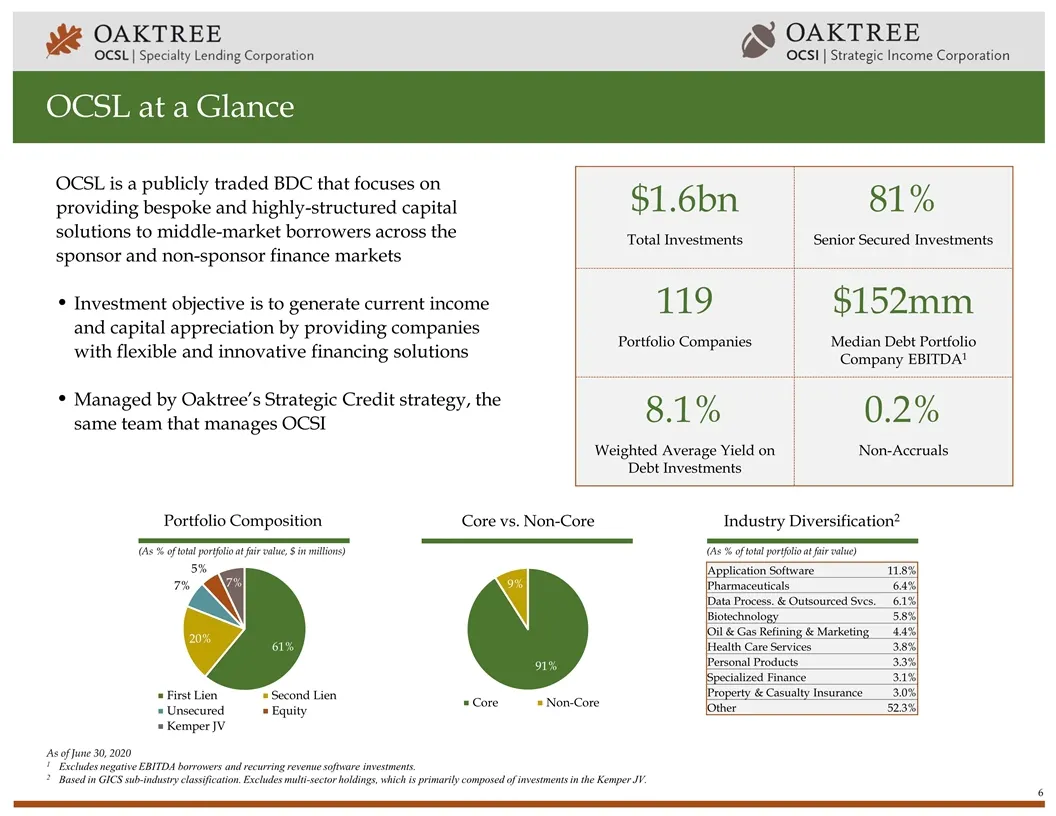
OCSL at a Glance OCSL is a publicly traded BDC that focuses on providing bespoke and highly-structured capital solutions to middle-market borrowers across the sponsor and non-sponsor finance markets Investment objective is to generate current income and capital appreciation by providing companies wi
Slide 7: OCSI at a Glance
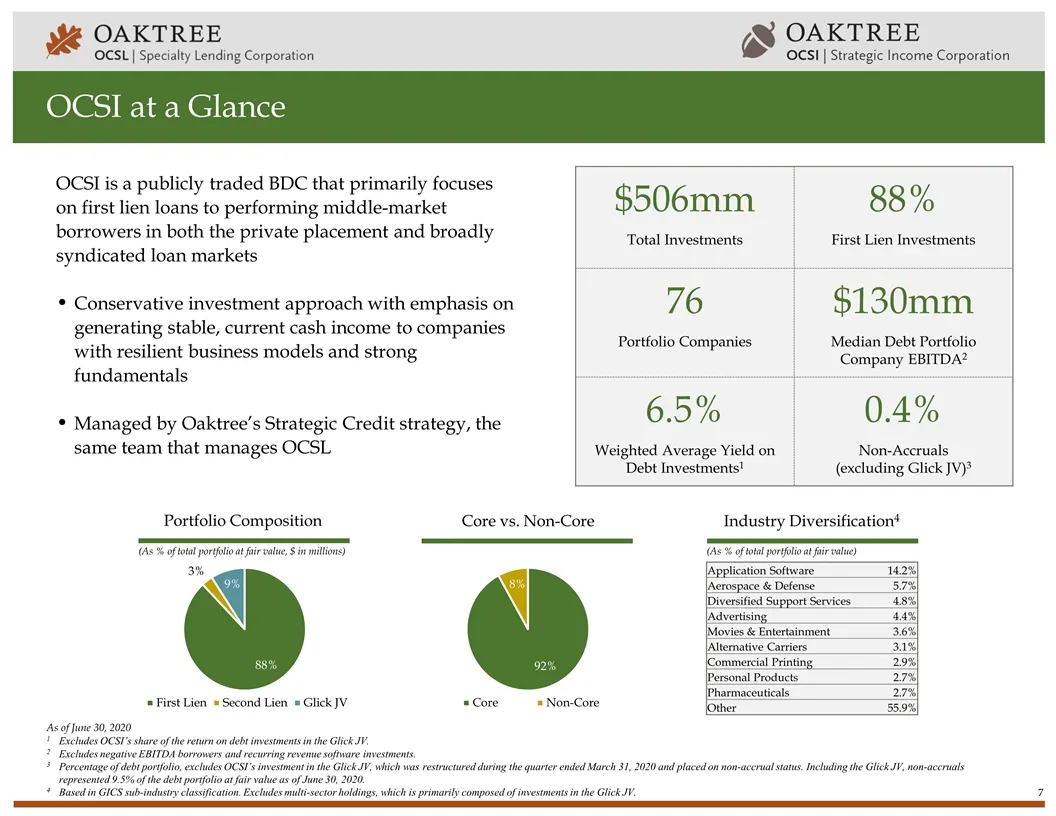
OCSI at a Glance OCSI is a publicly traded BDC that primarily focuses on first lien loans to performing middle-market borrowers in both the private placement and broadly syndicated loan markets Conservative investment approach with emphasis on generating stable, current cash income to companies with
Slide 8: Increased Scale and Secondary Market Liquidity
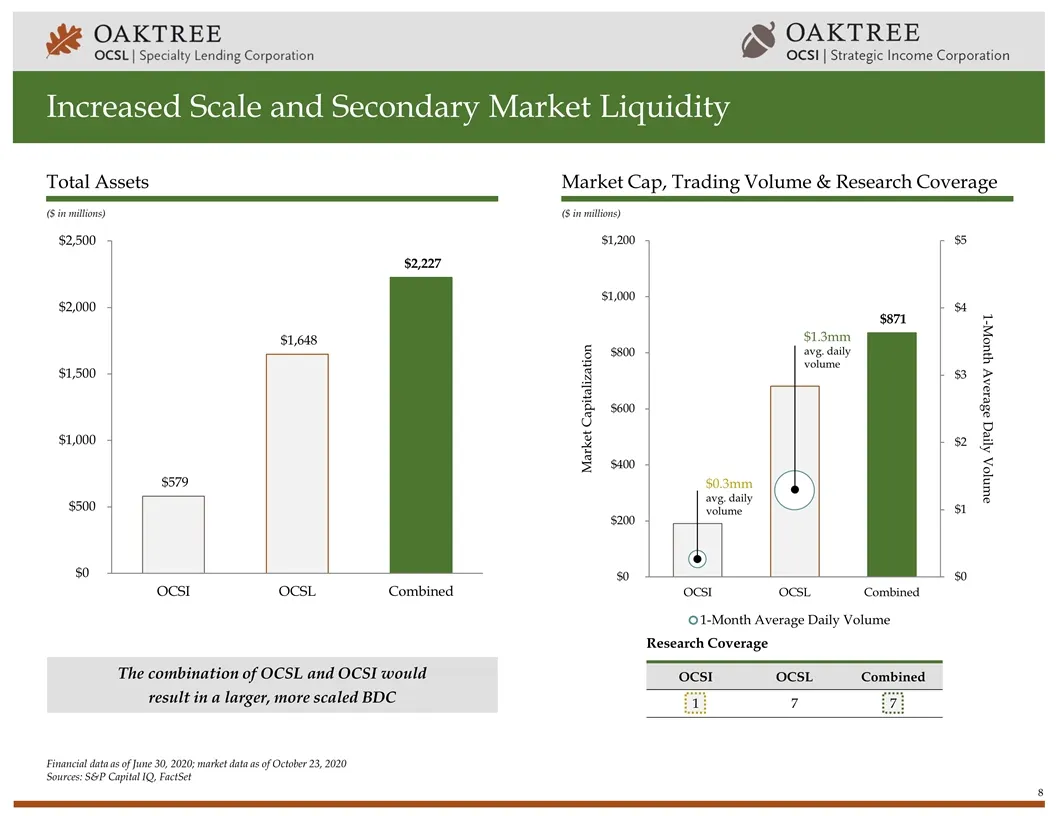
Increased Scale and Secondary Market Liquidity ($ in millions) ($ in millions) Total Assets Market Cap, Trading Volume & Research Coverage Financial data as of June 30, 2020; market data as of October 23, 2020 Sources:S&P Capital IQ, FactSet $0.3mm avg. daily volume $1.3mm avg. daily volume OCSI OCS
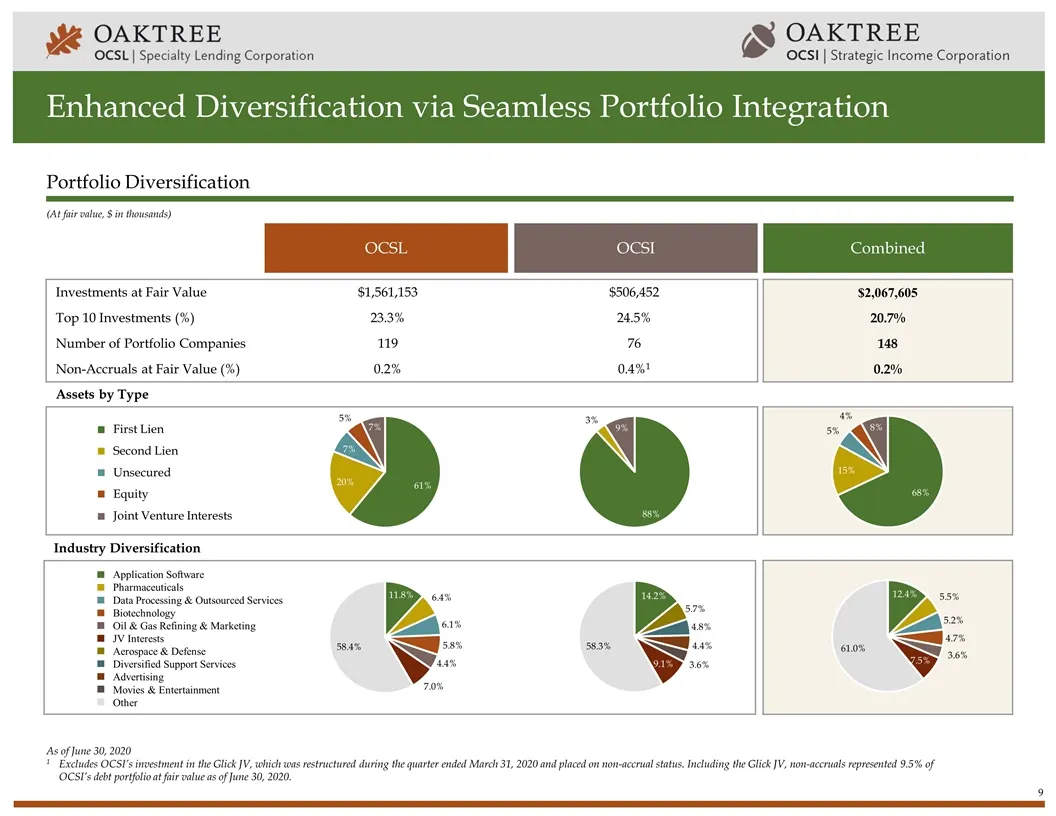
Slide 9: Enhanced Diversification via Seamless Portfolio Integration
Enhanced Diversification via Seamless Portfolio Integration (At fair value, $ in thousands) Portfolio Diversification OCSL OCSI Combined Investments at Fair Value $1,561,153 $506,452 Top 10 Investments (%) 23.3% 24.5% Number of Portfolio Companies 119 76 Non-Accruals at Fair Value (%) 0.2% 0.4%1 $2,
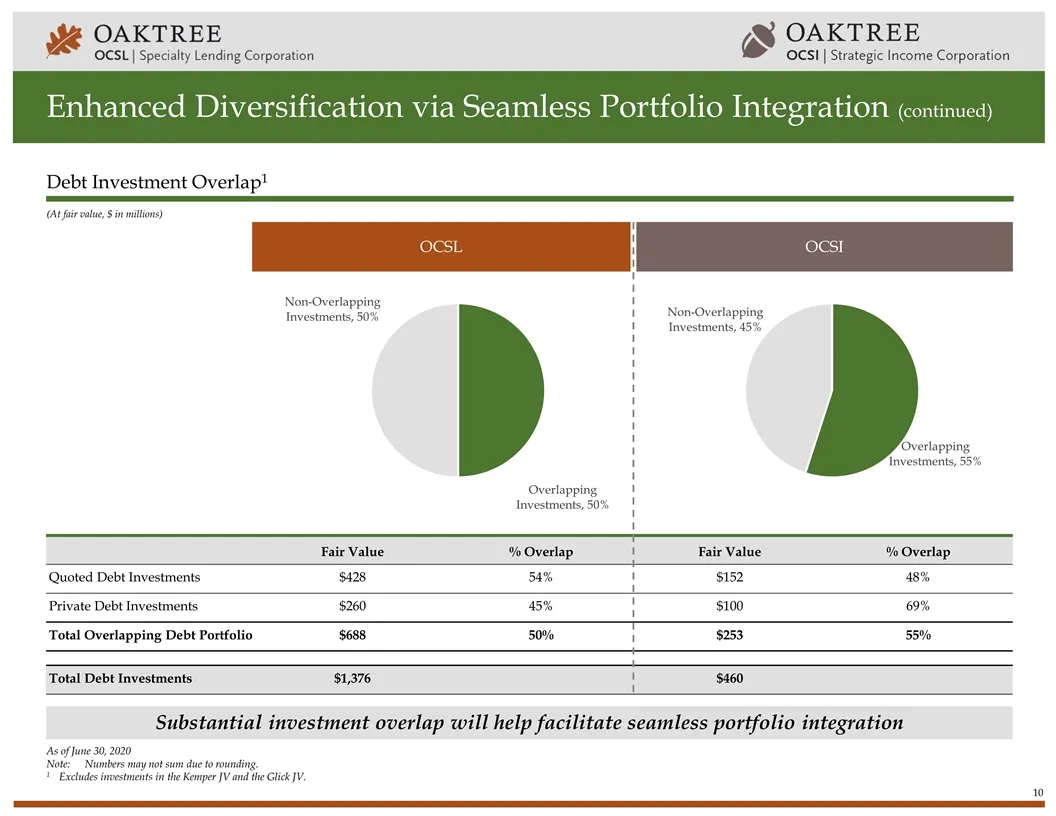
Slide 10: Enhanced Diversification via Seamless Portfolio Integration (continued)
Enhanced Diversification via Seamless Portfolio Integration (continued) Substantial investment overlap will help facilitate seamless portfolio integration (At fair value, $ in millions) Debt Investment Overlap1 Fair Value % Overlap Fair Value % Overlap Quoted Debt Investments $428 54% $152 48% Priva
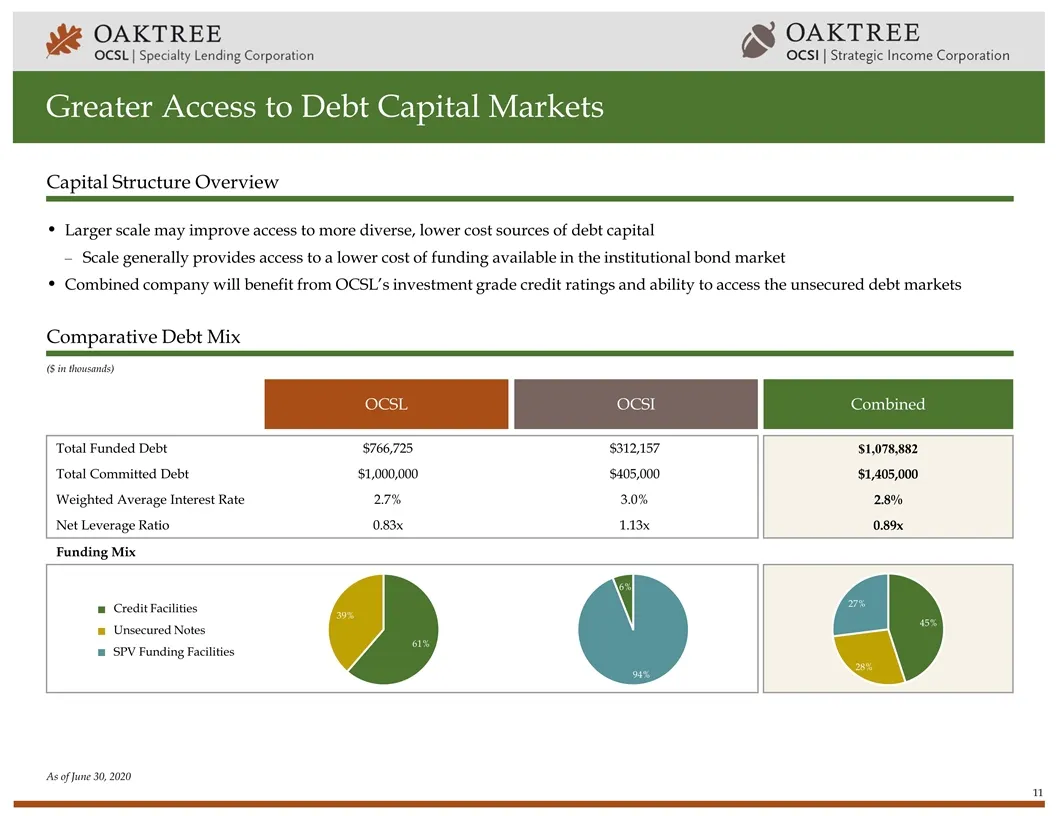
Slide 11: Greater Access to Debt Capital Markets
Greater Access to Debt Capital Markets ($ in thousands) Capital Structure Overview Comparative Debt Mix OCSL OCSI Combined Total Funded Debt $766,725 $312,157 Total Committed Debt $1,000,000 $405,000 Weighted Average Interest Rate 2.7% 3.0% Net Leverage Ratio 0.83x 1.13x $1,078,882 $1,405,000 2.8% 0
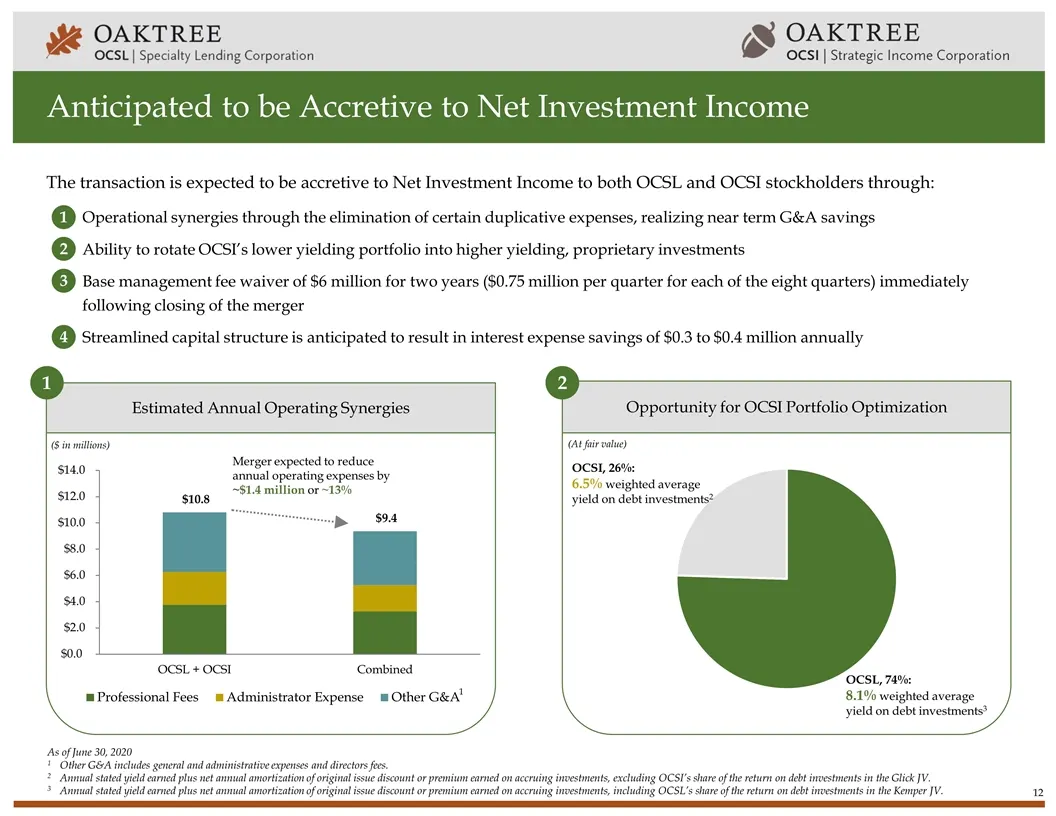
Slide 12: Anticipated to be Accretive to Net Investment Income
Anticipated to be Accretive to Net Investment Income The transaction is expected to be accretive to Net Investment Income to both OCSL and OCSI stockholders through: Operational synergies through the elimination of certain duplicative expenses, realizing near term G&A savings Ability to rotate OCSI’
Slide 13: Conclusion
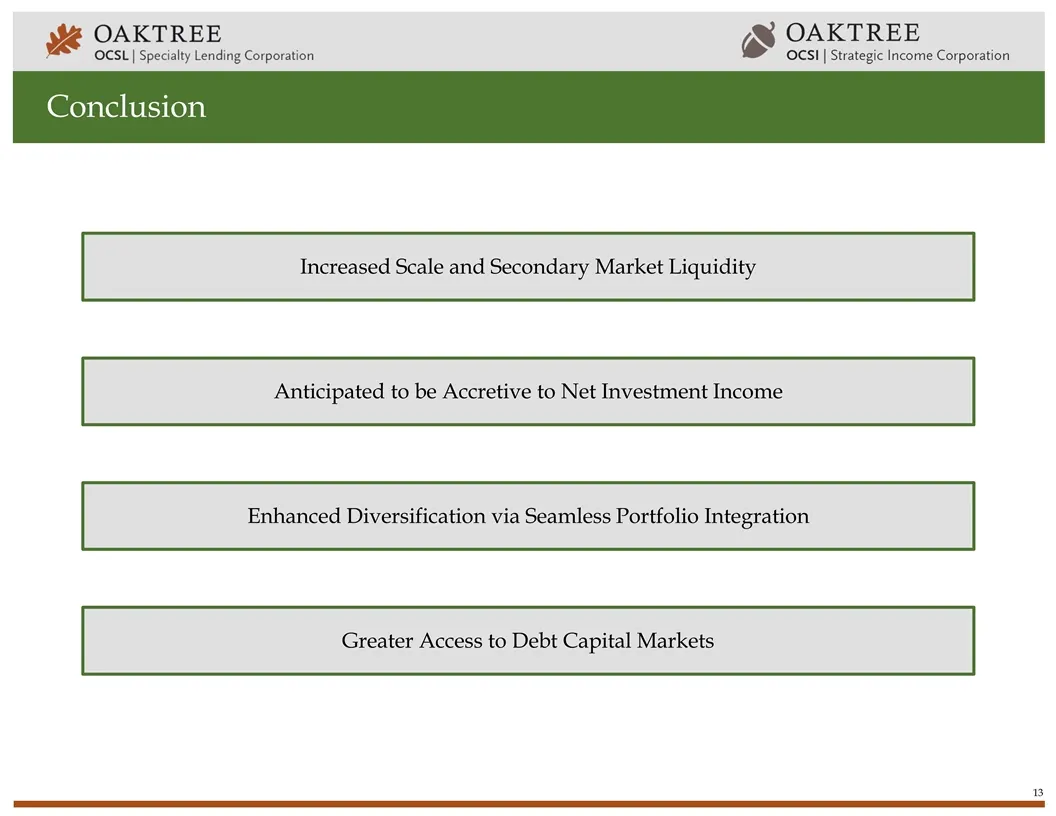
Conclusion Increased Scale and Secondary Market Liquidity Anticipated to be Accretive to Net Investment Income Enhanced Diversification via Seamless Portfolio Integration Greater Access to Debt Capital Markets
Slide 14: Indicative Transaction Timeline
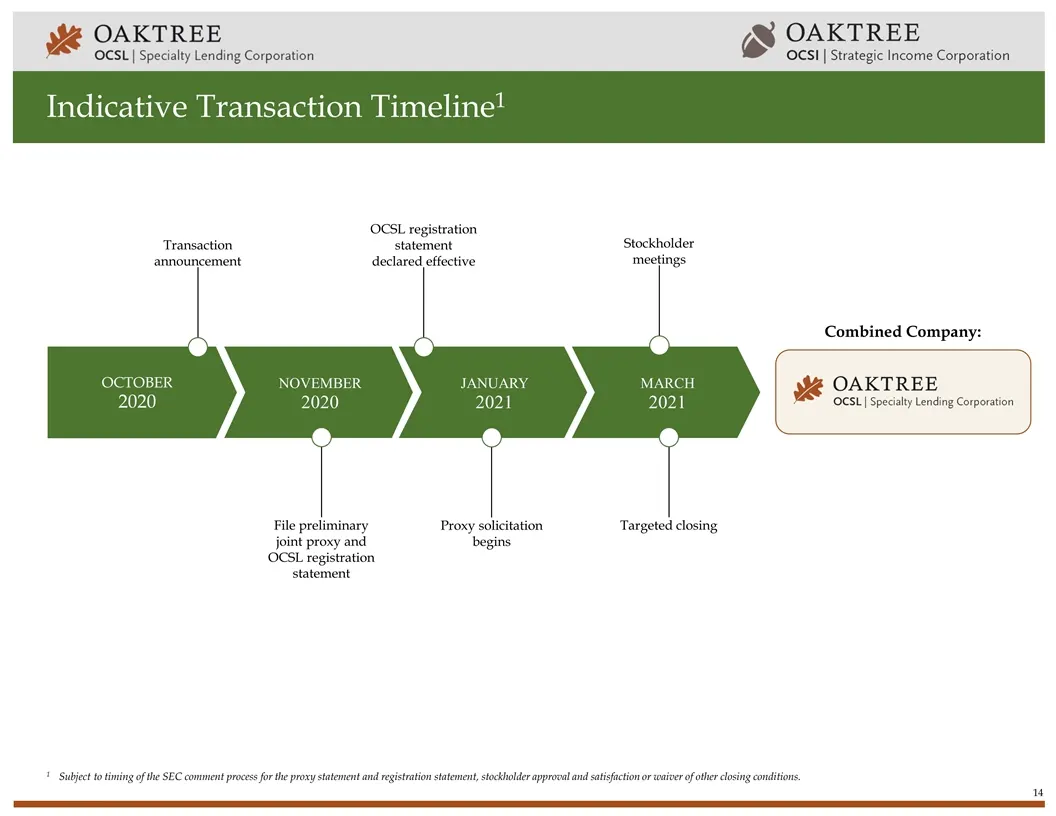
october 2020 november 2020 january 2021 march 2021 Indicative Transaction Timeline1 Transaction announcement File preliminary joint proxy and OCSL registration statement OCSL registration statement declared effective Proxy solicitation begins Stockholder meetings Targeted closing 1Subject to timing
Slide 15: Appendix
Appendix
Slide 16: Appendix I: Total Merger Consideration
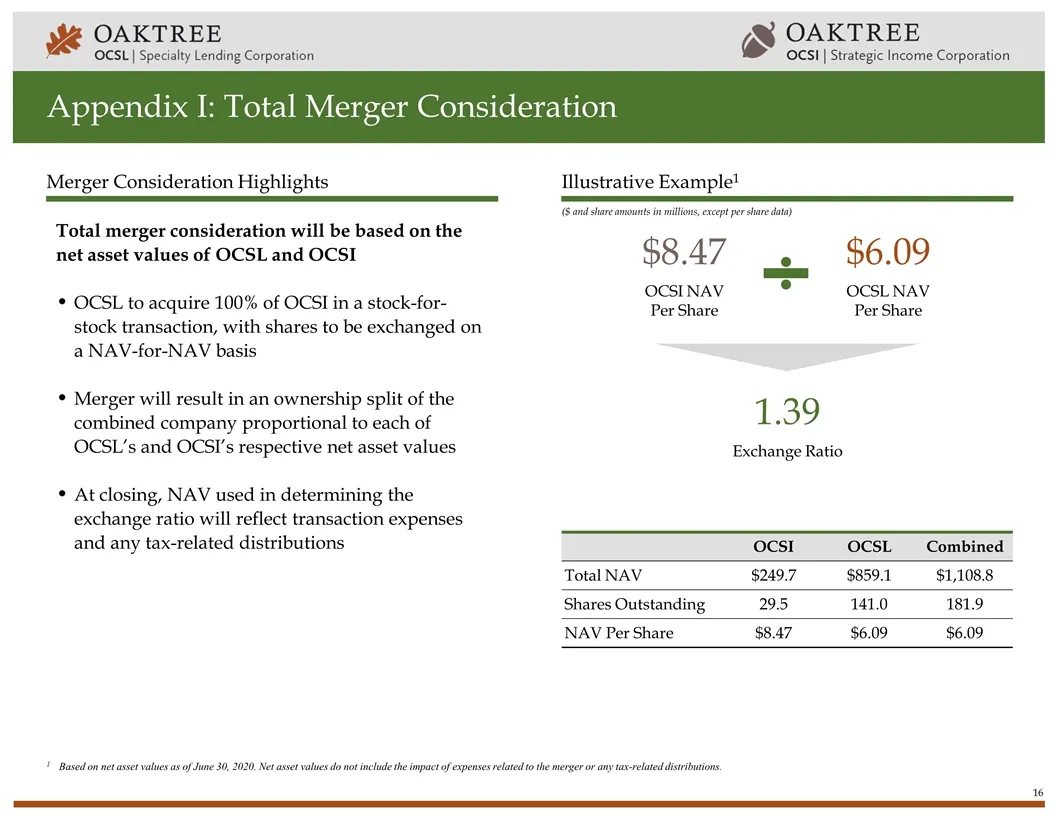
Appendix I: Total Merger Consideration Merger Consideration Highlights Illustrative Example1 OCSI OCSL Combined Total NAV $249.7 $859.1 $1,108.8 Shares Outstanding 29.5 141.0 181.9 NAV Per Share $8.47 $6.09 $6.09 Total merger consideration will be based on the net asset values of OCSL and OCSI OCSL
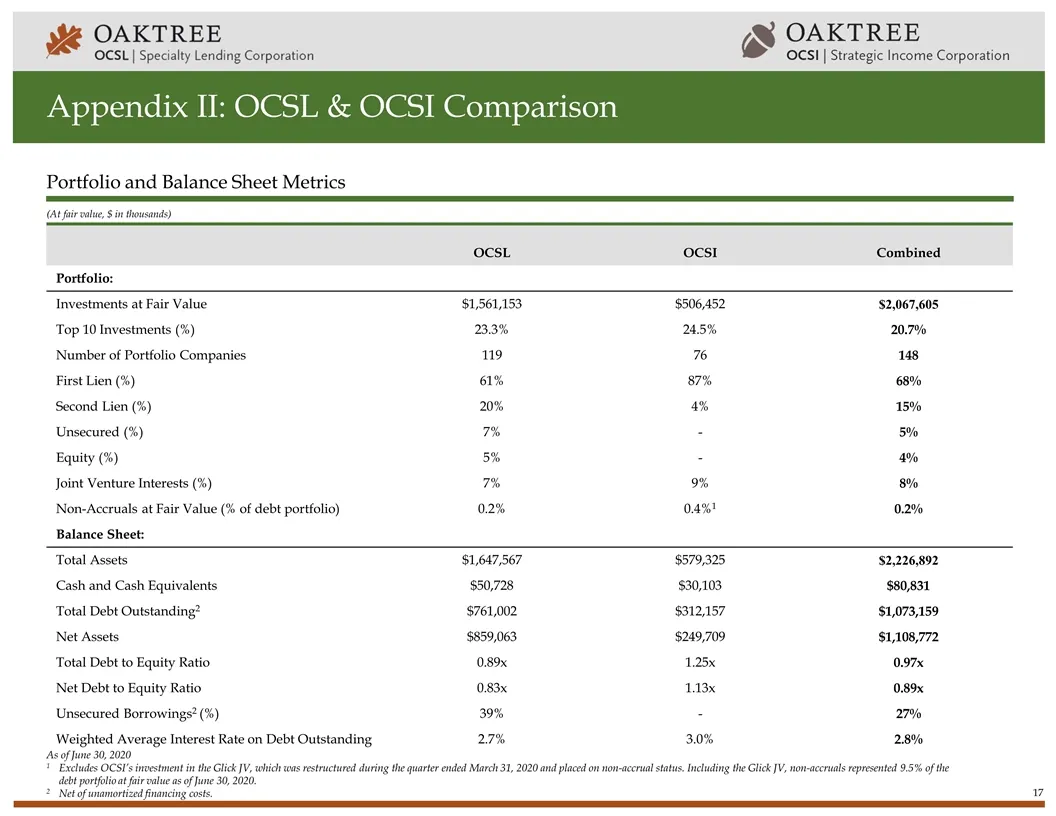
Slide 17: Appendix II: OCSL & OCSI Comparison
Appendix II: OCSL & OCSI Comparison (At fair value, $ in thousands) Portfolio and Balance Sheet Metrics OCSL OCSI Combined Portfolio: Investments at Fair Value $1,561,153 $506,452 $2,067,605 Top 10 Investments (%) 23.3% 24.5% 20.7% Number of Portfolio Companies 119 76 148 First Lien (%) 61% 87% 68%
Source: SEC EDGAR · 425 filed Oct 29, 2020
More decks from Oaktree Strategic Income Corporation
 Q1 2021 Earnings Presentation28 slides · Feb 17, 2021
 Q1 2021 Earnings Presentation33 slides · Feb 17, 2021
 Q1 FY2021 Earnings Presentation19 slides · Feb 4, 2021
 Q1 FY2021 Earnings Presentation23 slides · Feb 4, 2021
 Merger or Acquisition (December 2020)27 slides · Dec 8, 2020
 Q4 2020 Earnings Presentation34 slides · Dec 8, 2020