Inland Real Estate — Investor Presentation (November 2005)
70 slides from Inland Real Estate's investor presentation, Nov 1, 2005
Slide 1: Inland Real Estate Corporation
Inland Real Estate Corporation
Slide 2: Forward Looking Statements
FORWARD LOOKING STATEMENTS * These presentation materials contain forward-looking statements, Forwarl- looking statements are statements that are not historical, including statements regarding management's intentions, beliefs, expectations, representations, plans or predictions of the future, and ar
Slide 3: Introduction
INTRODUCTION ROBERT D. PARKS President and Chief Executive Officer
Slide 4: Company Overview
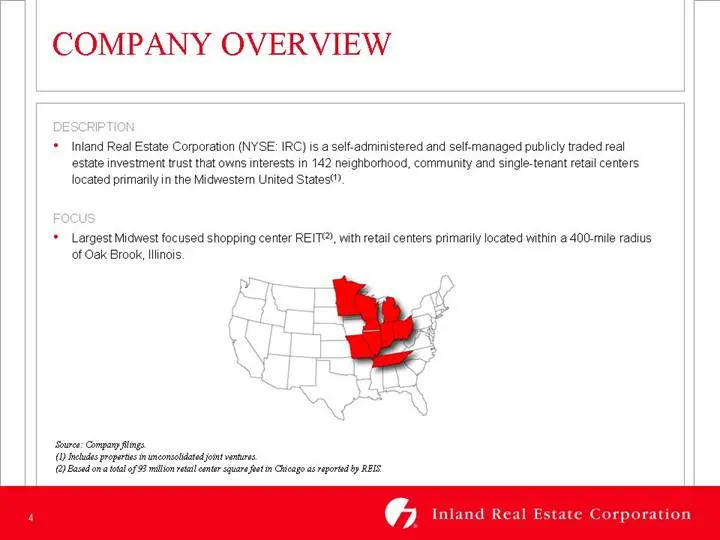
COMPANY OVERVIEW DE: * Inland Real Estate Corporation (NYSE: IRC) isa selt-administered and self managed publicly traded real estate investment trust that owns interests in 142 neighborhood, community and single-tenant retail centers focated primanly in the Midwestern United States, IPTION Focu * La
Slide 5: Company Overview: Strengths
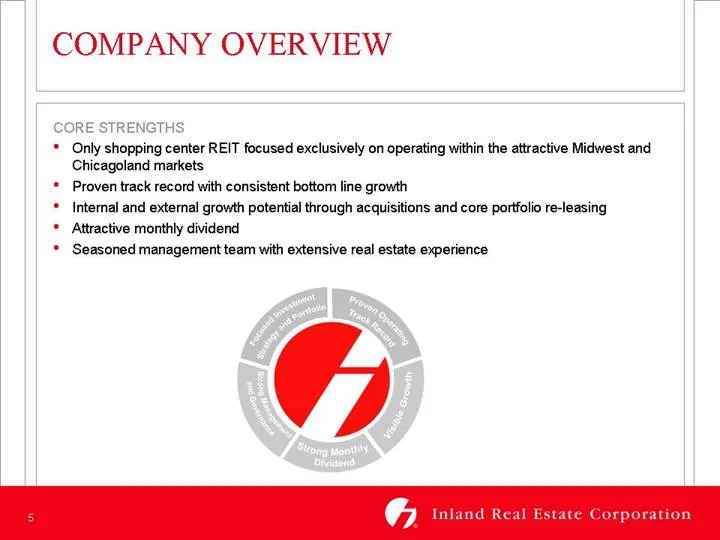
COMPANY OVERVIEW TRENGTHS * Only shopping center REIT focused exclusively on operating within the attractive Chicagoland markets * Proven track record with consistent bottom line growth Internal and external growth potential through acquisitions and core portfolio re-leasing * Attractive monthly div
Slide 6: Agenda
AGENDA ANTAGE * INLAND'S GROWTH STRATEGY — |. Acquisitions — Bill Anderson, Vice President of Transactions II, Development — Mark Zalatoris, Chief Operating Officer * INLAND’S EXECUTION EXPERTISE Ill, Operations — Kristi Rankin, Senior Vice President of Property Management IV. Minnesota — Rick Pless
Slide 7: Inland's Growth Strategy
INLAND’S GROWTH STRATEGY
Slide 8: I. Acquisitions
I. ACQUISITIONS WILLIAM W. ANDERSON Vice President, Transactions
Slide 9: Acquisition Strategy
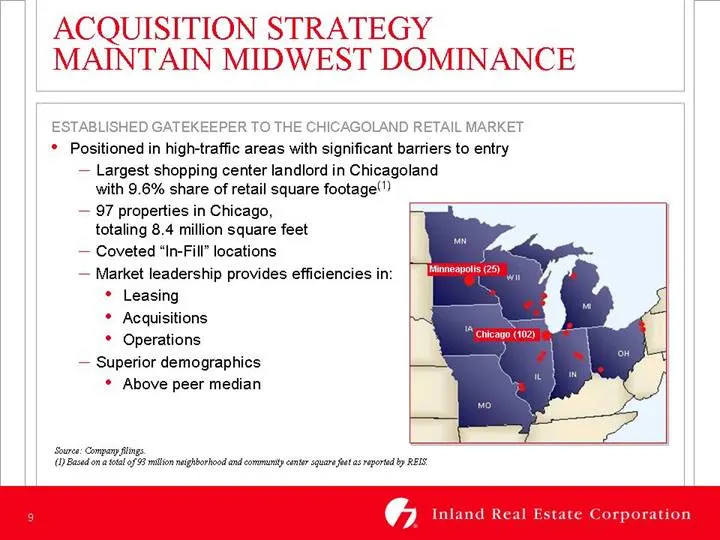
ACQUISITION STRATEGY MAINTAIN MIDWEST DOMINANCE ESTAI SHED KEEPER TO THE CHICAGOLAND RETAIL MARKET * Positioned in high-traffic areas with significant barriers to entry — Largest shopping center landlord in Chicagoland with 9.6% share of retail square footage!) — 97 properties in Chicago, totaling 8
Slide 10: Portfolio Snapshot
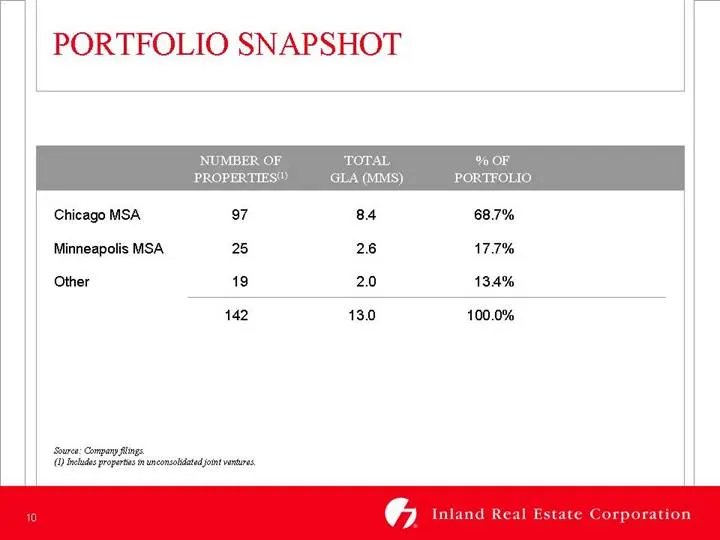
PORTFOLIO SNAPSHOT Chicago MSA 97 84 68.7% Minneapolis MSA 25 26 177% Other 19 2.0 13.4% 142 13.0 100.0% Source: Company ftngs. (ees ropa unconabdated on vets
Slide 11: Acquisition Criteria
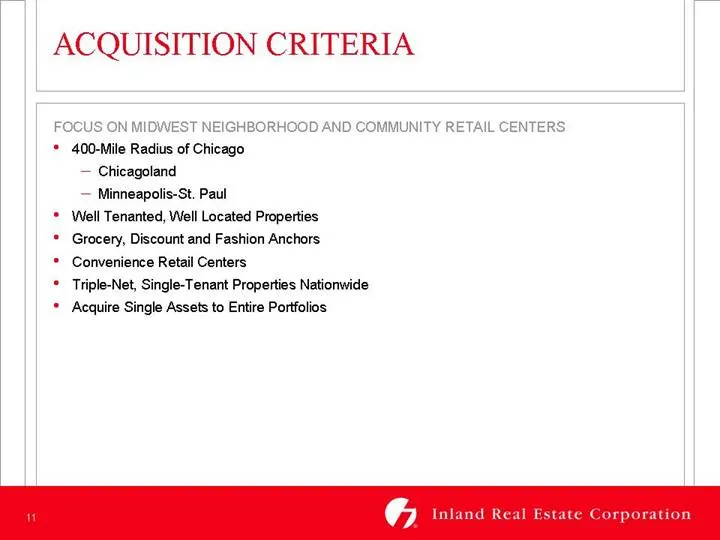
ACQUISITION CRITERIA ST NEIGHBORHOOD AND * 400-Mile Radius of Chicago — Chicagoland IMMUNITY RETAIL CENTERS Minneapolis-St. Paul * Well Tenanted, Well Located Properties * Grocery, Discount and Fashion Anchors * Convenience Retail Centers * Triple-Net, Single-Tenant Properties Nationwide * Acquire S
Slide 12: Recent Acquisitions
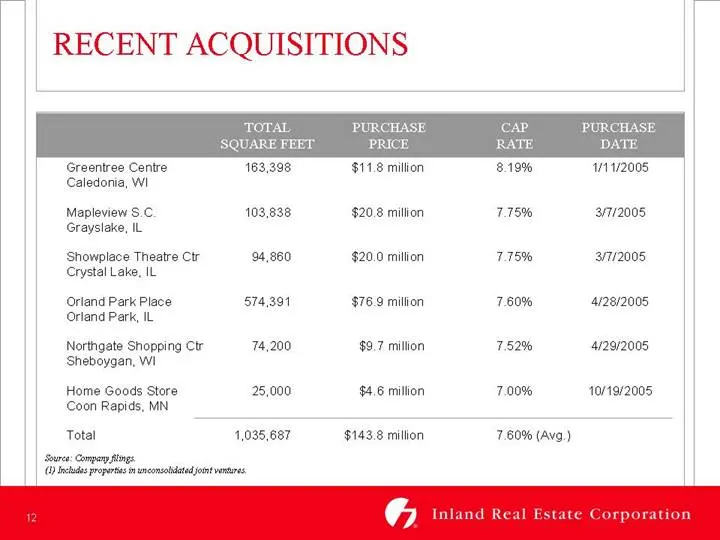
RECENT ACQUISITIONS Greentree Centre 163,398 $14.8 million 8.19% 11/2005 Caledonia, WI Mapleview S.C 103,838 $20.8 million 7.75% 3112005 Grayslake, IL Showplace Theatre Ctr 94,960 $20.0 milion 775% 3/7/2005 Crystal Lake, IL Orland Park Place 574,391 $769 milion 7.60% 4128/2005 Orland Park, IL Northg
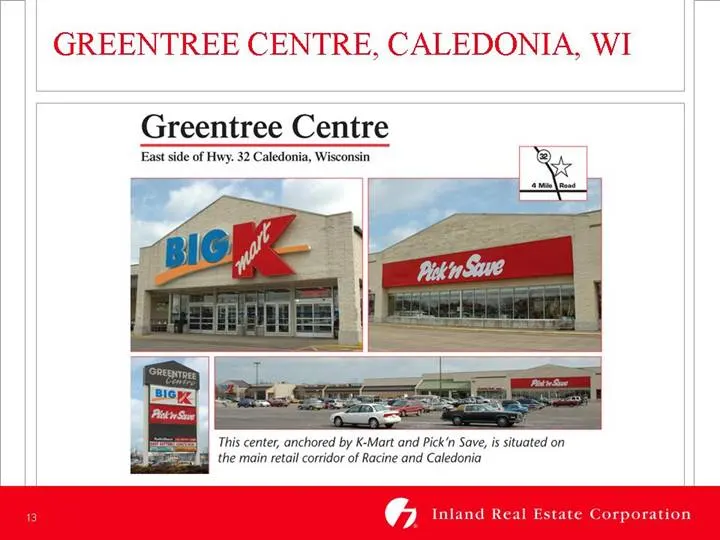
Slide 13: Greentree Centre, Caledonia, WI
GREENTREE CENTRE, CALEDONIA, WI Greentree Centre East side of Hwy. 32 Caledonia, Wisconsin om is situated on
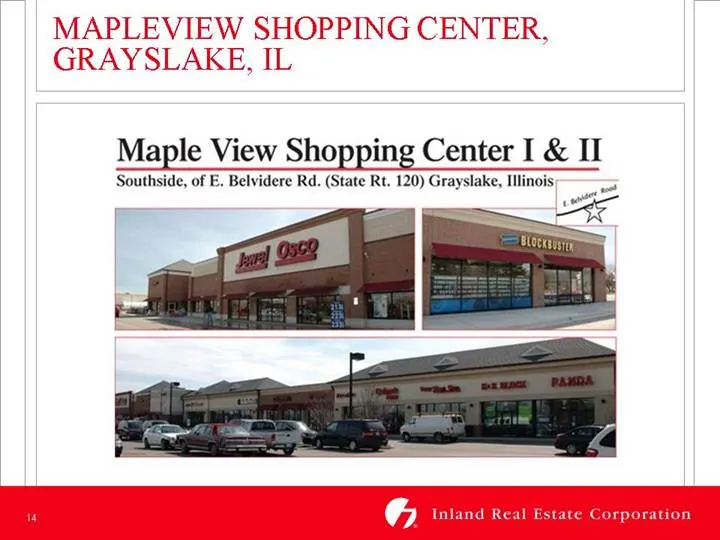
Slide 14: Maple View Shopping Center I & II
Maple View Shopping Center I & II Southside, of E. Belvidere Rd. (State Rt. 120) Grayslake, Illinois, =
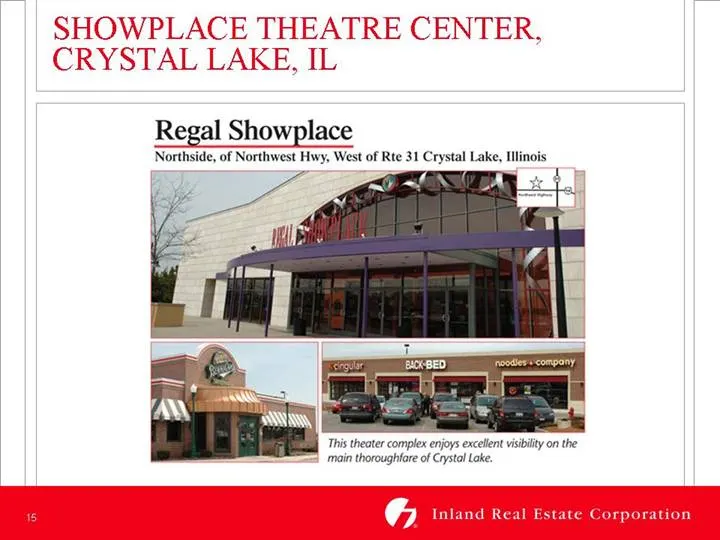
Slide 15: Regal Showplace Theatre Center, Crystal Lake, IL
E CENTER URYSLAL LAKE, IL Regal Showplace Northside, of Northwest Hwy, West of Rte 31 Cr This theater complex enjoys excellent visibility on the ‘main thoroughfare of Crystal Lake.
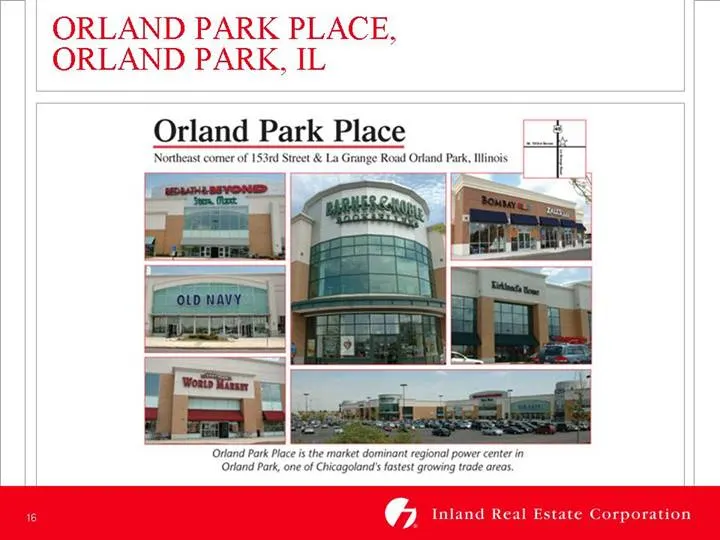
Slide 16: Orland Park Place
Orland Park Place Northeast comer of 153rd Street & La Grange Rowd Orland Park, Iinois Js the market dominant regional power center in ‘Orland Park, one of Chicagoland's fastest growing trade area.
Slide 17: Focus on Acquisitions
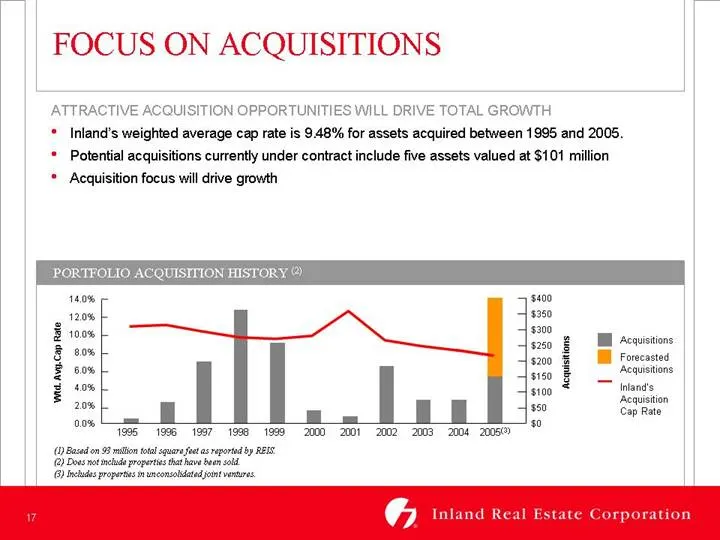
FOCUS ON ACQUISITIONS ATTRACTIVE ACQUISITION OPPORTUNITIES WILL DRIVE TOTAL GROWTH. * Inland’s weighted average cap rate is 9.48% for assets acquired between 1995 and 2005. * Potential acquisitions currently under contract include five assets valued at $101 million * Acquisition focus will drive gro
Slide 18: Pipeline Strength
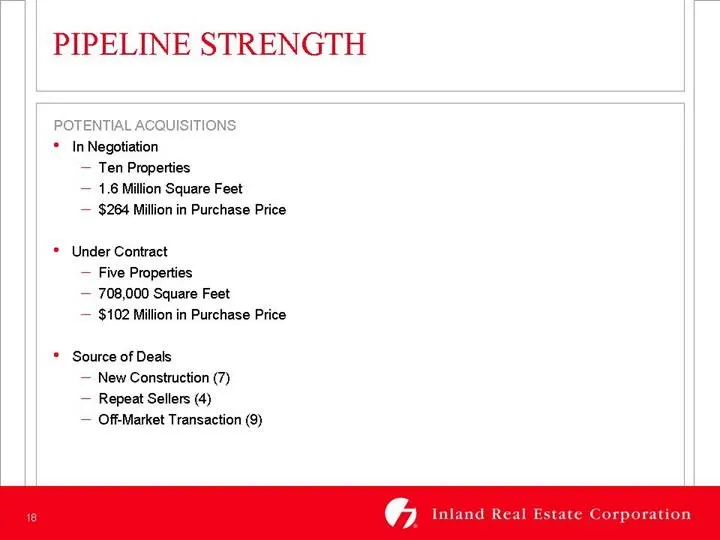
PIPELINE STRENGTH ENTIAL ACQUISITIC * In Negotiation ~ Ten Properties — 1.6 Million Square Feet — $264 Million in Purchase Price * Under Contract — Five Properties — 708,000 Square Feet — $102 Million in Purchase Price * Source of Deals — New Construction (7) — Repeat Sellers (4) — Off Market Transa
Slide 19: New Markets
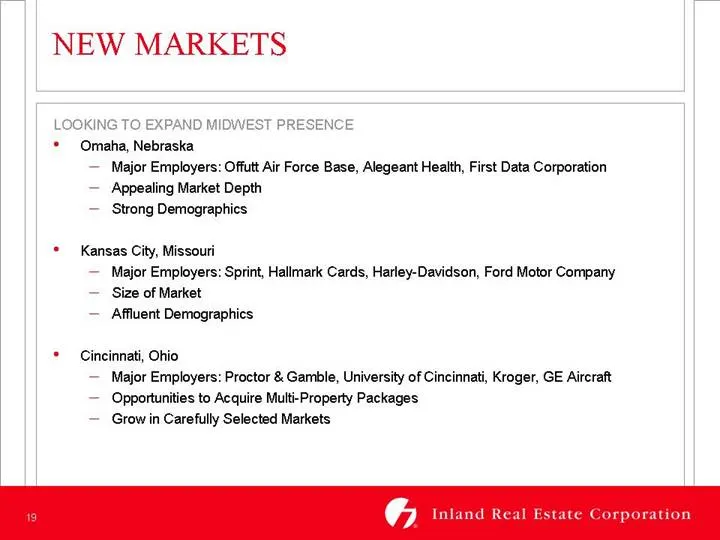
NEW MARKETS * Omaha, Nebraska Major Employers: Offutt Air Force Base, Alegeant Health, First Data Corporation Appealing Market Depth Strong Demographics * Kansas City, Missouri Major Employers: Sprint, Hallmark Cards, Harley-Davidson, Ford Motor Company Size of Market Affluent Demographics * Cincinn
Slide 20: II. Development
I]. DEVELOPMENT MARK E. ZALATORIS Chief Operating Officer
Slide 21: Local Relationships
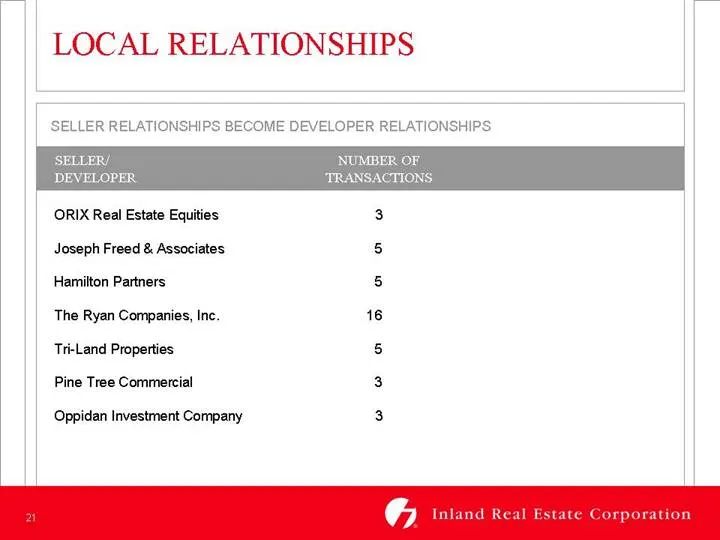
LOCAL RELATIONSHIPS SELLER RELATIONSHIPS BECOME DEVELOPER RELATIONSHIPS. ORIX Real Estate Equities 3 Joseph Freed & Associates 5 Hamilton Partners 5 ‘The Ryan Companies, Inc. 16 Tri-Land Properties 5 Pine Tree Commercial 3 Oppidan Investment Company 3
Slide 22: Case Study: Aurora, IL
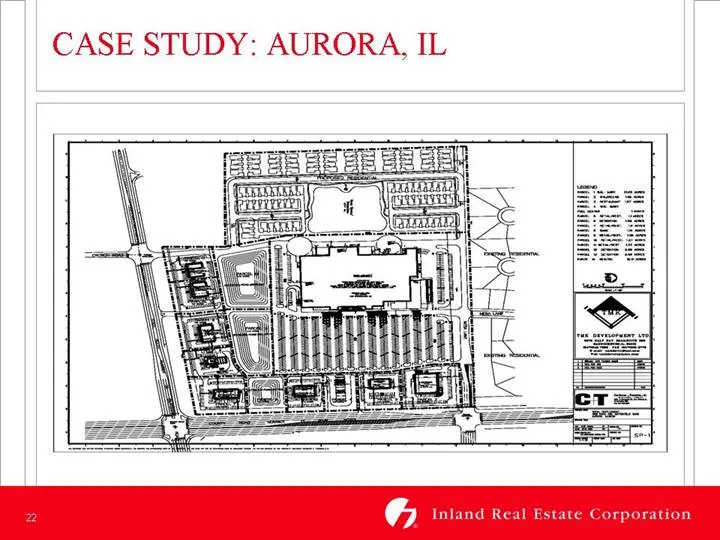
CASE STUDY: AURORA, IL
Slide 23: Case Study: Lino Lakes, MN
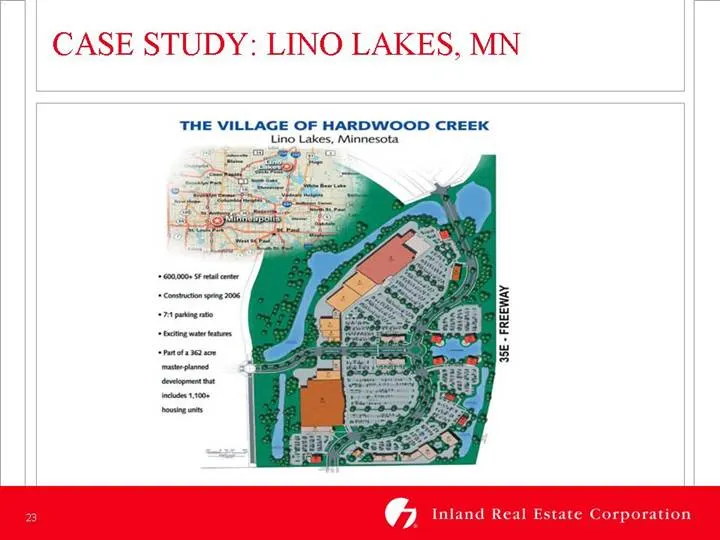
CASE STUDY: LINO LAKES, MN THE VILLAGE OF HARDWOOD CREEK
Slide 24: Asset-Based Joint Ventures
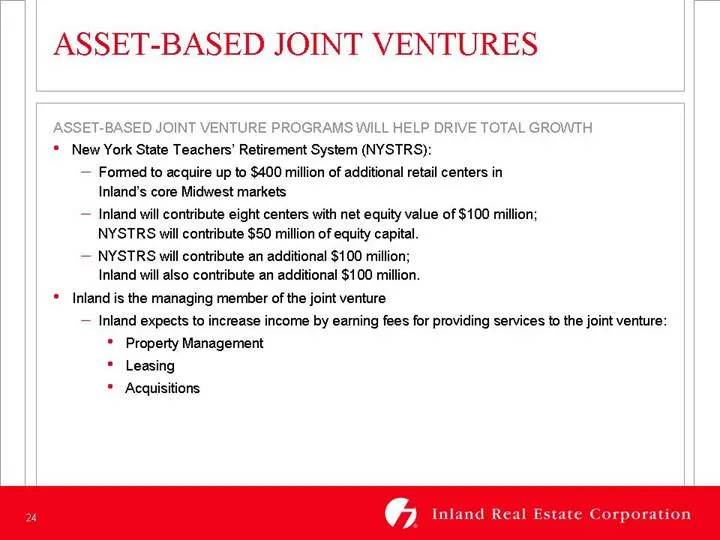
ASSET-BASED JOINT VENTURES SSET-BASED JOINT VENTURE P NILL HELP DRIVE TOTAL GROWTH * New York State Teachers’ Retirement System (NYSTRS): Formed to acquire up to $400 million of additional retail centers in Inland’s core Midwest markets Inland will contribute eight centers with net equity value of $
Slide 25: Questions & Answers
QUESTIONS & ANSWERS
Slide 26: Inland's Execution Expertise
INLAND’S EXECUTION EXPERTISE
Slide 27: III. Operations
III. OPERATIONS KRISTI A. RANKIN Senior Vice President, Inland Commercial Property Management, Inc.
Slide 28: Proven Operating Track Record
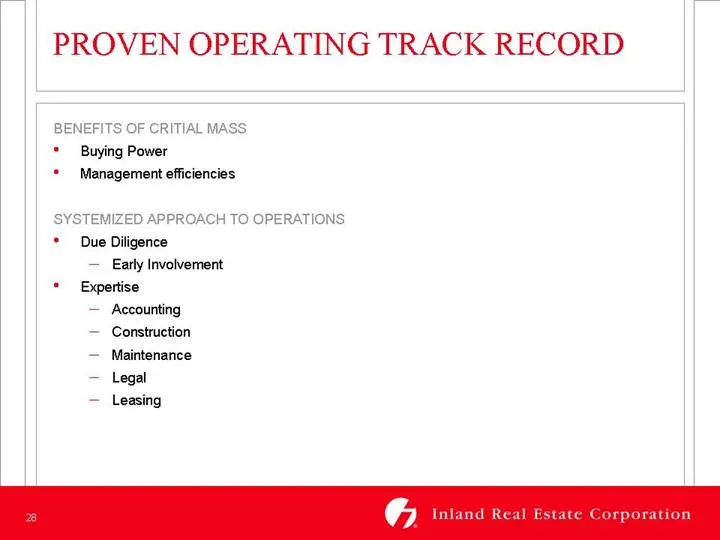
PROVEN OPERATING TRACK RECORD BENEFITS OF CRITIAL MASS * Buying Power * Management efficiencies SYSTEMIZED APPROACH TO OPERATIONS * Due Diligence — Early Involvement + Bypertise — Accounting — Construction — Maintenance — Legal — Leasing
Slide 29: Focused Cost Control
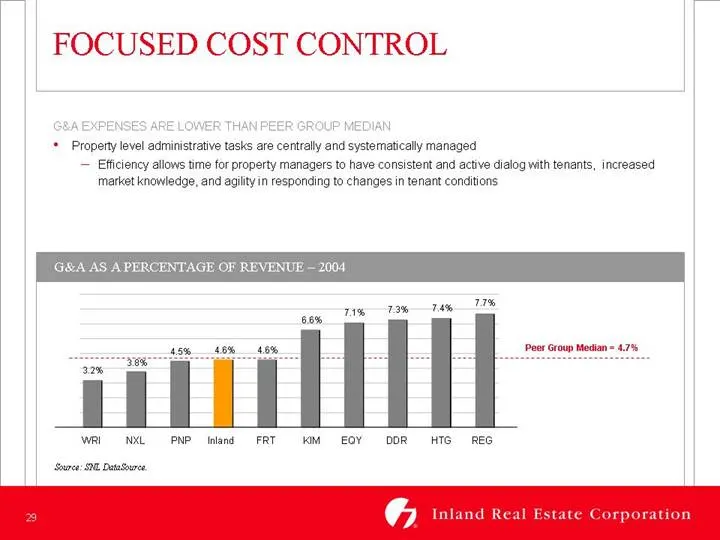
FOCUSED COST CONTROL GBA EXPENSES ARE LOWER THAN PEER GROUP Ny * Propeny level administrative tasks are centrally and systematically managed — Efficiency allows time for property managers to have consistent and active dialog with tenants, increased market knowledge, and agility in responding to chan
Slide 30: Diversified Portfolio
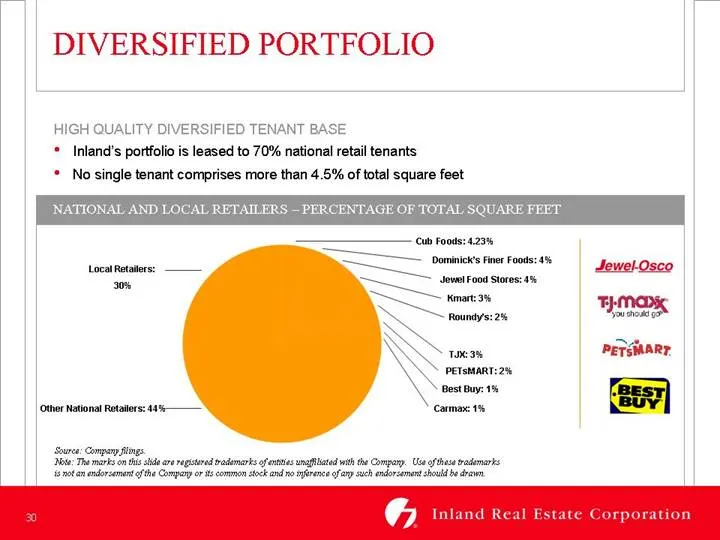
DIVERSIFIED PORTFOLIO HIGH QUALITY DIVERSIFIED TENANT BASE * Inland’s portfolio is leased to 70% national retail tenants * No single tenant comprises more than 4.5% of total square feet Cu Foods: 4.23% oS oth Po Fst ery rey S TMK PeTsiNaRT, ‘ther National Rtairs: 44%" See: Company ngs ‘se: Th mars o
Slide 31: Stable Lease Rollover
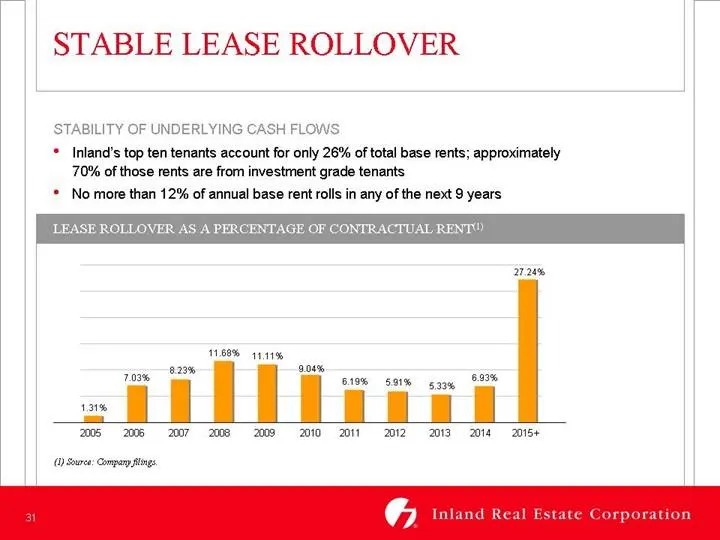
STABLE LEASE ROLLOVER STABILITY OF UNDERLYING CASH FLOWS * Inland's top ten tenants account for only 26% of total base rents; approximately 70% of those rents are from investment grade tenants * No more than 12% of annual base rent rolls in any of the next 9 years LEASE ROLLOVER AS A PERCENTAGE OF C
Slide 32: Partnerships with Retailers
PARTNERSHIPS WITH RETAILERS OUR TENANTS ARE OUR MOST VALUABLE ASSETS * Tenant Relations Committee — Proactively address tenant needs * 24M7 Service Request Center * Customer Surveys

Slide 33: IV. Minnesota Portfolio
IV. MINNESOTA PORTFOLIO RICK PLESSNER Vice President, Inland Commercial Property Management, Inc.
Slide 34: The Minnesota Market
THE MINNESOTA MARKET MINNEAPOLIS/ST, PAUL IS ONE OF THE MIDWEST’S MOST STABLE ECONOMIES * Diverse Employment Base * High Average Household Incomes * Below Average Unemployment Rate * Consistent, Moderate Population Growth * 7 Largest Retail Market in the Country * Appealing Temperate Climate
Slide 35: Bergen Plaza, Oakdale, MN
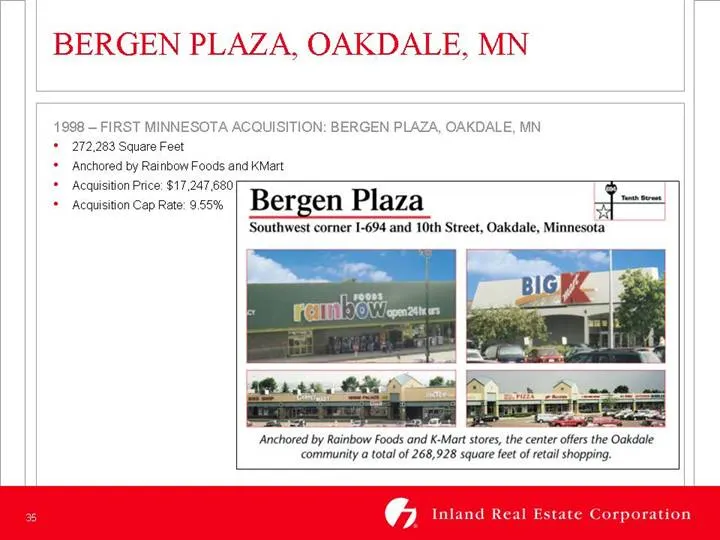
BERGEN PLAZA, OAKDALE, MN 1998 — FIRST MINNESOTA ACQUISITION: BERGEN PLAZA, OAKDALE, MN 272,283 Square Feet ‘Anchored by Rainbow Foods and KMart Acquisition Price: $17,247,680 | ‘Acquisition Cap Rate: 9.55% Bergen Plaza = ‘Southwest corner 1-694 and 10th Street, Oakdale, Minnesota ‘Anchored by Rainb
Slide 36: Acquisition of Ryan Portfolio
ACQUISITION OF RYAN PORTFOLIO 1999 - IRC ACQUIRES RYAN PORTFOLIO * $98 Million Transaction * Stabilized Portfolio of Nine Properties — Totaling 935,000 Square Feet * Average Cap Rate of 9.15% * IRC Operating Platform Firmly Established
Slide 37: Growth Potential in Minnesota
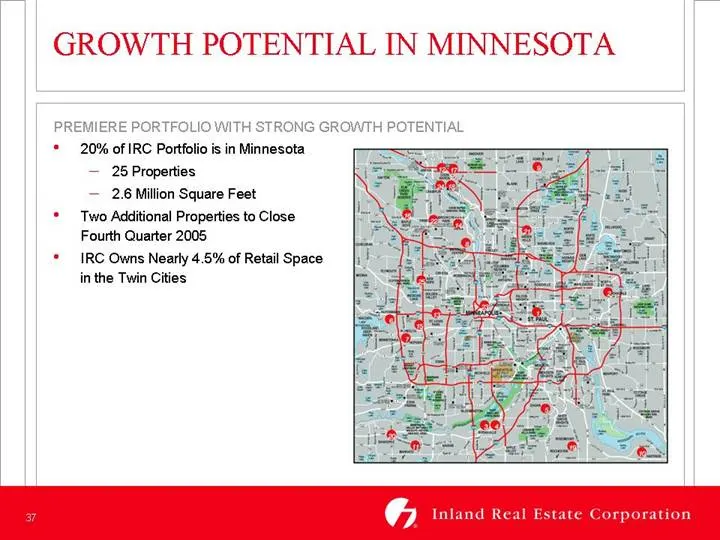
GROWTH POTENTIAL IN MINNESOTA * 20% of IRC Portfolio is in Minnesota — 25 Properties 2.6 Million Square Feet * Two Additional Properties to Close Fourth Quarter 2005 * IRC Owns Nearly 4.5% of Retail Space in the Twin Cities
Slide 38: V. Leasing and Asset Improvement Initiatives
V. LEASING AND ASSET IMPROVEMENT INITIATIVES D. SCOTT CARR President, Property Management
Slide 39: Midwest Retail Market Leader
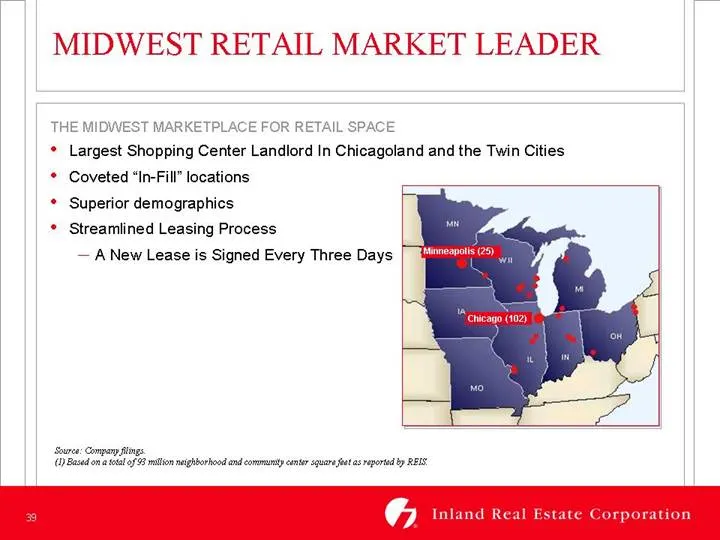
MIDWEST RETAIL MARKET LEADER THE MIDWEST MAR \CE FOR RETAIL Largest Shopping Center Landlord In Chicagoland and the Twin Cities Coveted “In-Fill” locations Superior demographics Streamlined Leasing Process — ANew Lease is Signed Every Three Days Source: Compa ngs. () Bead onal of 8 malin neghorhood
Slide 40: Leasing Efficiencies
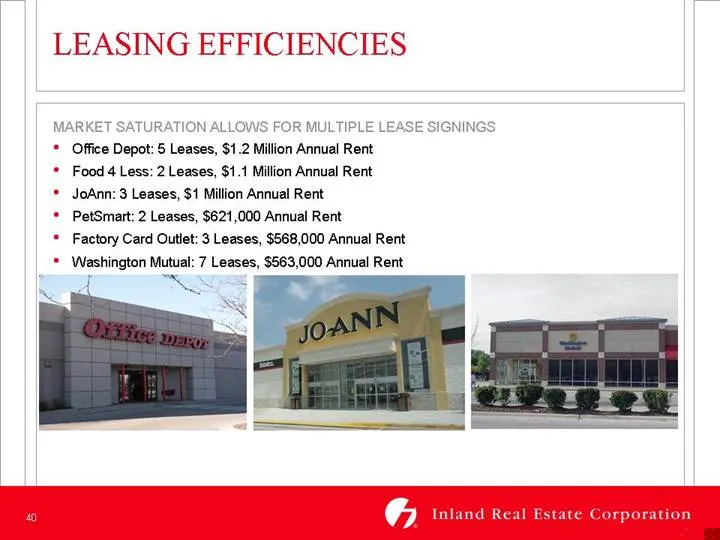
CIENCIES MARKET SATURATION ALLOWS FOR MULTIPLE LEASE SIGNINGS * Office Depot: 5 Leases, $1.2 Million Annual Rent * Food 4 Less: 2 Leases, $1.1 Million Annual Rent * JoAnn: 3 Leases, $1 Million Annual Rent * PetSmart: 2 Leases, $621,000 Annual Rent * Factory Card Outlet: 3 Leases, $568,000 Annual Ren
Slide 41: Visible Growth in Rental Rates
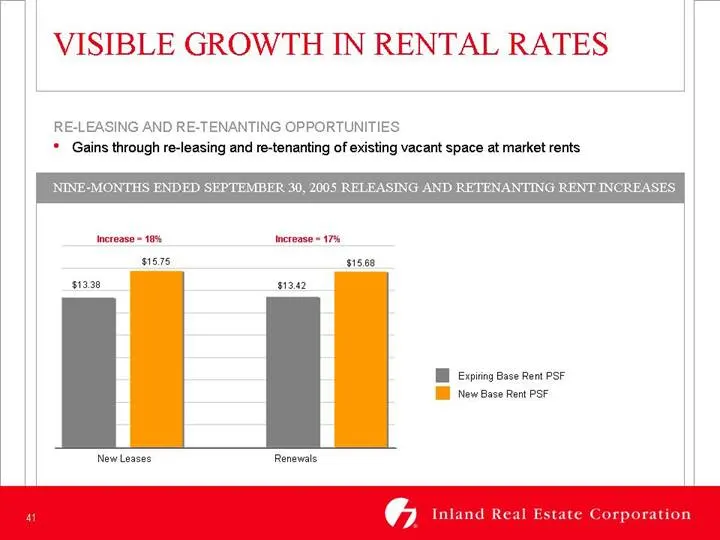
| VISIBLE GROWTH IN RENTAL RATES RE-LEASING AND RE-TENANTING OPPORTUNITIES * Gains through re-leasing and re-tenanting of existing vacant space at market rents ‘NINE-MONTHS ENDED SEPTEMBER 30, 2005 RELEASING AND RETENANTING RENT INCREASES increase = 108 iereee = 1% 575 s1560 $1338 me I ping Base Rem
Slide 42: Asset Improvement Initiatives
ASSET IMPROVEMENT INITIATIVES INCOME GROWTH THROUGH MAXIMIZING POTENTIAL OF EXISTING PORTFOLIO * Outlot Development * Center Reconfiguration — Retenanting Building Expansions * Investing $13.6 Million in Repositioning of Existing Assets 16.07% Projected Retum on Investment
Slide 43: Case Study: 22nd Street Plaza, Oakbrook Terrace, IL
CASE STUDY: 22™¢ STREET PLAZA, OAKBROOK TERRACE, IL REET PLAZA, OAKBROOK TERRACE, IL * Converted Single Tenant Building to Multi-Tenant Retail * Lease Termination Fee of $340,000 From Party City * Net Investment of $309,000 for Redevelopment * 63% Annual Retum on Additional Investment * 101% Increas
Slide 44: Case Study: Maple Park Place, Bolingbrook, IL
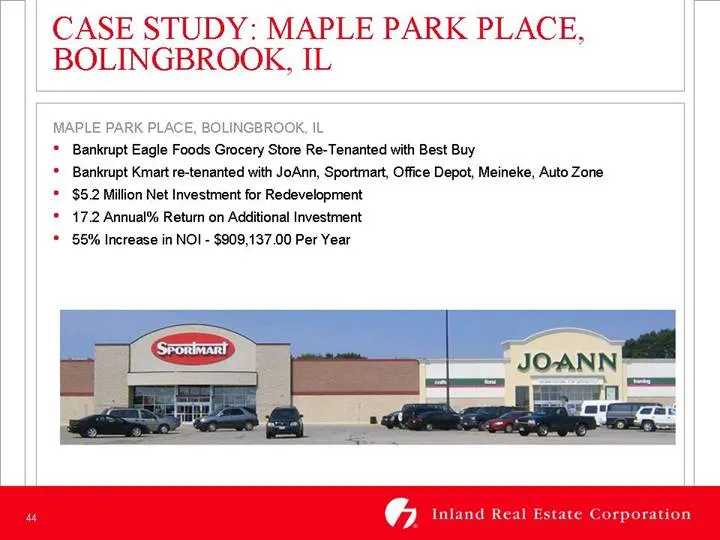
CASE STUDY: MAPLE PARK PLACE, BOLINGBROOK, IL MAPLE PARK PLACE, BOLINGBROOK, IL * Bankrupt Eagle Foods Grocery Store Re-Tenanted with Best Buy * Bankrupt Kmart re-tenanted with JoAnn, Sportmart, Office Depot, Meineke, Auto Zone $5.2 Million Net Investment for Redevelopment * 47.2 Annual% Return on A
Slide 45: Case Study: Regal Showplace, Crystal Lake, IL
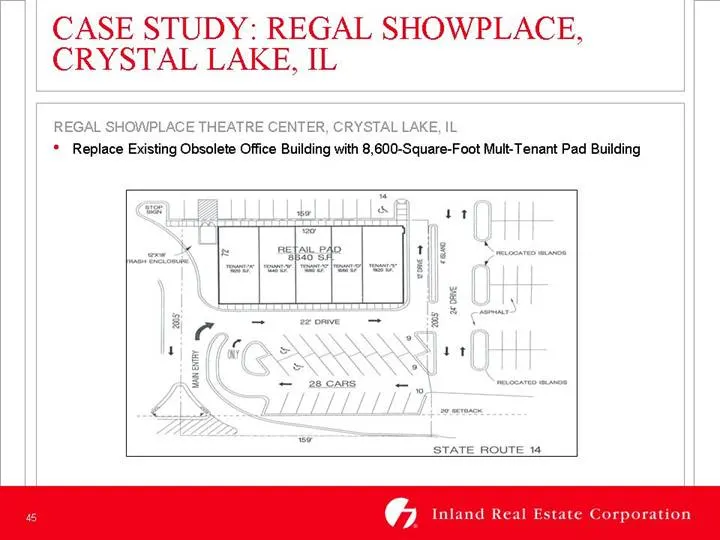
CASE STUDY: REGAL SHOWPLACE, CRYSTAL LAKE, IL REGAL SHOWPLACE THEATRE CENTER, CRYSTAL LAKE, IL * Replace Existing Obsolete Office Building with 8,600-Square-Foot Mult-Tenant Pad Building enchy STATE ROUTE 14
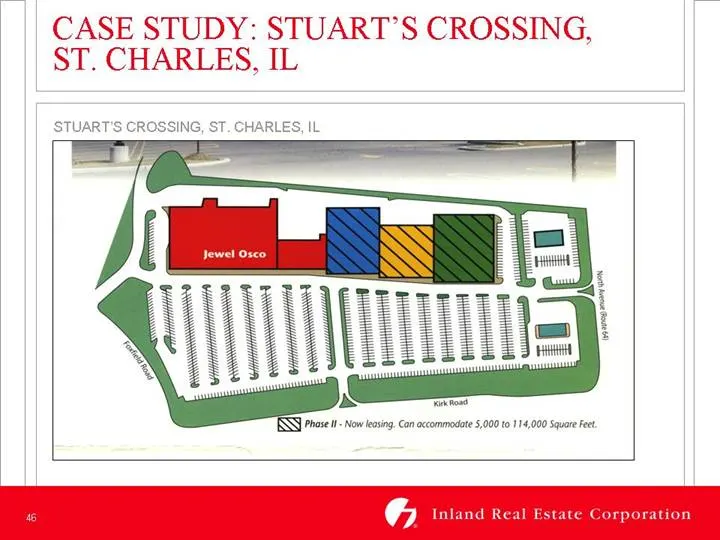
Slide 46: Case Study: Stuart's Crossing
YY: STUART’S CROSSING, ES, IL
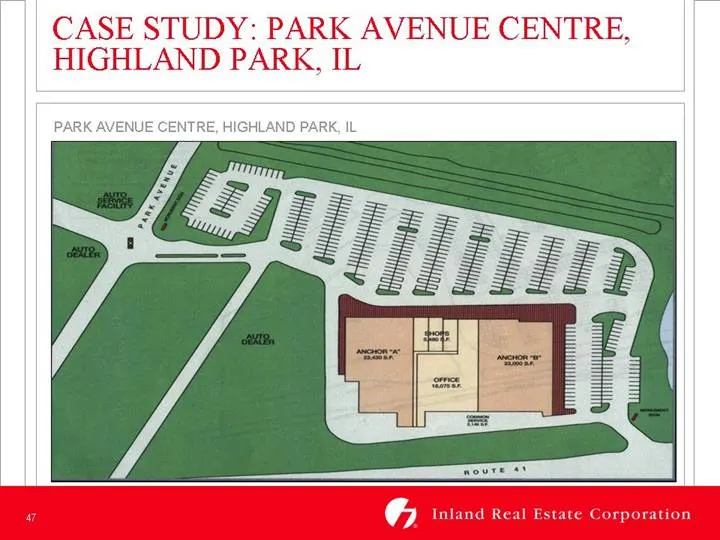
Slide 47
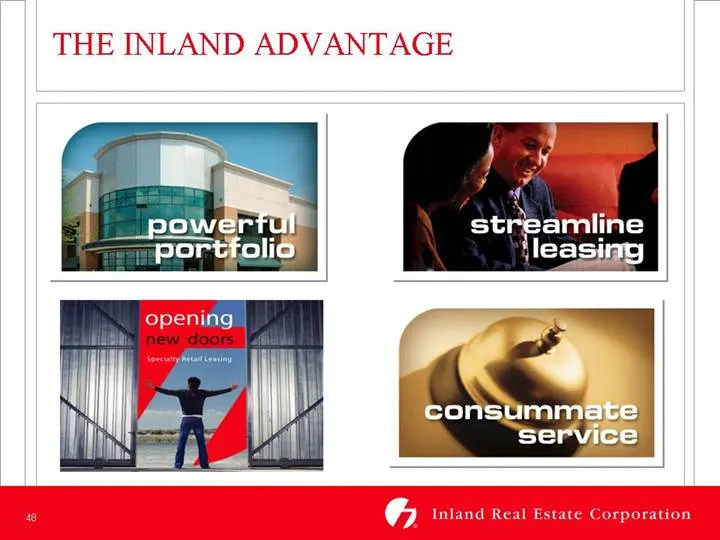
Slide 48: Steami ie
Steami ie tleasiae
Slide 49: VI. Finance
VIL FINANCE BRETT A. BROWN Chief Financial Officer
Slide 50: Financial Snapshot
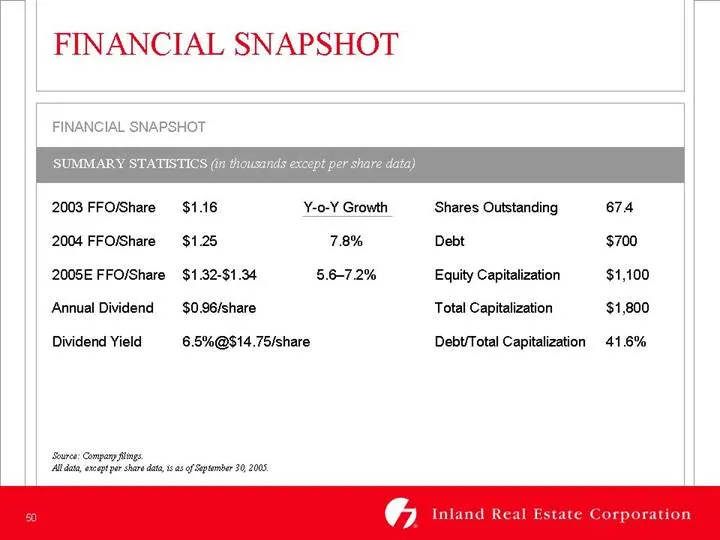
FINANCIAL SNAPSHOT FINANCIAL SNAPSHOT 2003 FFOShare = $1.16 Y-0-Y Growth ‘Shares Outstanding 674 2004 FFO/Share $1.25 78% Debt ‘$700 2005E FFO/Share $1.32-$1.34 5.6-7.2% Equity Capitalization $1,100 Annual Dividend — $0.96/share Total Capitalization $1,800 Dividend Yield 6.5% @$14.75/share Debt/Tota
Slide 51: Strong Results
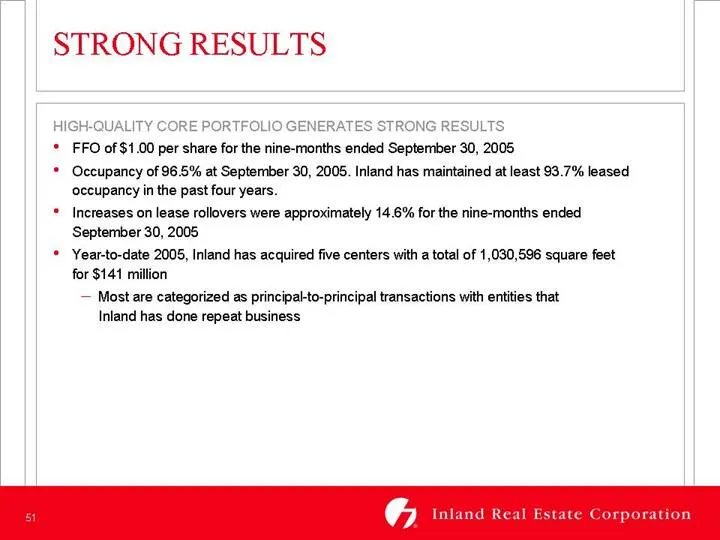
STRONG RESULTS QUALITY CORE PO! SENERATE! ONG RESULTS: * FFO of $1.00 per share for the nine-months ended September 30, 2005 * Occupancy of 96.5% at September 30, 2005. Inland has maintained at least 93.7% leased occupancy in the past four years. * Increases on lease rollovers were approximately 14.
Slide 52: Conservative Capital Structure
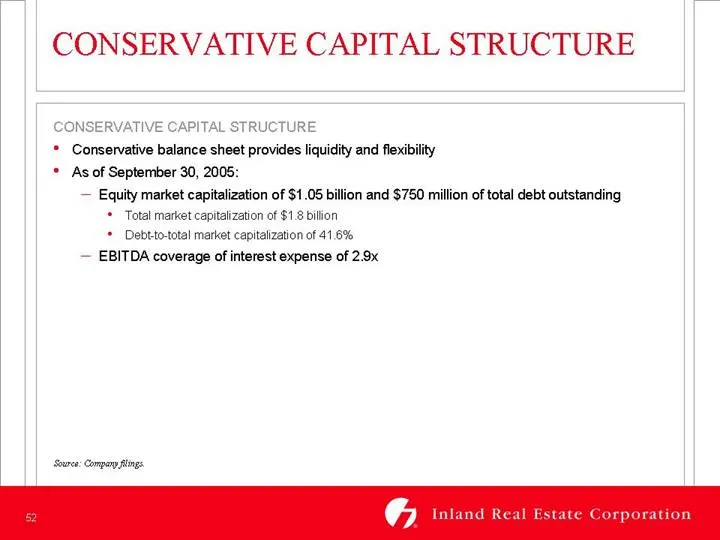
CONSERVATIVE CAPITAL STRUCTURE CONSERVATIVE CAPITAL STRUCTURE * Conservative balance sheet provides liquidity and flexibility * As of September 30, 20 ~ Equity market capitalization of $1.05 billion and $750 milion of total debt outstanding * Total market capitalization of $1 8 billion * Debt-to-tot
Slide 53: Financing Philosophy
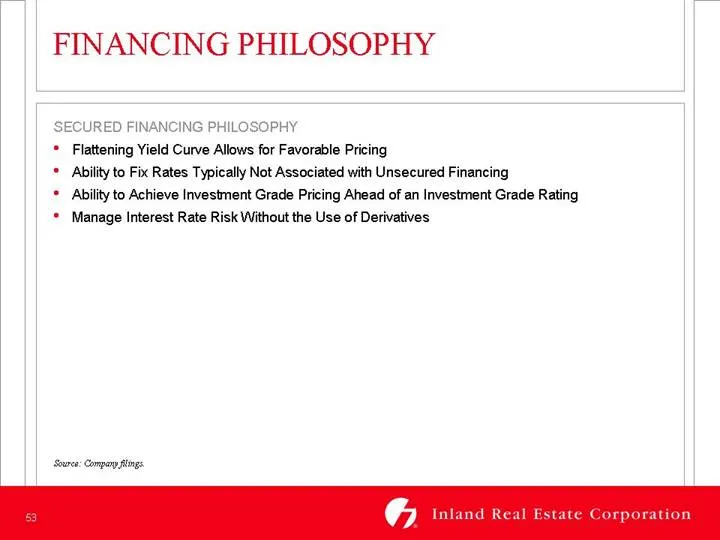
FINANCING PHILOSOPHY 5 INANCING PHILOSOPHY Flattening Yield Curve Allows for Favorable Pricing Ability to Fix Rates Typically Not Associated with Unsecured Financing Ability to Achieve Investment Grade Pricing Ahead of an Investment Grade Rating * Manage Interest Rate Risk Without the Use of Derivat
Slide 54: Average Interest Rates
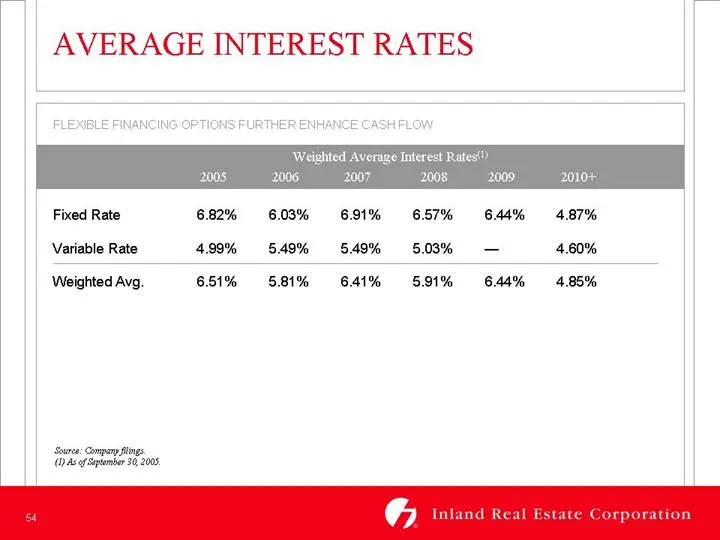
AVERAGE INTEREST RATES FLEXIBLE FINA Bigs (D Asef Sptonbe 30, 2005, Fixed Rate 6.82% 6.03% 691% 657% 644% 4.87% Variable Rate 499% 549% 549% 5.08% — 4.60% Weighted Avg. 651% 5.81% 641% 5.91% 6.44% 4.85% Sores: Company
Slide 55: Debt Maturities
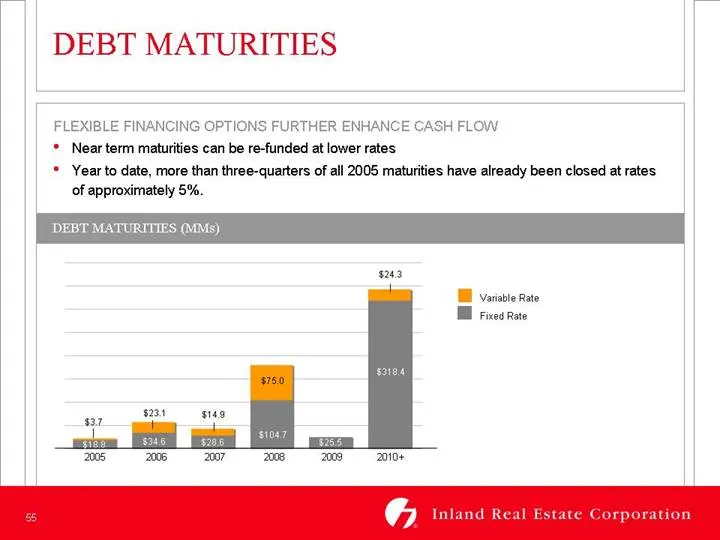
DEBT MATURITIES FLEXIBLE FINANCING OPTIONS FURTHER ENHANCE CASH FLOW * Near term maturities can be re-funded at lower rates * Year to date, more than three-quarters of all 2005 maturities have already been closed at rates of approximately 5%. DEBT MATURITIES (MMs) $243 Variable Rate Hl Fixe Rate #23
Slide 56: Equity Line of Credit
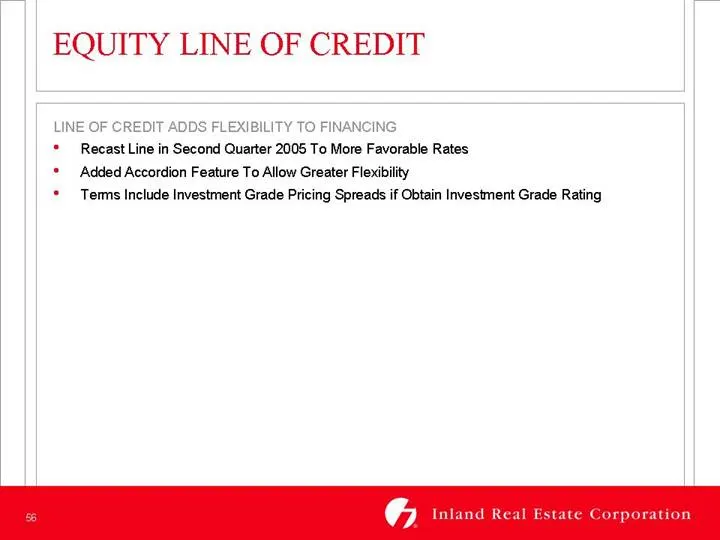
EQUITY LINE OF CREDIT LINE OF CREDIT ADDS FLEXIBILITY TO FINANC * Recast Line in Second Quarter 2005 To More Favorable Rates * Added Accordion Feature To Allow Greater Flexibility * Tems Include Investment Grade Pricing Spreads if Obtain Investment Grade Rating
Slide 57: Investment Grade Rating
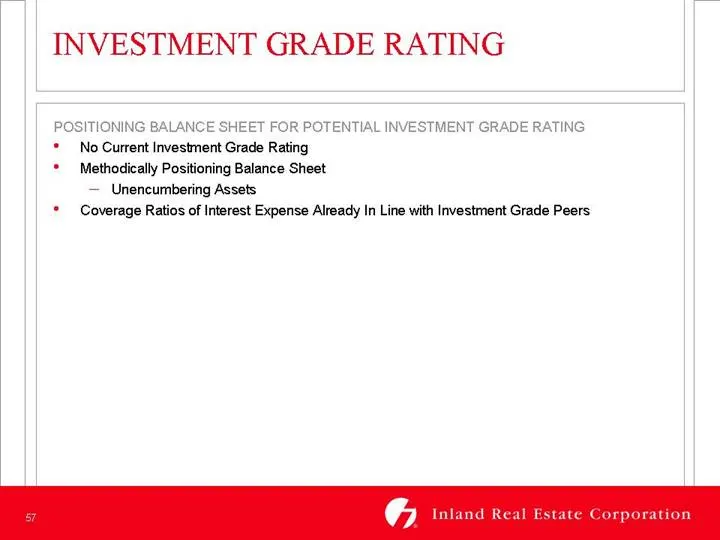
INVESTMENT GRADE RATING POSITIONING BALANCE SHEET FOR POTENTIAL INVESTMENT GRADE RATING * No Current Investment Grade Rating * — Methodically Positioning Balance Sheet — Unencumbering Assets * Coverage Ratios of Interest Expense Already In Line with Investment Grade Peers
Slide 58: Financial Track Record
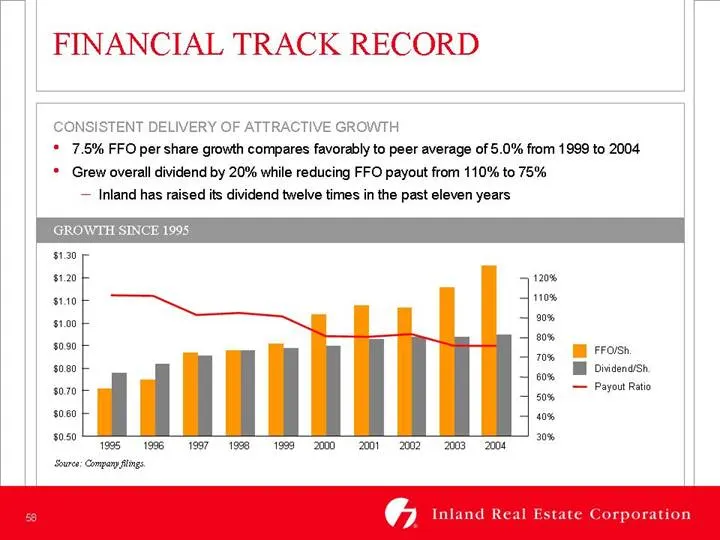
FINANCIAL TRACK RECORD CONSISTENT DELIVERY OF ATTRACTIVE GROWTH * 7.5% FFO per share growth compares favorably to peer average of 5.0% from 1999 to 2004 * Grew overall dividend by 20% while reducing FFO payout from 110% to 75% — Inland has raised its dividend twelve times in the past eleven years $1
Slide 59: Questions & Answers
QUESTIONS & ANSWERS
Slide 60: Conclusion
CONCLUSION ROBERT D. PARKS President and Chief Executive Officer
Slide 61: The Midwest Marketplace for Retail Space
The Midwest Marketplace for Retail Space orporation
Slide 62
Slide 63: Appendix
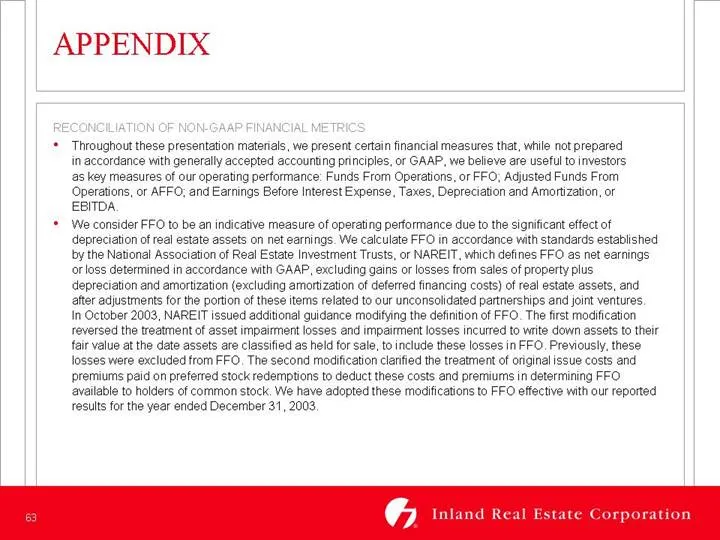
APPENDIX * Throughout these presentation materials, we present certain financial measures that, while not prepared in accordance with generally accepted accounting principles, or GAAP, we believe are useful to investors, ‘as key measures of our operating performance: Funds From Operations, or FFO; A
Slide 64: Appendix: Reconciliation of Non-GAAP Financial Metrics
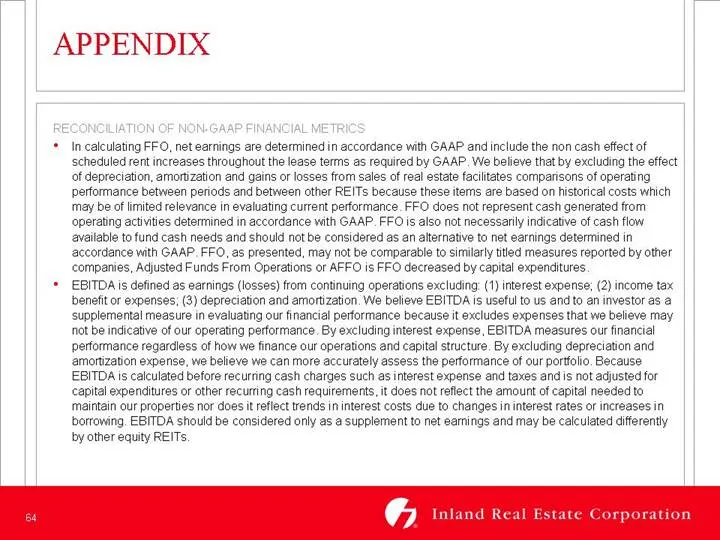
APPENDIX RECONCILIATION OF NON-GAAP FINA TR + Incalculating FFO, net earnings are determined in accordance with GAAP and include the non cash effect of ‘scheduled rent increases throughout the lease terms as required by GAAP. We believe that by excluding the effect ‘of depreciation, amortization and
Slide 65: Appendix: Reconciliation of FFO to Net Income
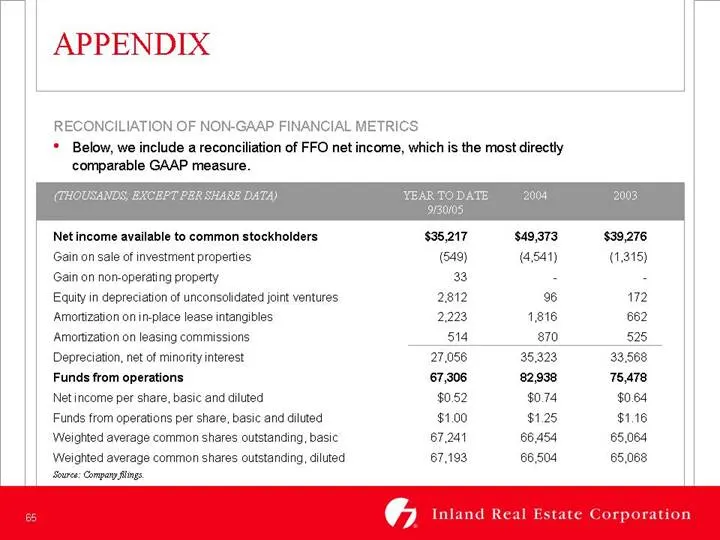
APPENDIX RECONCILIATION OF NON-GAAP FINANCIAL METRICS: * Below, we include a reconciliation of FFO net income, which is the most directly comparable GAAP measure. Net income available to common stockholders Gain on sale of investment properties Gain on non-operating property Equity in depreciation o
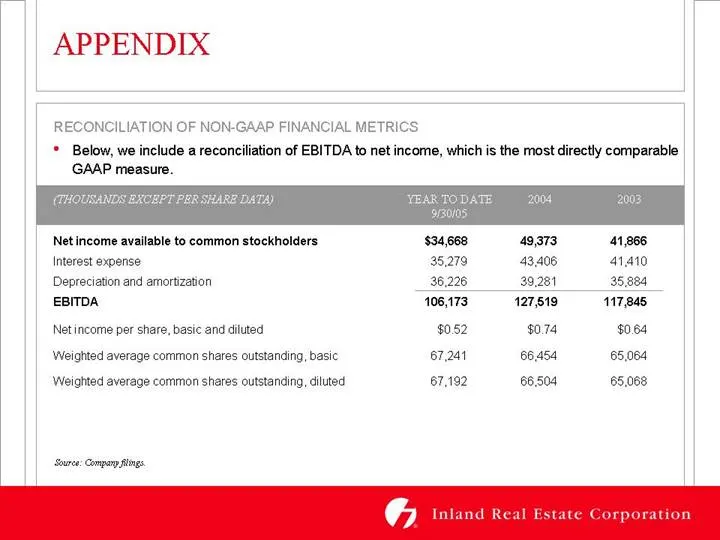
Slide 66: Appendix: Reconciliation of EBITDA to Net Income
APPENDIX RECONCILIATION OF NON-GAAP FINANCIAL METRICS. * Below, we include a reconciliation of EBITDA to net income, which is the most directly comparable GAAP measure. Net income available to common stockholders $34,668 49,373 41,986 Interest expense 36.279 43.406 41.410 Depreciation and amortizati
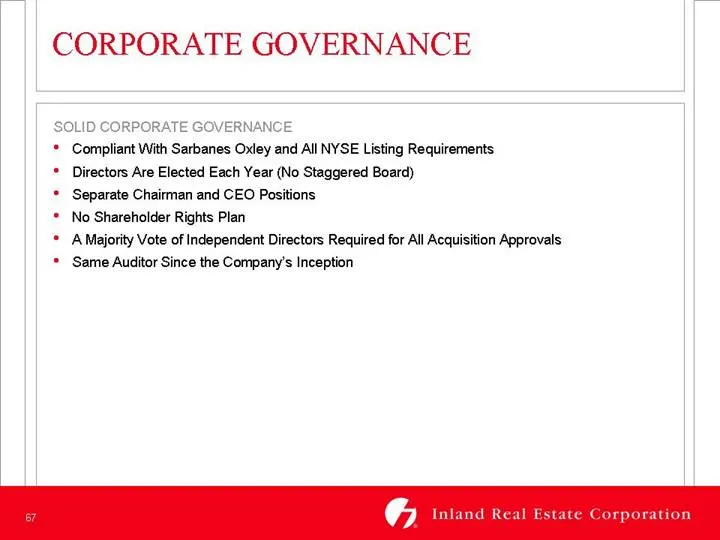
Slide 67: Corporate Governance
CORPORATE GOVERNANCE LID CORP TE GOVERNAN * Compliant With Sarbanes Oxley and All NYSE Listing Requirements * Directors Are Elected Each Year (No Staggered Board) * Separate Chairman and CEO Positions * No Shareholder Rights Plan * A Majority Vote of Independent Directors Required for All Acquisitio
Slide 68
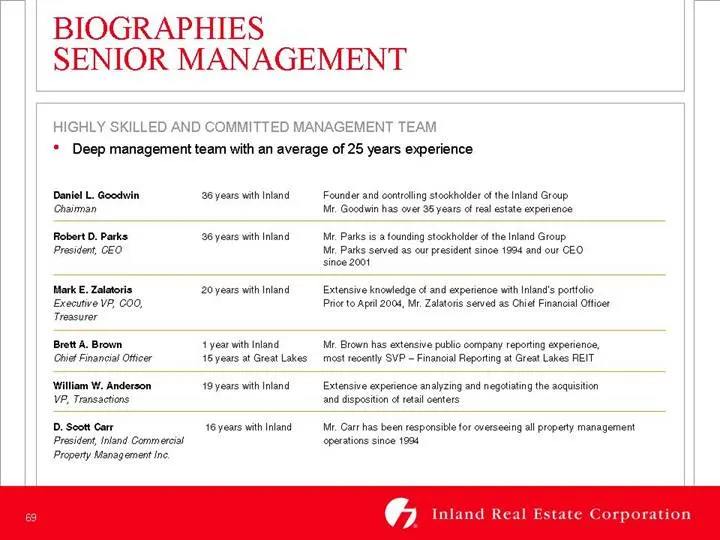
Slide 69: Biographies
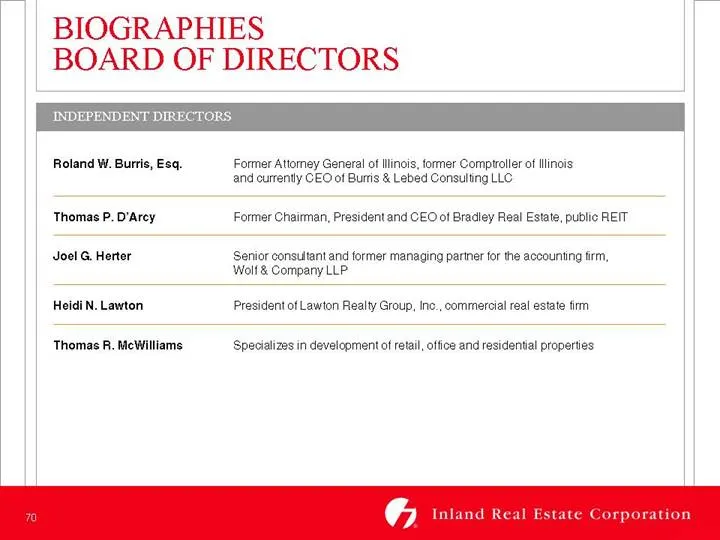
BIOGRAPHIES SENIOR MANAGEMENT HIGHLY SKILLED AND COMMITTED MANAGEMENT TEAM * Deep management team with an average of 25 years experience Daniel L. Goodwin 2Gyears with Inland Founder and cateling stockholder ofthe Inland Group Chairman Mr, Gocdwin has over 95 years of rel estate experience Robert D.
Slide 70: Searchable text section of graphics shown above
Searchable text section of graphics shown above [L OGO] Investor Presentation November 2005 FO RWARD LOOKING STATEMENTS • These presentation materials contain forward-looking statements. Forward-looking statements are statements that are not historical, including statements regarding management’s in
Source: SEC EDGAR · 8-K filed Nov 1, 2005
More decks from Inland Real Estate Corp
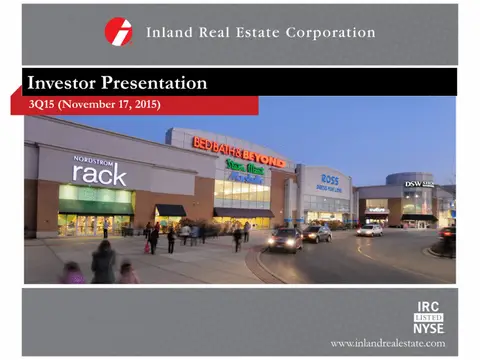 Investor Presentation (November 2015)30 slides · Nov 17, 2015
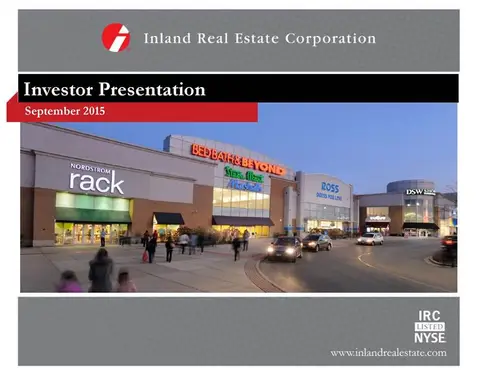 Investor Presentation (September 2015)29 slides · Sep 16, 2015
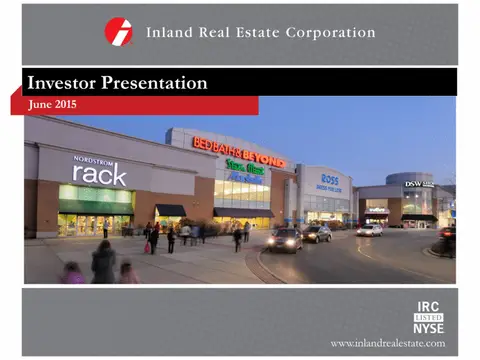 Investor Presentation (June 2015)29 slides · Jun 9, 2015
 Investor Presentation (May 2015)26 slides · May 15, 2015
 Investor Presentation (February 2015)26 slides · Feb 24, 2015
 Investor Presentation (November 2014)26 slides · Nov 5, 2014