Air Transport Services Group Inc
Air Transport Services — Non-Deal Roadshow (November 2018)
18 slides from Air Transport Services's roadshow presentation, Nov 15, 2018
Slide 1: Investor Meetings, Toronto, November 15, 2018
Rich Corrado Investor Meetings COO [email protected] Toronto, Canada Quint Turner CFO November 15, 2018 [email protected] The global leader in midsize wide-body (937) 366-2303 leasing and operating solutions
Slide 2: Cautionary Statement Regarding Forward-Looking Statements
Cautionary Statement Regarding Forward-Looking Statements Except for historical information contained herein, the matters discussed in this presentation contain forward-looking statements as that term is defined in the Private Securities Litigation Reform Act of 1995. These forward-looking statement
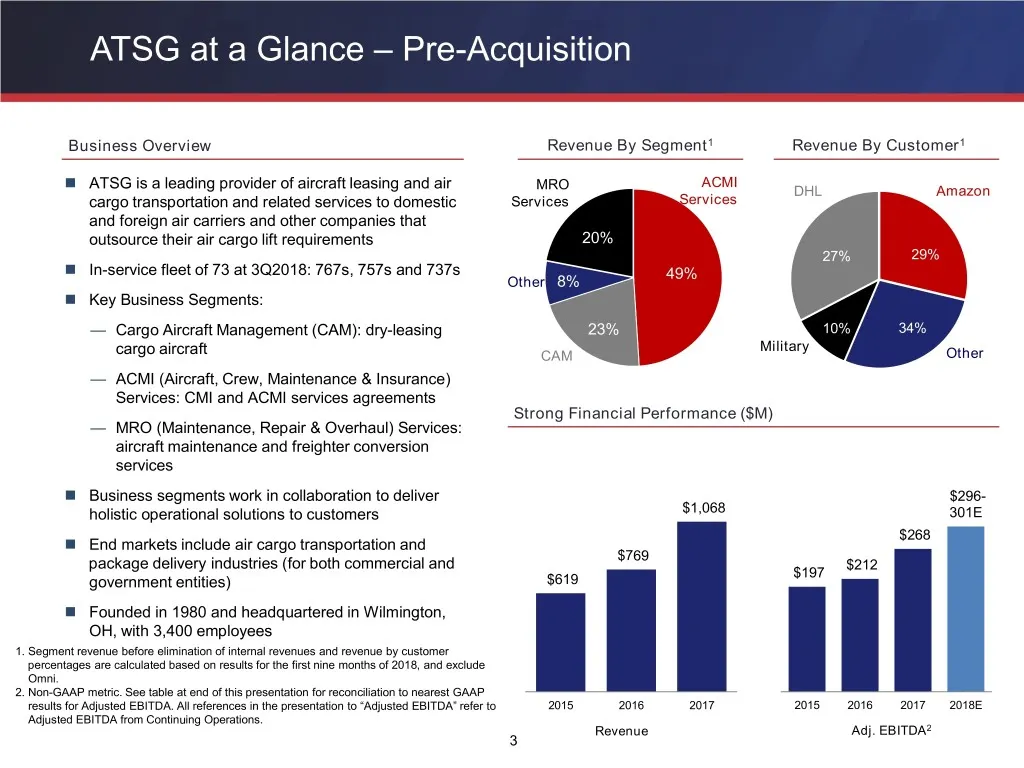
Slide 3: ATSG at a Glance – Pre-Acquisition Business Overview
ATSG at a Glance – Pre-Acquisition Business Overview Revenue By Segment1 Revenue By Customer1 ACMI ATSG is a leading provider of aircraft leasing and air MRO DHL Amazon cargo transportation and related services to domestic Services Services and foreign air carriers and other companies that outsour
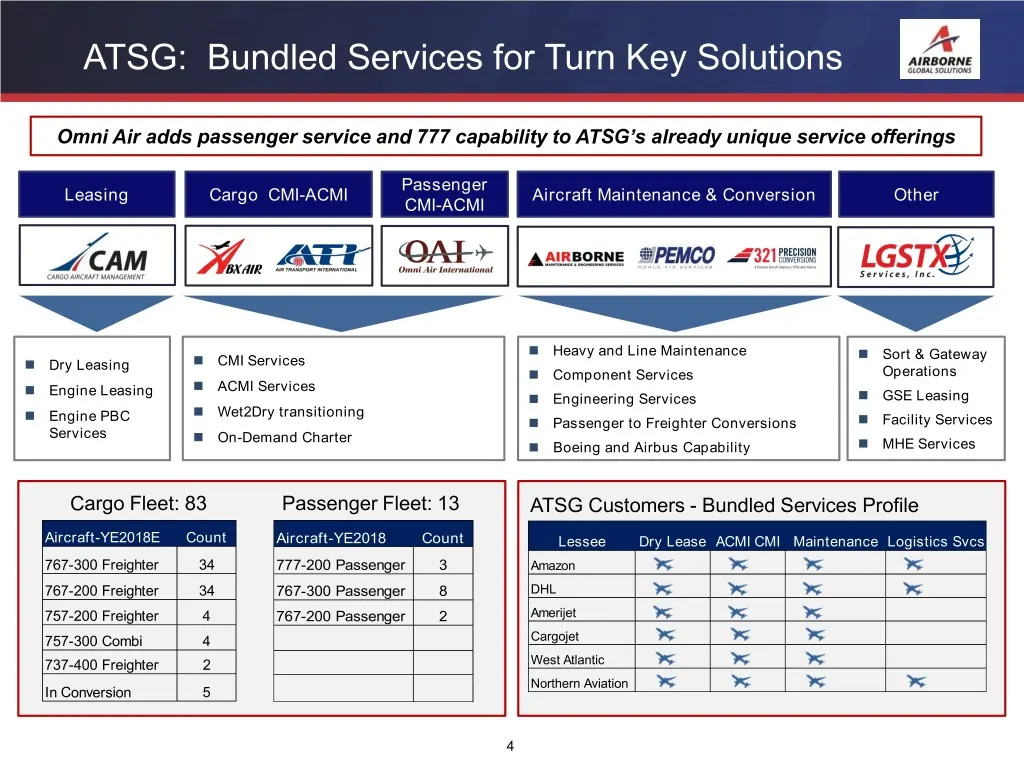
Slide 4: ATSG: Bundled Services for Turn Key Solutions
ATSG: Bundled Services for Turn Key Solutions Omni Air adds passenger service and 777 capability to ATSG’s already unique service offerings Passenger Leasing Cargo CMI-ACMI Aircraft Maintenance & Conversion Other CMI-ACMI Heavy and Line Maintenance Sort & Gateway Dry Leasing CMI Services C
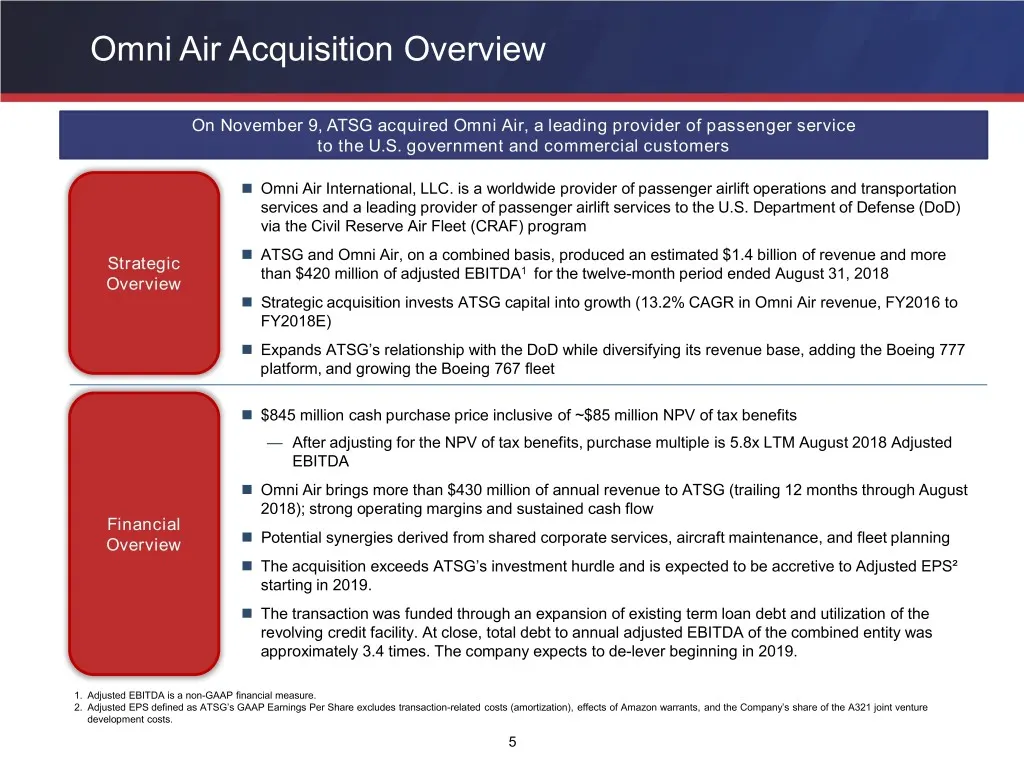
Slide 5: Omni Air Acquisition Overview
Omni Air Acquisition Overview On November 9, ATSG acquired Omni Air, a leading provider of passenger service to the U.S. government and commercial customers Omni Air International, LLC. is a worldwide provider of passenger airlift operations and transportation services and a leading provider of pa
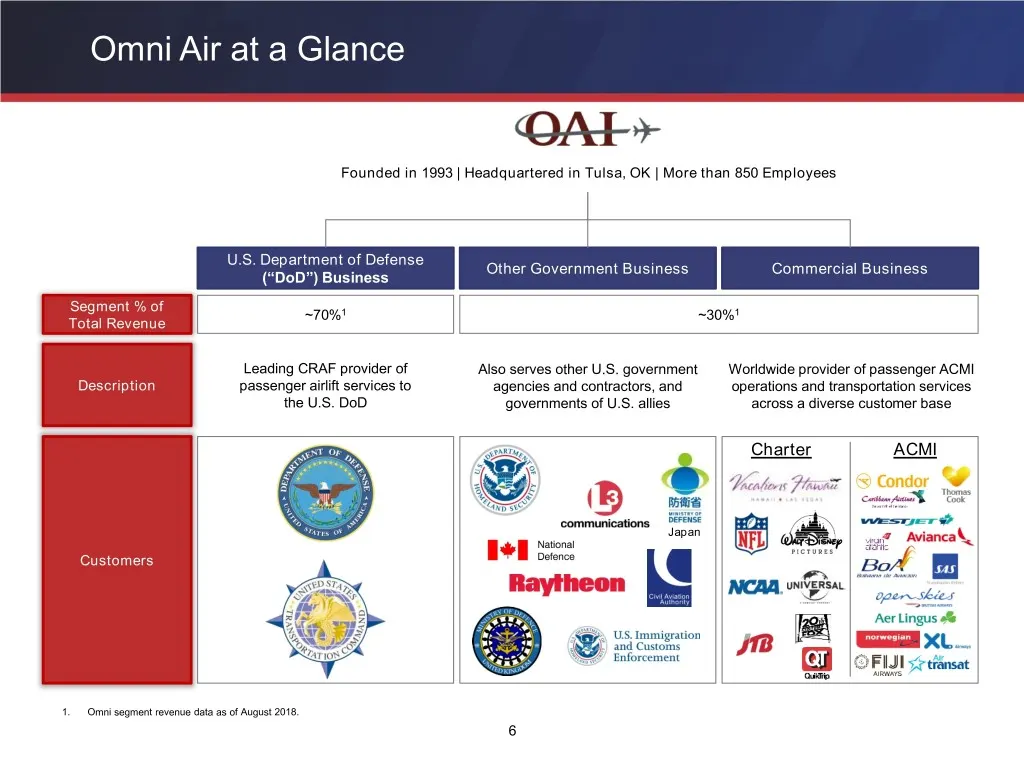
Slide 6: Omni Air at a Glance
Omni Air at a Glance Founded in 1993 | Headquartered in Tulsa, OK | More than 850 Employees U.S. Department of Defense Other Government Business Commercial Business (“DoD”) Business Segment % of ~70%1 ~30%1 Total Revenue Leading CRAF provider of Also serves other U.S. government Worldwide provider o
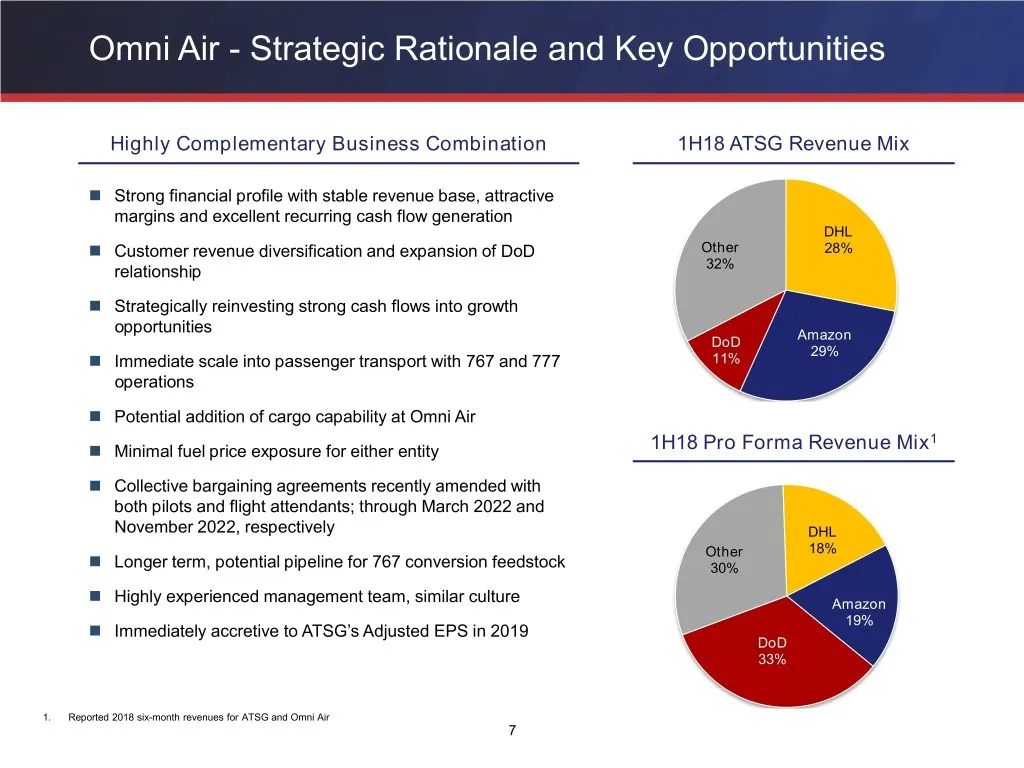
Slide 7: Omni Air - Strategic Rationale and Key Opportunities
Omni Air - Strategic Rationale and Key Opportunities Highly Complementary Business Combination 1H18 ATSG Revenue Mix Strong financial profile with stable revenue base, attractive margins and excellent recurring cash flow generation DHL Customer revenue diversification and expansion of DoD Other
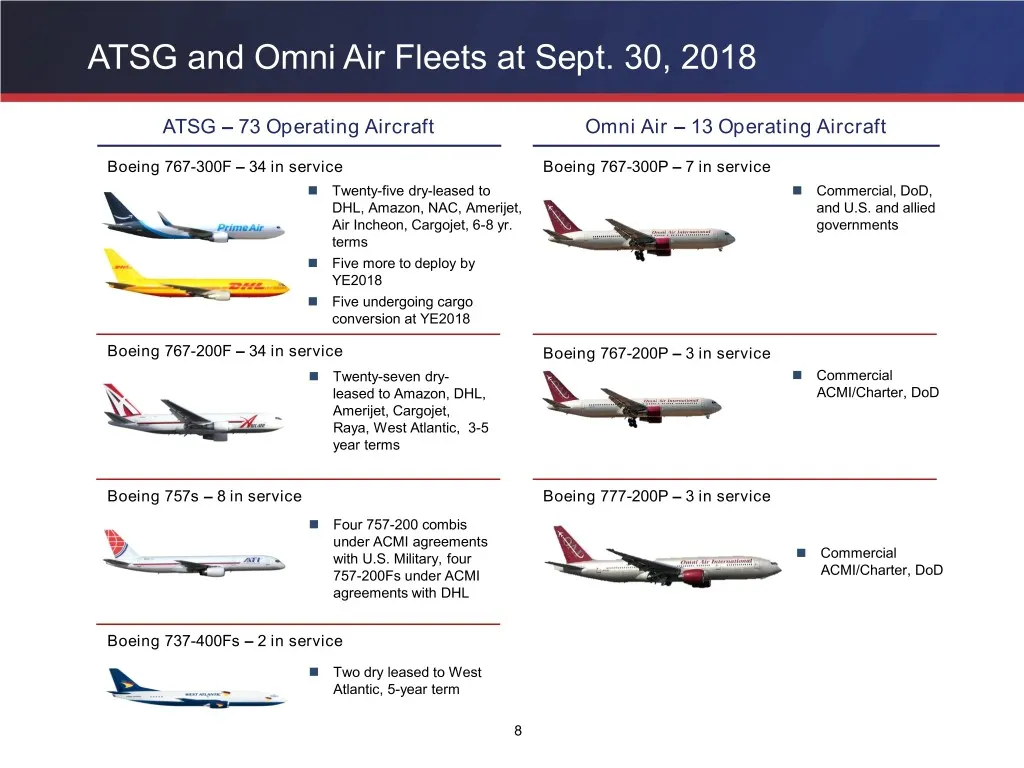
Slide 8: ATSG and Omni Air Fleets at Sept. 30, 2018
ATSG and Omni Air Fleets at Sept. 30, 2018 ATSG – 73 Operating Aircraft Omni Air – 13 Operating Aircraft Boeing 767-300F – 34 in service Boeing 767-300P – 7 in service Twenty-five dry-leased to Commercial, DoD, DHL, Amazon, NAC, Amerijet, and U.S. and allied Air Incheon, Cargojet, 6-8 yr. govern
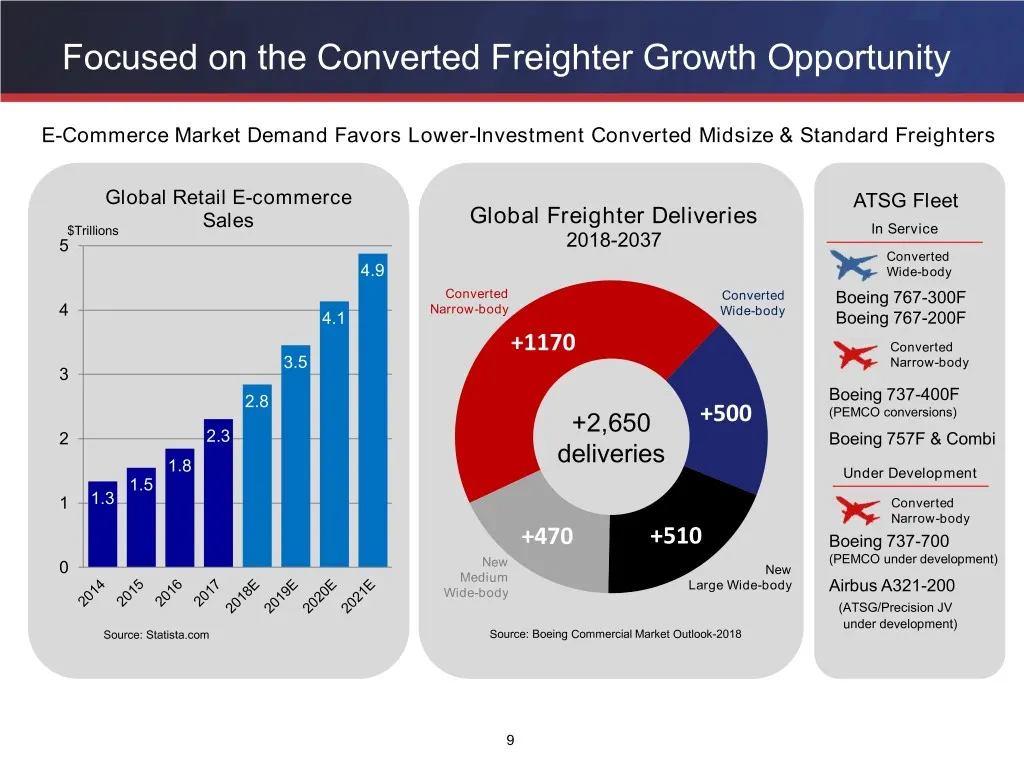
Slide 9: Focused on the Converted Freighter Growth Opportunity
Focused on the Converted Freighter Growth Opportunity E-Commerce Market Demand Favors Lower-Investment Converted Midsize & Standard Freighters Global Retail E-commerce ATSG Fleet Global Freighter Deliveries $Trillions Sales In Service 5 2018-2037 Converted 4.9 Wide-body Converted Converted Boeing 76
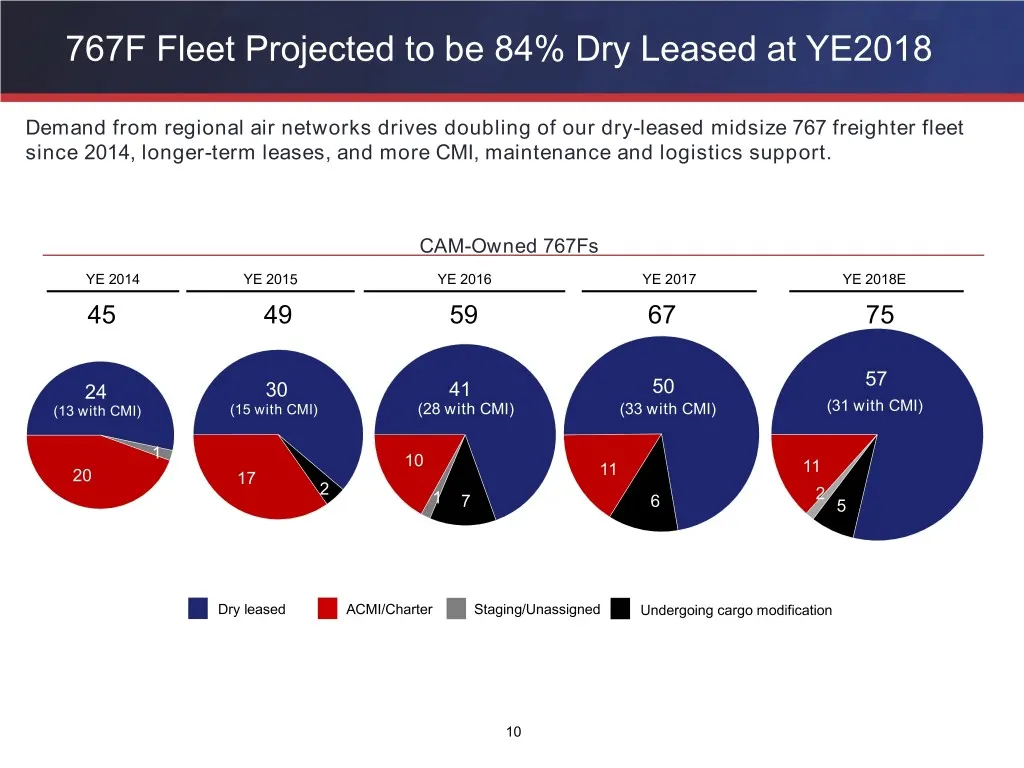
Slide 10: 767F Fleet Projected to be 84% Dry Leased at YE2018
767F Fleet Projected to be 84% Dry Leased at YE2018 Demand from regional air networks drives doubling of our dry-leased midsize 767 freighter fleet since 2014, longer-term leases, and more CMI, maintenance and logistics support. CAM-Owned 767Fs YE 2014 YE 2015 YE 2016 YE 2017 YE 2018E 45 49 59 67 75
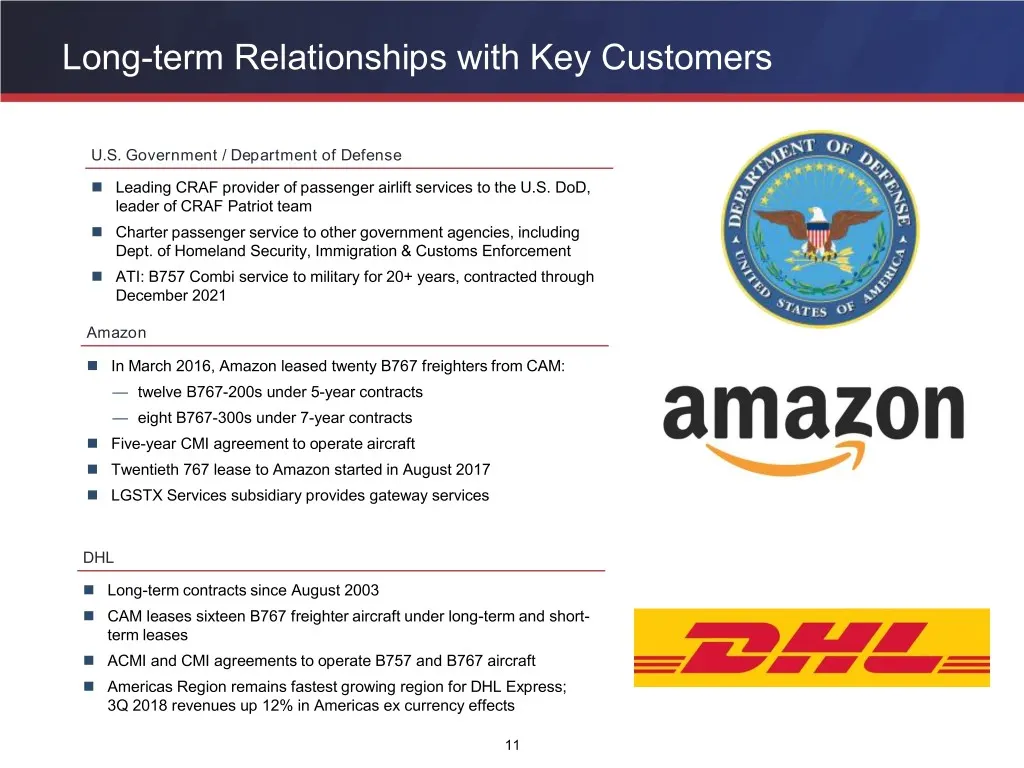
Slide 11: Long-term Relationships with Key Customers
Long-term Relationships with Key Customers U.S. Government / Department of Defense Leading CRAF provider of passenger airlift services to the U.S. DoD, leader of CRAF Patriot team Charter passenger service to other government agencies, including Dept. of Homeland Security, Immigration & Customs
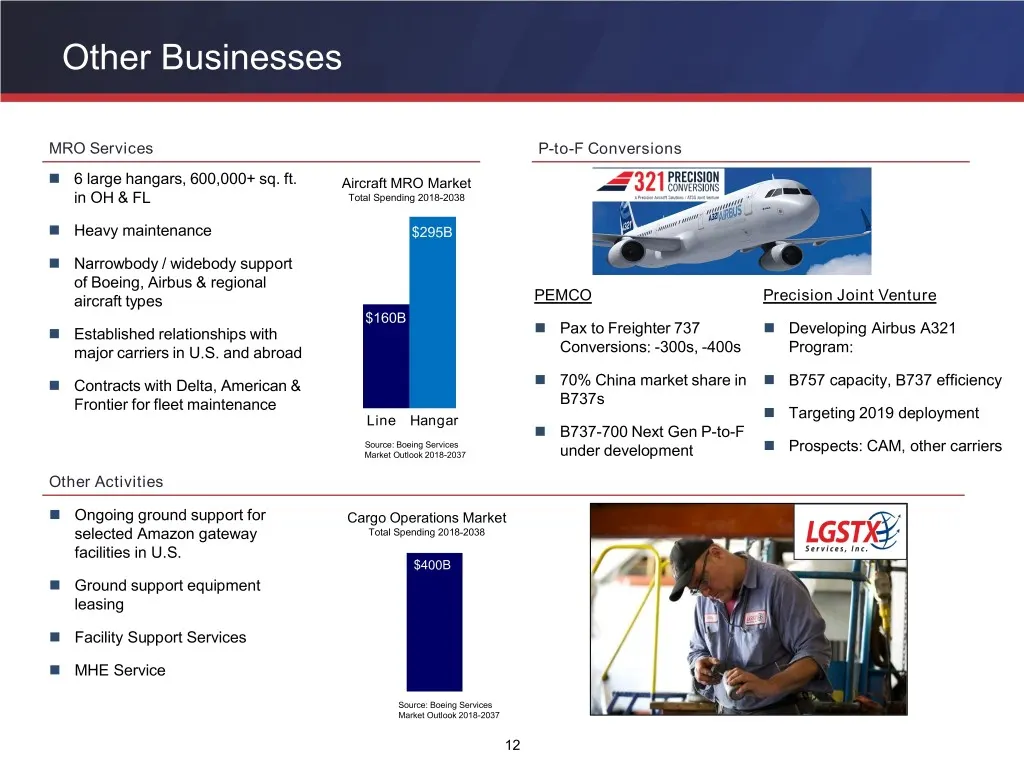
Slide 12: Other Businesses: MRO Services and P-to-F Conversions
Other Businesses MRO Services P-to-F Conversions 6 large hangars, 600,000+ sq. ft. Aircraft MRO Market in OH & FL Total Spending 2018-2038 Heavy maintenance $295B Narrowbody / widebody support of Boeing, Airbus & regional aircraft types PEMCO Precision Joint Venture $160B Established rel
Slide 13: Historical Financial Performance
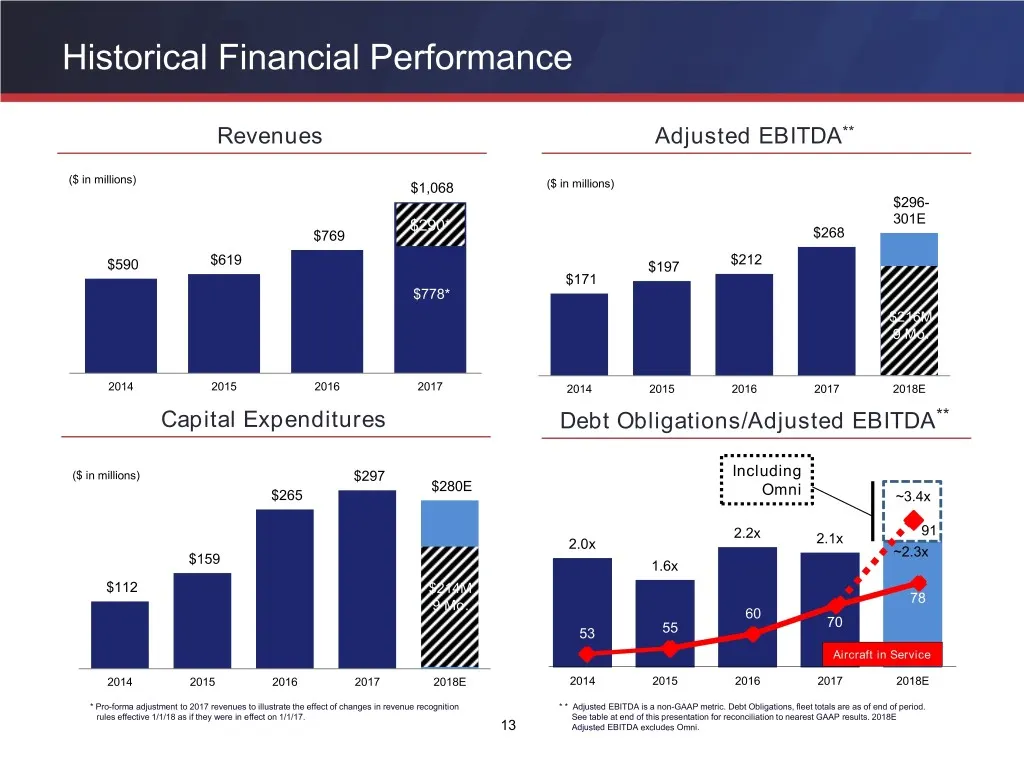
Historical Financial Performance Revenues Adjusted EBITDA** ($ in millions) $1,068 ($ in millions) $296- $290* 301E $769 $268 $212 $590 $619 $197 $171 $778* $216M 9 Mo. 2014 2015 2016 2017 2014 2015 2016 2017 2018E Capital Expenditures Debt Obligations/Adjusted EBITDA** ($ in millions) $297 Includin
Slide 14: Nine Months 2018 Results
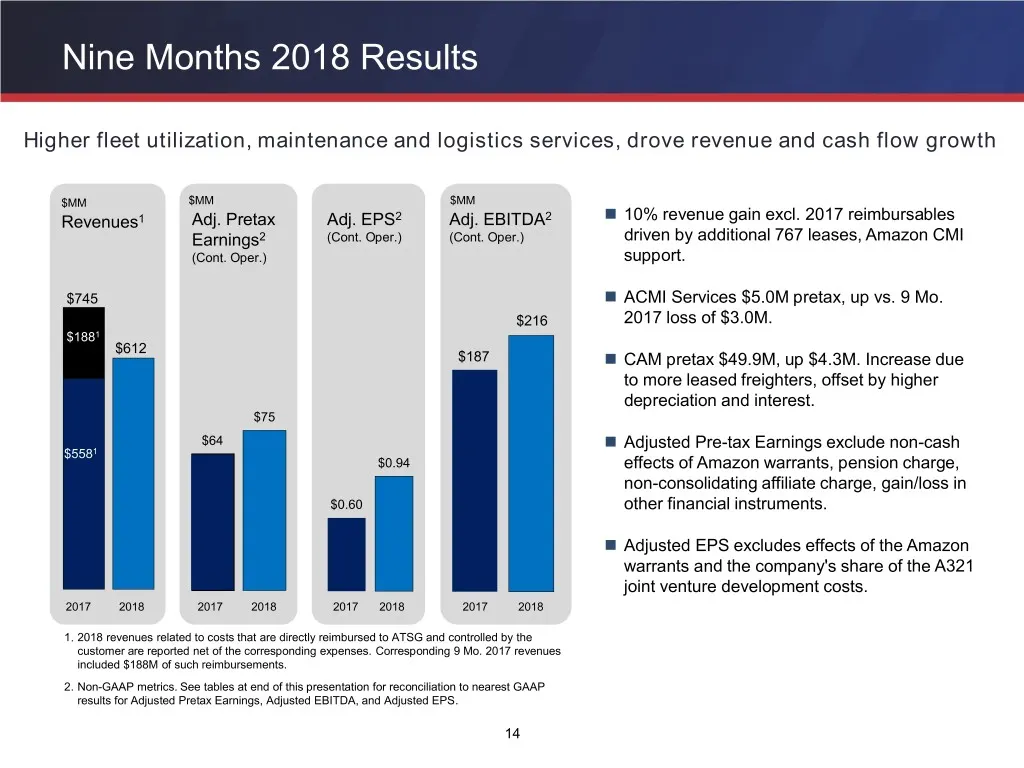
Nine Months 2018 Results Higher fleet utilization, maintenance and logistics services, drove revenue and cash flow growth $MM $MM $MM Revenues1 Adj. Pretax Adj. EPS2 Adj. EBITDA2 10% revenue gain excl. 2017 reimbursables Earnings2 (Cont. Oper.) (Cont. Oper.) driven by additional 767 leases, Amazon
Slide 15: Key Components of Capital Structure
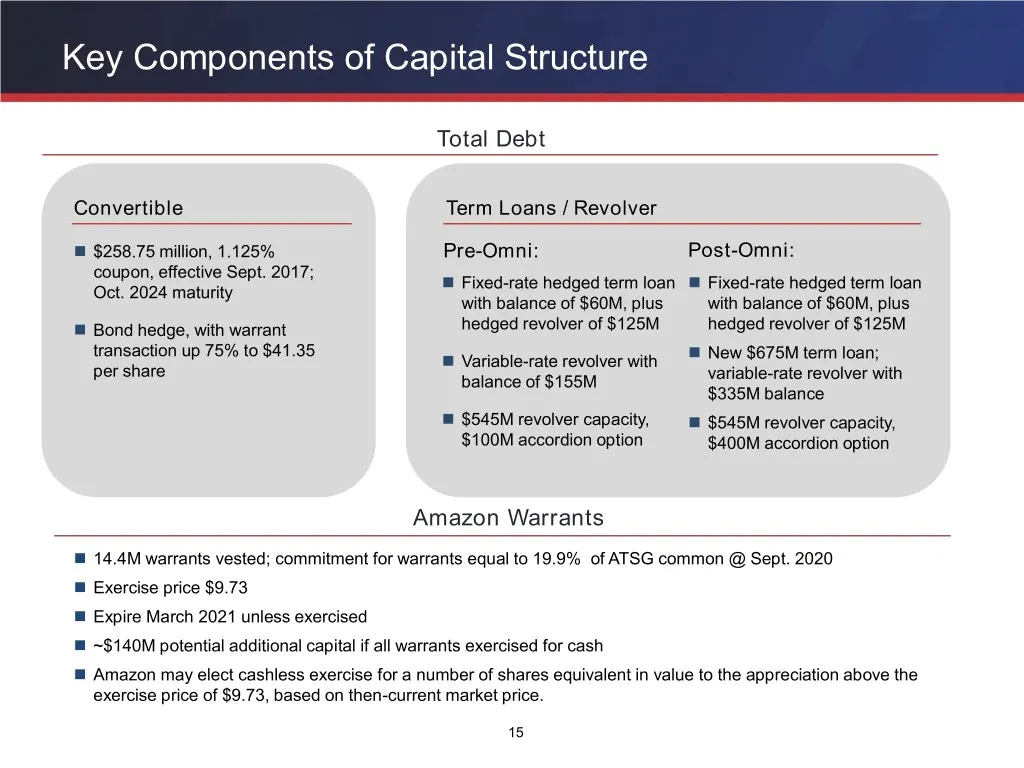
Key Components of Capital Structure Total Debt Convertible Term Loans / Revolver $258.75 million, 1.125% Pre-Omni: Post-Omni: coupon, effective Sept. 2017; Fixed-rate hedged term loan Fixed-rate hedged term loan Oct. 2024 maturity with balance of $60M, plus with balance of $60M, plus Bond he
Slide 16: Conclusion - Investment Highlights
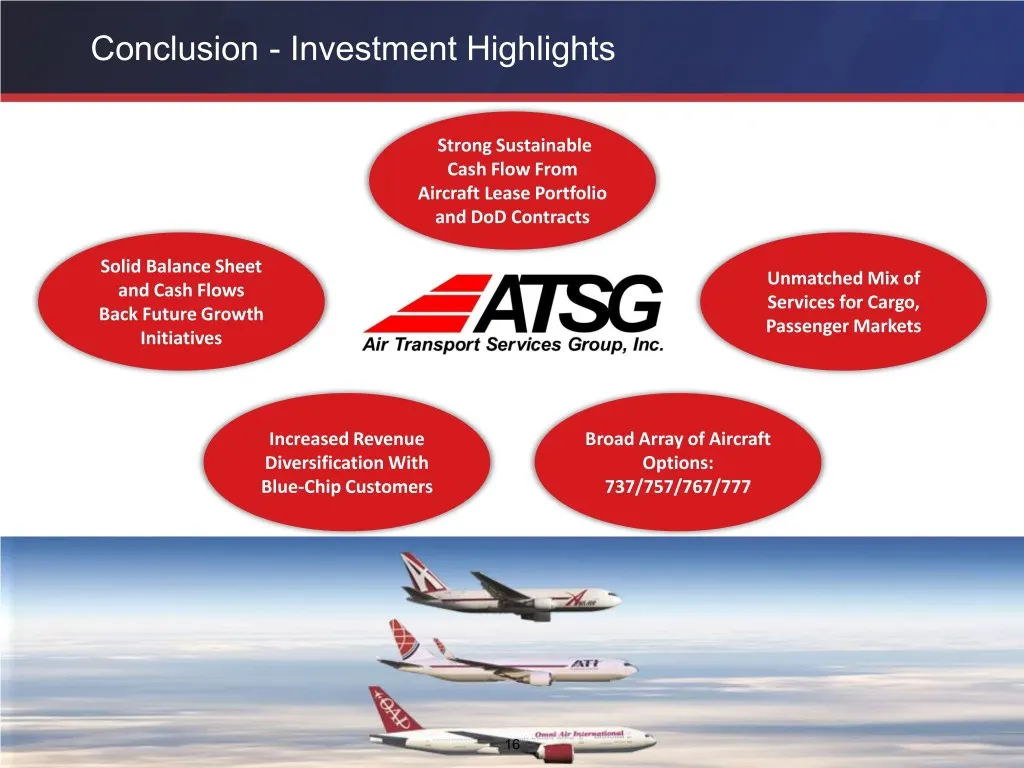
Conclusion - Investment Highlights Strong Sustainable Cash Flow From Aircraft Lease Portfolio and DoD Contracts Solid Balance Sheet Unmatched Mix of and Cash Flows Services for Cargo, Back Future Growth Passenger Markets Initiatives Increased Revenue Broad Array of Aircraft Diversification With Opti
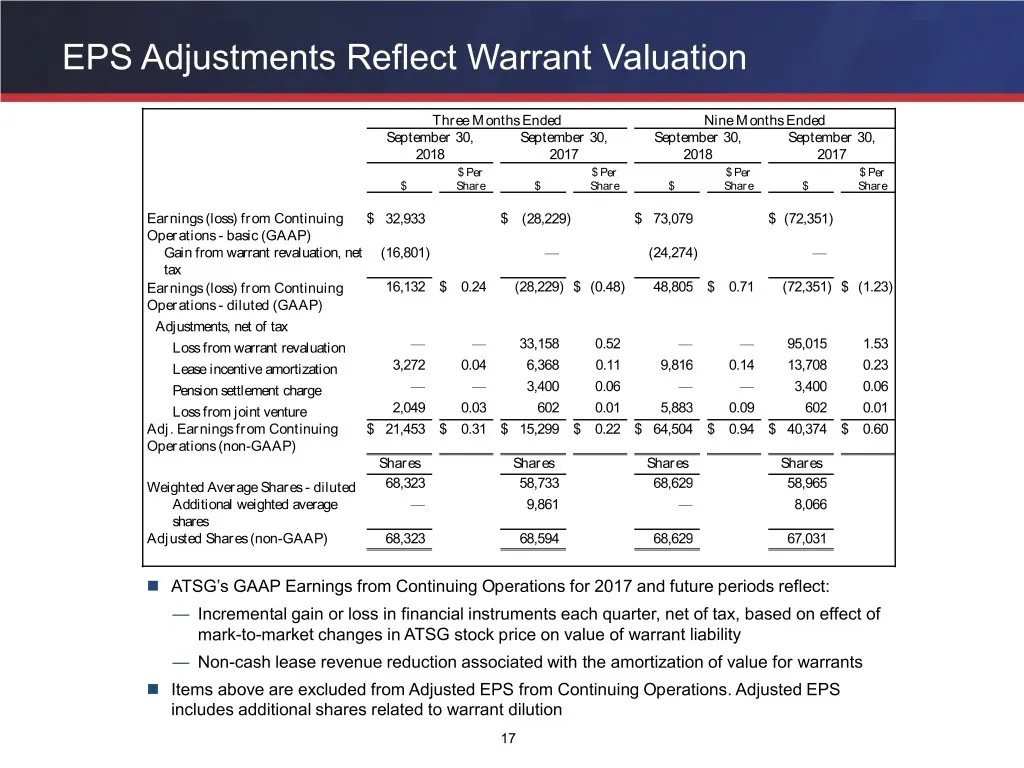
Slide 17: EPS Adjustments Reflect Warrant Valuation
EPS Adjustments Reflect Warrant Valuation Three Months Ended Nine Months Ended September 30, September 30, September 30, September 30, 2018 2017 2018 2017 $ Per $ Per $ Per $ Per $ Share $ Share $ Share $ Share Earnings (loss) from Continuing $ 32,933 $ (28,229 ) $ 73,079 $ (72,351) Operations - bas
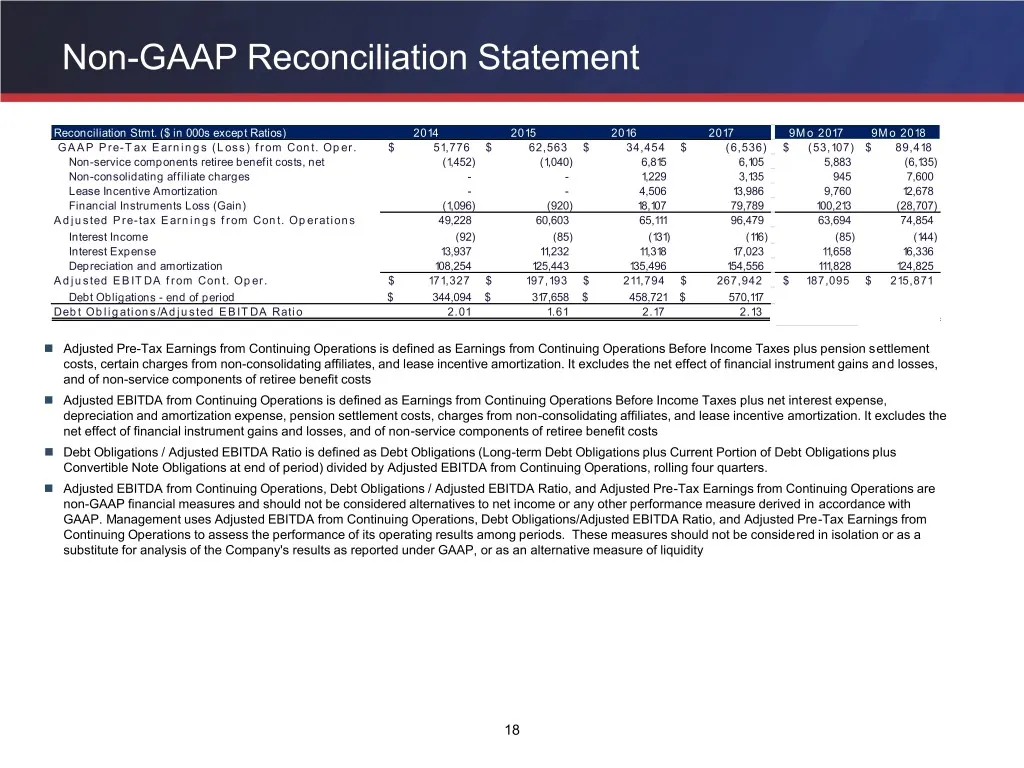
Slide 18: Non-GAAP Reconciliation Statement
Non-GAAP Reconciliation Statement Reconciliation Stmt. ($ in 000s except Ratios) 2014 2015 2016 2017 9M o 2017 9M o 2018 GAAP P re-T ax E arnings (Loss) from Cont. Oper. $ 51,776 $ 62,563 $ 34,454 $ (6,536) $ (53,107) $ 89,418 Non-service components retiree benefit costs, net (1,452) (1,040) 6,815 6
Source: SEC EDGAR · 8-K filed Nov 15, 2018
More decks from Air Transport Services Group Inc
 Shareholder Meeting (May 2024)26 slides · May 23, 2024
 Stephens Annual Investment Conference 202321 slides · Nov 14, 2023
 Investor Day (September 2023)68 slides · Sep 27, 2023
 Shareholder Meeting (May 2023)25 slides · May 26, 2023
 Stifel conference (February 2023)15 slides · Feb 6, 2023
 Stifel 2020 Transportation & Logistics Conference18 slides · Feb 11, 2020