NuStar Energy LP — MLP & Energy Infrastructure Conference 2019
44 slides from NuStar Energy LP's conference presentation, May 15, 2019
Slide 1: MLP & Energy Infrastructure Conference May 15-16, 2019
Exhibit 99.1 MLP & Energy Infra struct ure C onference May 15 –16, 2019
Slide 2: Forward-Looking Statements
Forward-Looking Statements Statements contained in this presentation other than statements of historical fact are forward-looking statements. While these forward-looking statements, and any assumptions upon which they are based, are made in good faith and reflect our current judgment regarding the d
Slide 3: Introduction
The Permian Basin: PhenomenalIntroduction Growth Driving Midstream Opportunities
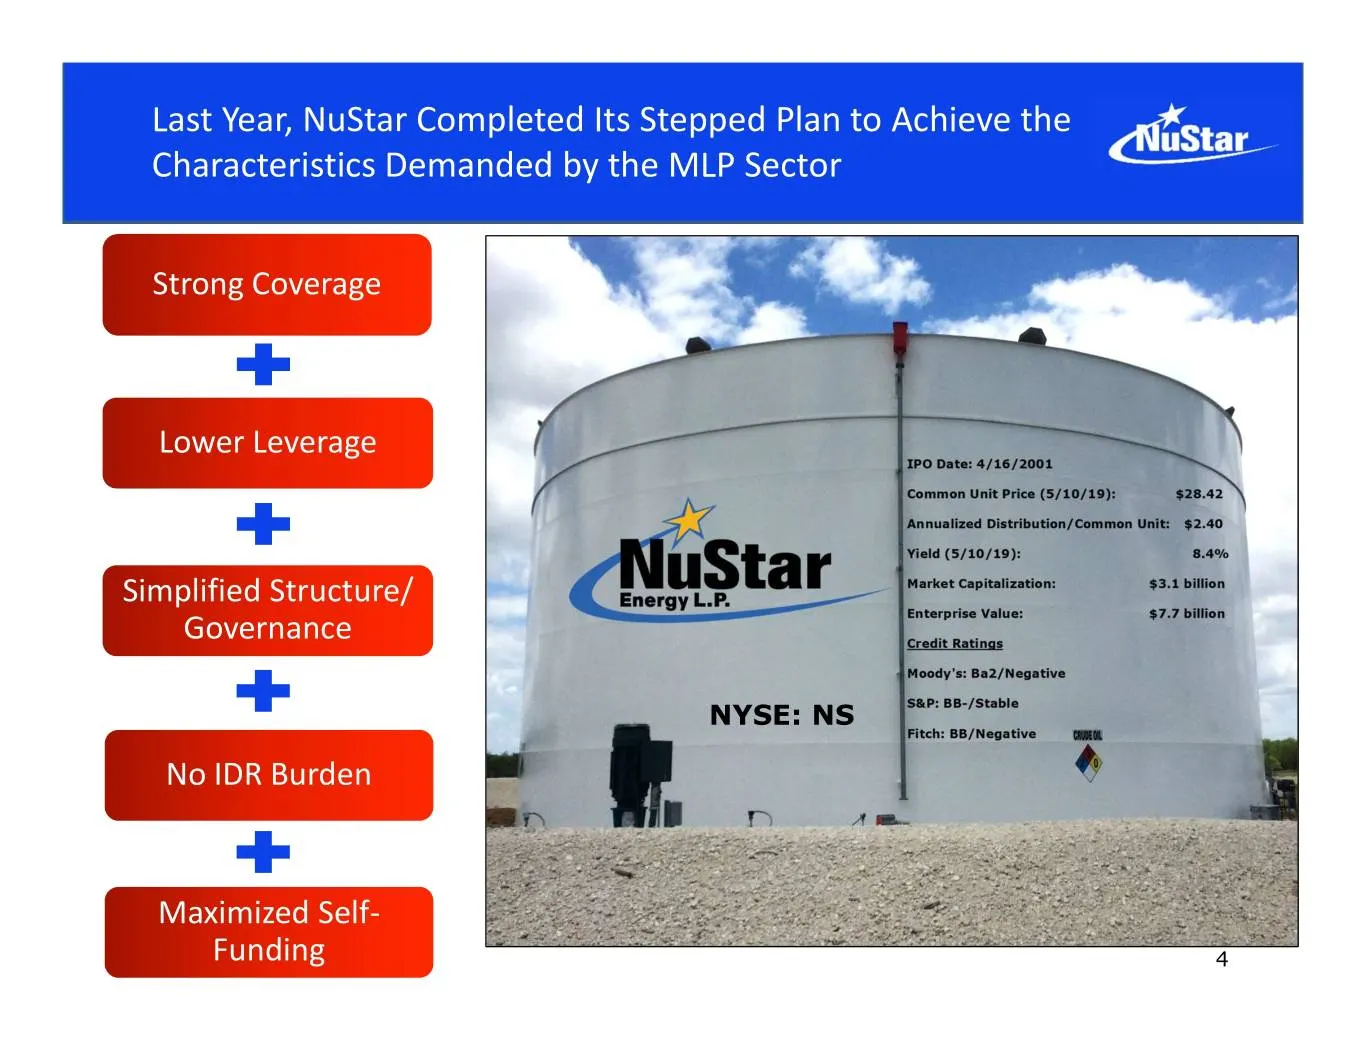
Slide 4: NuStar Completed Its Stepped Plan to Achieve MLP Sector Characteristics
Last Year, NuStar Completed Its Stepped Plan to Achieve the Characteristics Demanded by the MLP Sector Strong Coverage Lower Leverage Simplified Structure/ Governance NYSE: NS No IDR Burden Maximized Self- Funding 4
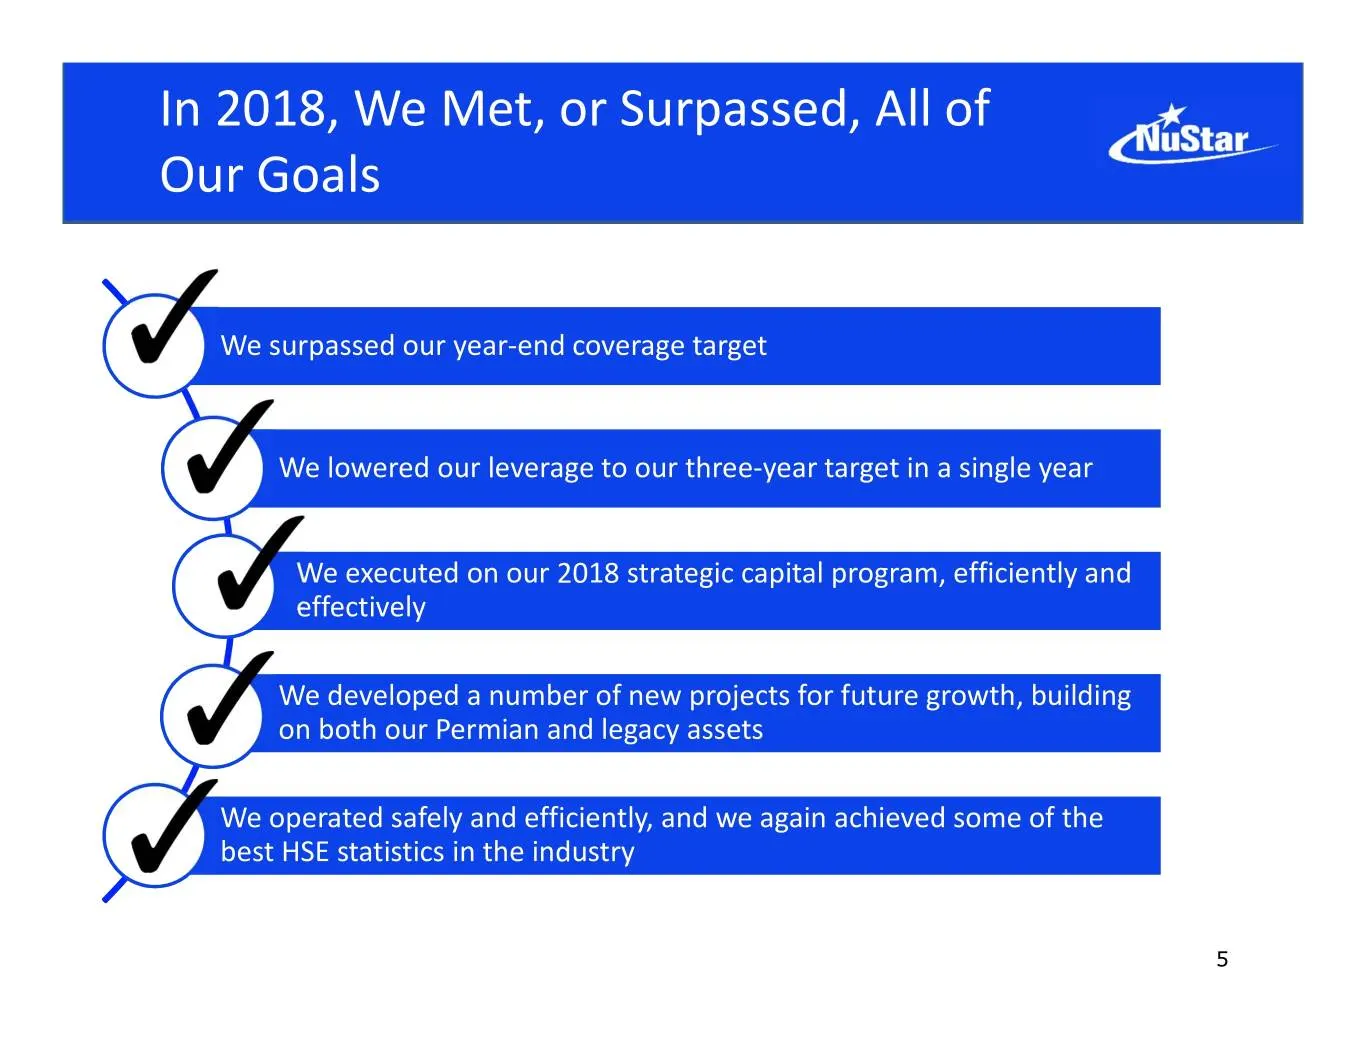
Slide 5: In 2018, We Met, or Surpassed, All of Our Goals
In 2018, We Met, or Surpassed, All of Our Goals We surpassed our year-end coverage target We lowered our leverage to our three-year target in a single year We executed on our 2018 strategic capital program, efficiently and effectively We developed a number of new projects for future growth, building
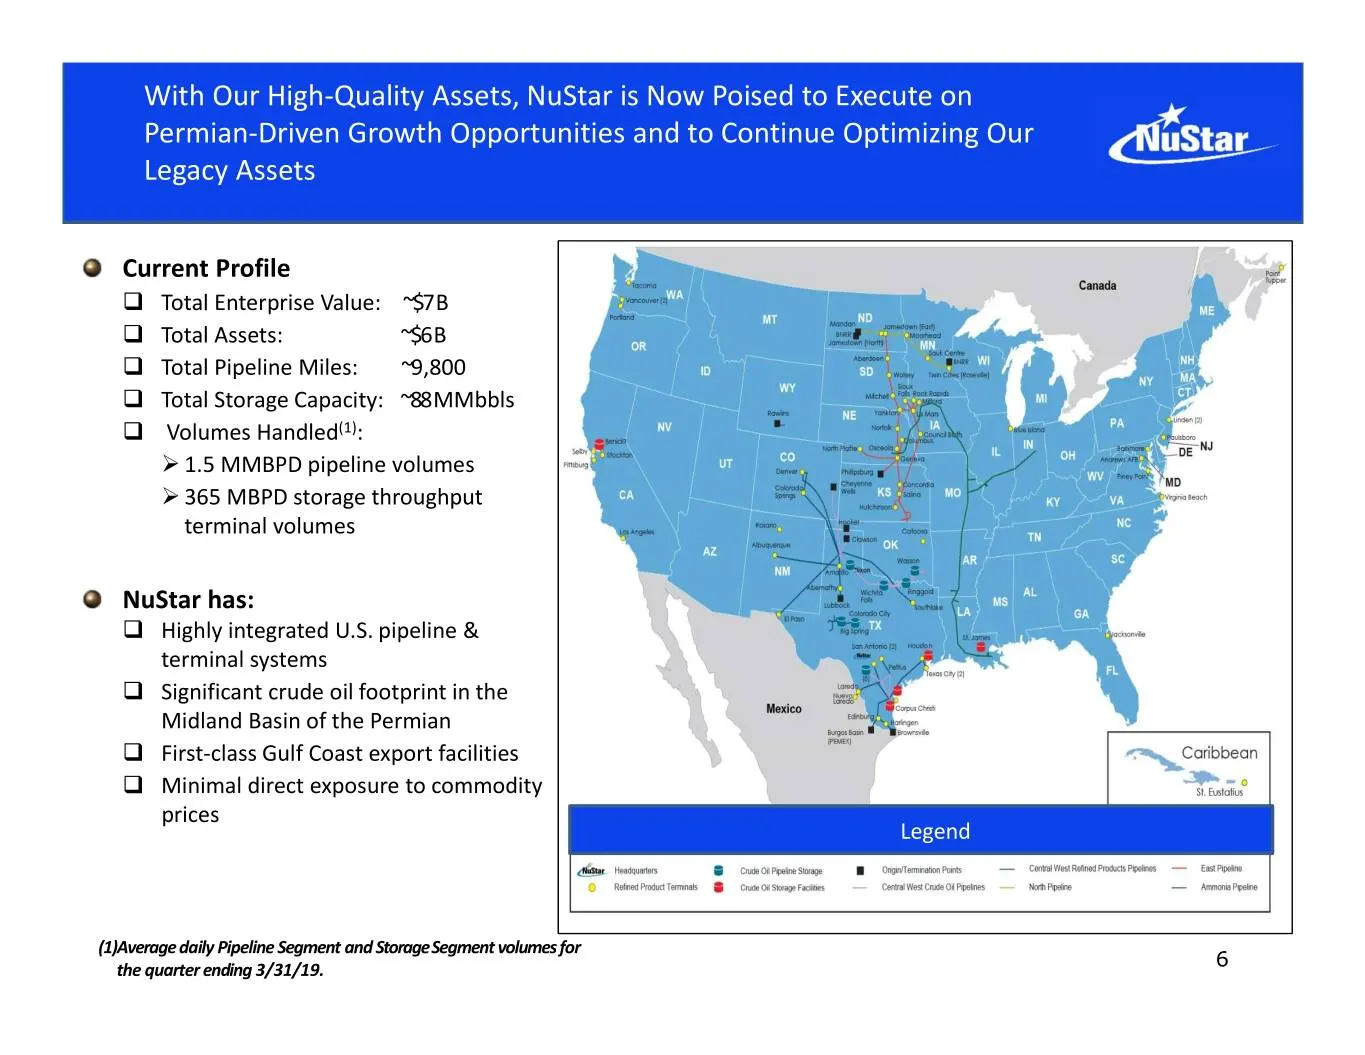
Slide 6: NuStar Poised to Execute on Permian-Driven Growth Opportunities
With Our High-Quality Assets, NuStar is Now Poised to Execute on Permian-Driven Growth Opportunities and to Continue Optimizing Our Legacy Assets Current Profile Total Enterprise Value: ~$7 B Total Assets: ~$6 B Total Pipeline Miles: ~9,800 Total Storage Capacity: ~88 MMbbls Volumes Handle
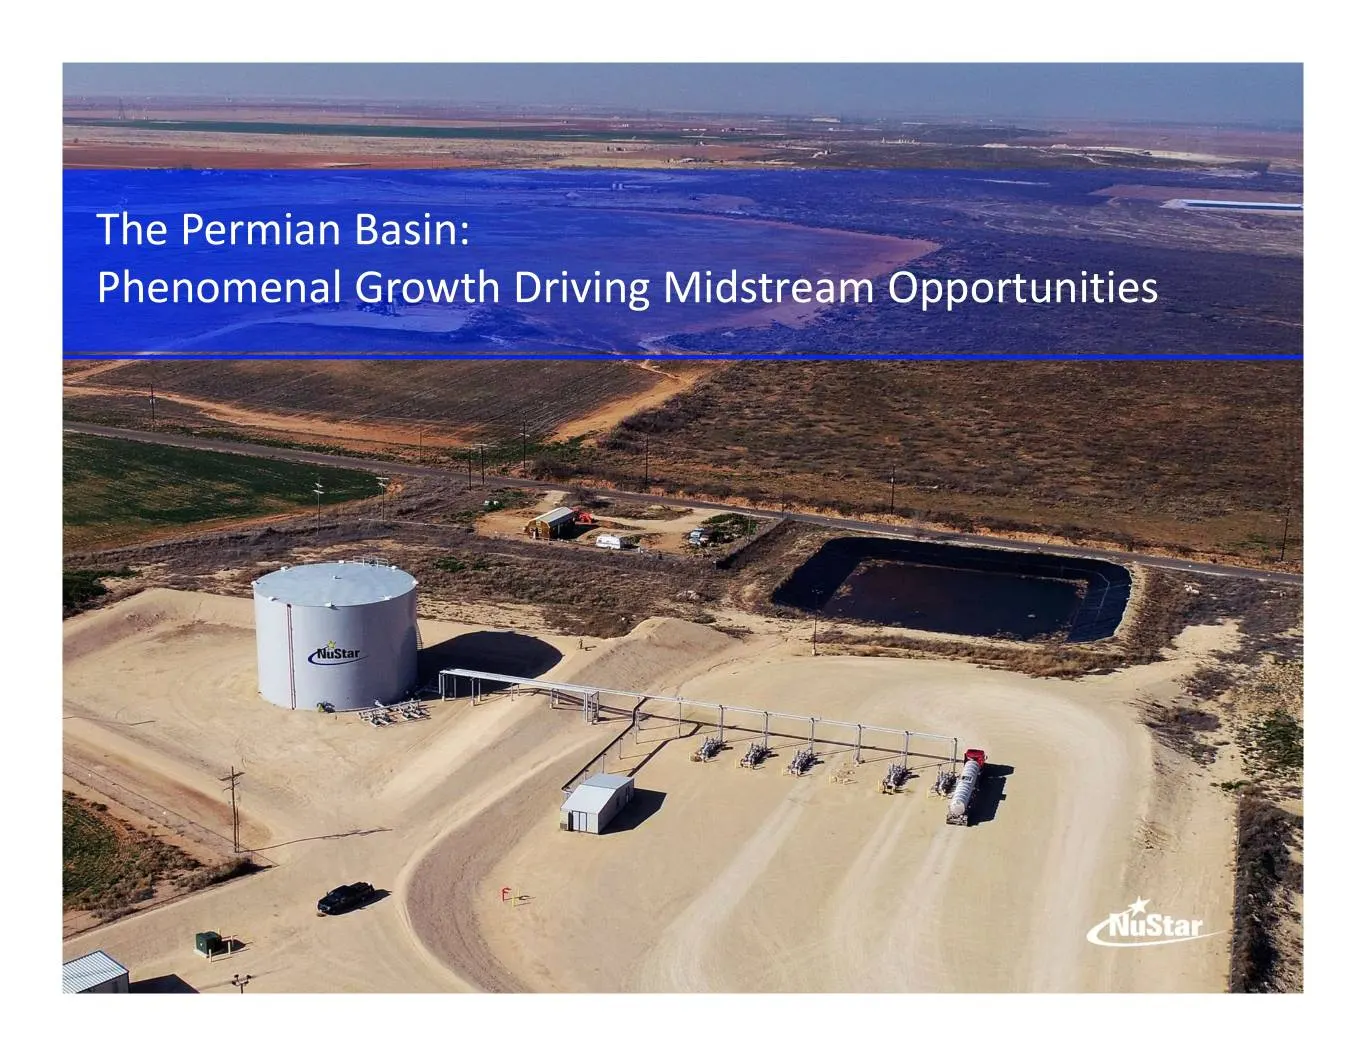
Slide 7: The Permian Basin: Phenomenal Growth Driving Midstream Opportunities
The Permian Basin: Phenomenal Growth Driving Midstream Opportunities
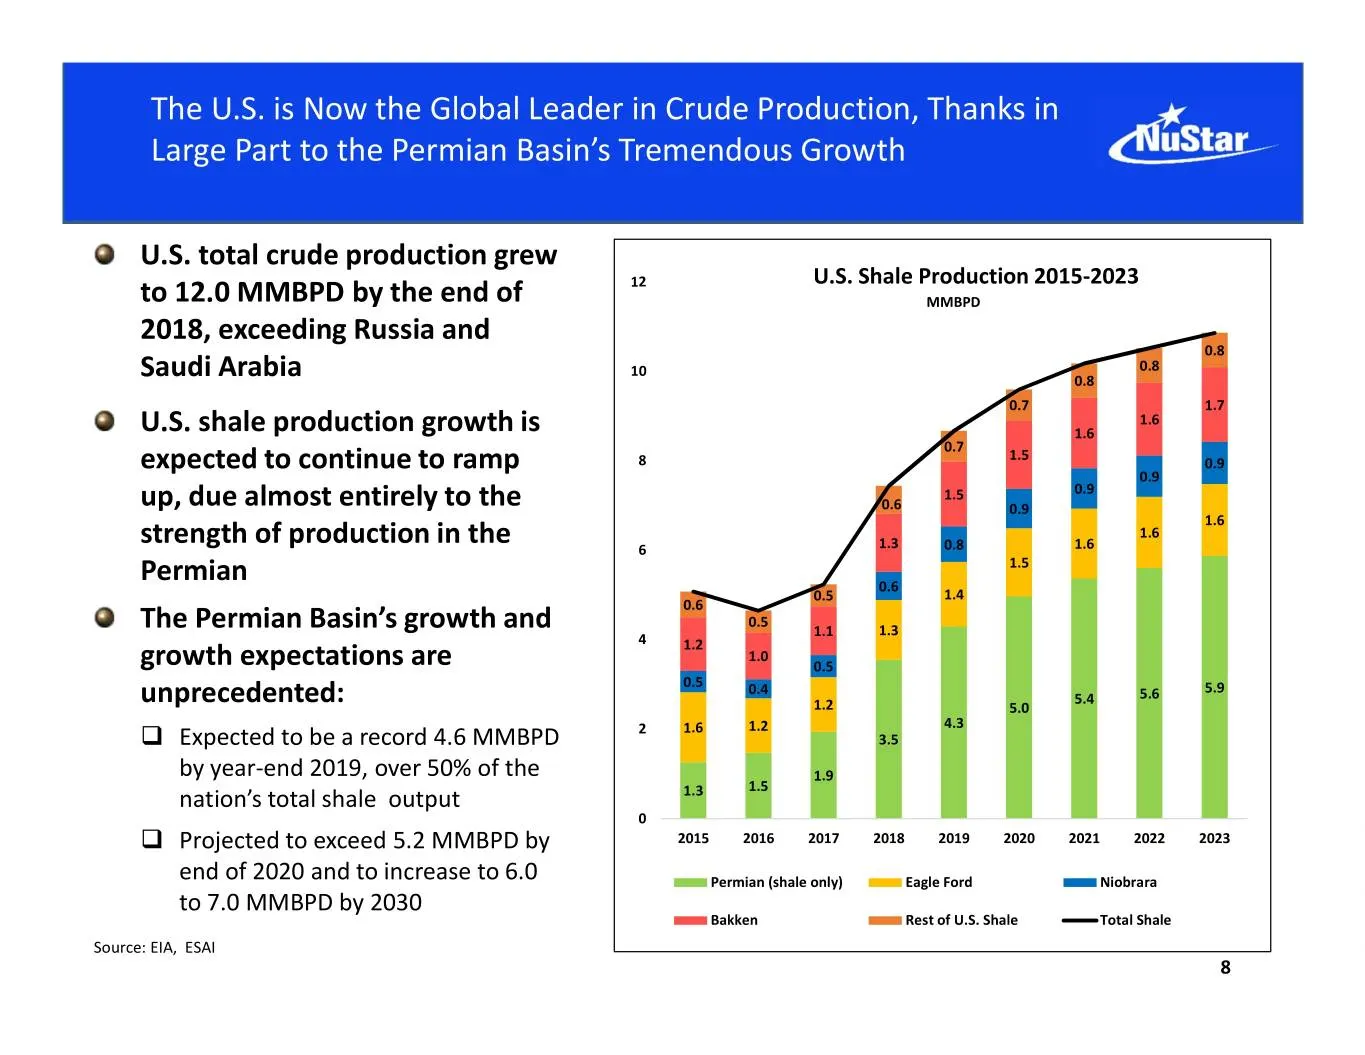
Slide 8: U.S. is Now the Global Leader in Crude Production
The U.S. is Now the Global Leader in Crude Production, Thanks in Large Part to the Permian Basin’s Tremendous Growth U.S. total crude production grew 12 U.S. Shale Production 2015-2023 to 12.0 MMBPD by the end of MMBPD 2018, exceeding Russia and 0.8 10 0.8 Saudi Arabia 0.8 0.7 1.7 1.6 U.S. shale pro
Slide 9: Breadth and Depth of the Permian's Growth Potential is Unprecedented
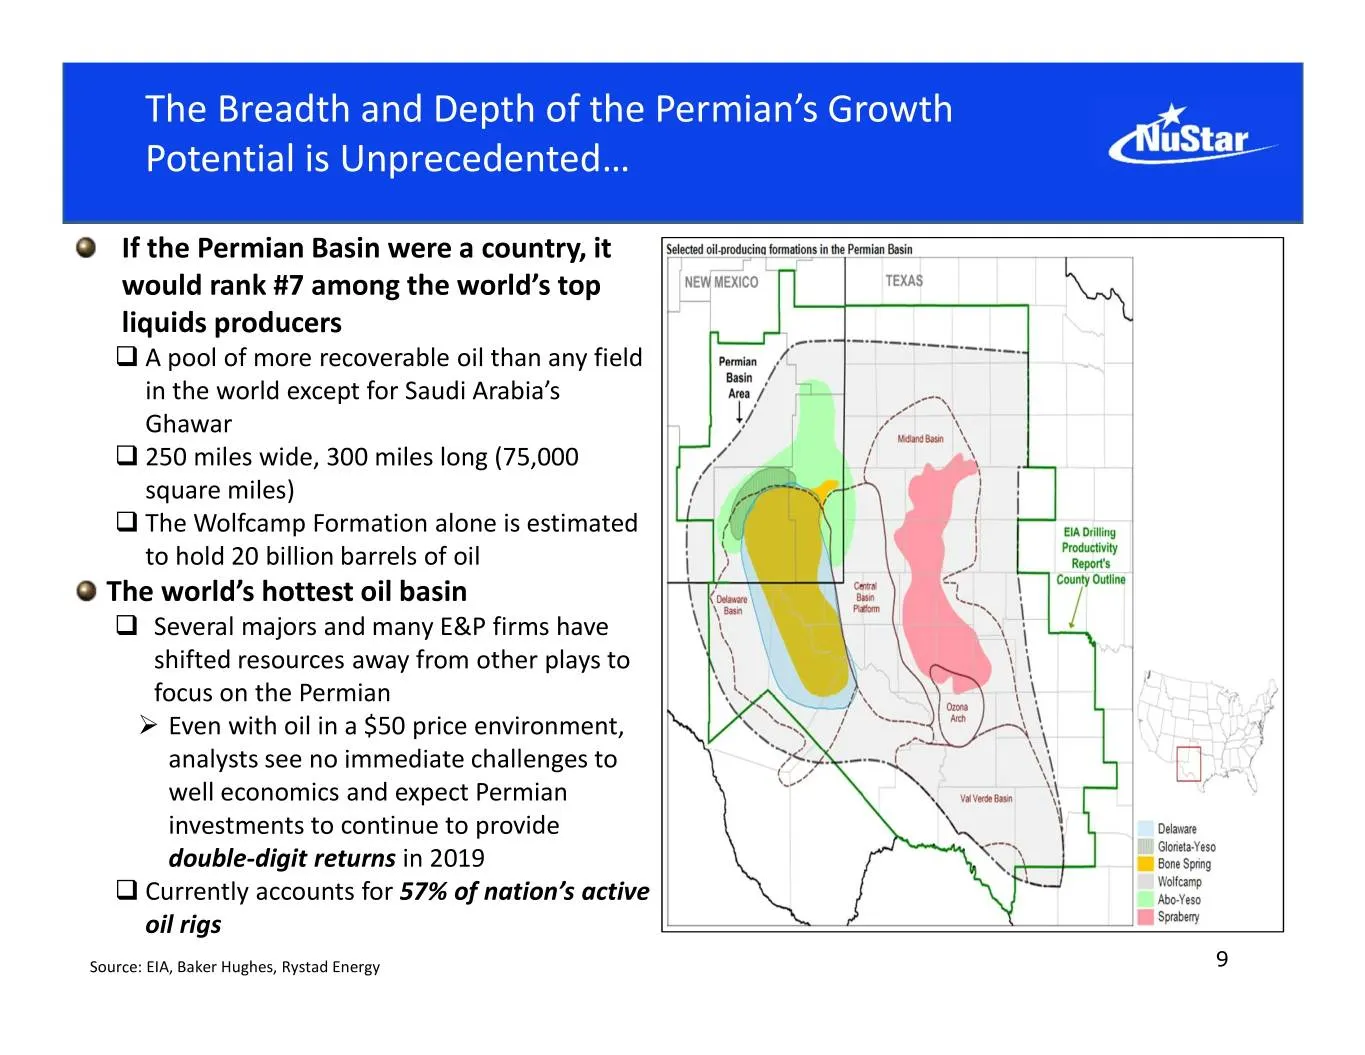
The Breadth and Depth of the Permian’s Growth Potential is Unprecedented… If the Permian Basin were a country, it would rank #7 among the world’s top liquids producers A pool of more recoverable oil than any field in the world except for Saudi Arabia’s Ghawar 250 miles wide, 300 miles long (75,0
Slide 10: Basin's Resiliency and Efficiency Should Drive Strong Growth
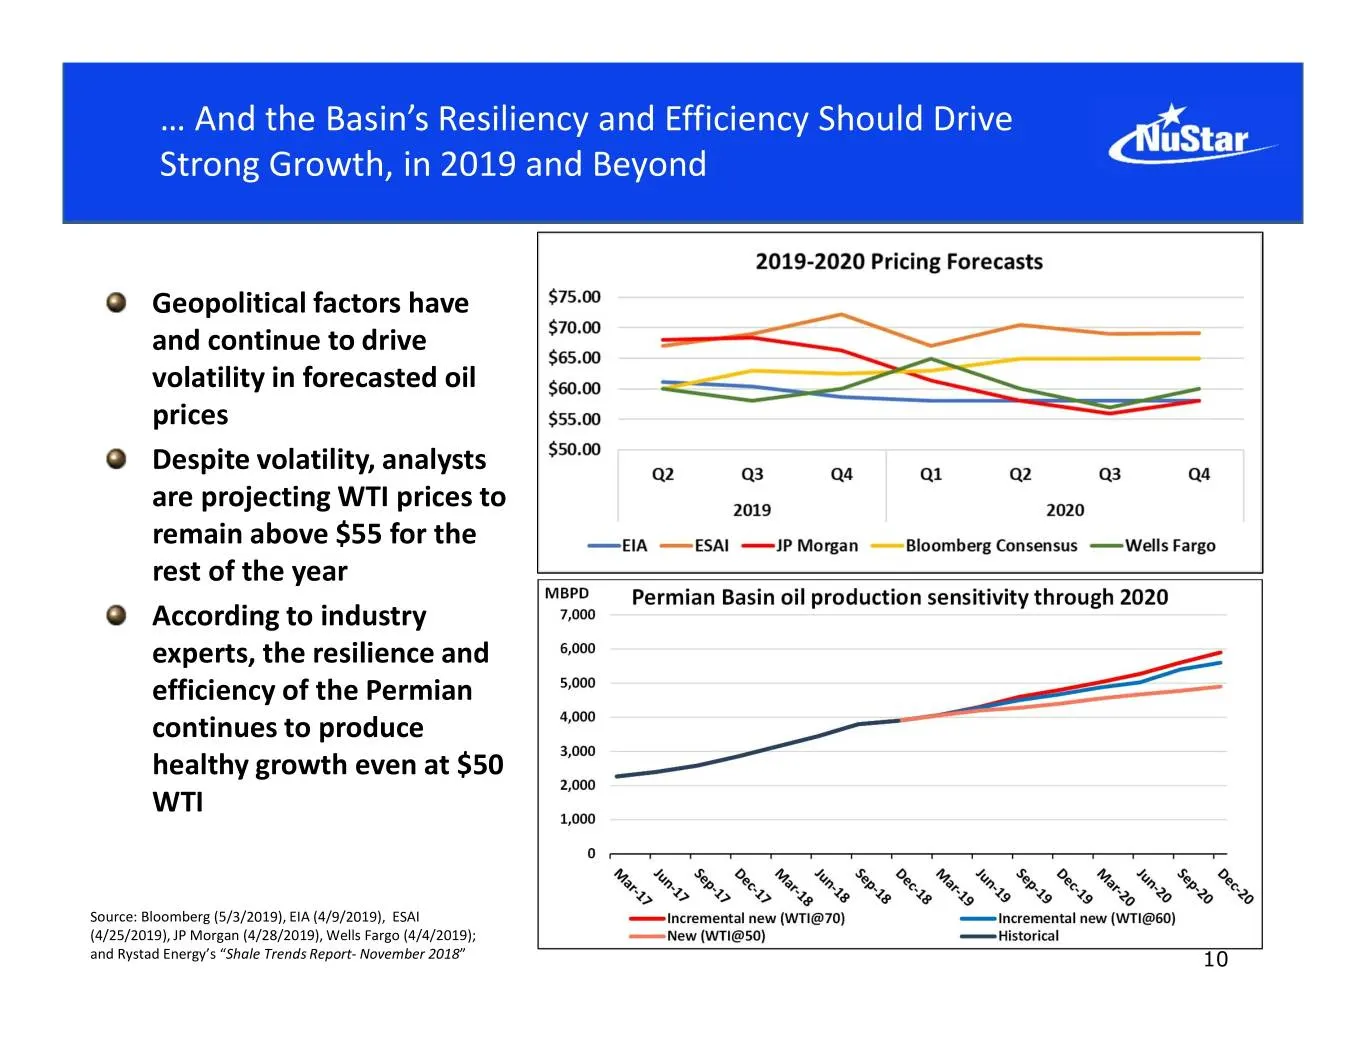
… And the Basin’s Resiliency and Efficiency Should Drive Strong Growth, in 2019 and Beyond Geopolitical factors have and continue to drive volatility in forecasted oil prices Despite volatility, analysts are projecting WTI prices to remain above $55 for the rest of the year MBPD Permian Basin oil pr
Slide 11: Producers in the Basin Remain Bullish on Permian Growth
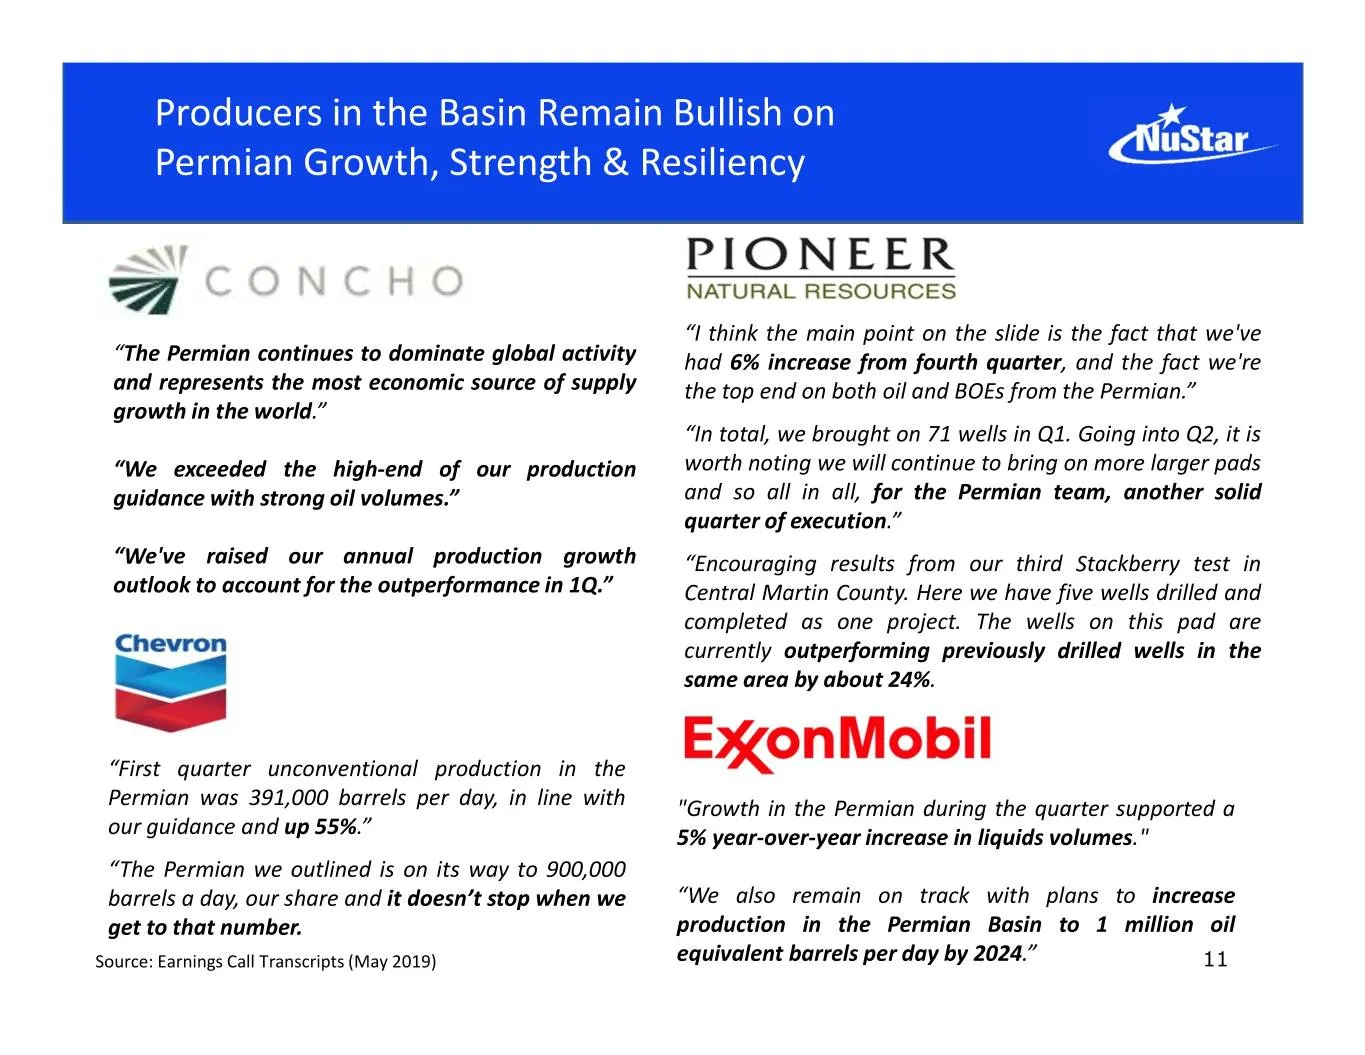
Producers in the Basin Remain Bullish on Permian Growth, Strength & Resiliency “I think the main point on the slide is the fact that we've “The Permian continues to dominate global activity had 6% increase from fourth quarter, and the fact we're and represents the most economic source of supply the
Slide 12: Permian's Track Record Driving Midstream Growth Opportunities
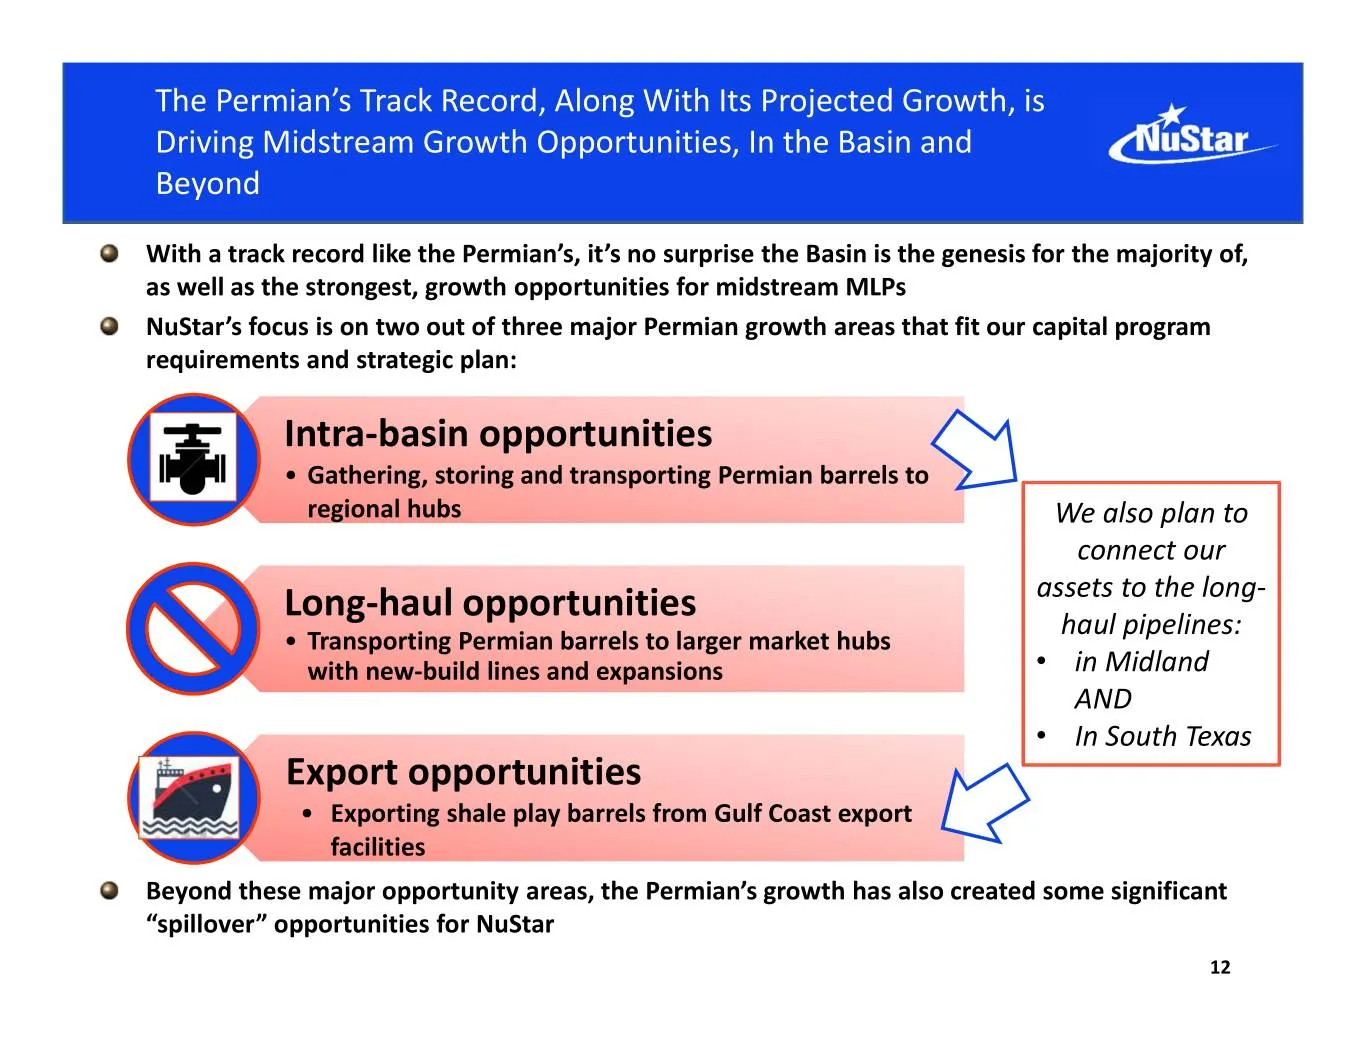
The Permian’s Track Record, Along With Its Projected Growth, is Driving Midstream Growth Opportunities, In the Basin and Beyond With a track record like the Permian’s, it’s no surprise the Basin is the genesis for the majority of, as well as the strongest, growth opportunities for midstream MLPs NuS
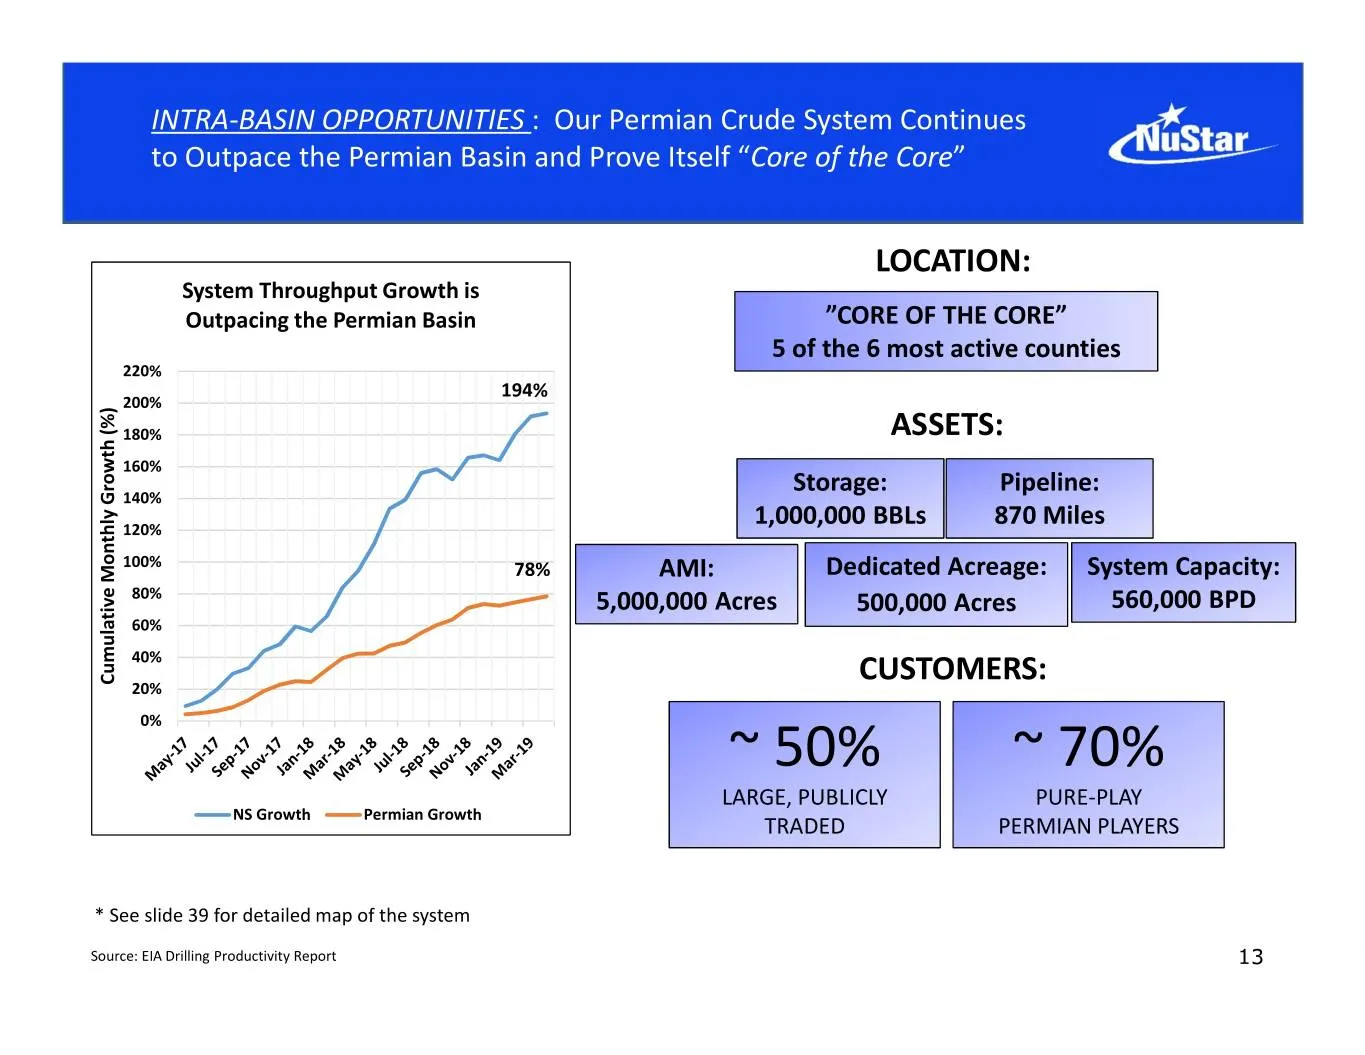
Slide 13: Our Permian Crude System Continues to Outpace the Permian Basin
INTRA-BASIN OPPORTUNITIES : Our Permian Crude System Continues to Outpace the Permian Basin and Prove Itself “Core of the Core” LOCATION: System Throughput Growth is Outpacing the Permian Basin ”CORE OF THE CORE” 5 of the 6 most active counties 220% 194% 200% 180% ASSETS: 160% Storage: Pipeline: 140
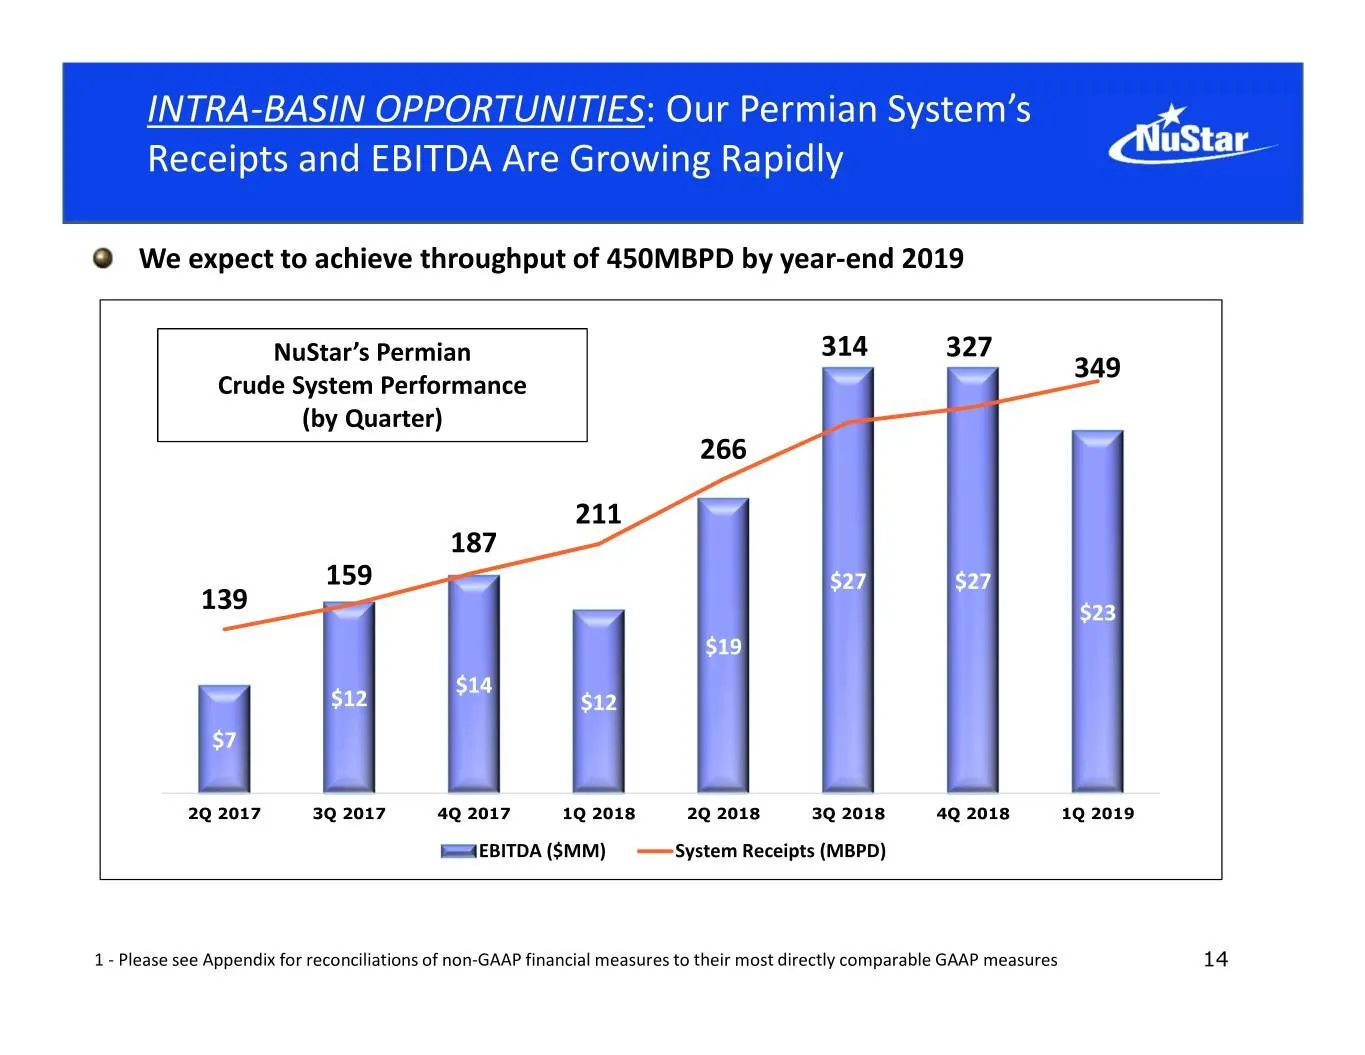
Slide 14: Permian System's Receipts and EBITDA Are Growing Rapidly
INTRA-BASIN OPPORTUNITIES: Our Permian System’s Receipts and EBITDA Are Growing Rapidly We expect to achieve throughput of 450MBPD by year-end 2019 $30 400 NuStar’s Permian 314 327 349 350 $25 Crude System Performance (by Quarter) 266 300 $20 250 211 $15 187 200 159 $27 $27 139 $23 150 $10 $19 $14 1
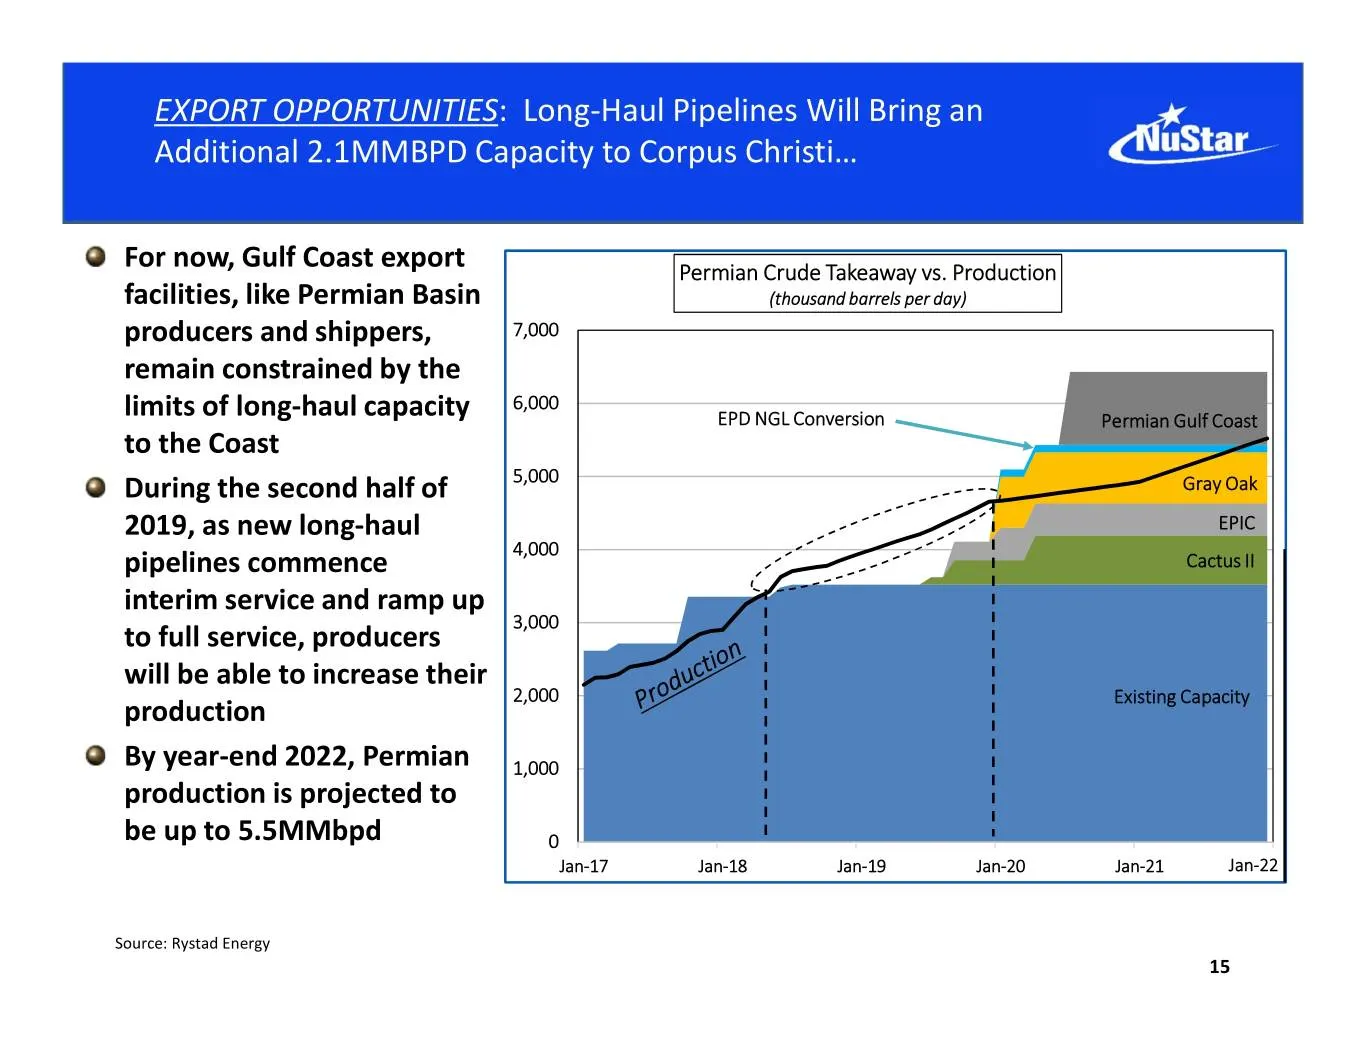
Slide 15: Long-Haul Pipelines Will Bring Additional 2.1MMBPD Capacity to Corpus Christi
EXPORT OPPORTUNITIES: Long-Haul Pipelines Will Bring an Additional 2.1MMBPD Capacity to Corpus Christi… For now, Gulf Coast export Permian Crude Takeaway vs. Production facilities, like Permian Basin (thousand barrels per day) producers and shippers, 7,000 remain constrained by the 6,000 limits of l
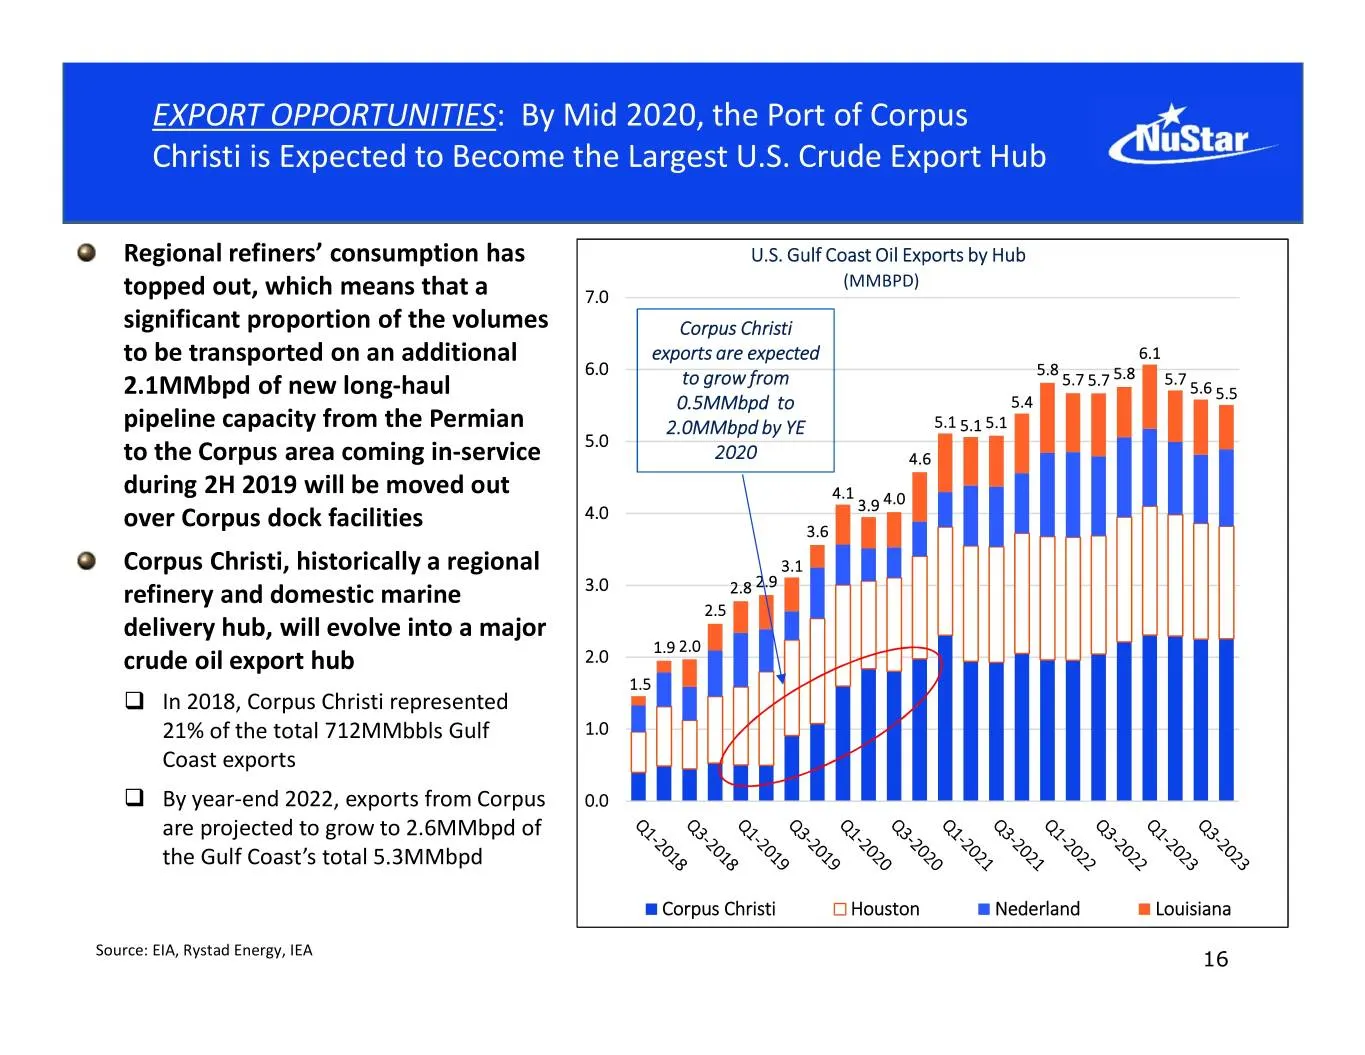
Slide 16: Port of Corpus Christi Expected to Become Largest U.S. Crude Export Hub
EXPORT OPPORTUNITIES: By Mid 2020, the Port of Corpus Christi is Expected to Become the Largest U.S. Crude Export Hub Regional refiners’ consumption has U.S. Gulf Coast Oil Exports by Hub (MMBPD) topped out, which means that a 7.0 significant proportion of the volumes Corpus Christi to be transporte
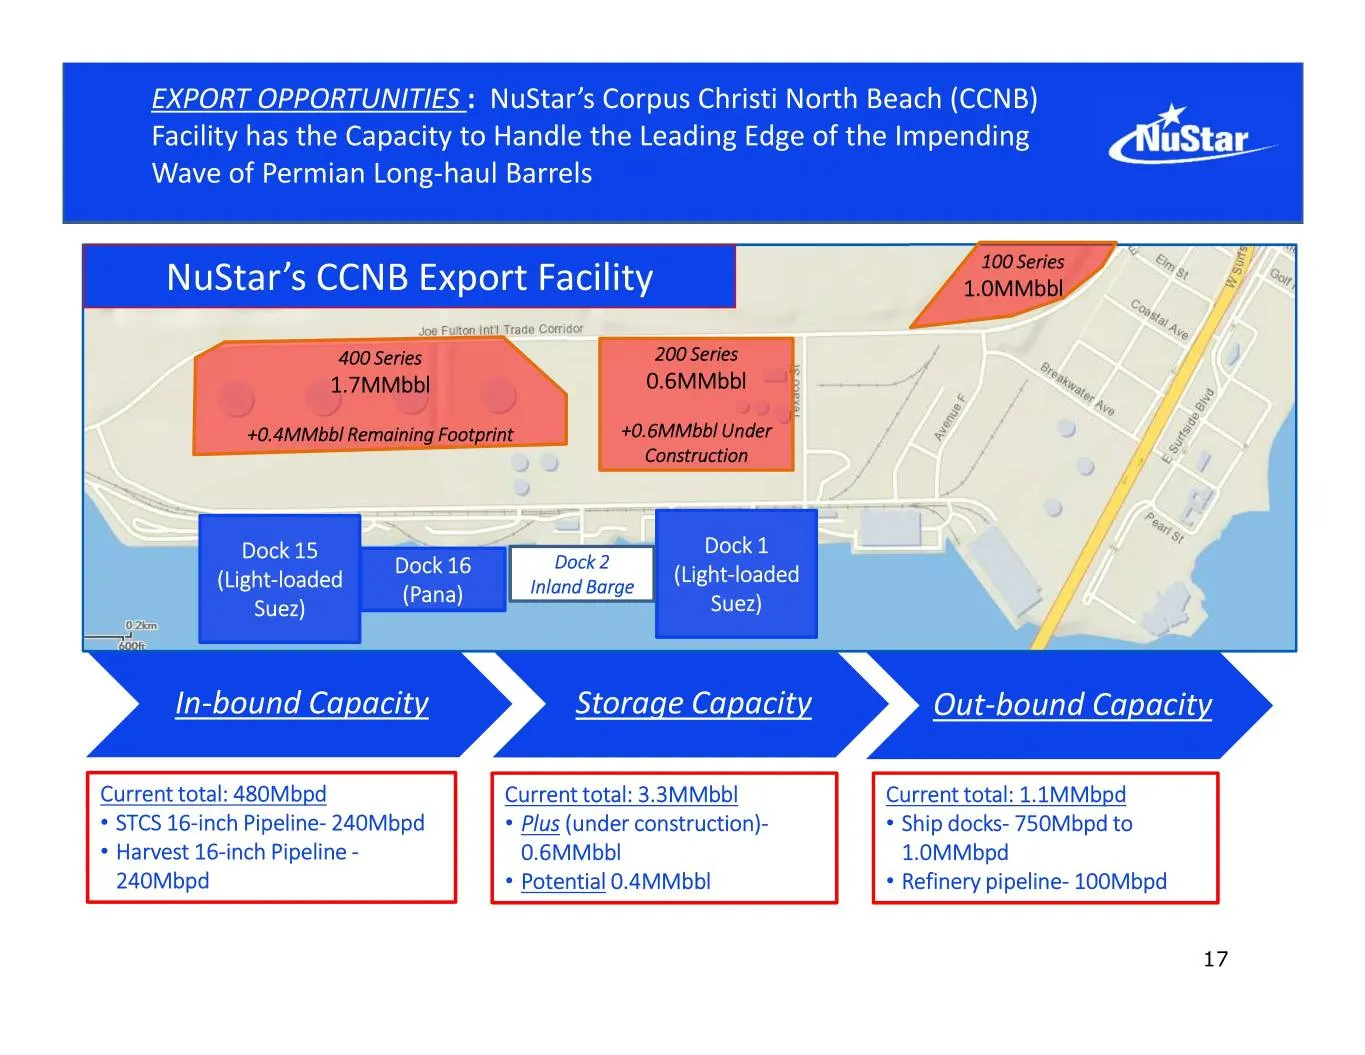
Slide 17: NuStar's CCNB Facility Capacity for Permian Long-haul Barrels
EXPORT OPPORTUNITIES : NuStar’s Corpus Christi North Beach (CCNB) Facility has the Capacity to Handle the Leading Edge of the Impending Wave of Permian Long-haul Barrels 100 Series NuStar’s CCNB Export Facility 1.0MMbbl 400 Series 200 Series 1.7MMbbl 0.6MMbbl +0.4MMbbl Remaining Footprint +0.6MMbbl
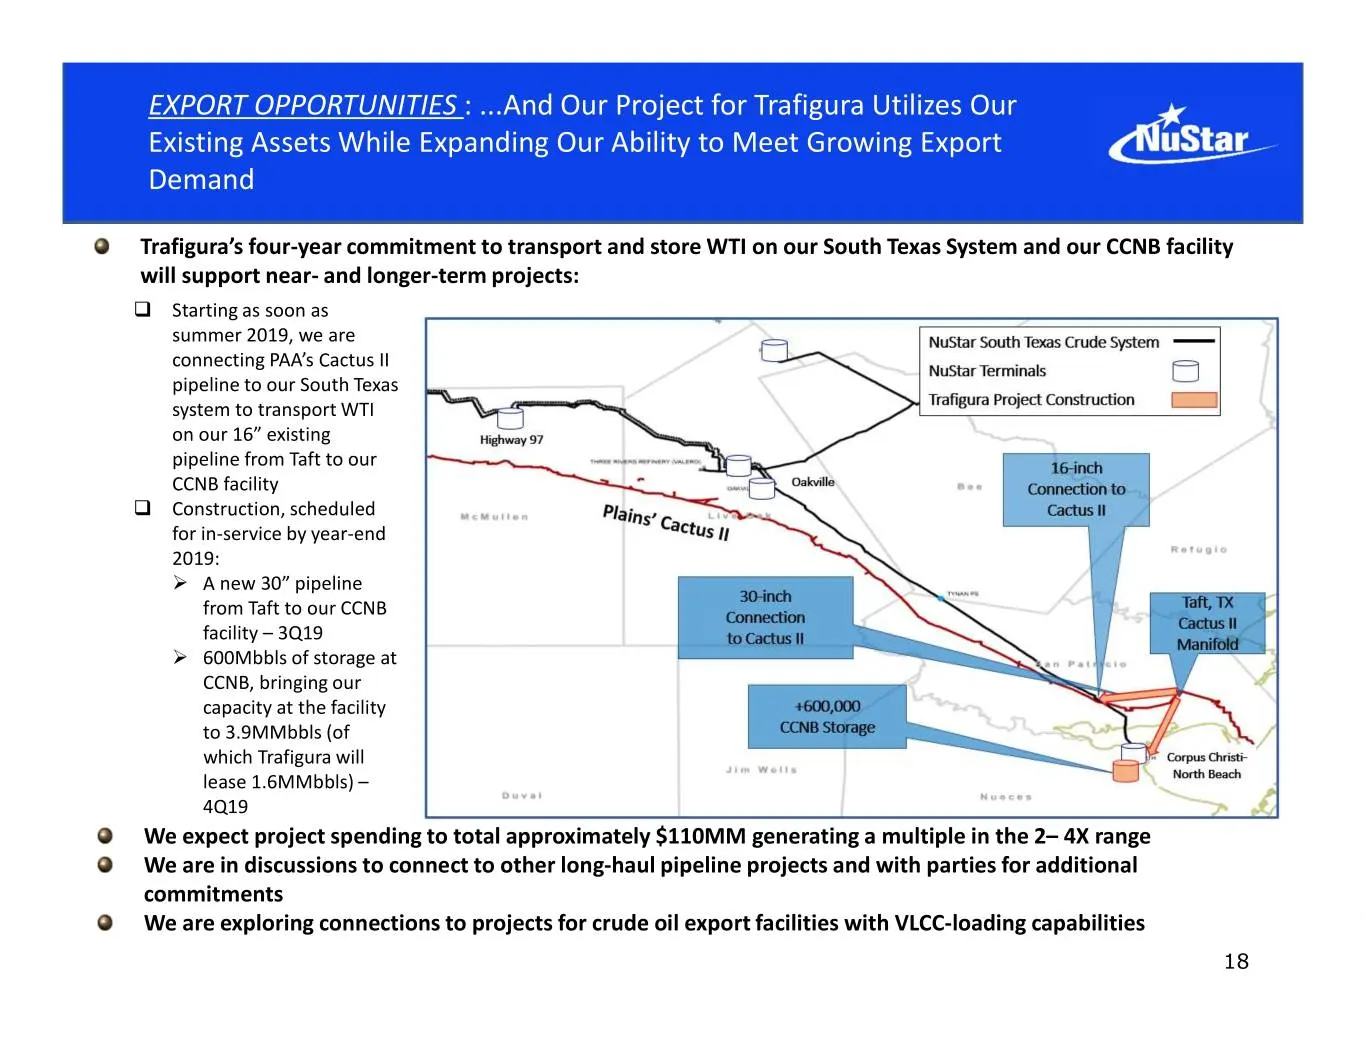
Slide 18: Our Project for Trafigura Utilizes Existing Assets
EXPORT OPPORTUNITIES : ...And Our Project for Trafigura Utilizes Our Existing Assets While Expanding Our Ability to Meet Growing Export Demand Trafigura’s four-year commitment to transport and store WTI on our South Texas System and our CCNB facility will support near- and longer-term projects: St
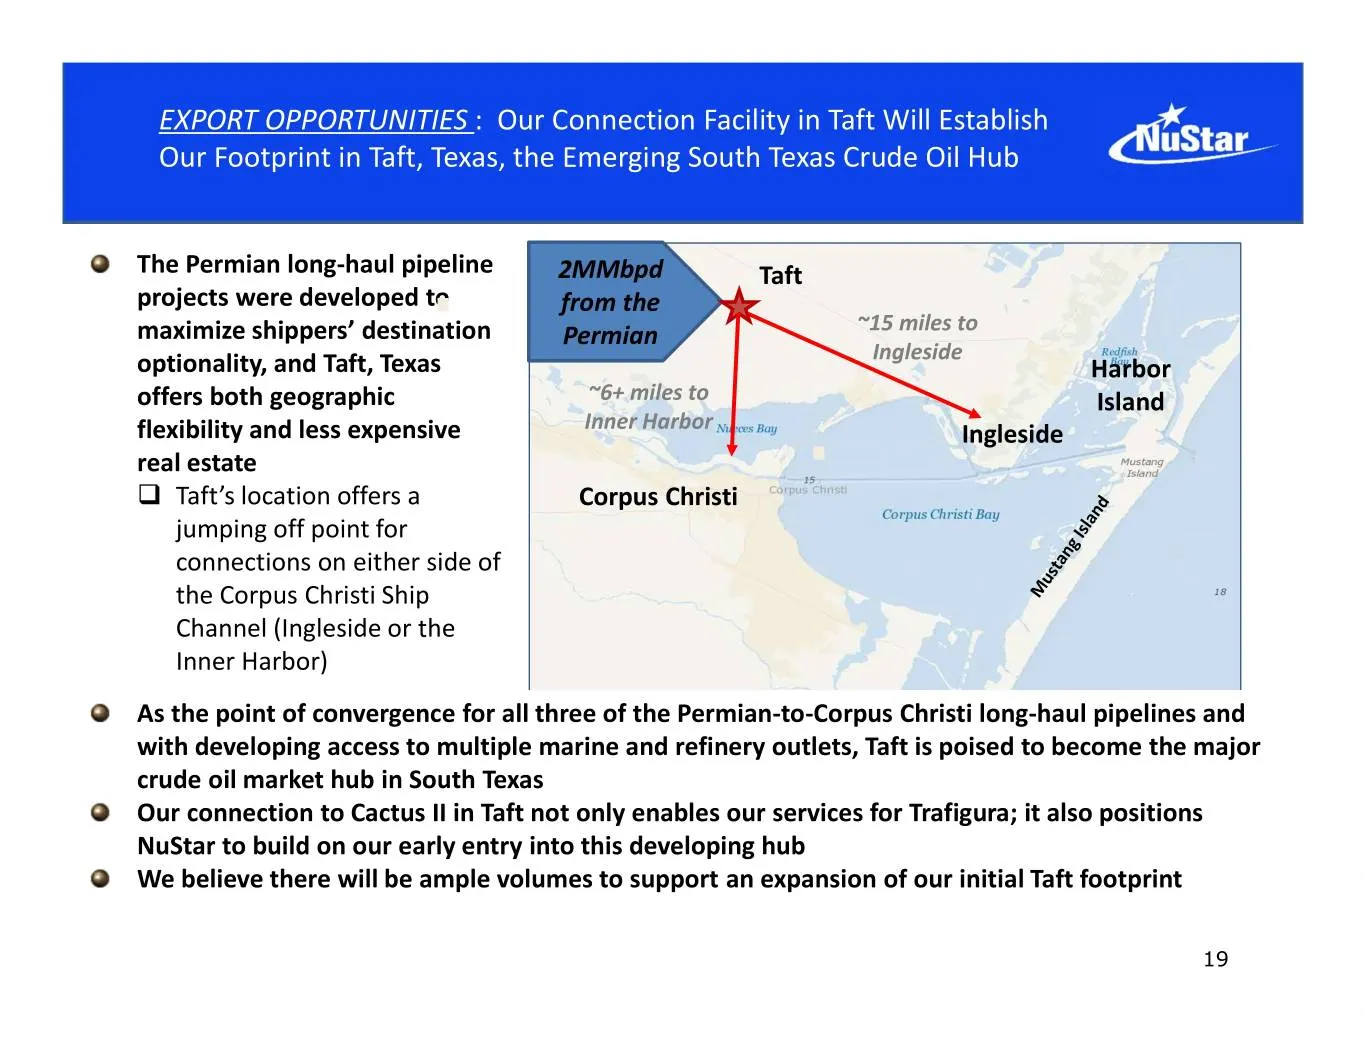
Slide 19: Our Connection Facility in Taft, Emerging South Texas Crude Hub
EXPORT OPPORTUNITIES : Our Connection Facility in Taft Will Establish Our Footprint in Taft, Texas, the Emerging South Texas Crude Oil Hub The Permian long-haul pipeline 2MMbpd Taft projects were developed to from the maximize shippers’ destination Permian ~15 miles to Ingleside optionality, and Taf
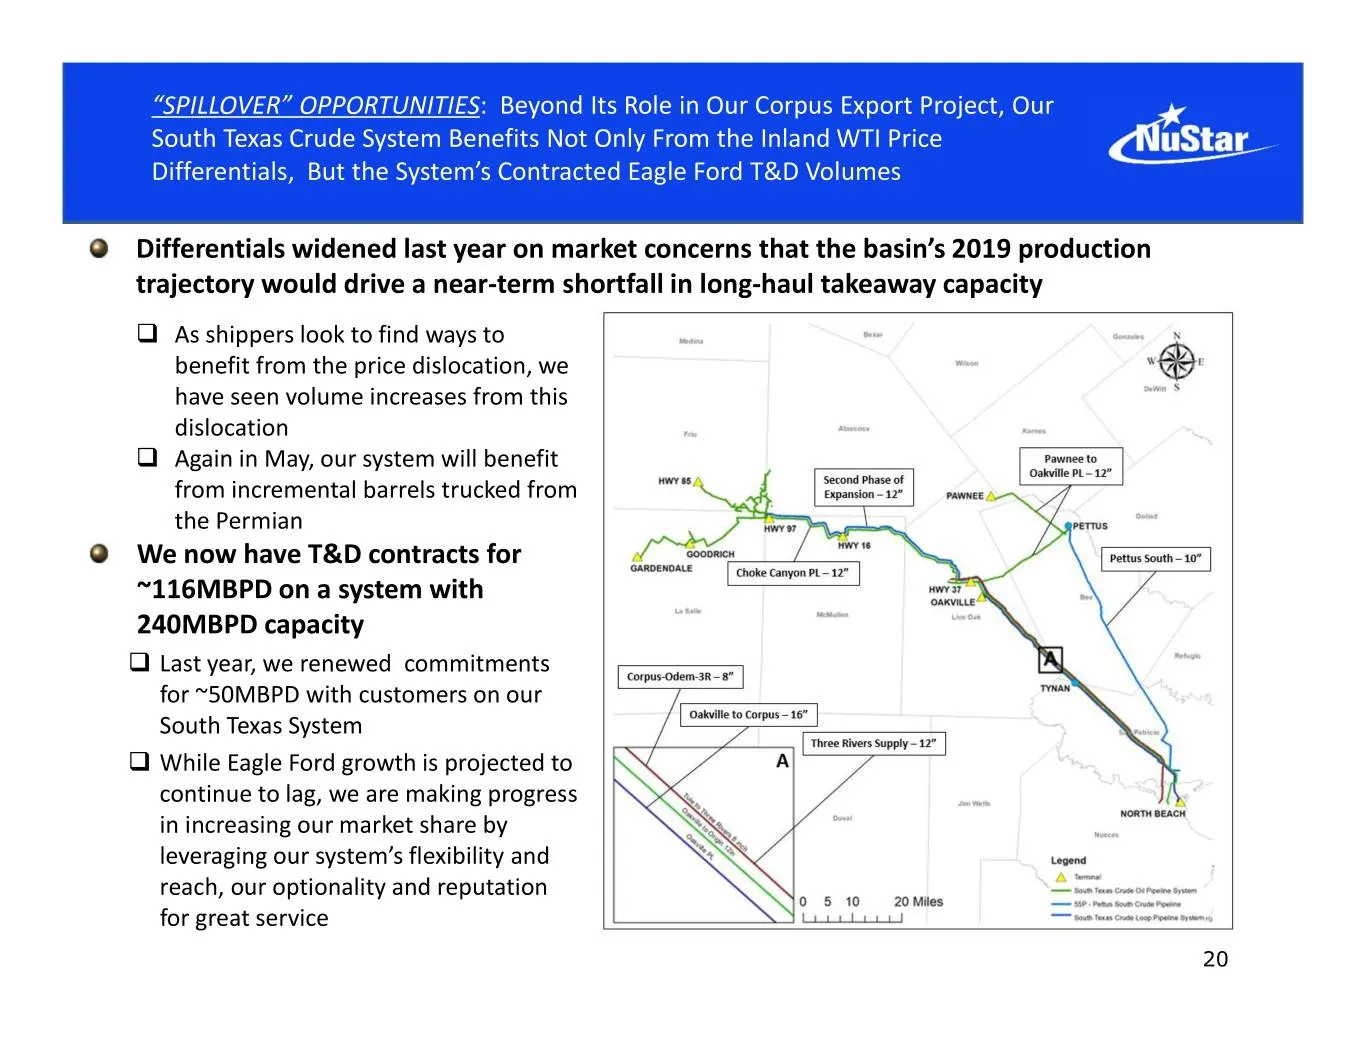
Slide 20: South Texas Crude System Spillover Opportunities
“SPILLOVER” OPPORTUNITIES: Beyond Its Role in Our Corpus Export Project, Our South Texas Crude System Benefits Not Only From the Inland WTI Price Differentials, But the System’s Contracted Eagle Ford T&D Volumes Differentials widened last year on market concerns that the basin’s 2019 production traj
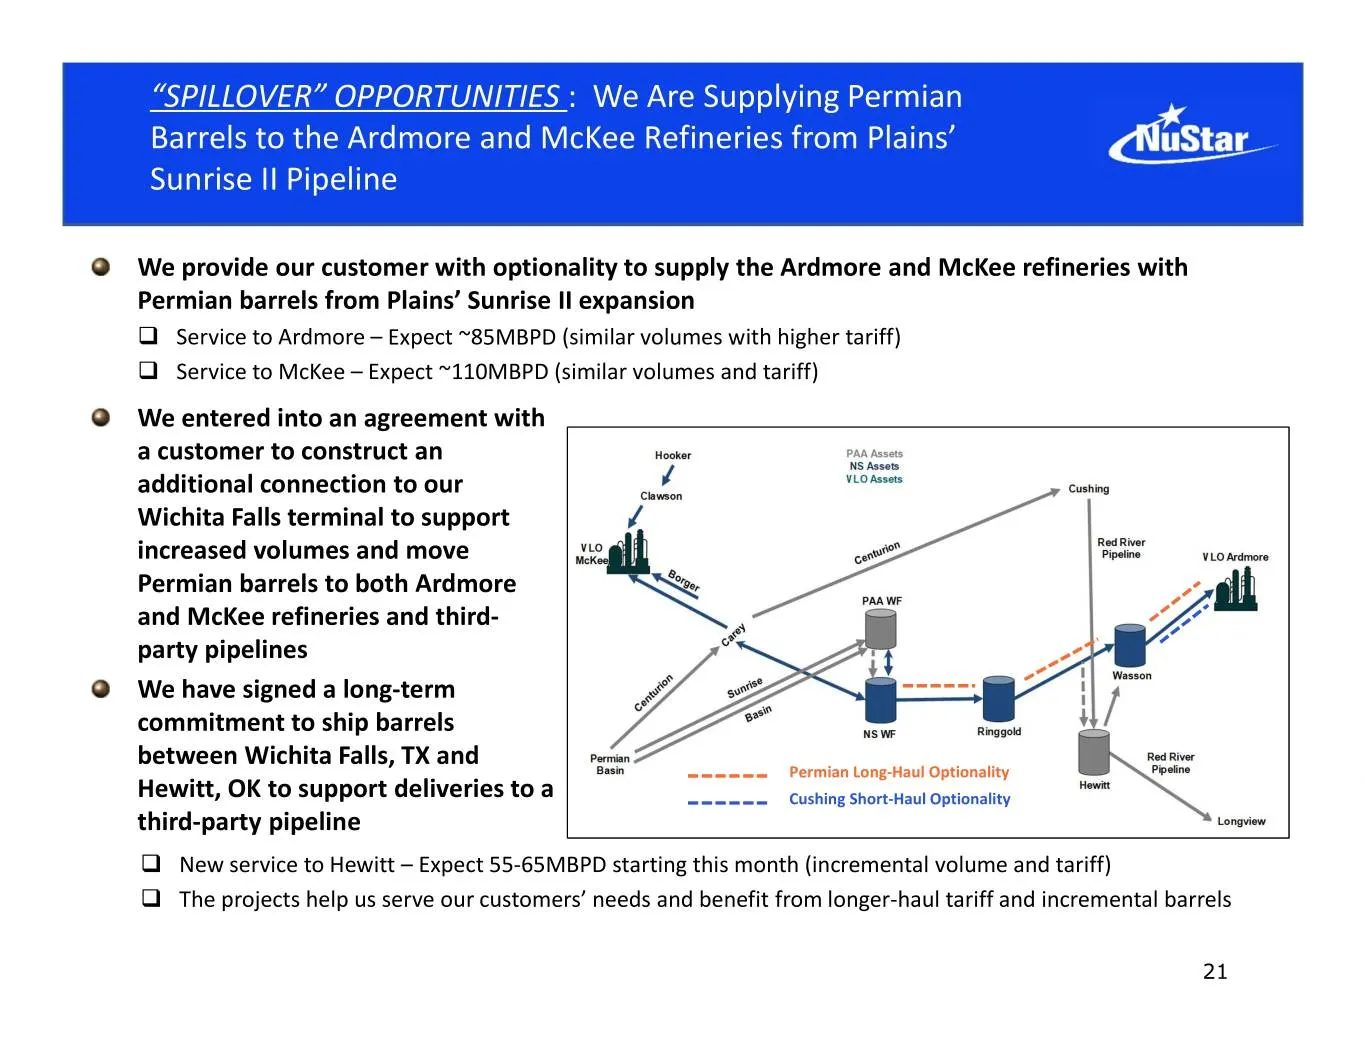
Slide 21: Supplying Permian Barrels to Ardmore and McKee Refineries
“SPILLOVER” OPPORTUNITIES : We Are Supplying Permian Barrels to the Ardmore and McKee Refineries from Plains’ Sunrise II Pipeline We provide our customer with optionality to supply the Ardmore and McKee refineries with Permian barrels from Plains’ Sunrise II expansion Service to Ardmore – Expect ~
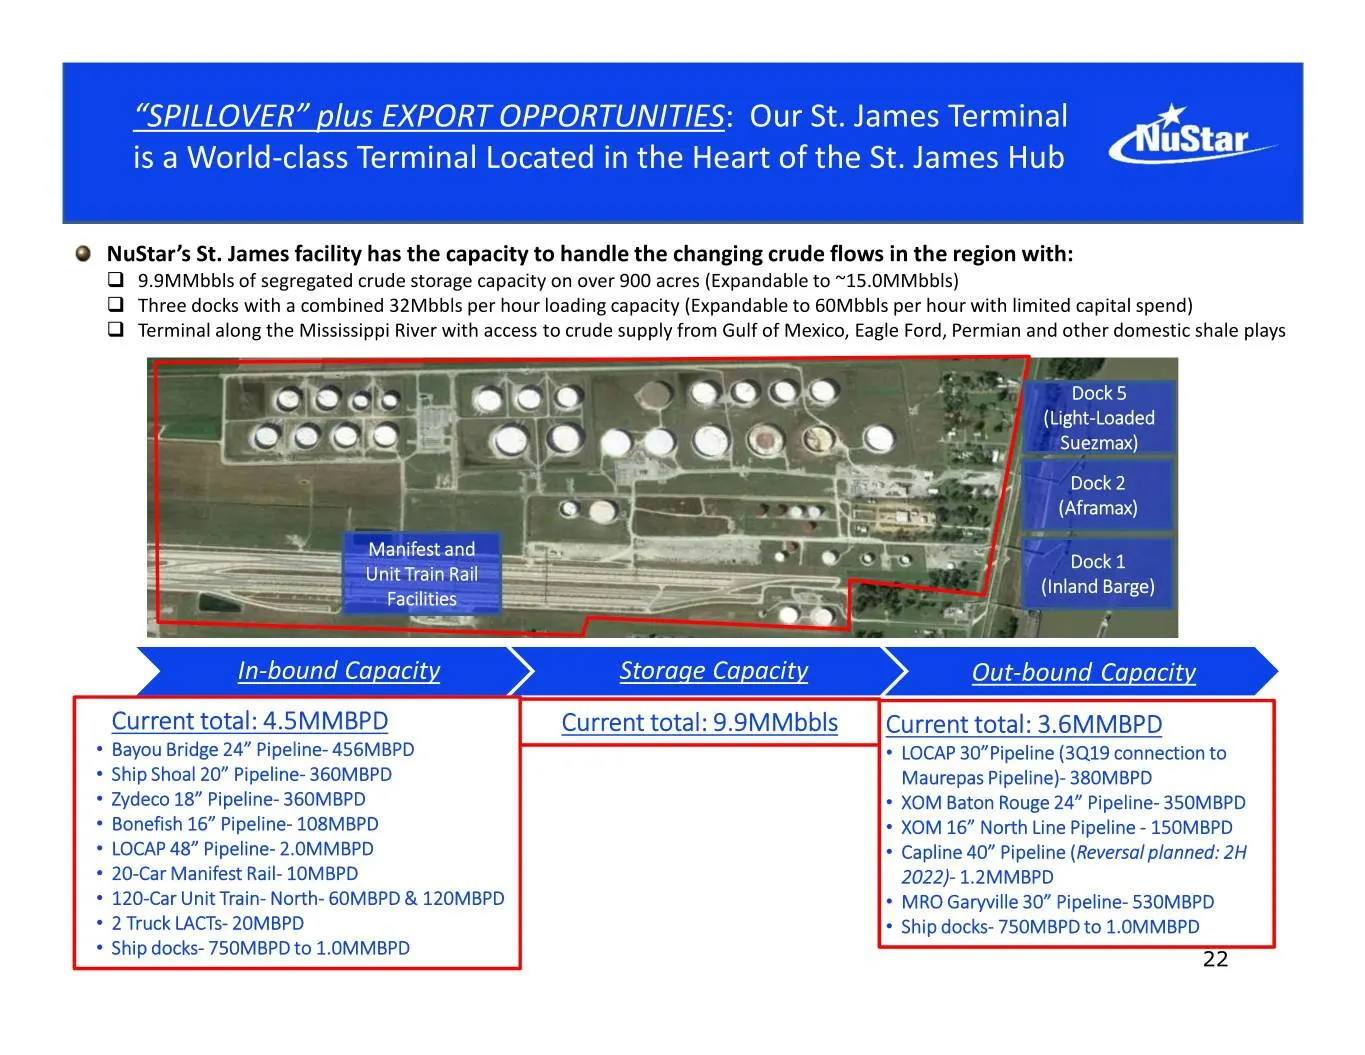
Slide 22: St. James Terminal is a World-class Terminal
“SPILLOVER” plus EXPORT OPPORTUNITIES: Our St. James Terminal is a World-class Terminal Located in the Heart of the St. James Hub NuStar’s St. James facility has the capacity to handle the changing crude flows in the region with: 9.9MMbbls of segregated crude storage capacity on over 900 acres (Ex
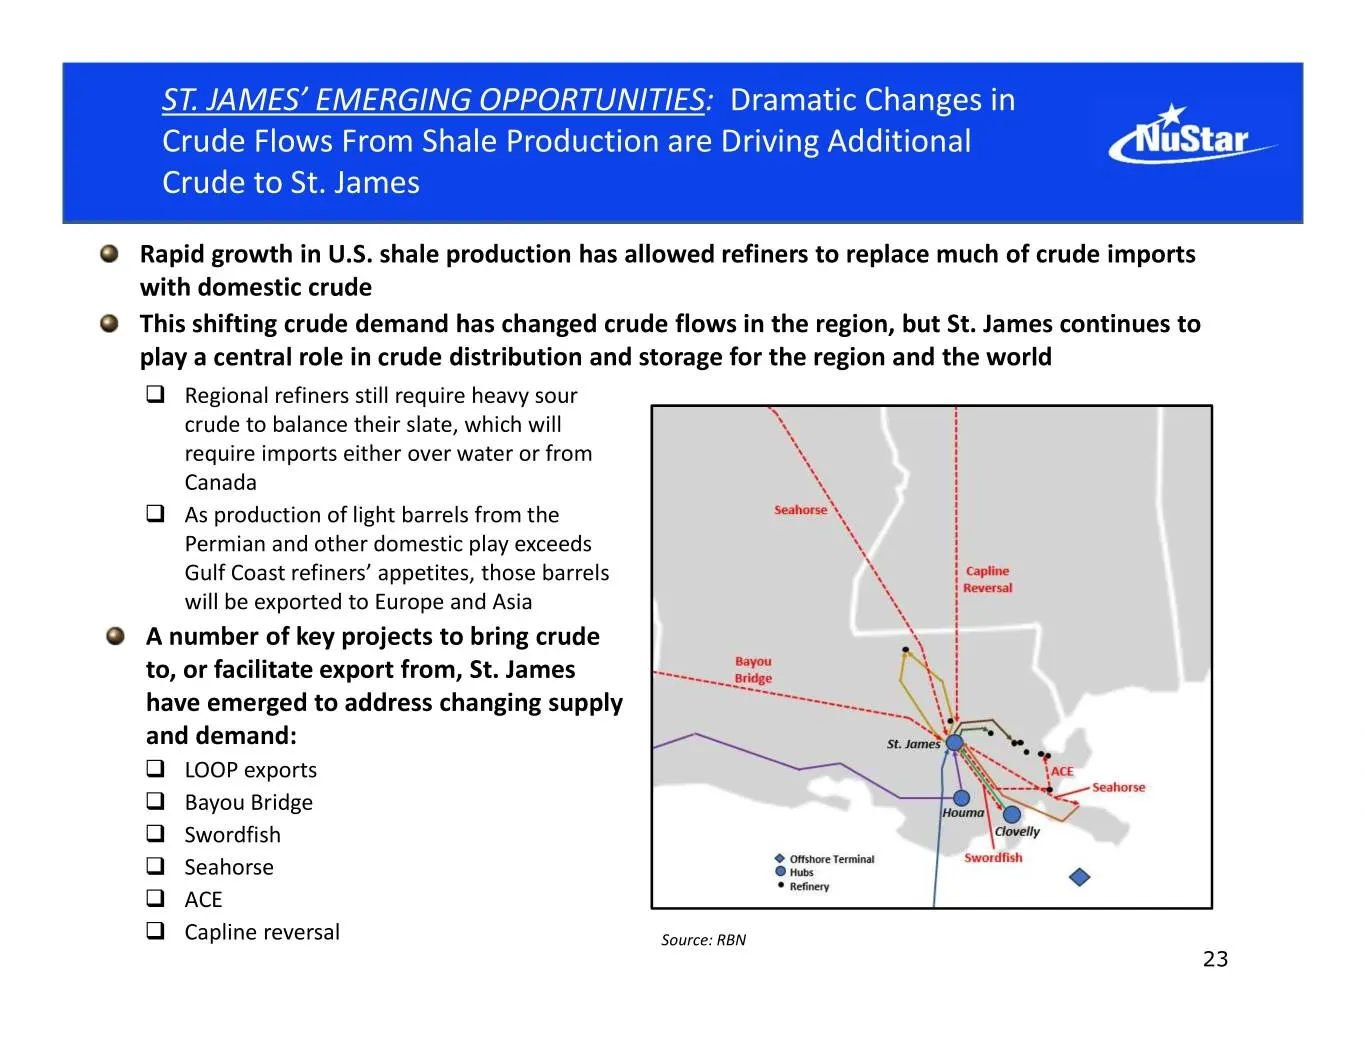
Slide 23: Changes in Crude Flows Driving Additional Crude to St. James
ST. JAMES’ EMERGING OPPORTUNITIES: Dramatic Changes in Crude Flows From Shale Production are Driving Additional Crude to St. James Rapid growth in U.S. shale production has allowed refiners to replace much of crude imports with domestic crude This shifting crude demand has changed crude flows in the
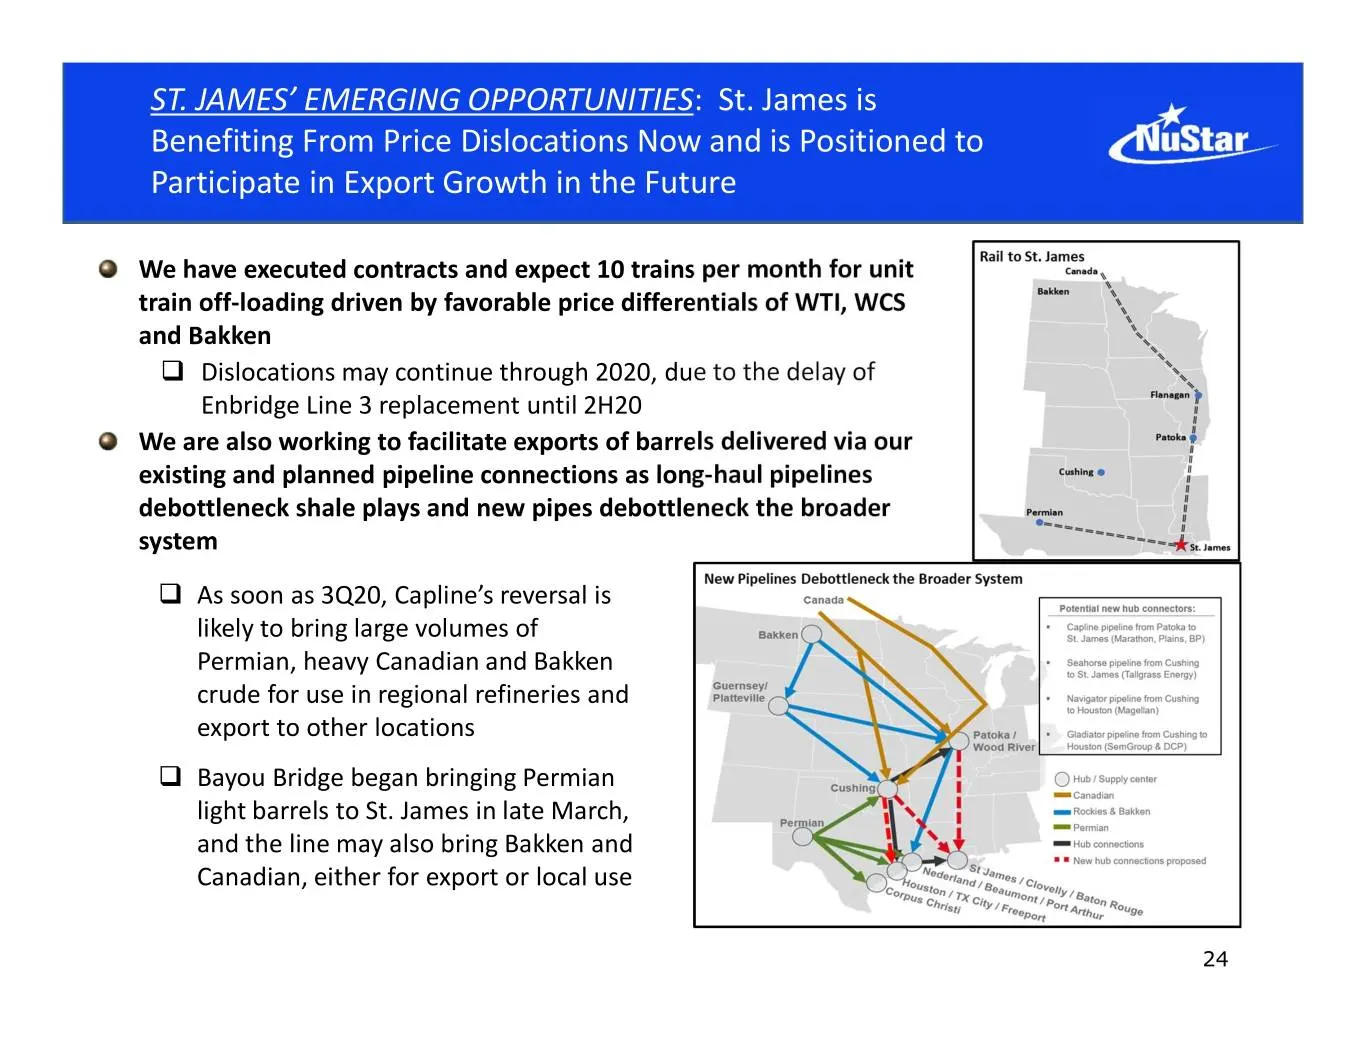
Slide 24: St. James Benefiting From Price Dislocations and Export Growth
ST. JAMES’ EMERGING OPPORTUNITIES: St. James is Benefiting From Price Dislocations Now and is Positioned to Participate in Export Growth in the Future We have executed contracts and expect 10 trains per month for unit train off-loading driven by favorable price differentials of WTI, WCS and Bakken
Slide 25: Optimizing Our Legacy Assets
OptimizingThe Permian Basin: OurPhenomenal Legacy Growth Assets Driving Midstream Opportunities
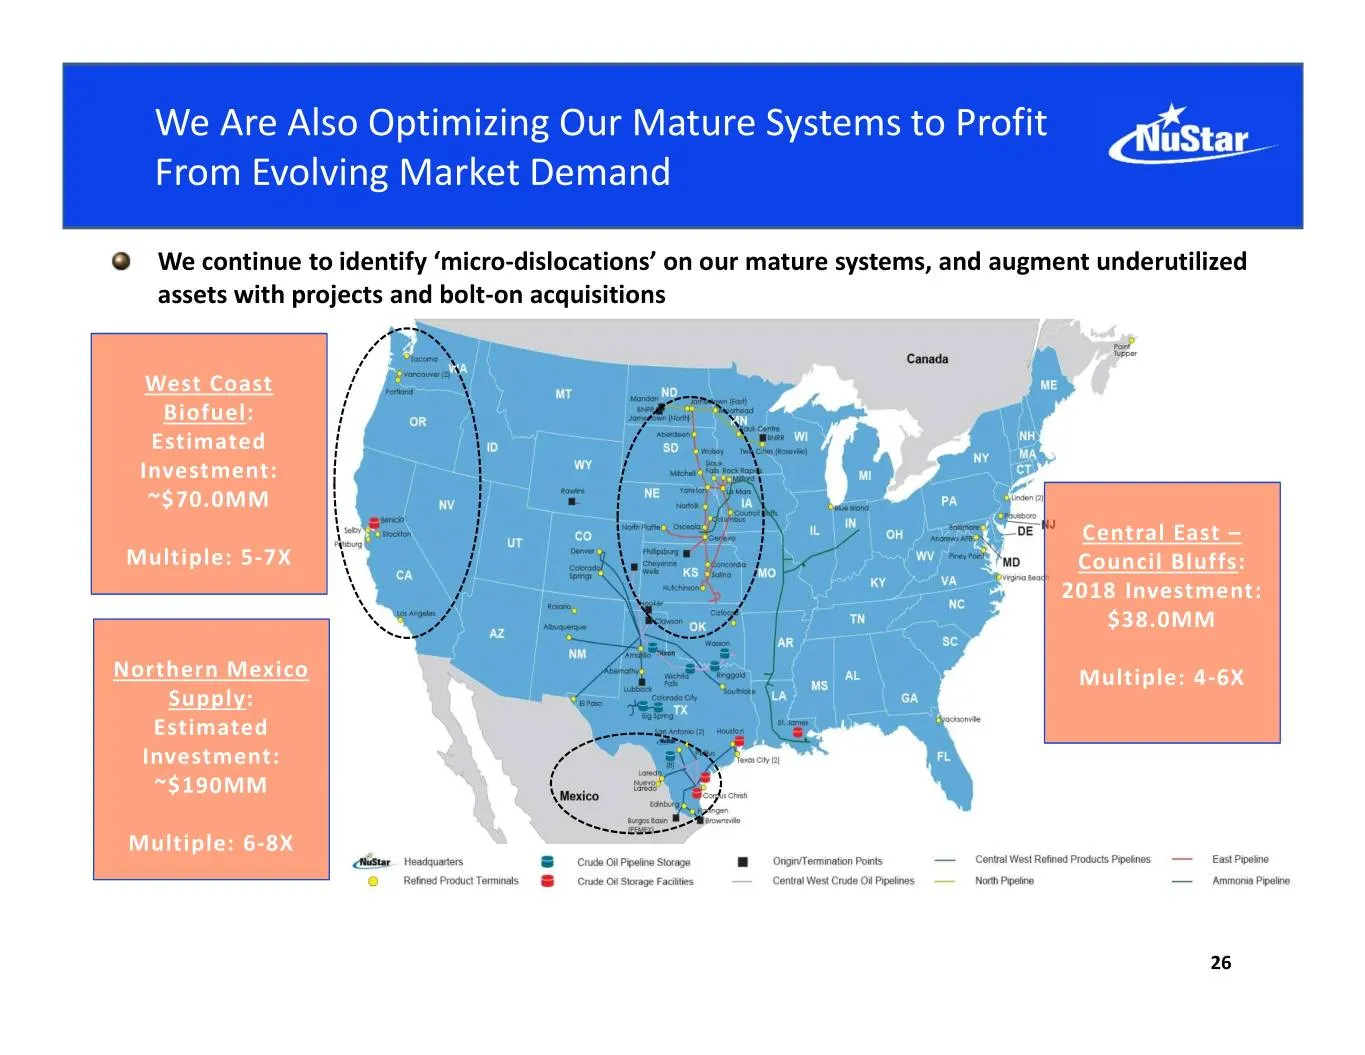
Slide 26: Optimizing Our Mature Systems to Profit From Market Demand
We Are Also Optimizing Our Mature Systems to Profit From Evolving Market Demand We continue to identify ‘micro-dislocations’ on our mature systems, and augment underutilized assets with projects and bolt-on acquisitions West Coast Biofuel: Estimated Investment: ~$70.0MM Central East – Multiple: 5-7X
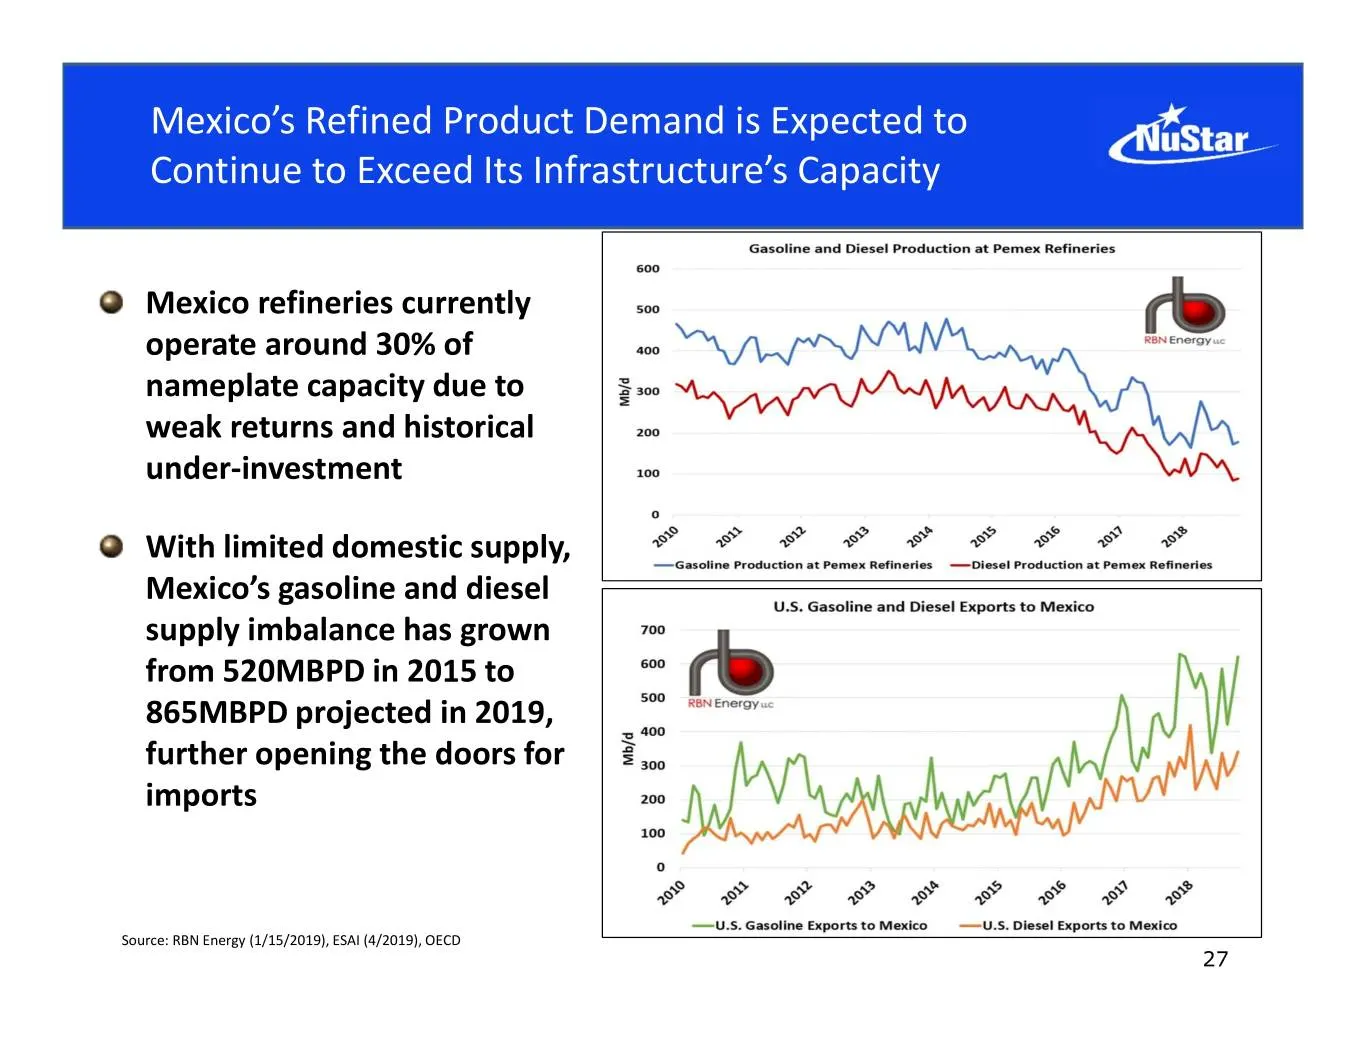
Slide 27: Mexico's Refined Product Demand Expected to Exceed Infrastructure Capacity
Mexico’s Refined Product Demand is Expected to Continue to Exceed Its Infrastructure’s Capacity Mexico refineries currently operate around 30% of nameplate capacity due to weak returns and historical under-investment With limited domestic supply, Mexico’s gasoline and diesel supply imbalance has gro
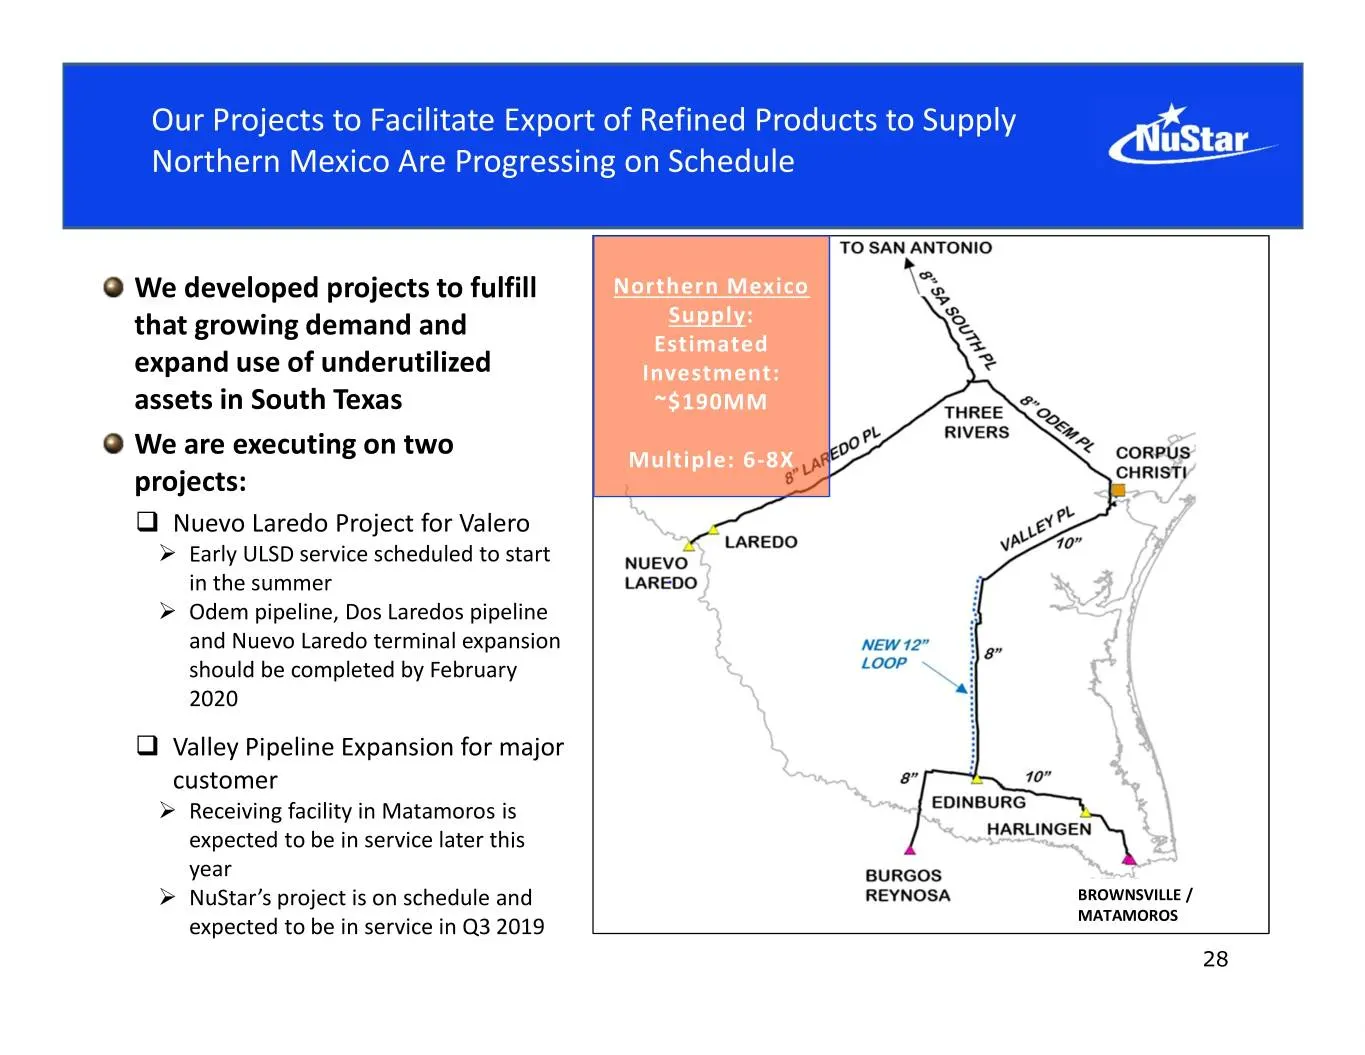
Slide 28: Projects to Supply Northern Mexico Progressing on Schedule
Our Projects to Facilitate Export of Refined Products to Supply Northern Mexico Are Progressing on Schedule We developed projects to fulfill Northern Mexico that growing demand and Supply: Estimated expand use of underutilized Investment: assets in South Texas ~$190MM We are executing on two Multipl
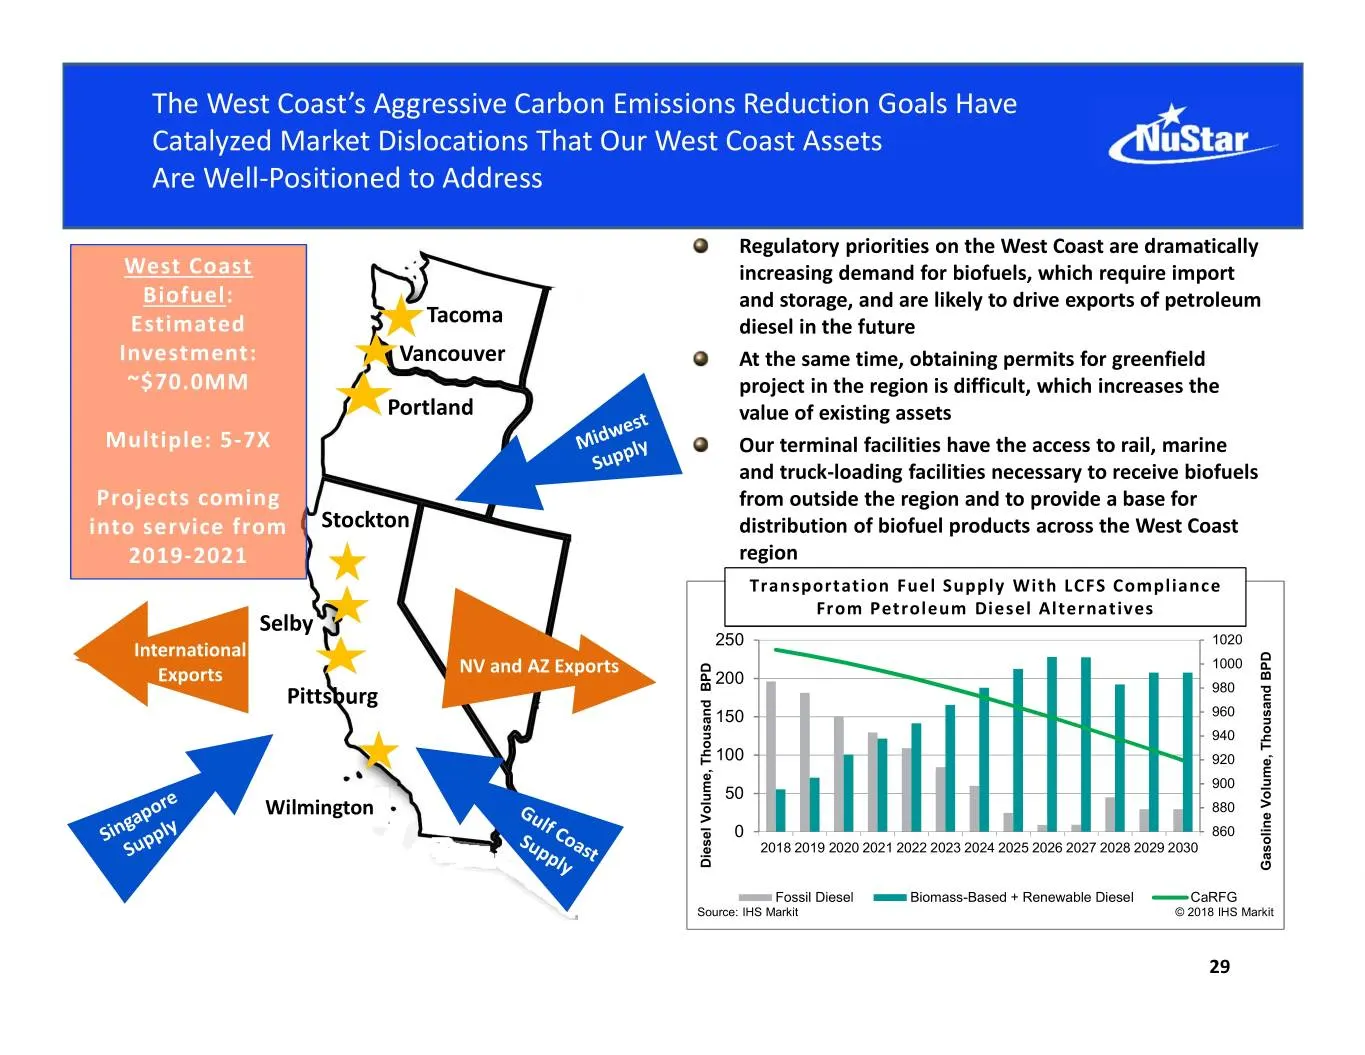
Slide 29: West Coast Carbon Reduction Goals Catalyzed Market Dislocations
The West Coast’s Aggressive Carbon Emissions Reduction Goals Have Catalyzed Market Dislocations That Our West Coast Assets Are Well-Positioned to Address Regulatory priorities on the West Coast are dramatically West Coast increasing demand for biofuels, which require import Biofuel: and storage, and
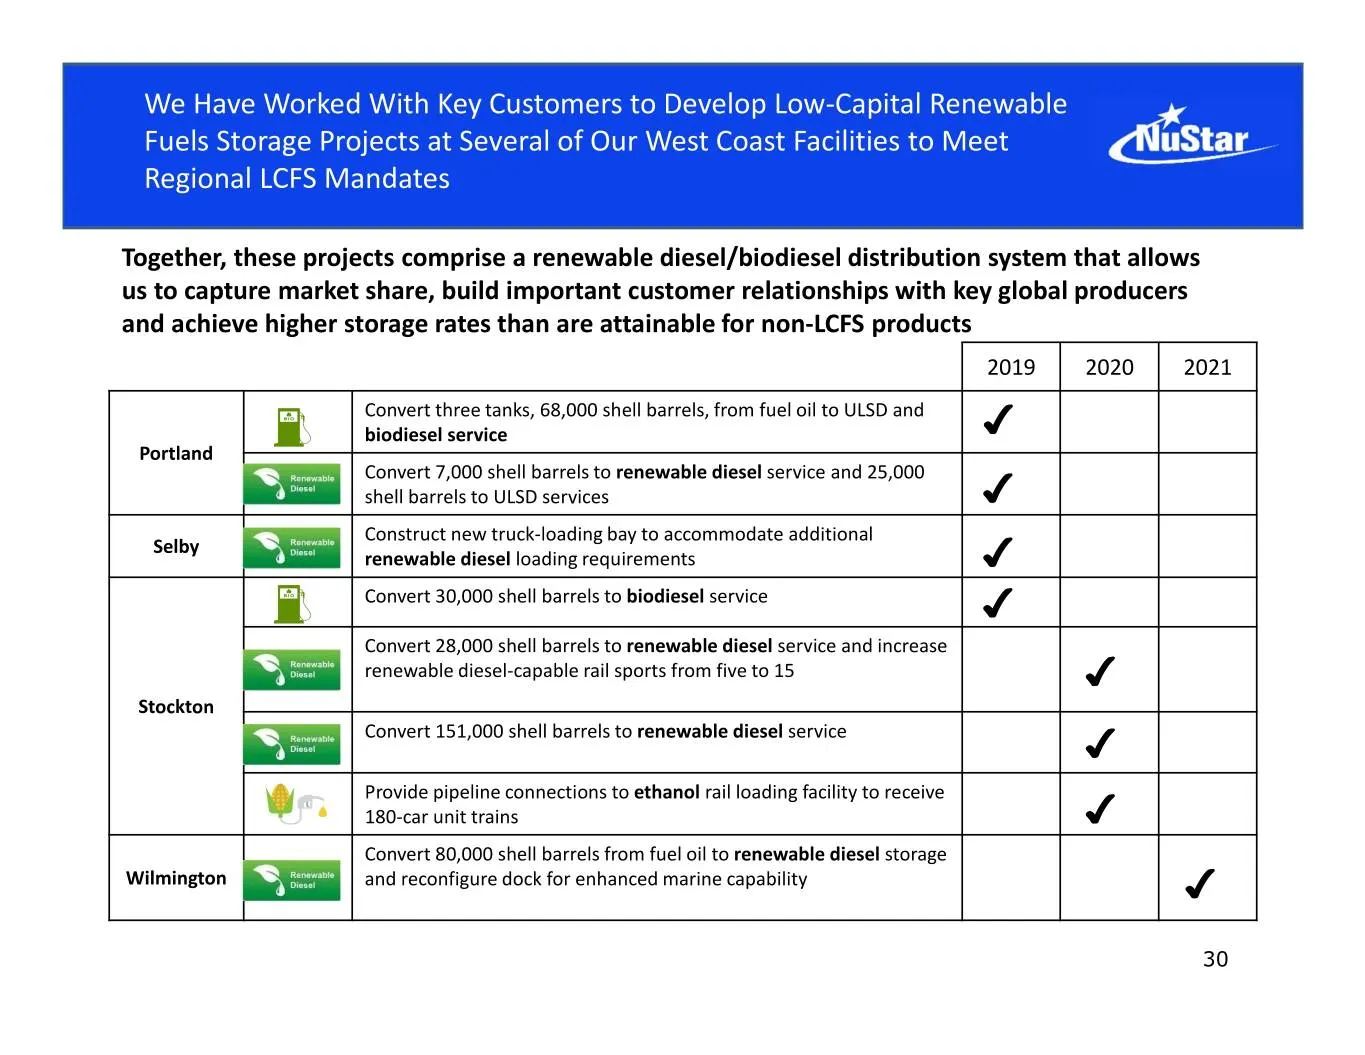
Slide 30: Low-Capital Renewable Fuels Storage Projects on West Coast
We Have Worked With Key Customers to Develop Low-Capital Renewable Fuels Storage Projects at Several of Our West Coast Facilities to Meet Regional LCFS Mandates Together, these projects comprise a renewable diesel/biodiesel distribution system that allows us to capture market share, build important
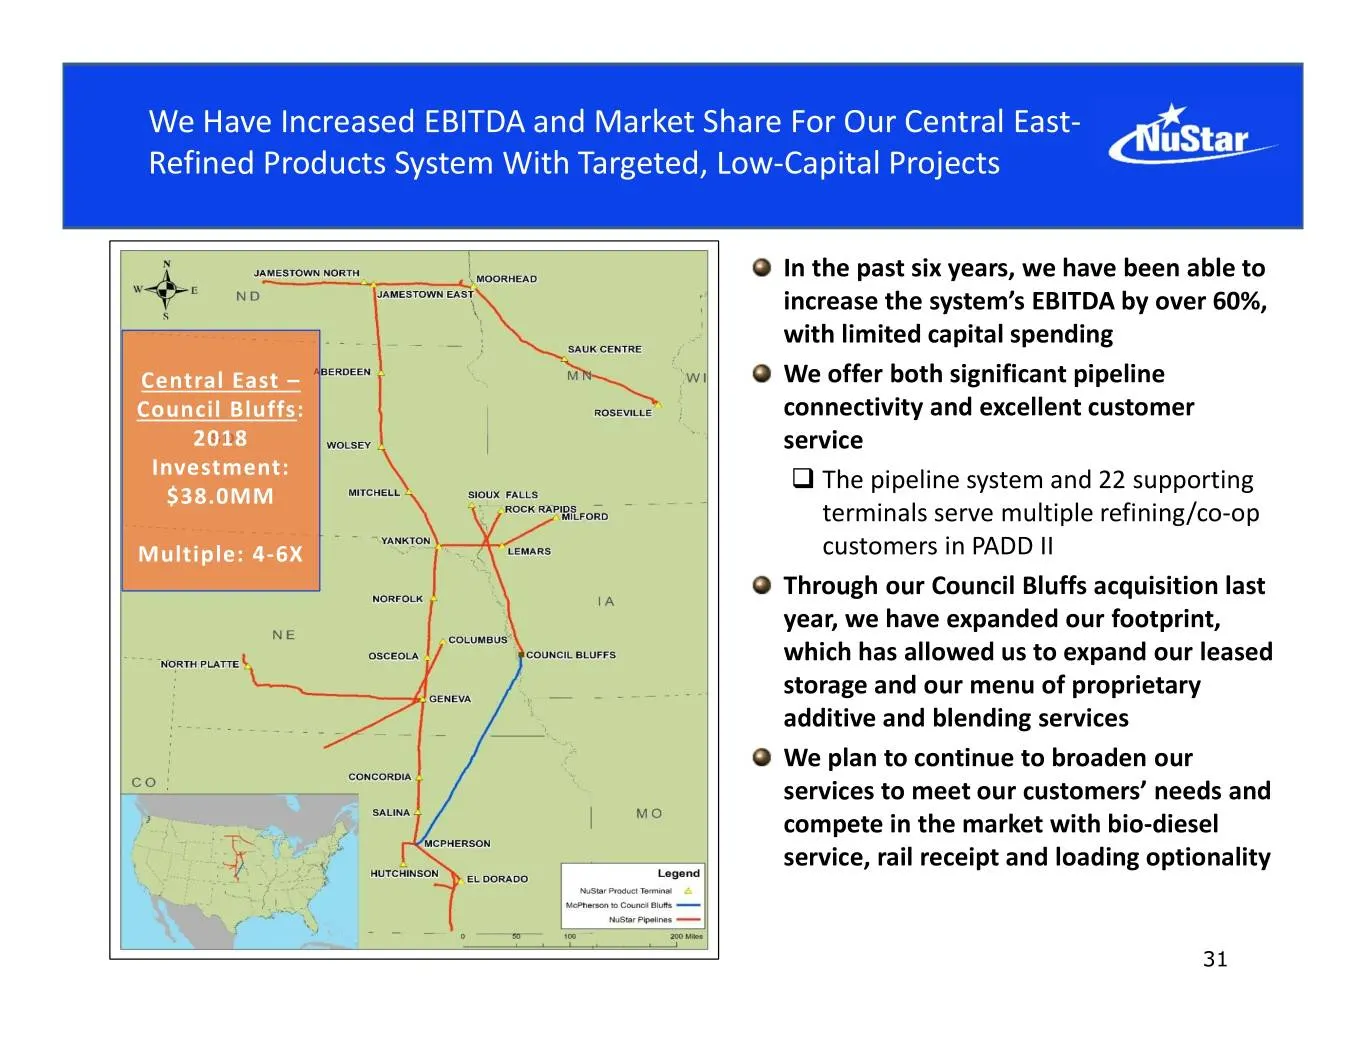
Slide 31: Increased EBITDA and Market Share for Central East System
We Have Increased EBITDA and Market Share For Our Central East- Refined Products System With Targeted, Low-Capital Projects In the past six years, we have been able to increase the system’s EBITDA by over 60%, with limited capital spending Central East – We offer both significant pipeline Council Bl
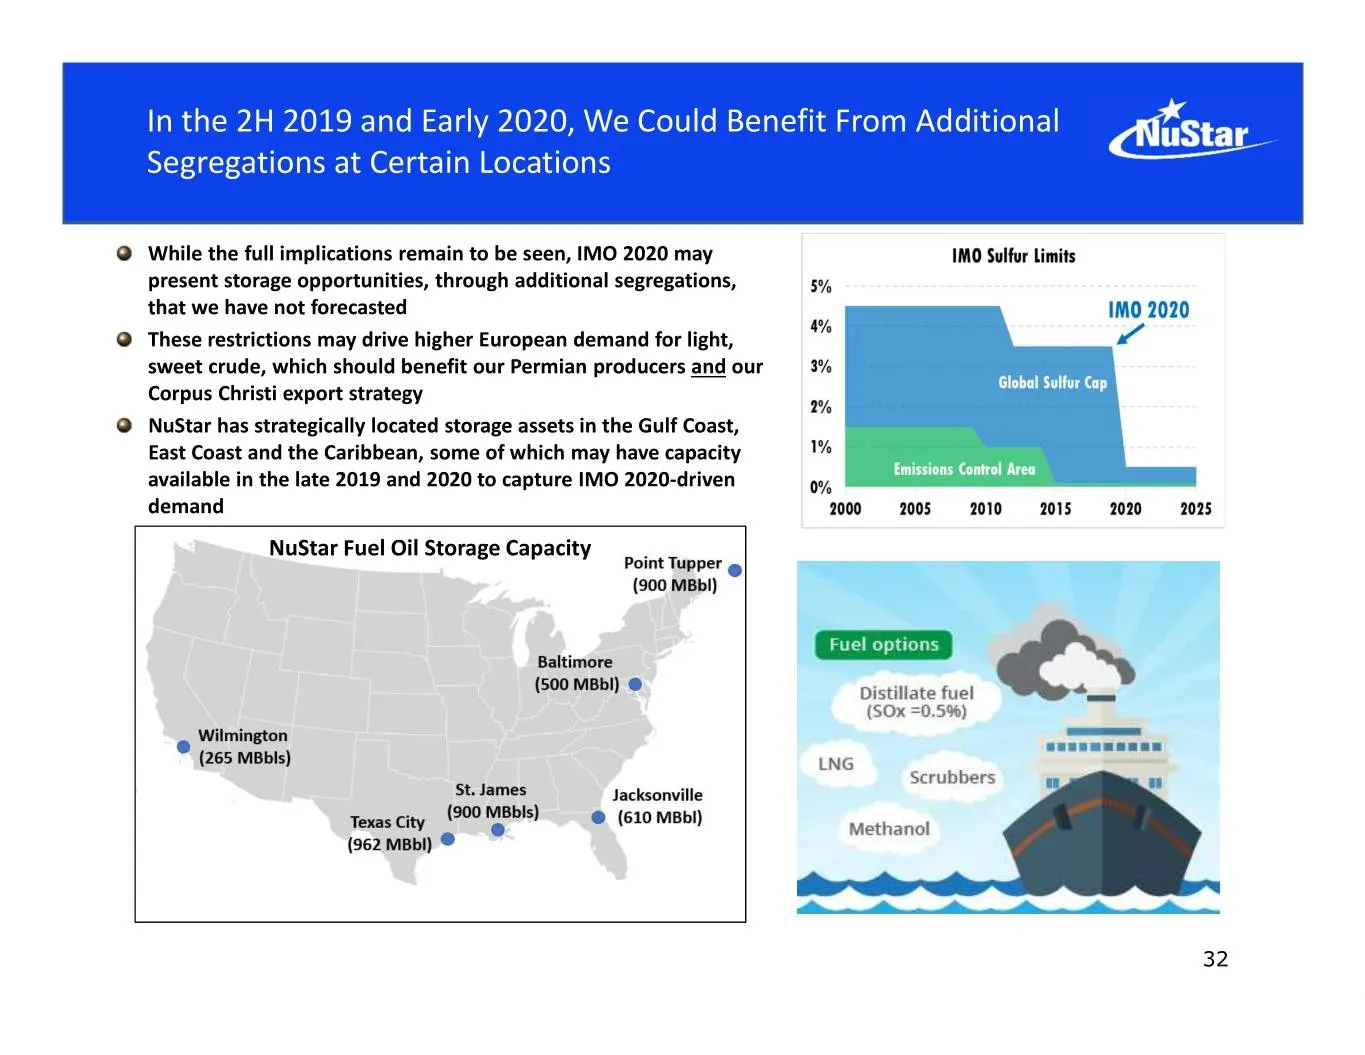
Slide 32: 2H 2019 and Early 2020 Benefit From Additional Segregations (IMO 2020)
In the 2H 2019 and Early 2020, We Could Benefit From Additional Segregations at Certain Locations While the full implications remain to be seen, IMO 2020 may present storage opportunities, through additional segregations, that we have not forecasted These restrictions may drive higher European deman
Slide 33: Good Corporate Citizenship Foundation of NuStar's Culture
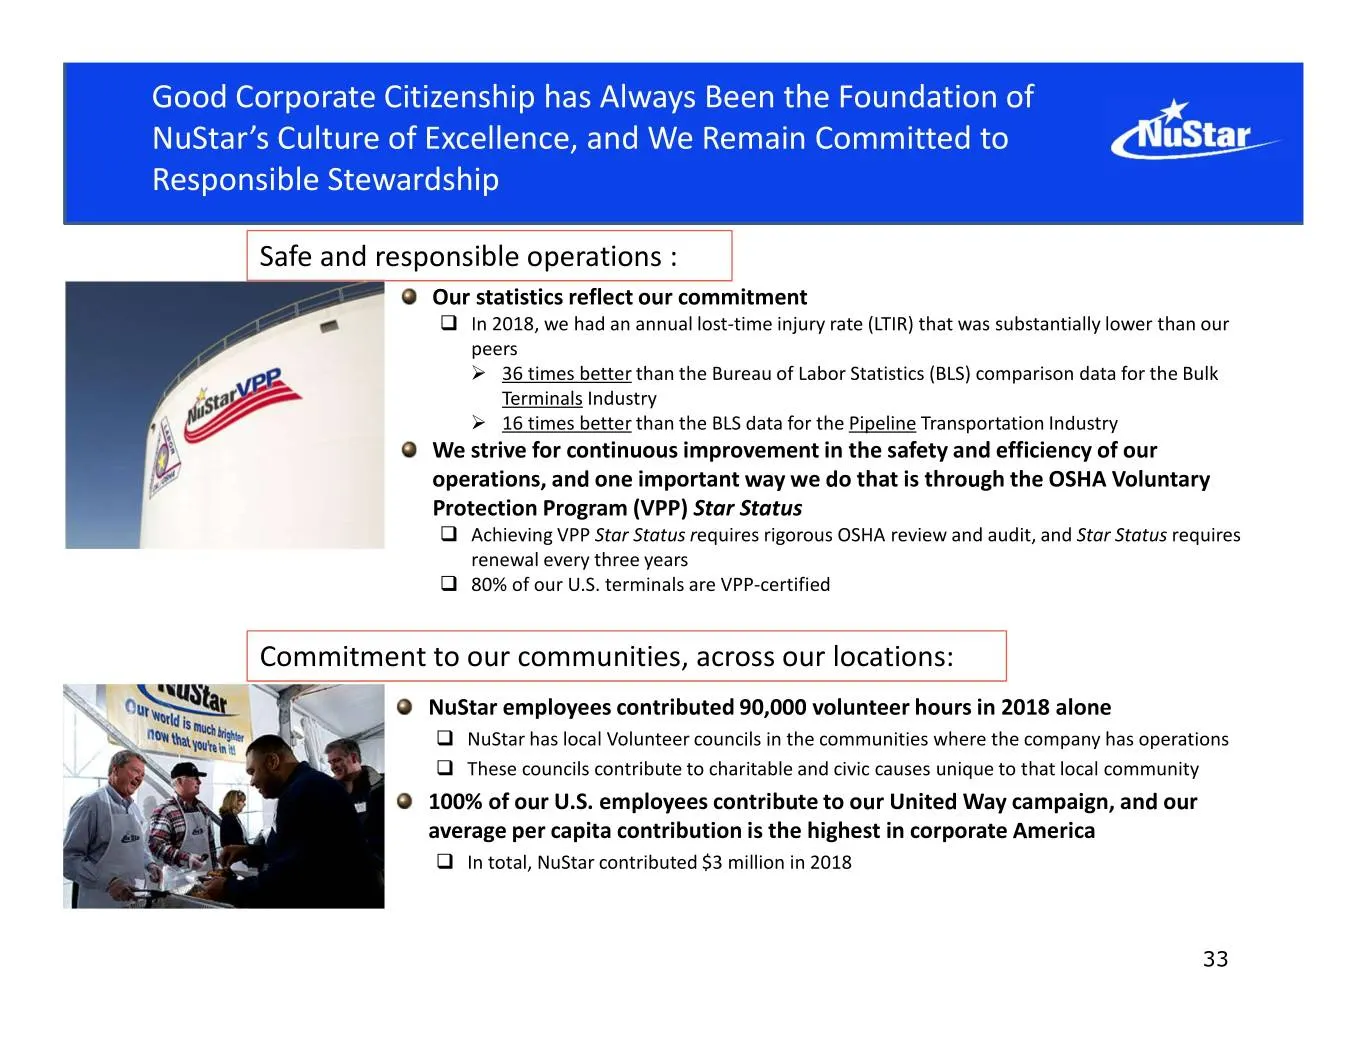
Good Corporate Citizenship has Always Been the Foundation of NuStar’s Culture of Excellence, and We Remain Committed to Responsible Stewardship Safe and responsible operations : Our statistics reflect our commitment In 2018, we had an annual lost-time injury rate (LTIR) that was substantially lowe
Slide 34: Continued Improvement: Our 2019 Plan
Continued Improvement: ContinuedOur 2019 Plan Improvement: Our 2019 Plan
Slide 35: 2019 Focus on Discipline, Execution and Continued Improvement
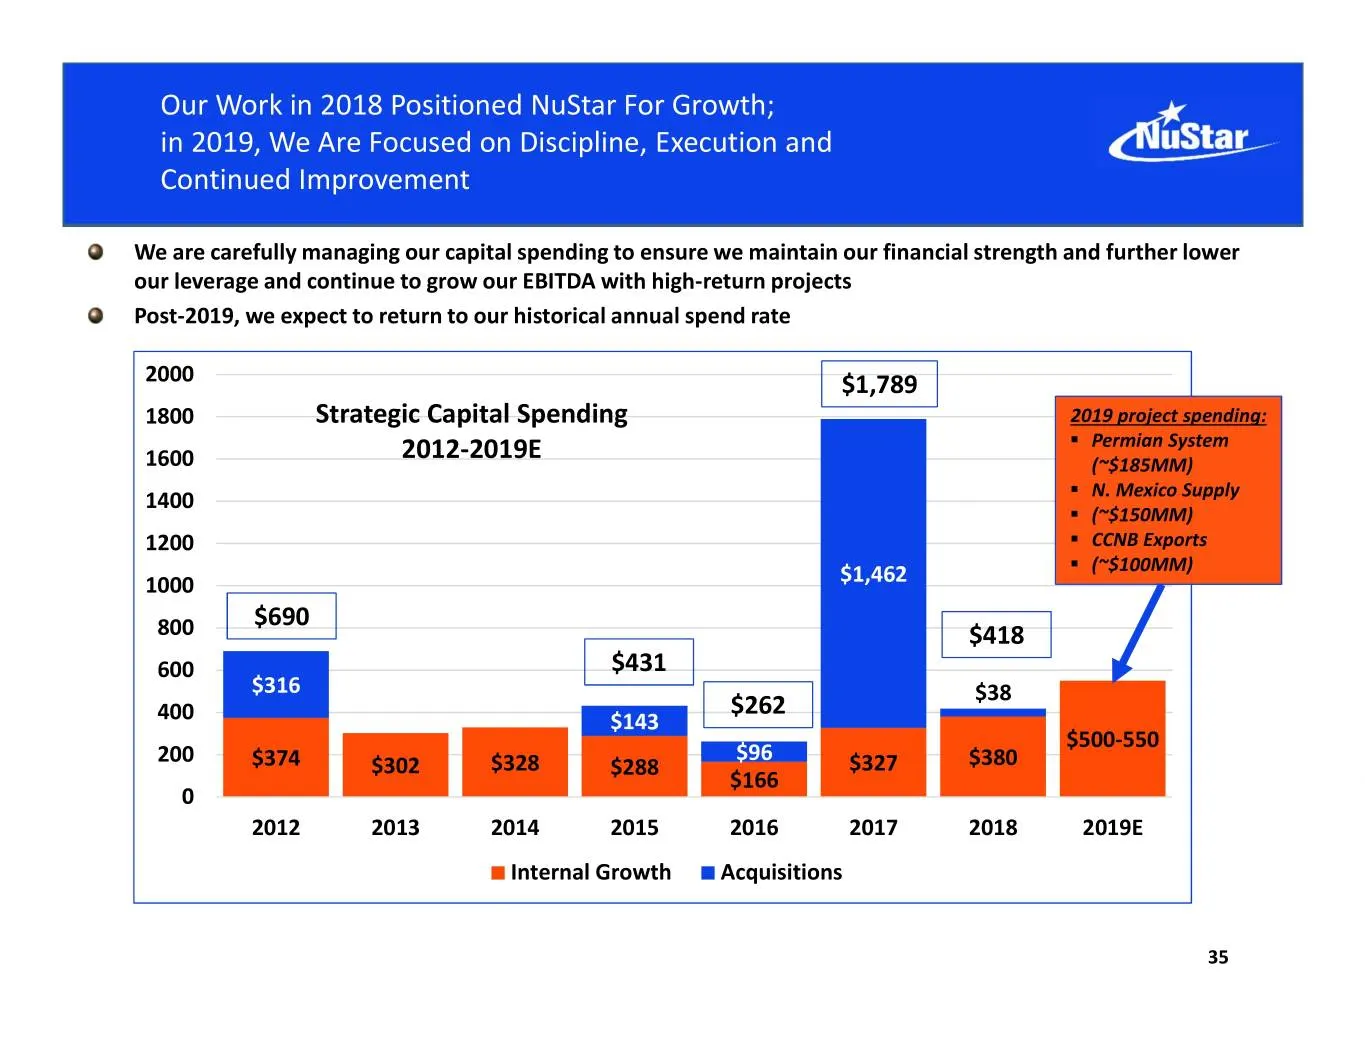
Our Work in 2018 Positioned NuStar For Growth; in 2019, We Are Focused on Discipline, Execution and Continued Improvement We are carefully managing our capital spending to ensure we maintain our financial strength and further lower our leverage and continue to grow our EBITDA with high-return projec
Slide 36: Selling St. Eustatius Facility to Lower Debt Metrics
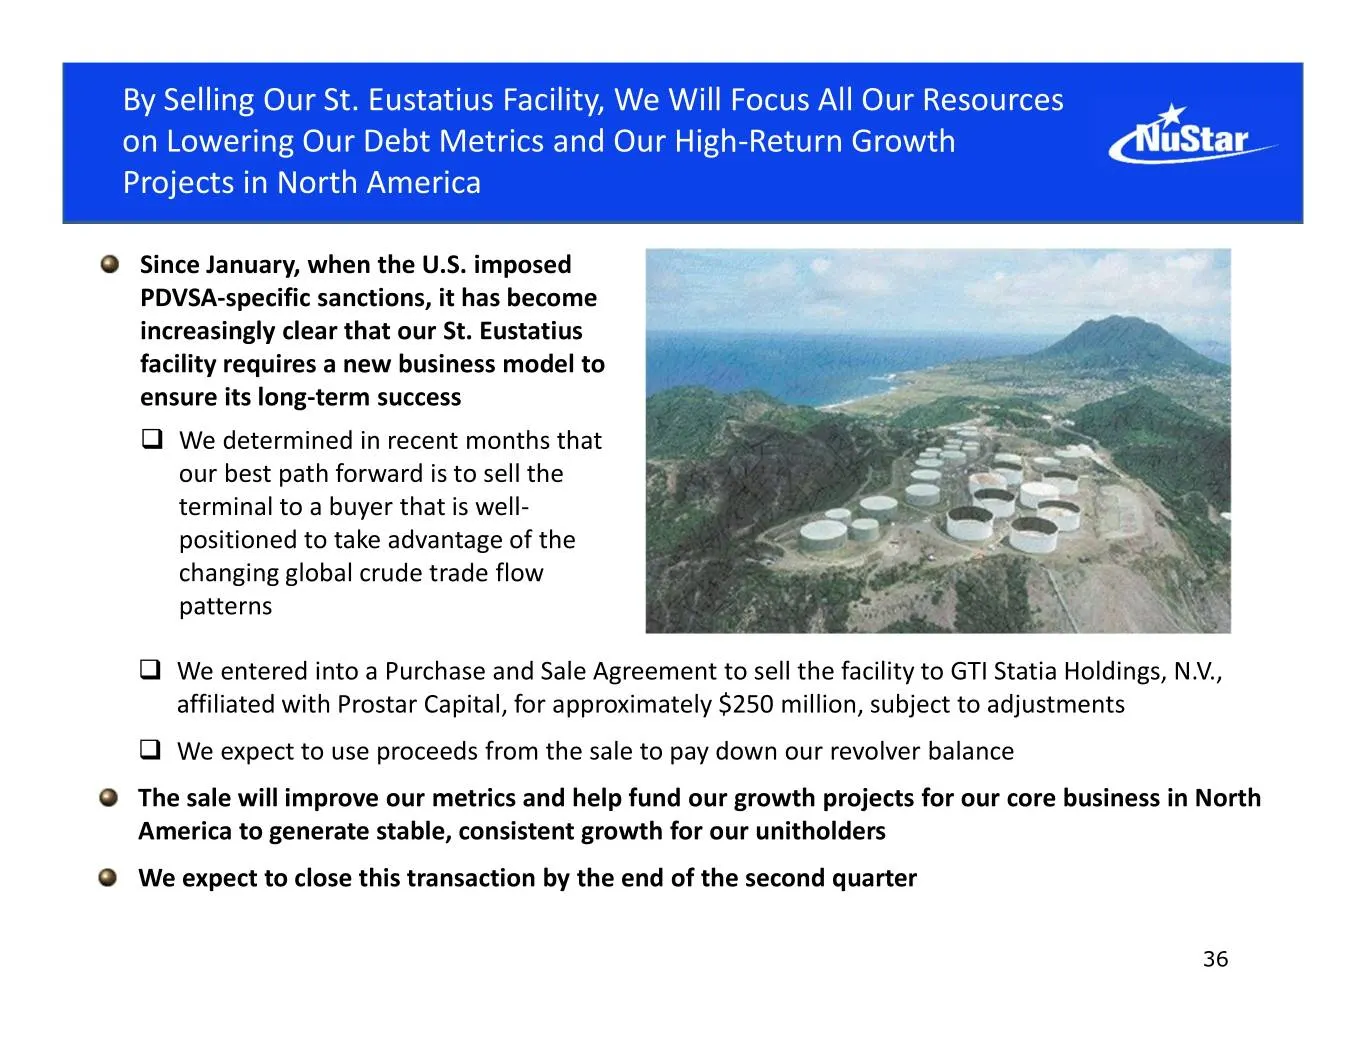
By Selling Our St. Eustatius Facility, We Will Focus All Our Resources on Lowering Our Debt Metrics and Our High-Return Growth Projects in North America Since January, when the U.S. imposed PDVSA-specific sanctions, it has become increasingly clear that our St. Eustatius facility requires a new busi
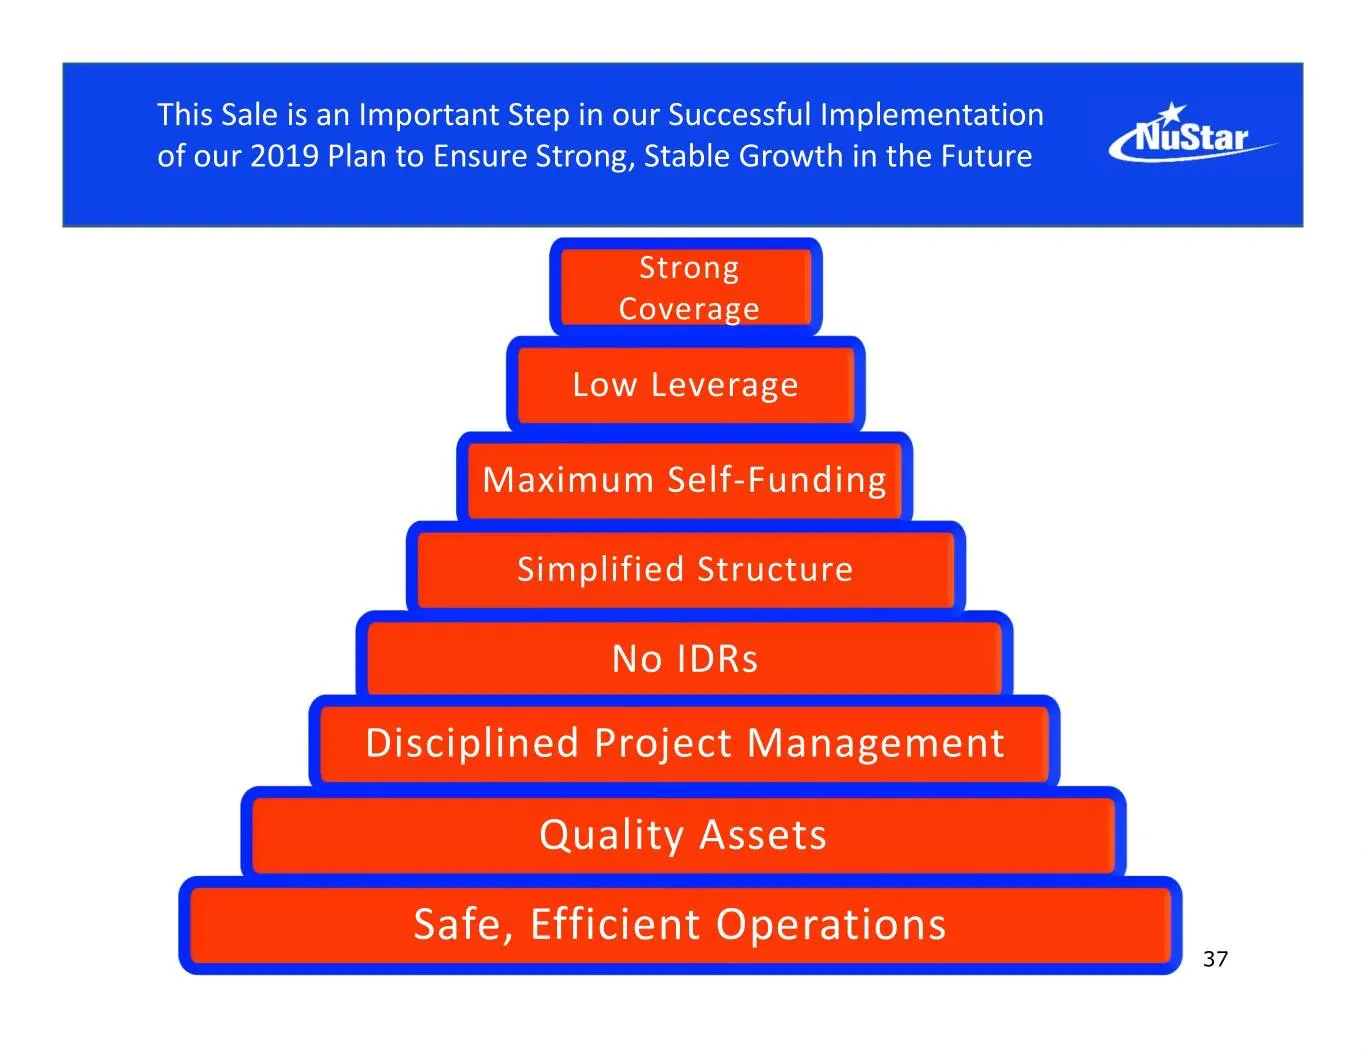
Slide 37: Sale is an Important Step in Successful Implementation of 2019 Plan
This Sale is an Important Step in our Successful Implementation of our 2019 Plan to Ensure Strong, Stable Growth in the Future Strong Coverage Low Leverage Maximum Self-Funding Simplified Structure No IDRs Disciplined Project Management Quality Assets Safe, Efficient Operations 37
Slide 38: Appendix
Appendix
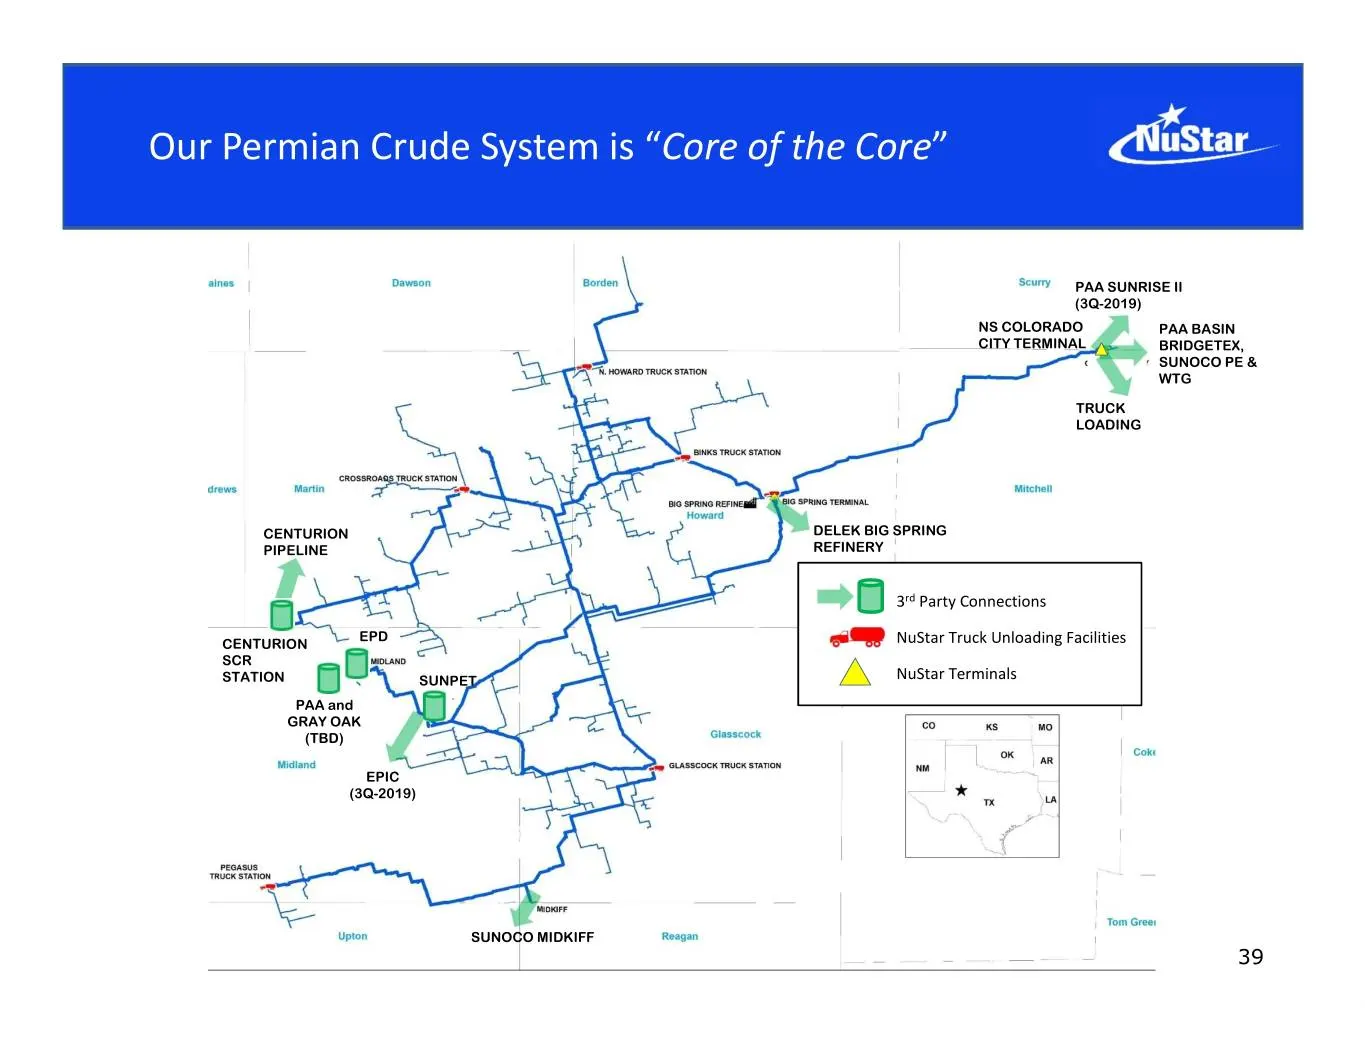
Slide 39: Our Permian Crude System is Core of the Core
Our Permian Crude System is “Core of the Core” PAA SUNRISE II (3Q-2019) NS COLORADO PAA BASIN CITY TERMINAL BRIDGETEX, SUNOCO PE & WTG TRUCK LOADING CENTURION DELEK BIG SPRING PIPELINE REFINERY 3rd Party Connections EPD CENTURION NuStar Truck Unloading Facilities SCR STATION SUNPET NuStar Terminals
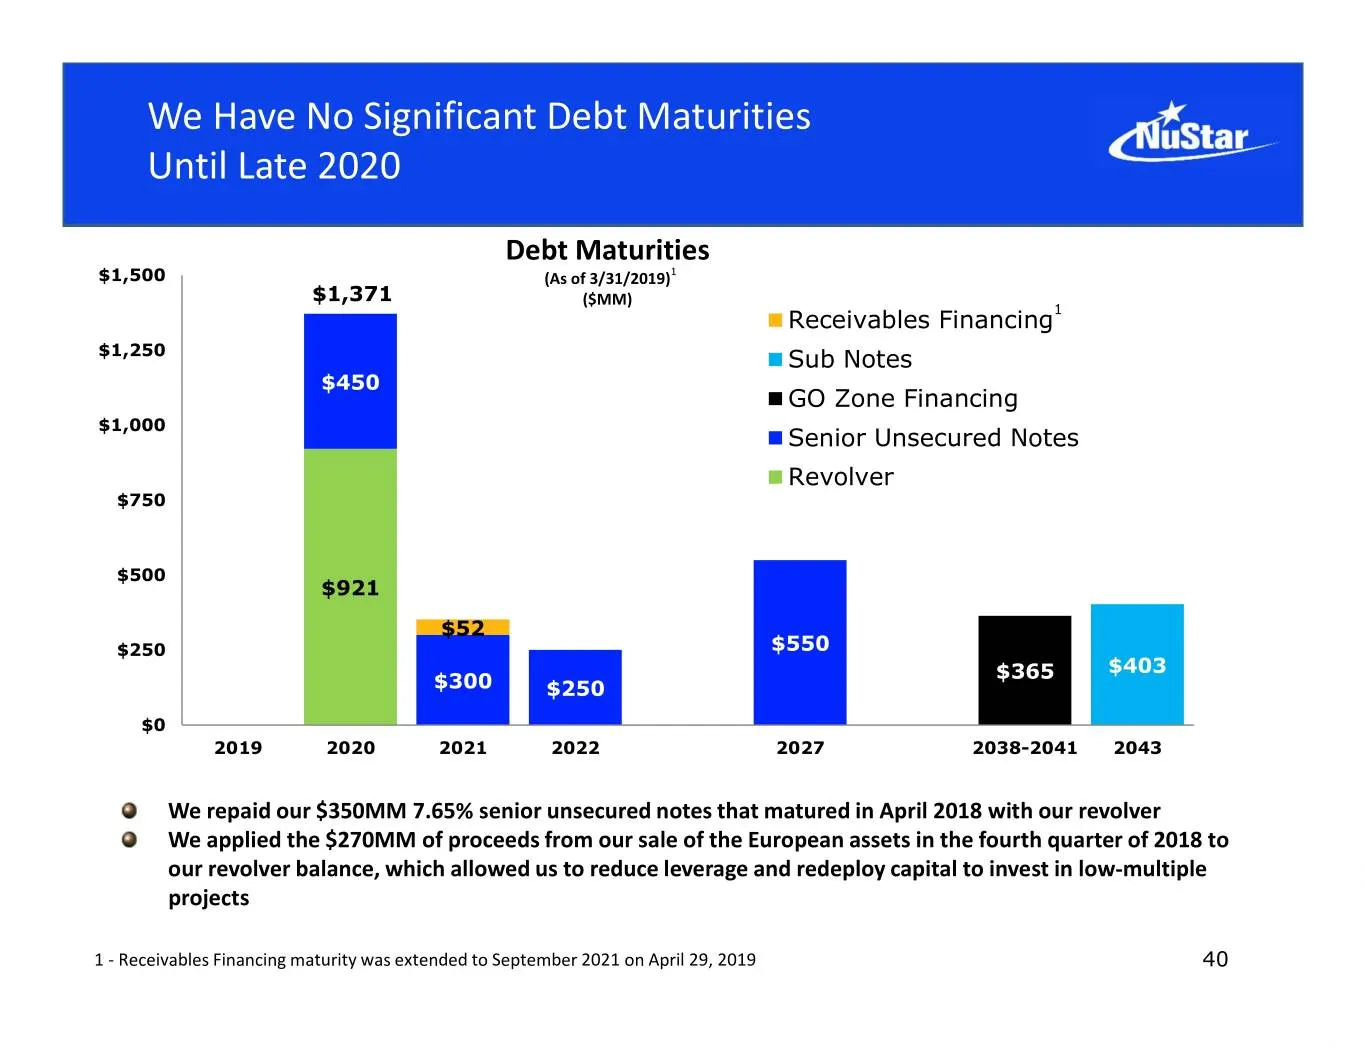
Slide 40: No Significant Debt Maturities Until Late 2020
We Have No Significant Debt Maturities Until Late 2020 Debt Maturities $1,500 (As of 3/31/2019)1 $1,371 ($MM) Receivables Financing1 $1,250 Sub Notes $450 GO Zone Financing $1,000 Senior Unsecured Notes Revolver $750 $500 $921 $52 $250 $550 $365 $403 $300 $250 $0 2019 2020 2021 2022 2027 2038-2041 2
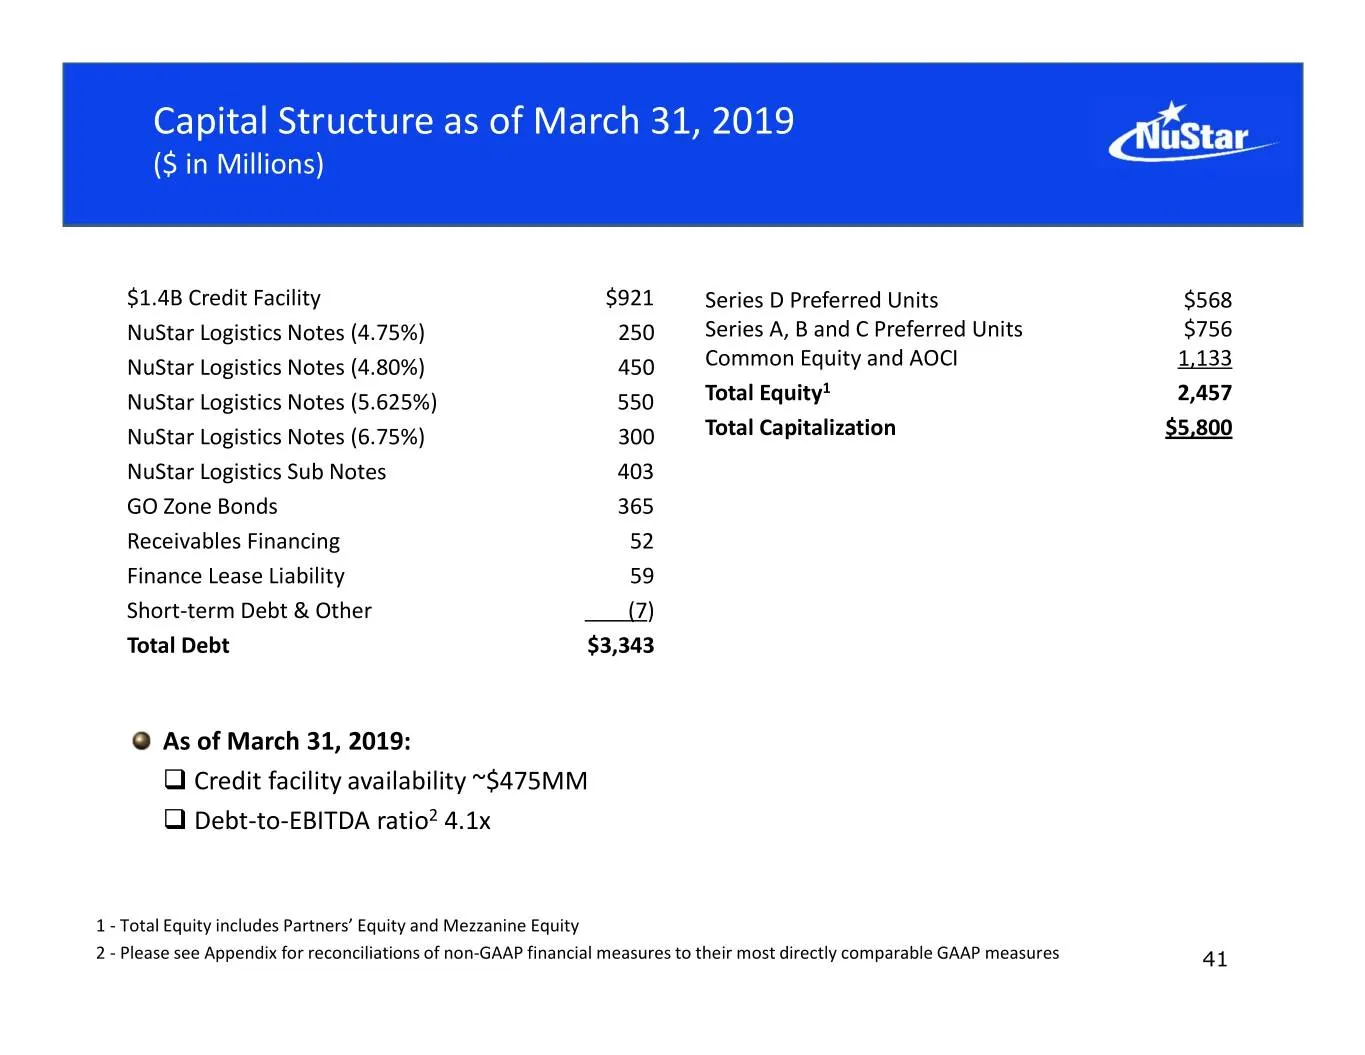
Slide 41: Capital Structure as of March 31, 2019
Capital Structure as of March 31, 2019 ($ in Millions) $1.4B Credit Facility $921 Series D Preferred Units $568 NuStar Logistics Notes (4.75%) 250 Series A, B and C Preferred Units $756 NuStar Logistics Notes (4.80%) 450 Common Equity and AOCI 1,133 1 NuStar Logistics Notes (5.625%) 550 Total Equity
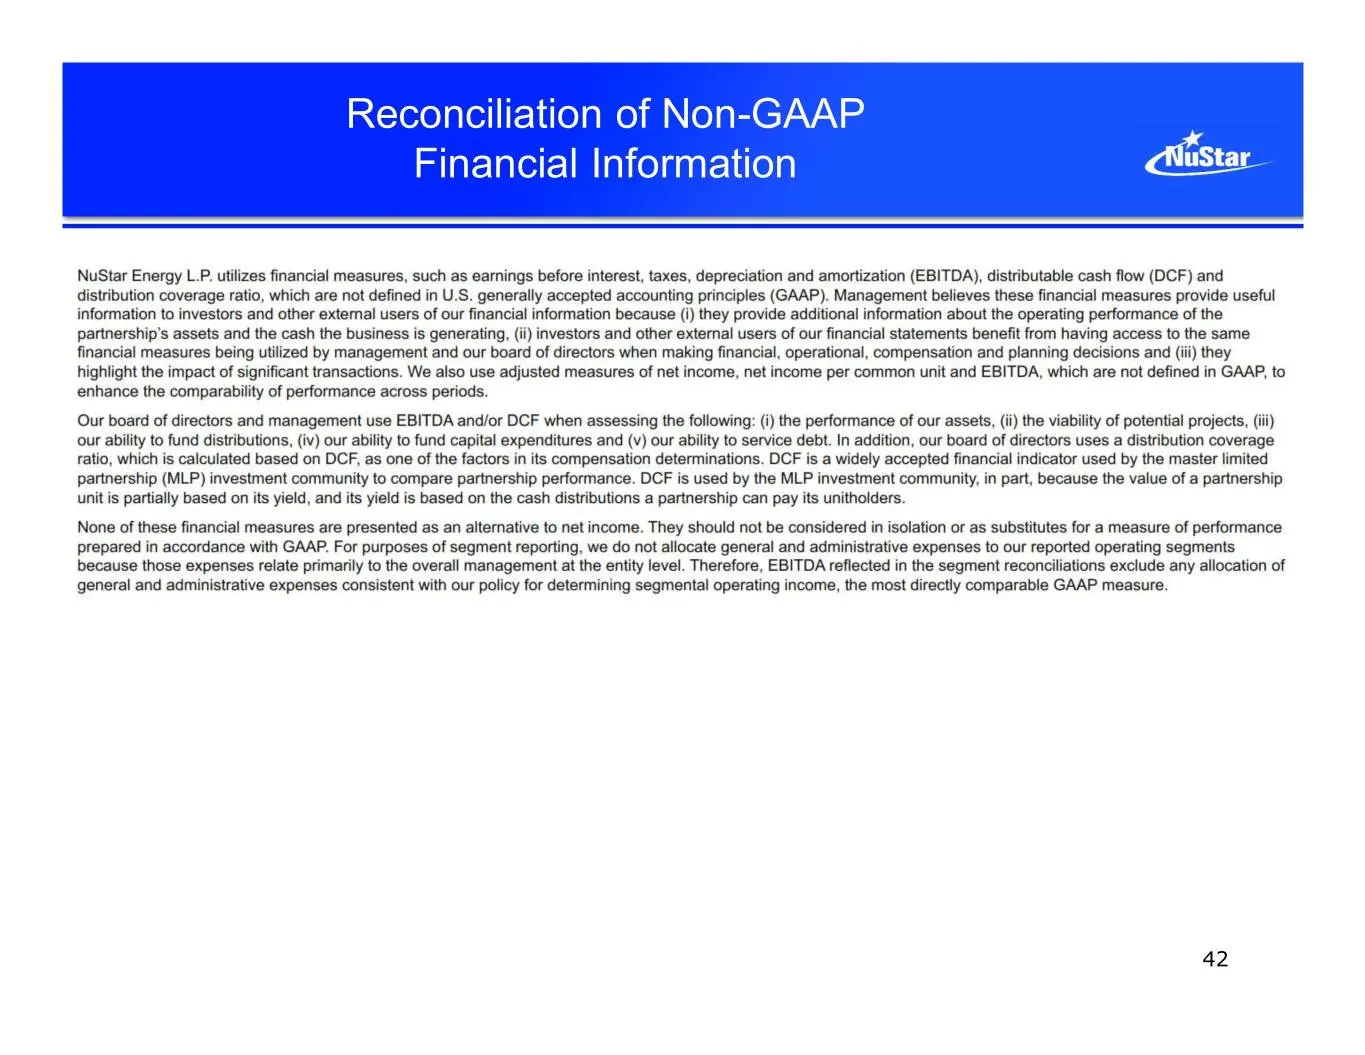
Slide 42: Reconciliation of Non-GAAP Financial Information
Reconciliation of Non-GAAP Financial Information 42
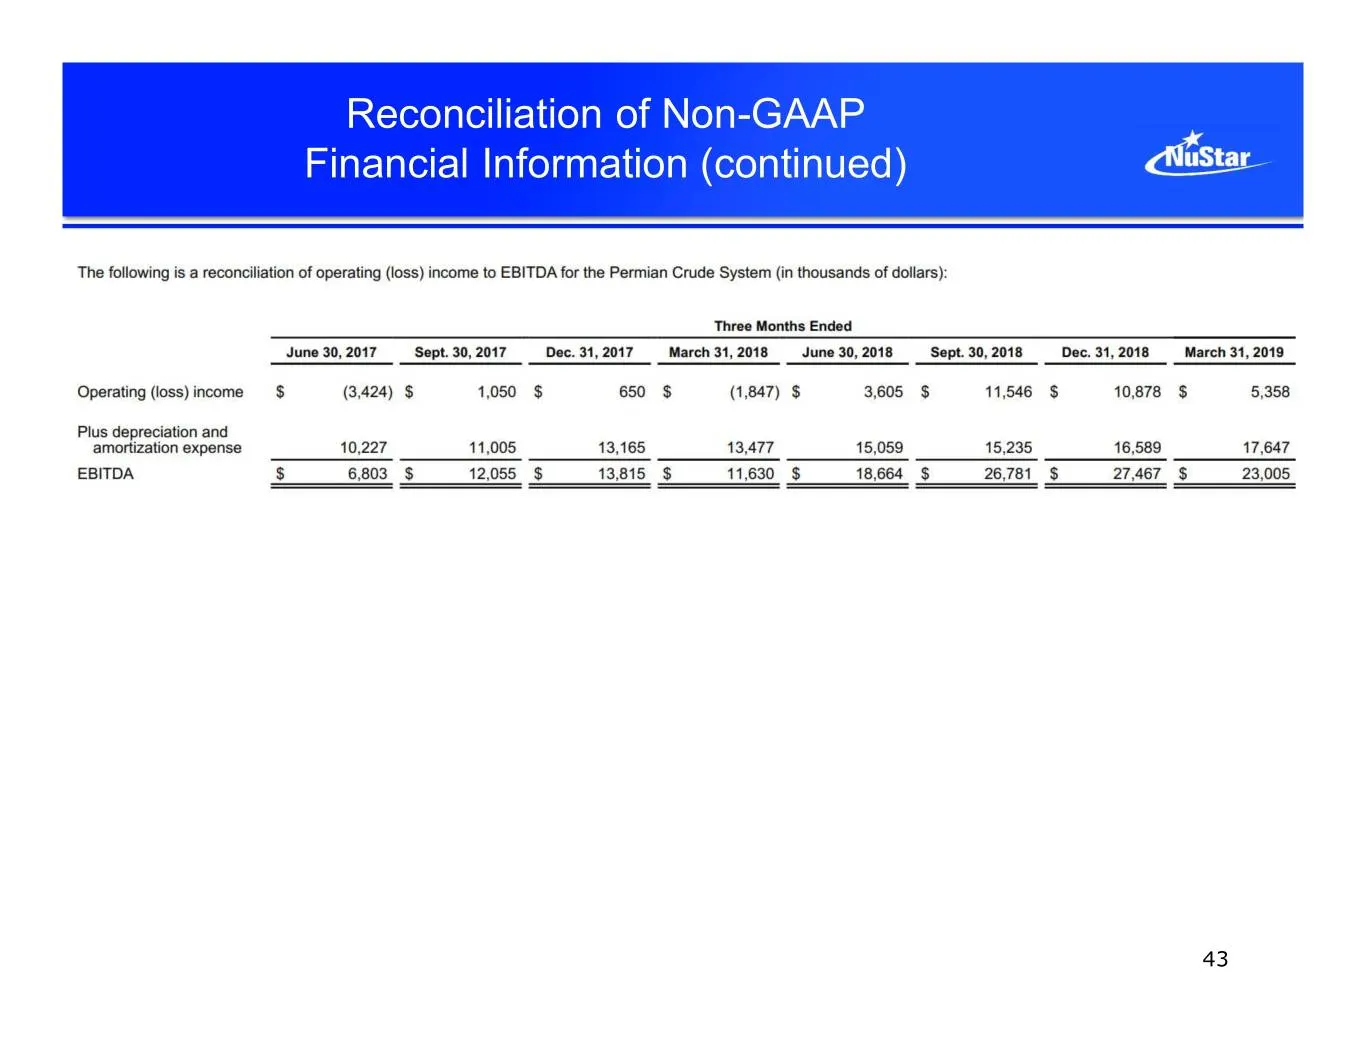
Slide 43: Reconciliation of Non-GAAP Financial Information (continued)
Reconciliation of Non-GAAP Financial Information (continued) 43
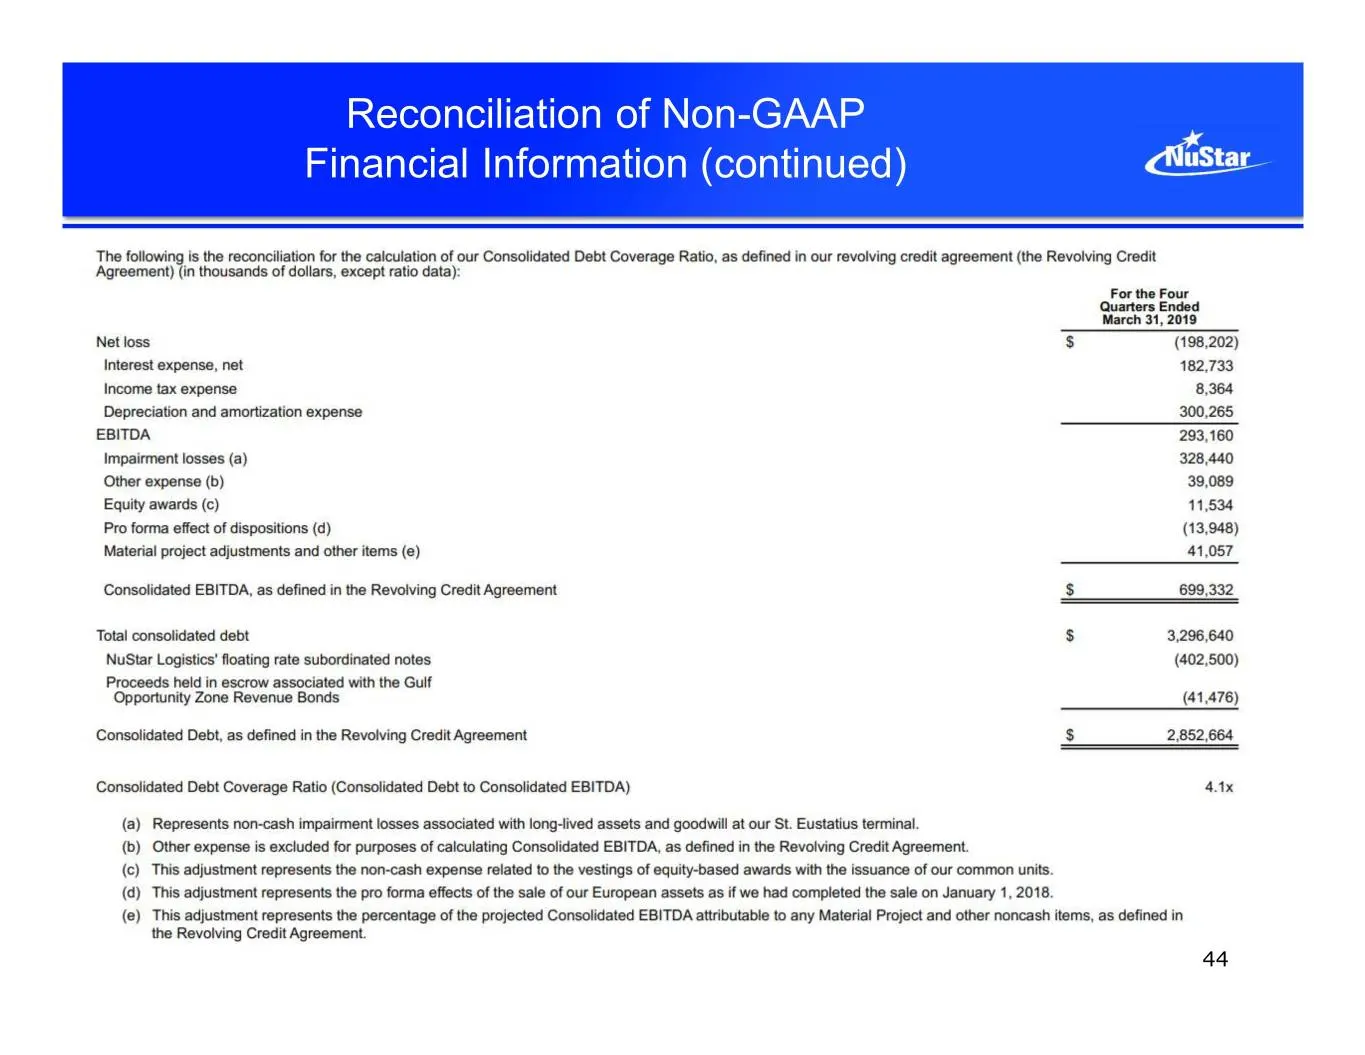
Slide 44: Reconciliation of Non-GAAP Financial Information (continued)
Reconciliation of Non-GAAP Financial Information (continued) 44
Source: SEC EDGAR · 8-K filed May 15, 2019
More decks from NuStar Energy LP
 Merger or Acquisition (January 2024)14 slides · Jan 22, 2024
 Investor Presentation (December 2023)35 slides · Dec 5, 2023
 Raymond James Virtual Energy Supply Chain Conference 2023; Pickering Energy Partners TE&MF36 slides · Sep 19, 2023
 Barclays CEO Energy-Power Conference 202336 slides · Sep 6, 2023
 Citi One-on-One Midstream/Energy Infrastructure Conference 202336 slides · Aug 22, 2023
 8th Annual J.P. Morgan Energy, Power & Renewables Conference 202336 slides · Jun 21, 2023