ION Acquisition Corp 2 — Innovid — Investor Day (November 2023)
74 slides from ION Acquisition Corp 2's investor day presentation, Nov 30, 2023
Slide 1: Investor Day November 2023
INNOVLO ee INVESTOR DAY November 2023
Slide 2: Disclaimers: Forward-Looking Statements
DISCLAIMERS Forward-Looking Statements This presentation includes “forward-looking statements” within the meaning of the “safe harbor” provisions of the Private Securities Litigation Reform Act of 1996. The Company's actual results may differ from its expectations, estimates and projections and cons
Slide 3: Disclaimers (Cont'd)
DISCLAIMERS (Cont’d) These non-GAAP financial measures have limitations as analytical tools and should not be considered in isolation or as substitutes for an analysis of our results as reported under GAAP. Some of the limitations of these measures are: ● they do not reflect changes in, or cash requ
Slide 4: Agenda
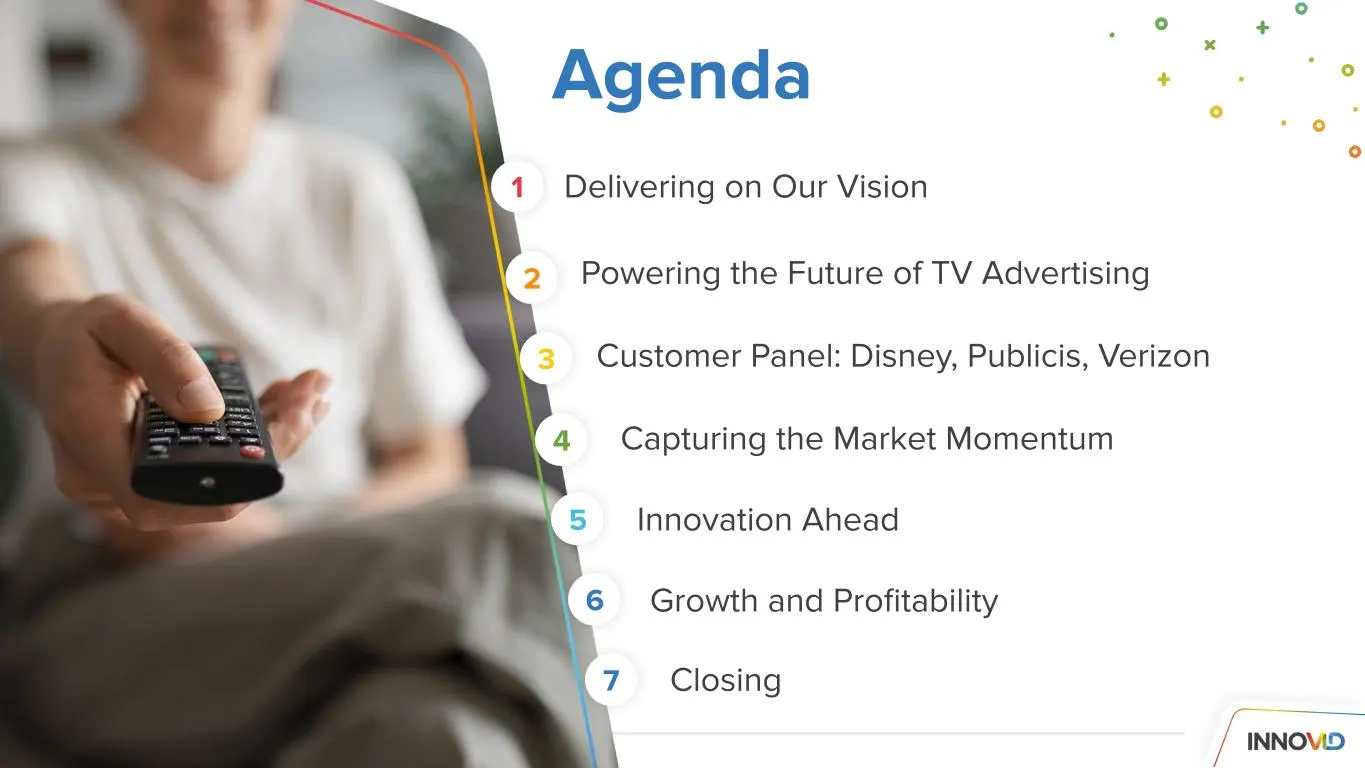
Agenda Delivering on Our Vision Powering the Future of TV Advertising Capturing the Market Momentum Growth and Profitability Closing 1 2 3 4 6 7 Customer Panel: Disney, Publicis, Verizon Innovation Ahead5
Slide 5: Today's Presenters
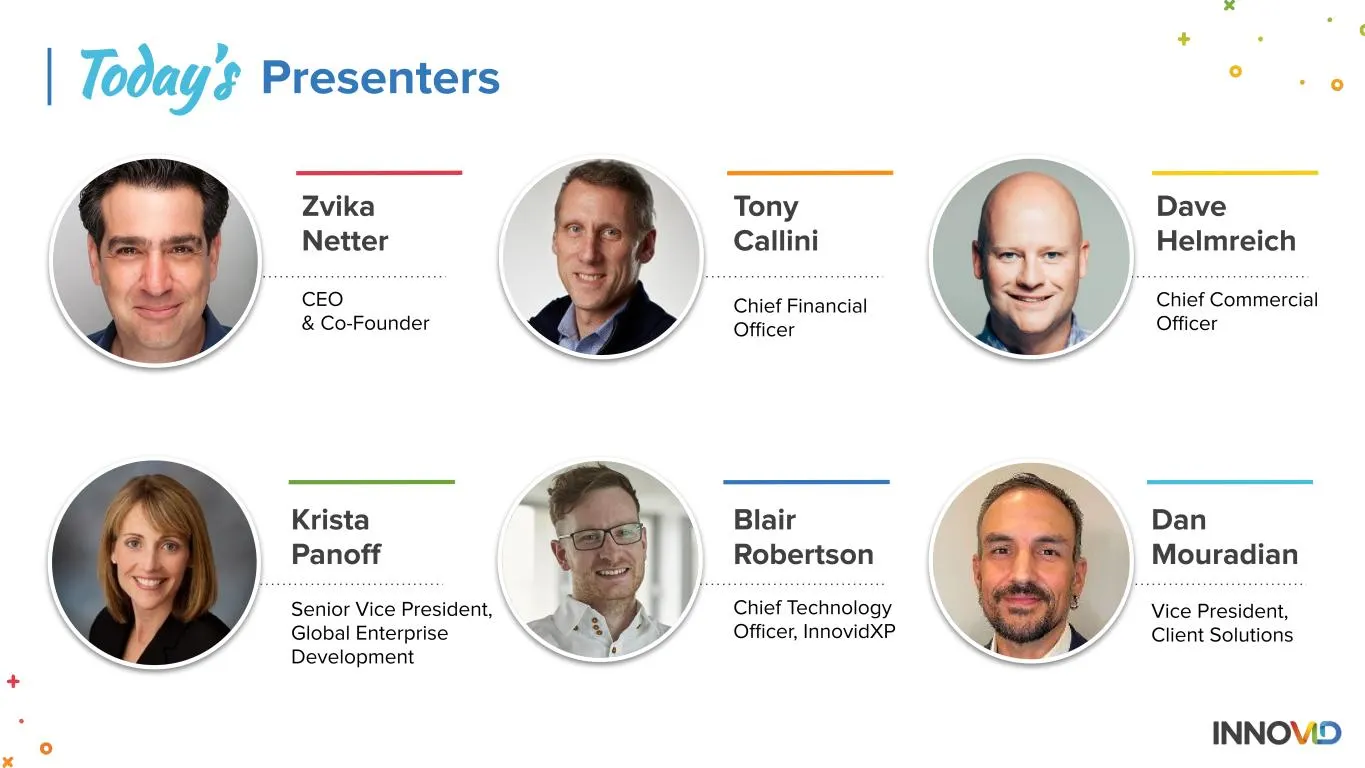
5 | Dave Helmreich Tony Callini Chief Financial Officer Chief Commercial Officer Zvika Netter CEO & Co-Founder Today’s Presenters Krista Panoff Dan Mouradian Vice President, Client Solutions Senior Vice President, Global Enterprise Development Blair Robertson Chief Technology Officer, InnovidXP
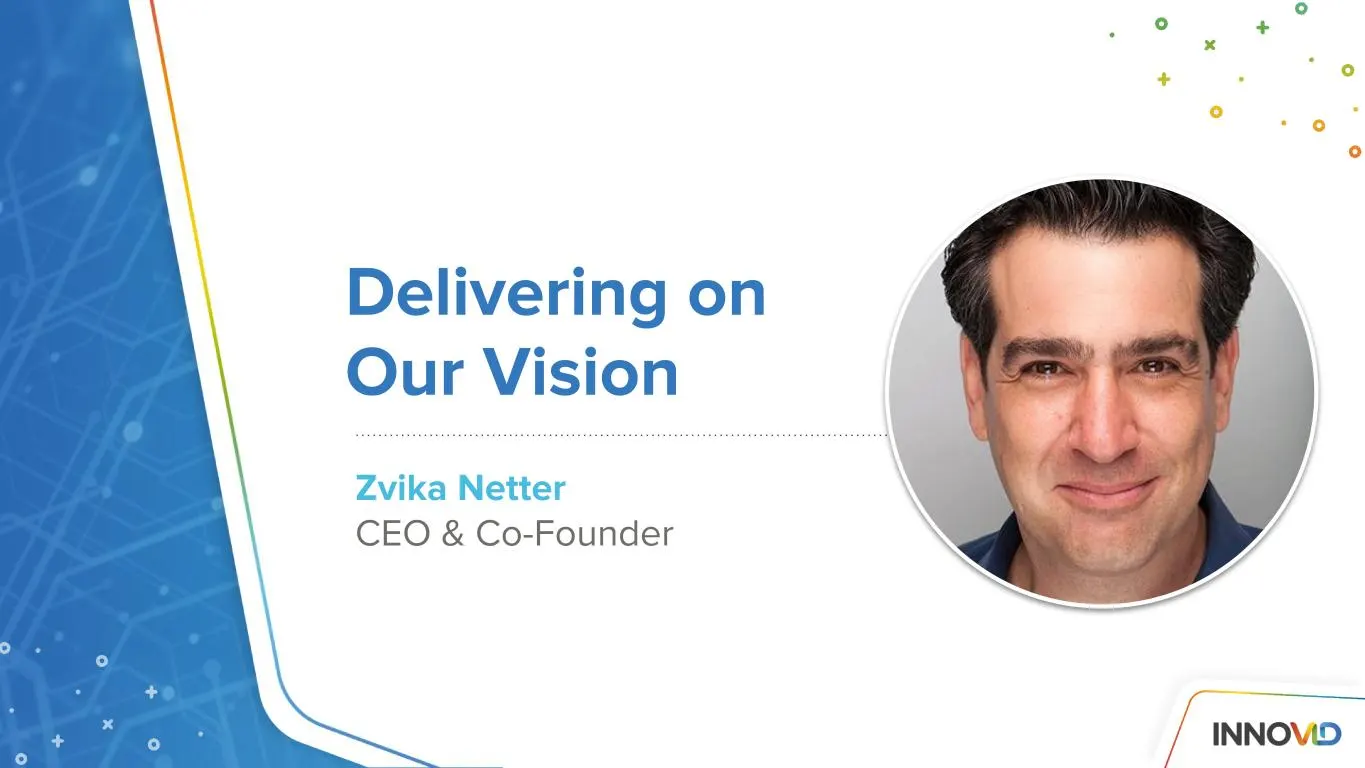
Slide 6: Delivering on Our Vision
Delivering on Our Vision Zvika Netter CEO & Co-Founder
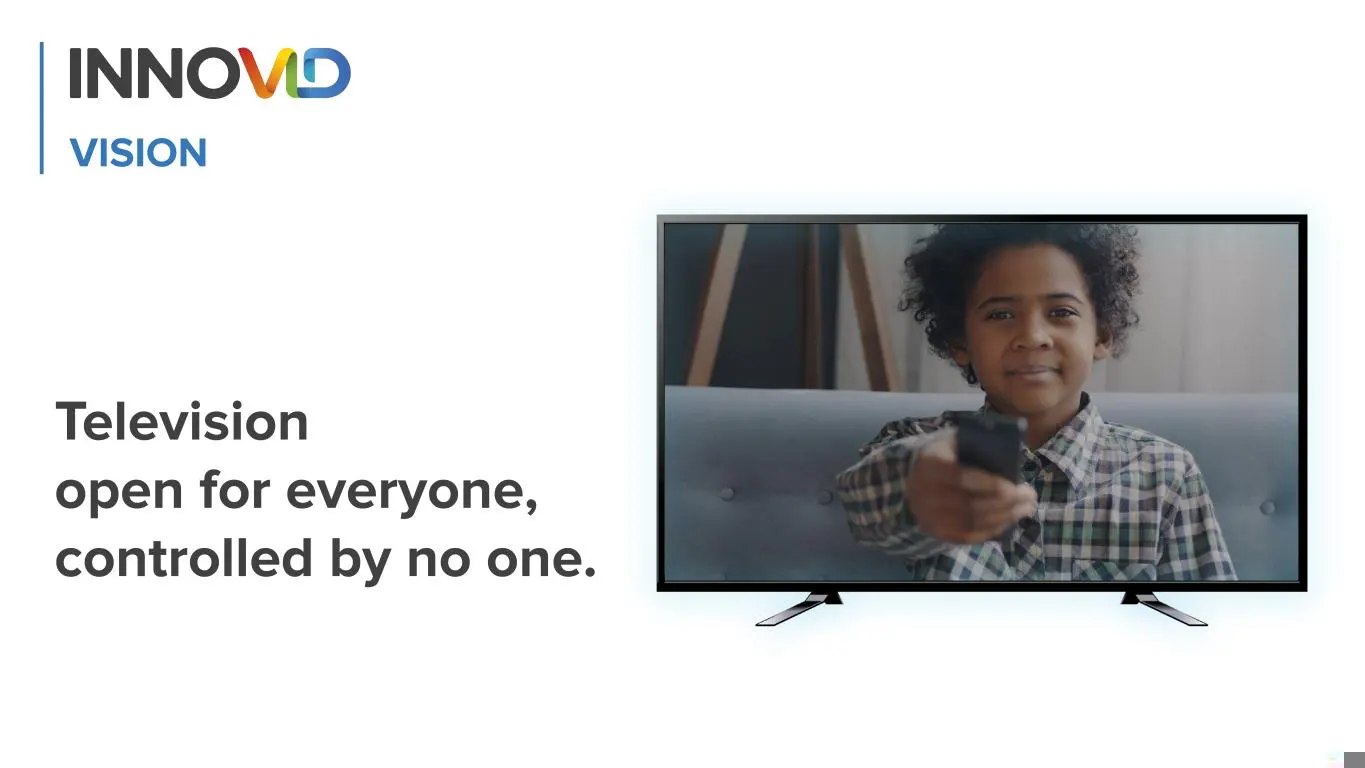
Slide 7: Vision: Television open for everyone, controlled by no one
Television open for everyone, controlled by no one. VISION
Slide 8: Mission
To empower the creation, delivery, measurement, and optimization of ad-supported TV experiences that people love. MISSION
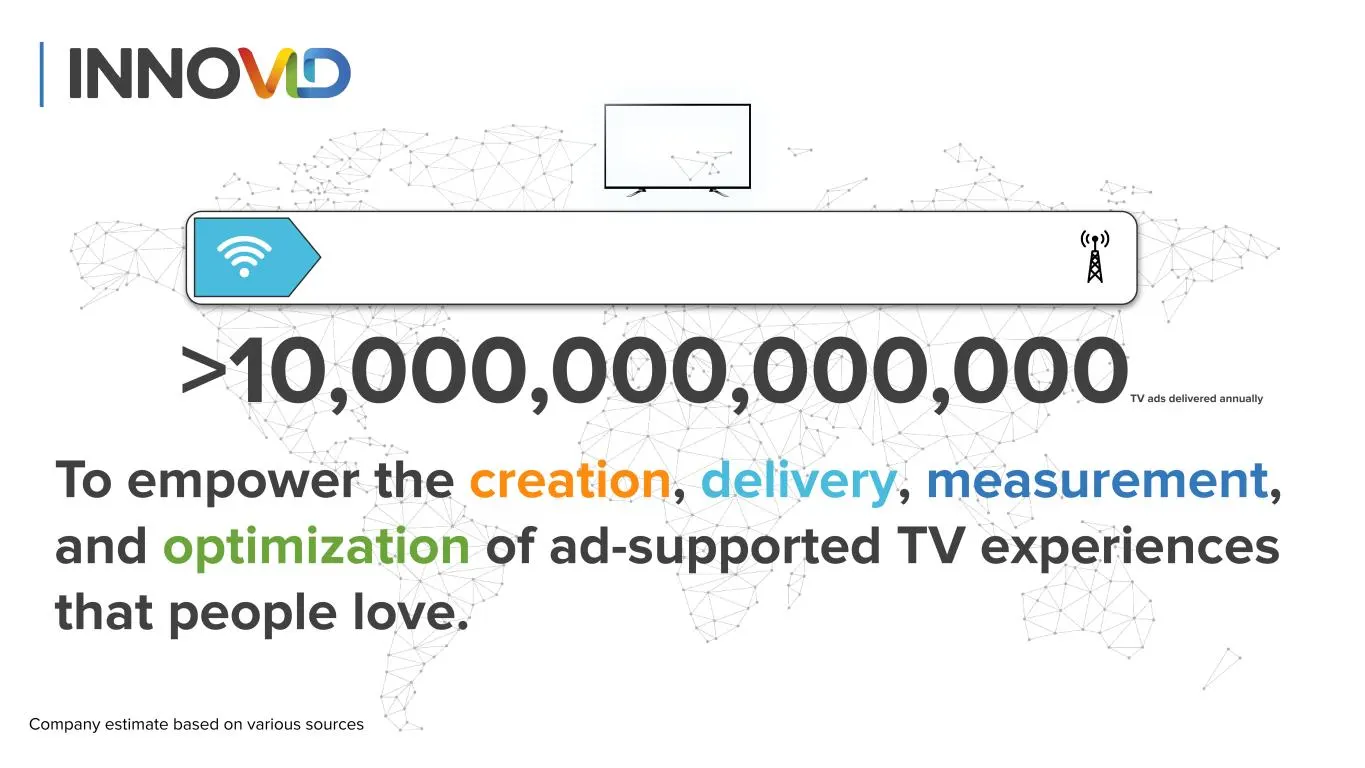
Slide 9: Mission and TV ads delivered annually
To empower the creation, delivery, measurement, and optimization of ad-supported TV experiences that people love. >10,000,000,000,000TV ads delivered annually Company estimate based on various sources
Slide 10: 2023 Continued Momentum
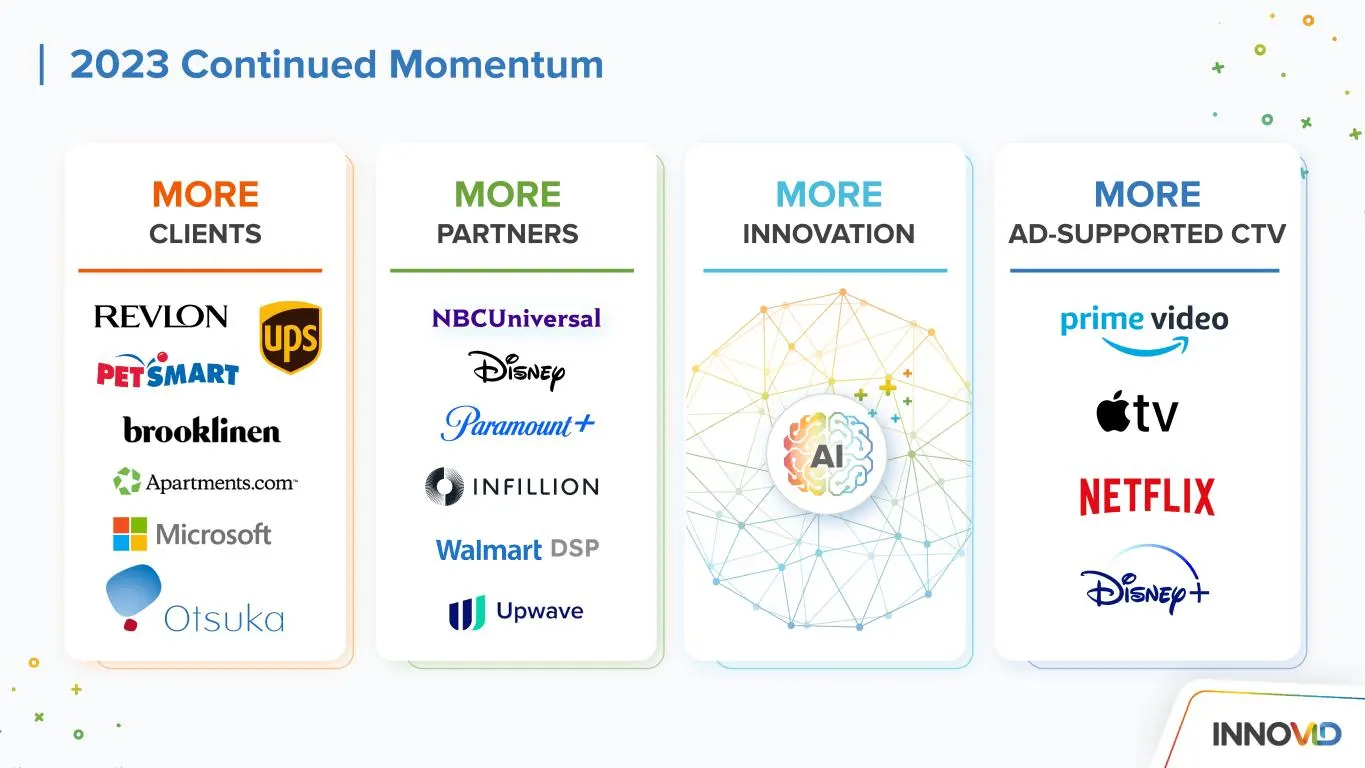
MORE CLIENTS MORE PARTNERS 2023 Continued Momentum DSP MORE INNOVATION MORE AD-SUPPORTED CTV AI
Slide 11: On Top of Our Existing Best-in-Class Client Base
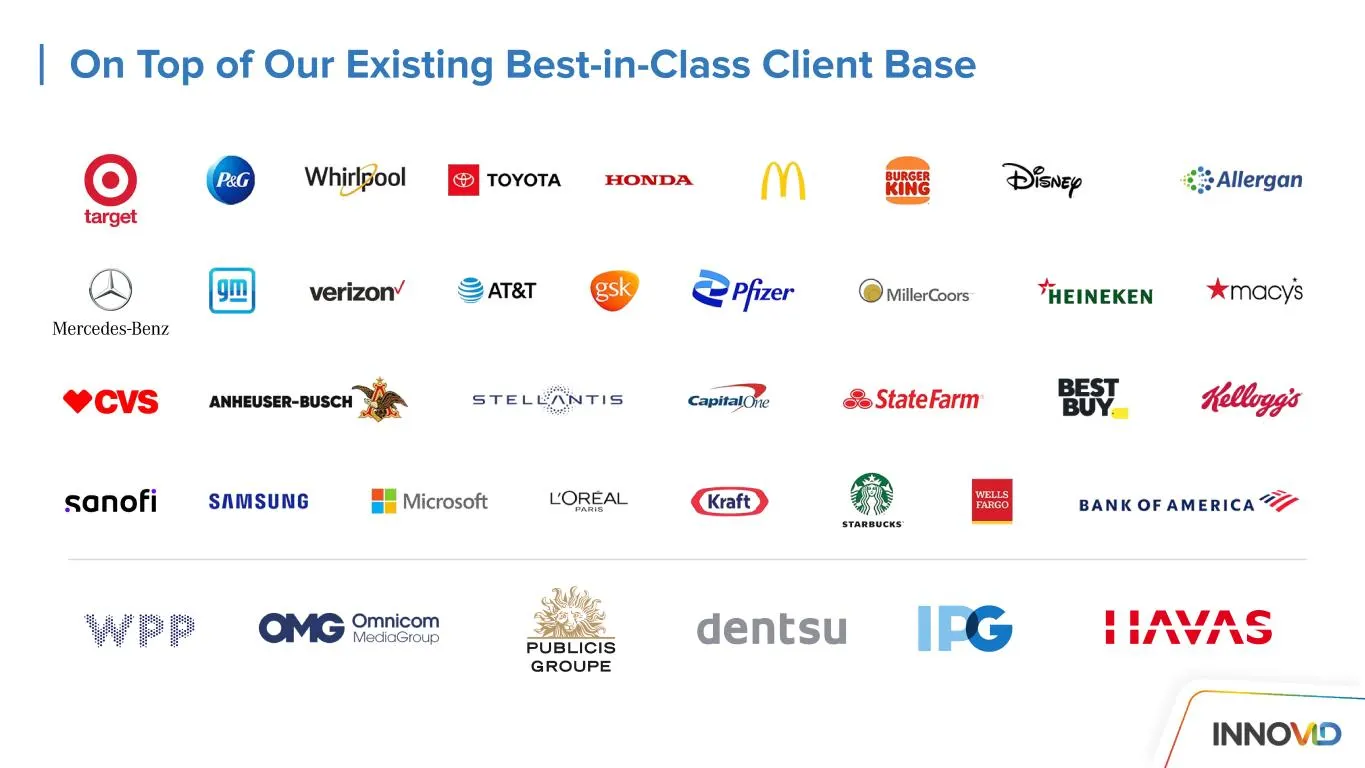
On Top of Our Existing Best-in-Class Client Base
Slide 12: New C-Suite Leaders Scaling-Up for Faster Growth
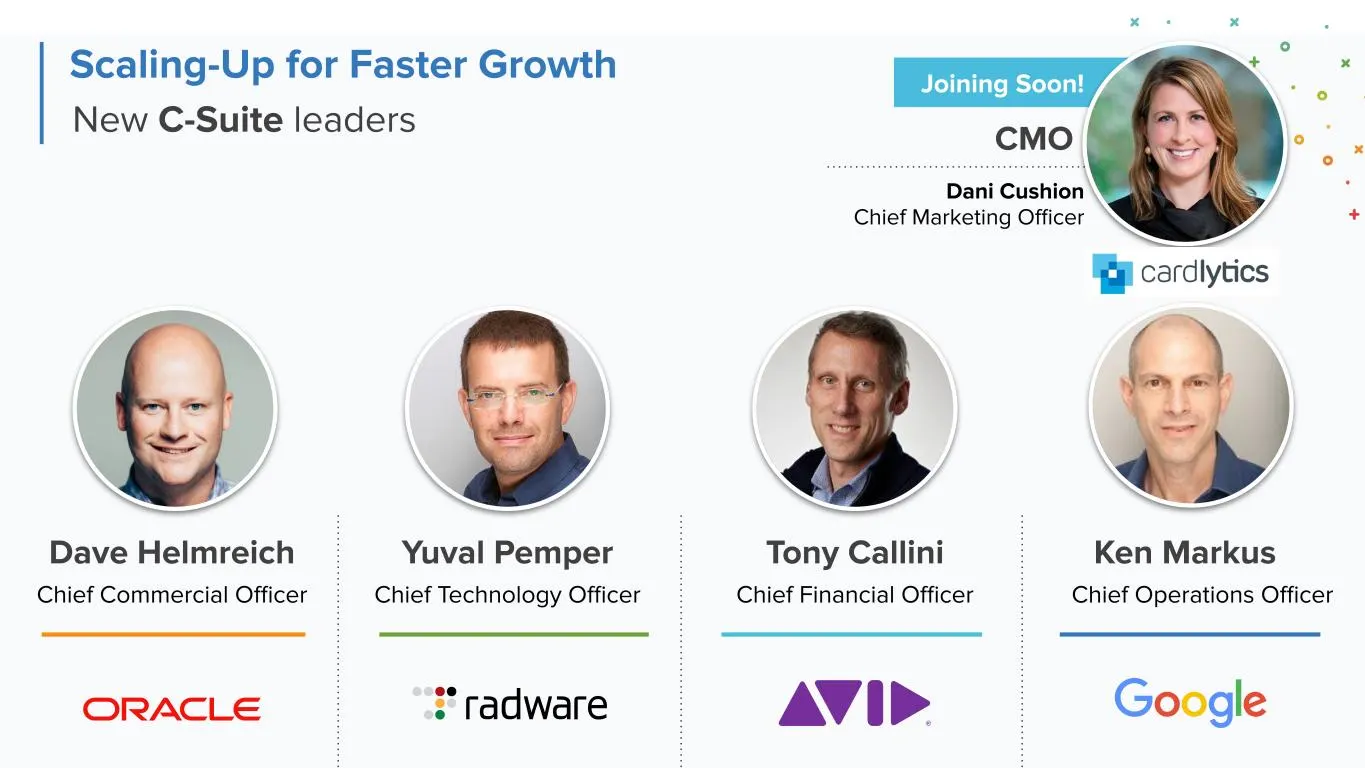
Dave Helmreich Yuval Pemper Tony Callini Ken Markus Chief Technology Officer Chief Financial Officer Chief Operations Officer New C-Suite leaders Scaling-Up for Faster Growth Chief Commercial Officer CMO Dani Cushion Chief Marketing Officer Joining Soon!
Slide 13: New Commercial Leaders Scaling-Up for Faster Growth
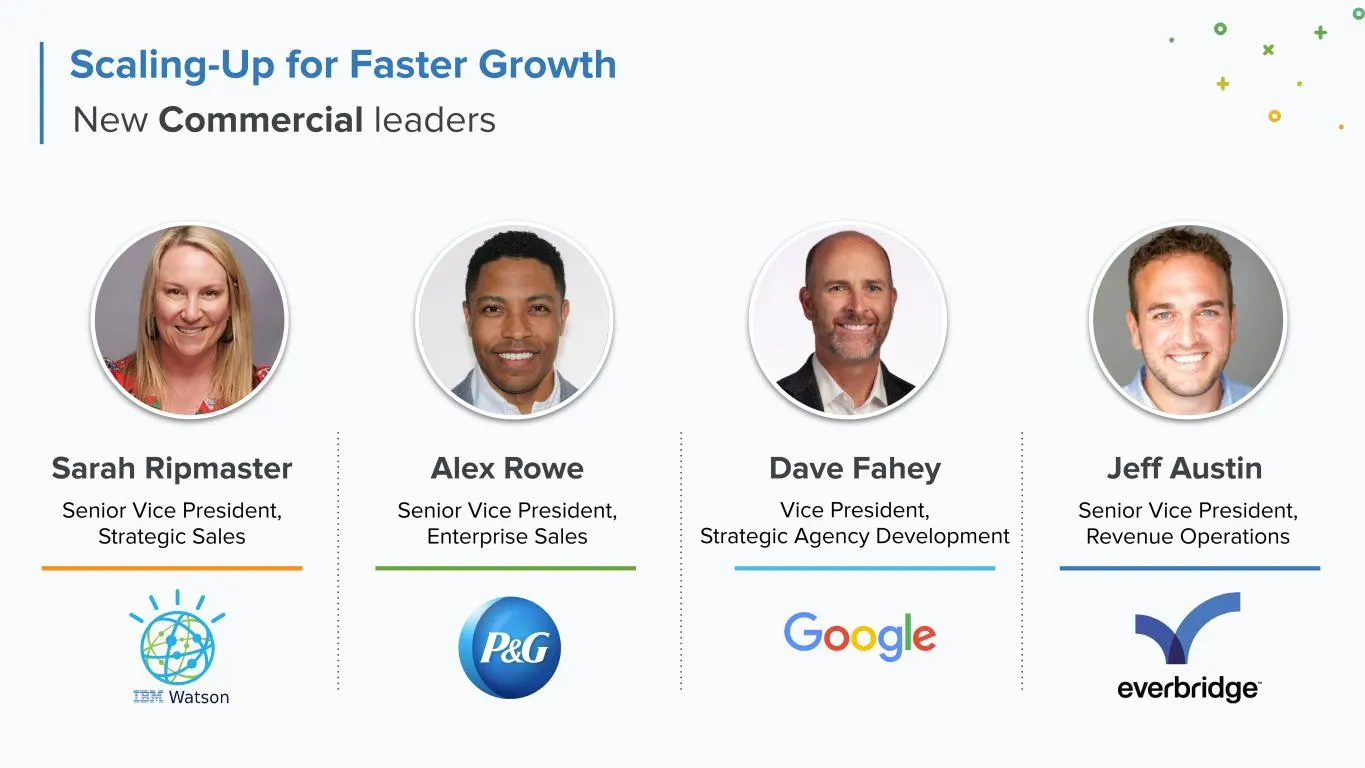
New Commercial leaders Scaling-Up for Faster Growth Sarah Ripmaster Alex Rowe Dave Fahey Jeff Austin Senior Vice President, Enterprise Sales Vice President, Strategic Agency Development Senior Vice President, Revenue Operations Senior Vice President, Strategic Sales
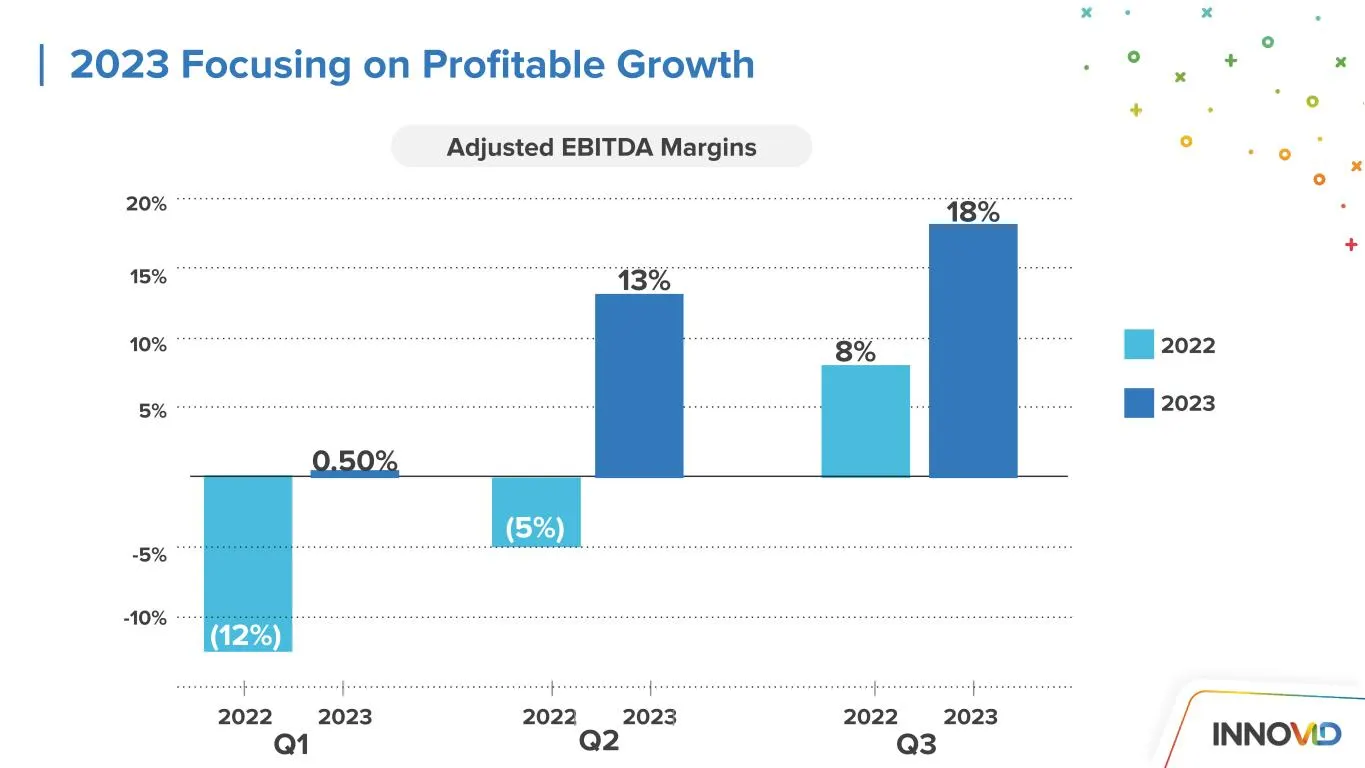
Slide 14: 2023 Focusing on Profitable Growth
13% 18% 2023 Focusing on Profitable Growth 10% 15% 20% 5% 8% 2022 2023 Adjusted EBITDA Margins (5%) -5% -10% (12%) Q1 2022 2023 2022 2023 2022 2023 Q2 Q3 0.50%
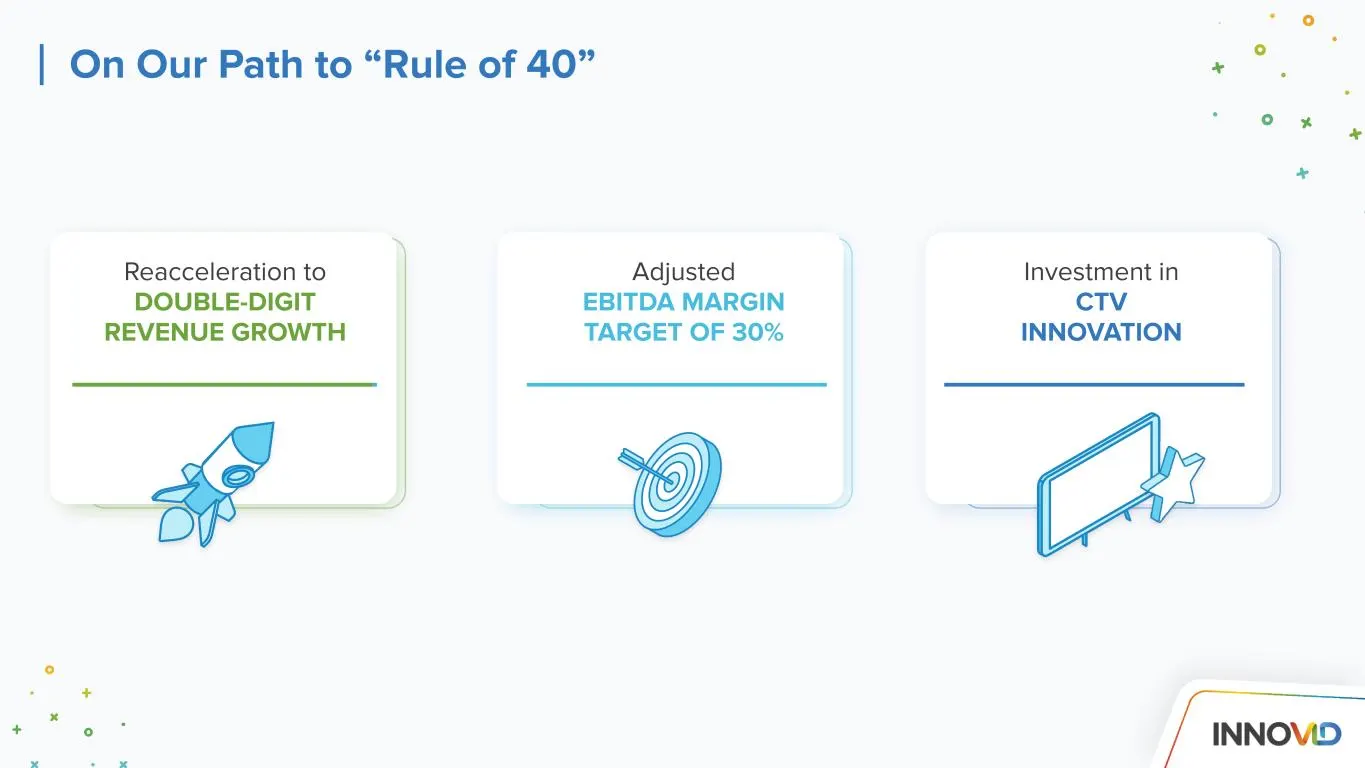
Slide 15: On Our Path to Rule of 40
Adjusted EBITDA MARGIN TARGET OF 30% On Our Path to “Rule of 40” Reacceleration to DOUBLE-DIGIT REVENUE GROWTH Investment in CTV INNOVATION
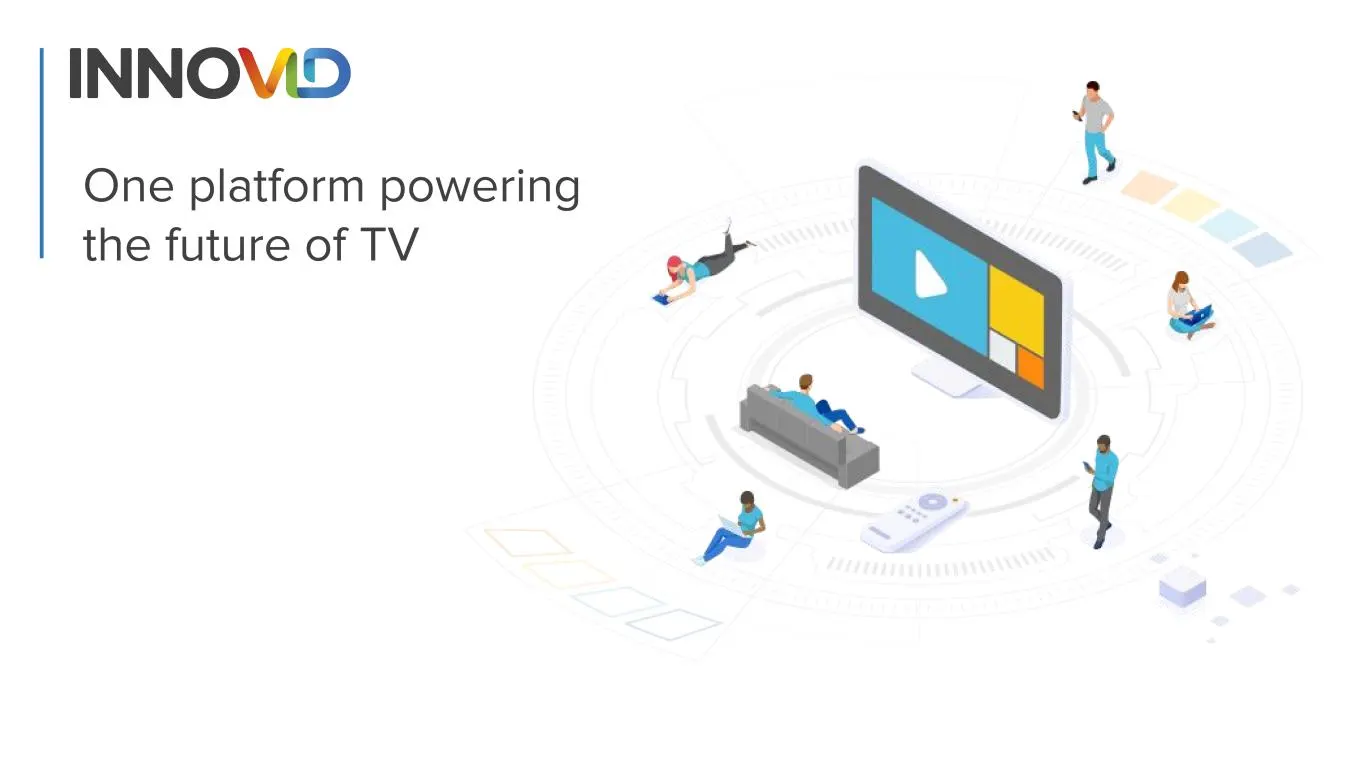
Slide 16: One platform powering the future of TV
One platform powering the future of TV
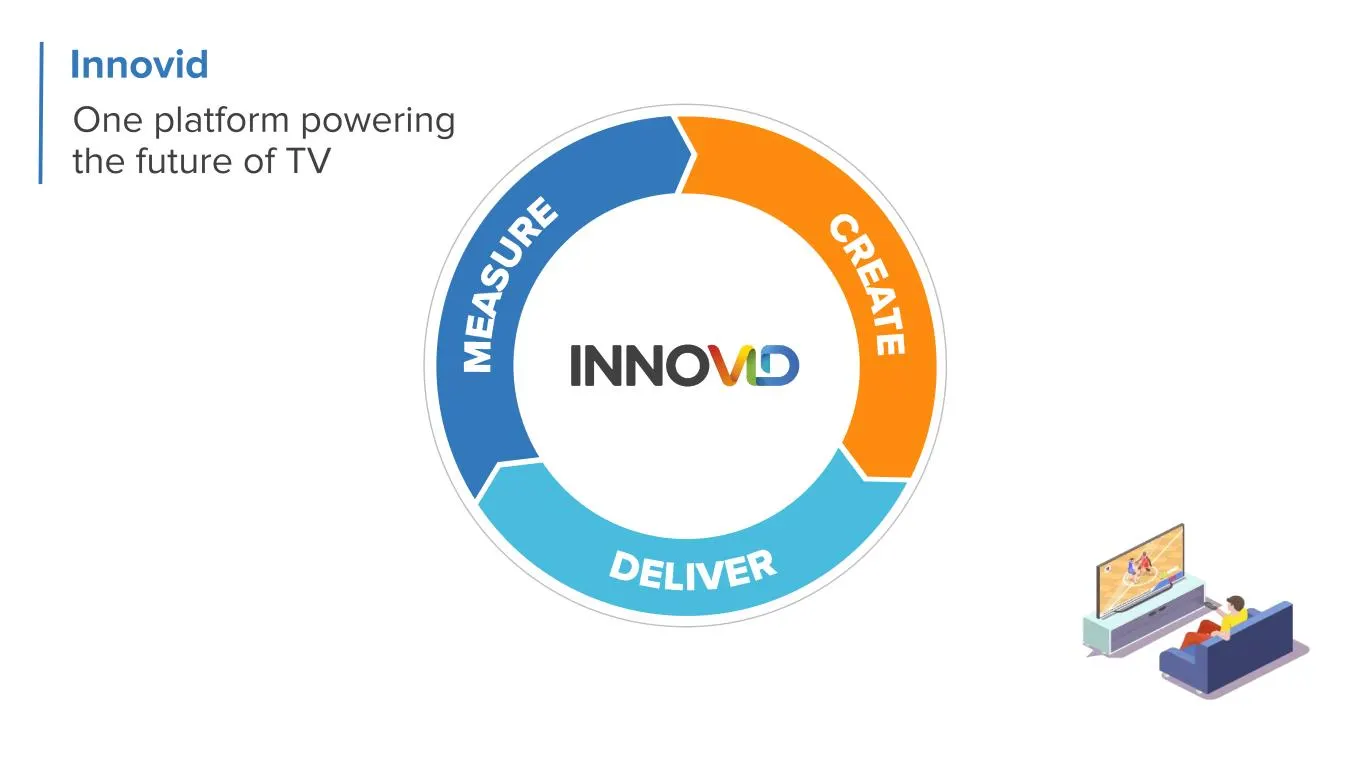
Slide 17: Innovid: One platform powering the future of TV
Innovid One platform powering the future of TV
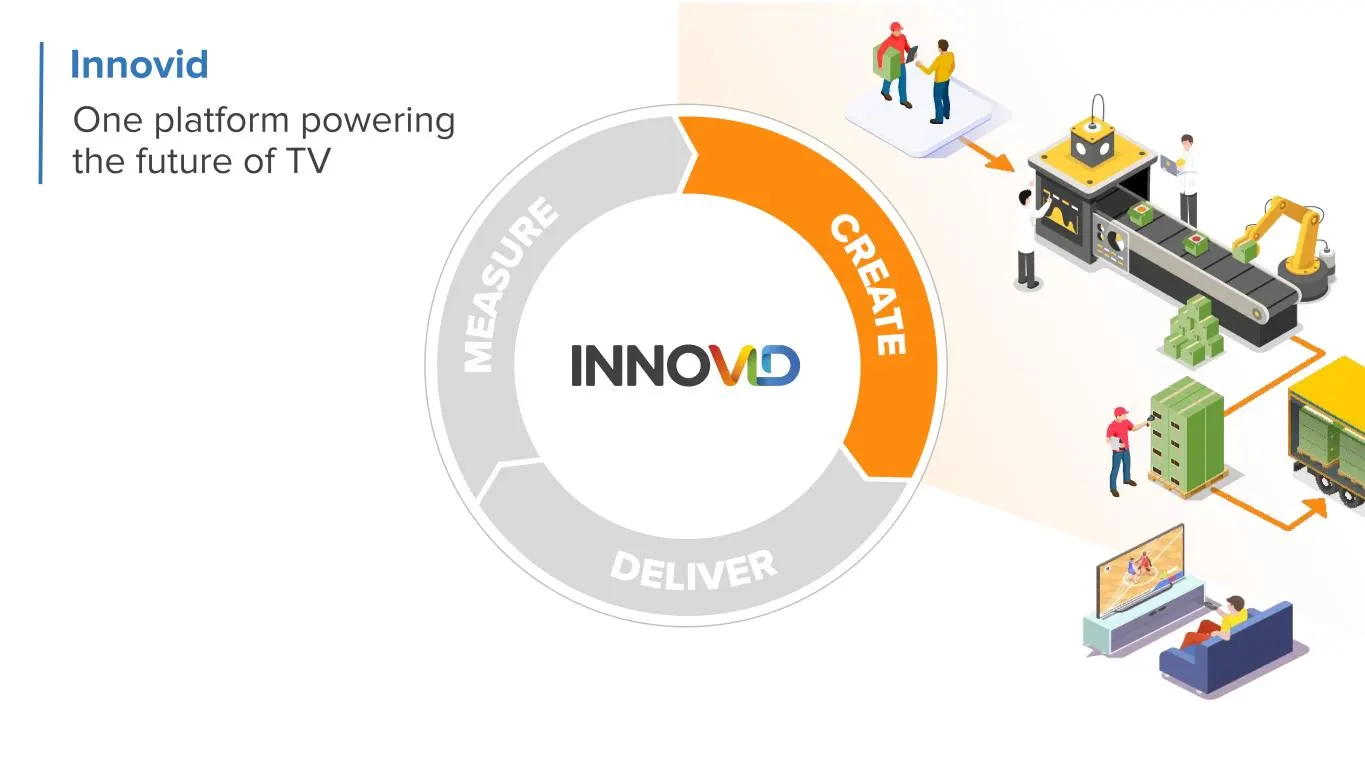
Slide 18: Innovid: One platform powering the future of TV
Innovid One platform powering the future of TV
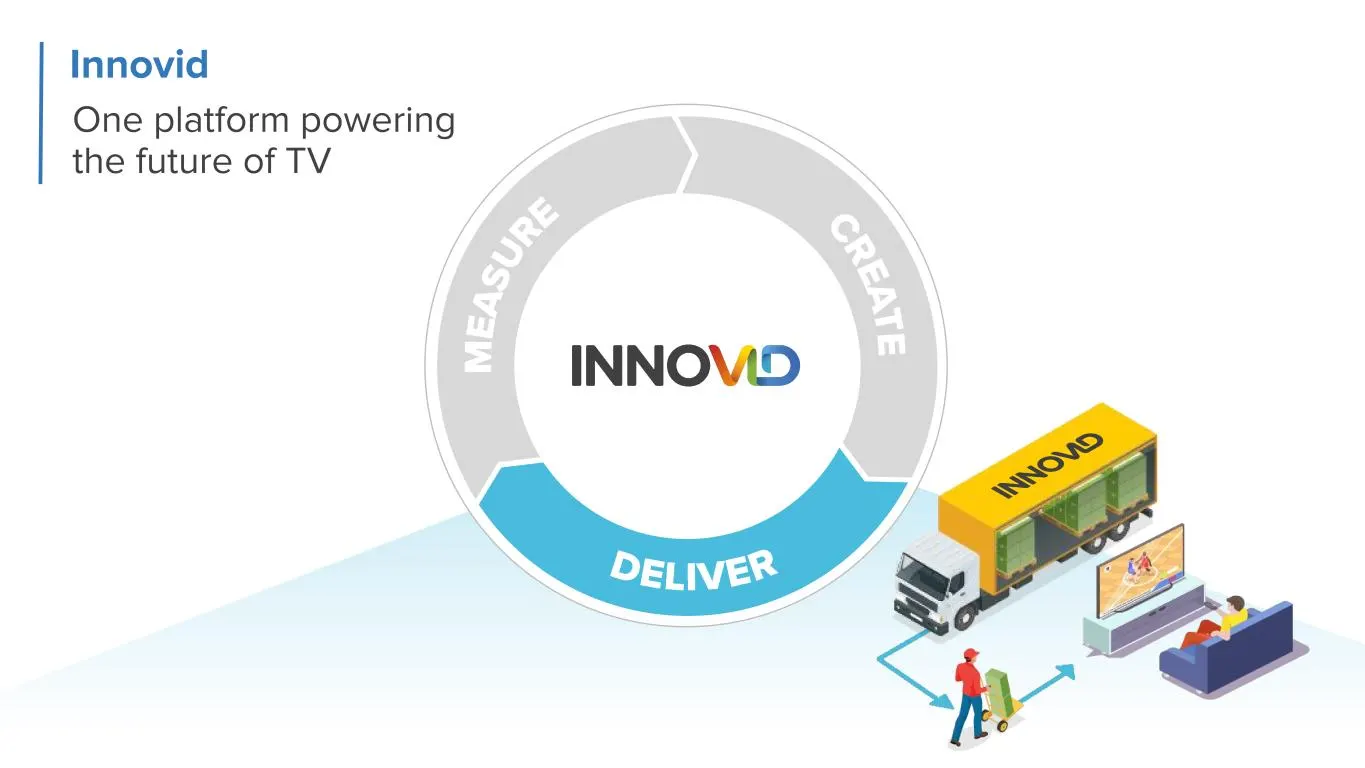
Slide 19: Innovid: One platform powering the future of TV
One platform powering the future of TV Innovid
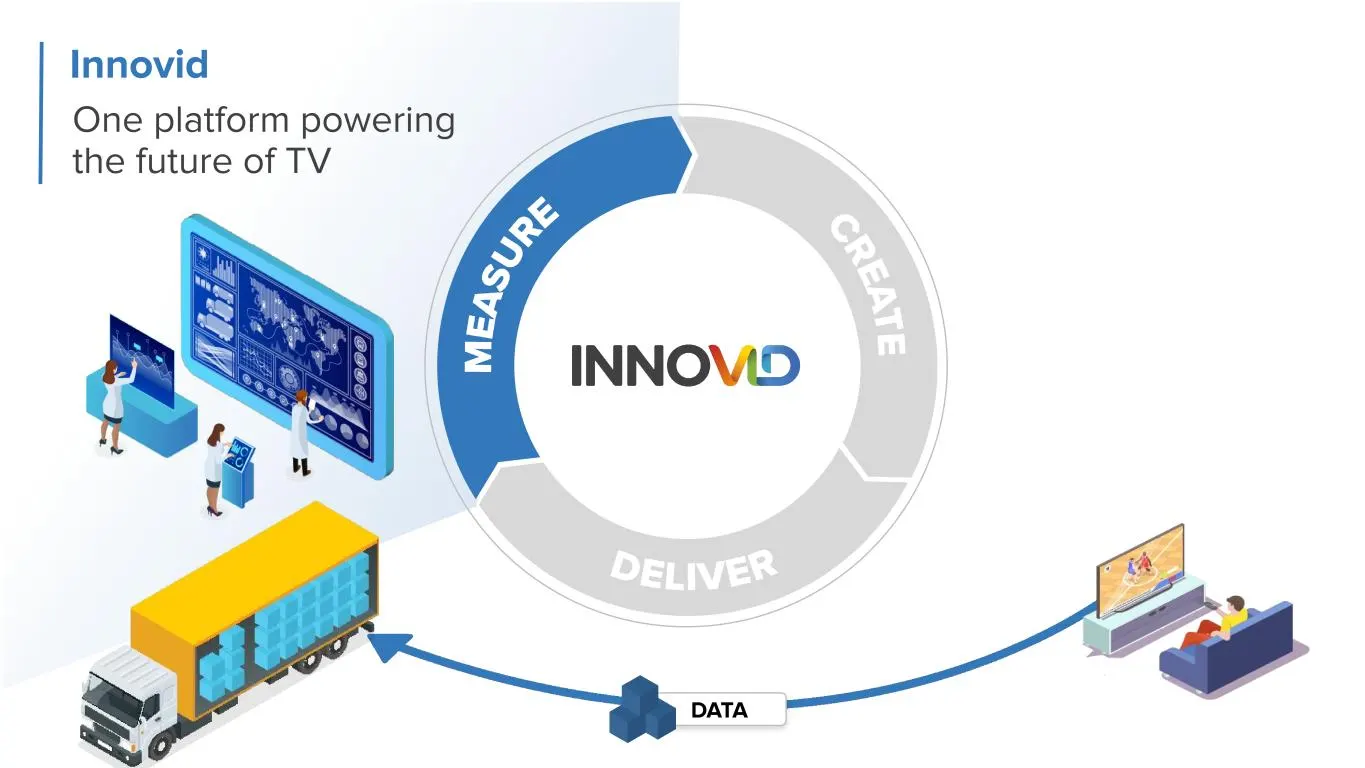
Slide 20: One platform with Data
One platform powering the future of TV Innovid DATA
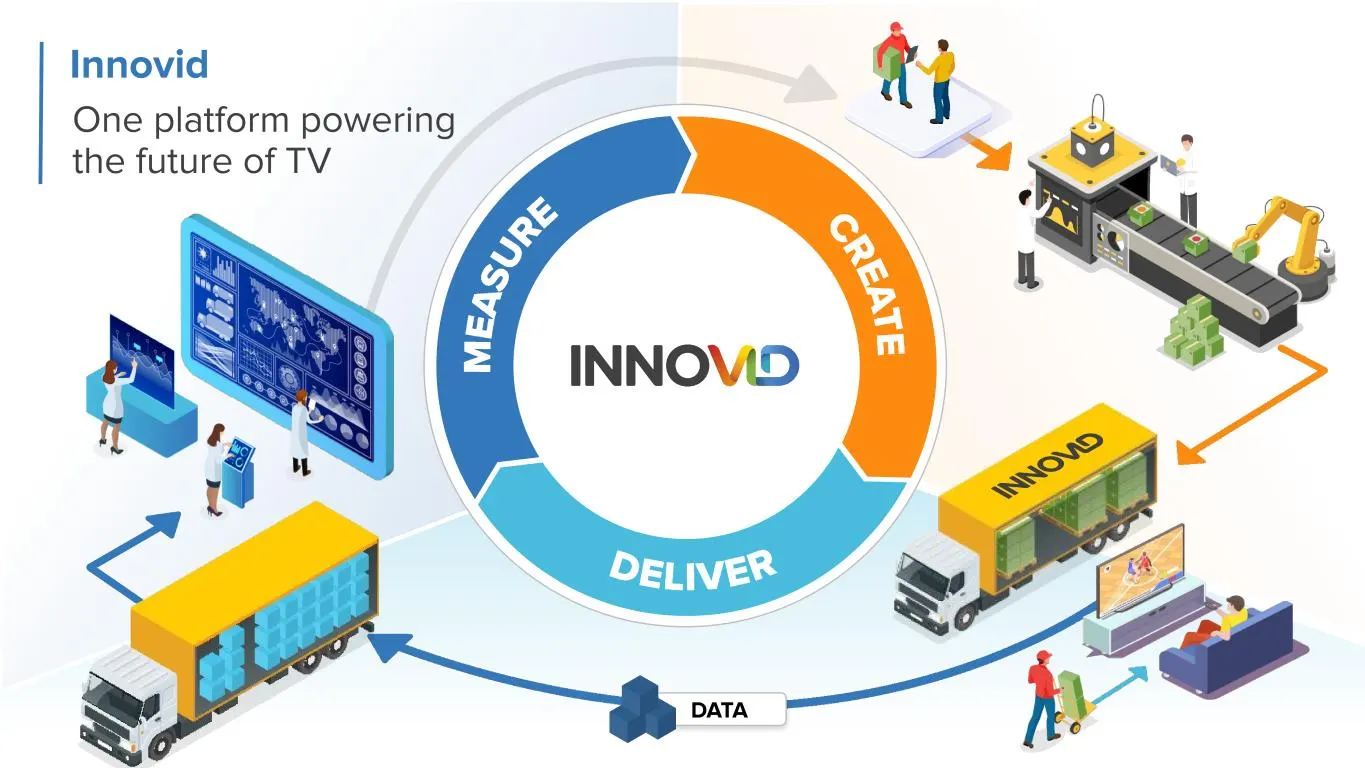
Slide 21: One platform with Data
Innovid One platform powering the future of TV DATA
Slide 22: Data: Our Strategic Asset
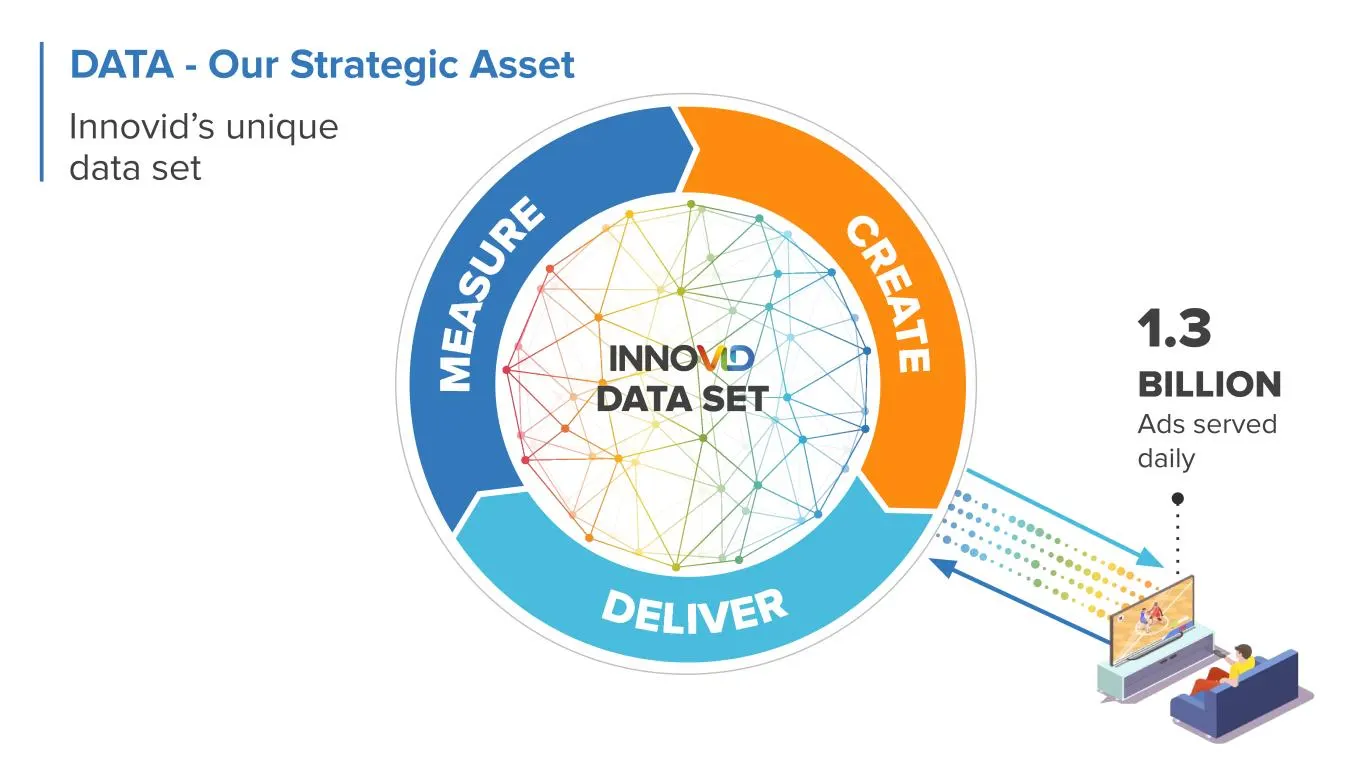
1.3 BILLION Ads served daily DATA SET DATA - Our Strategic Asset Innovid’s unique data set
Slide 23: Innovid's Unique Data Set
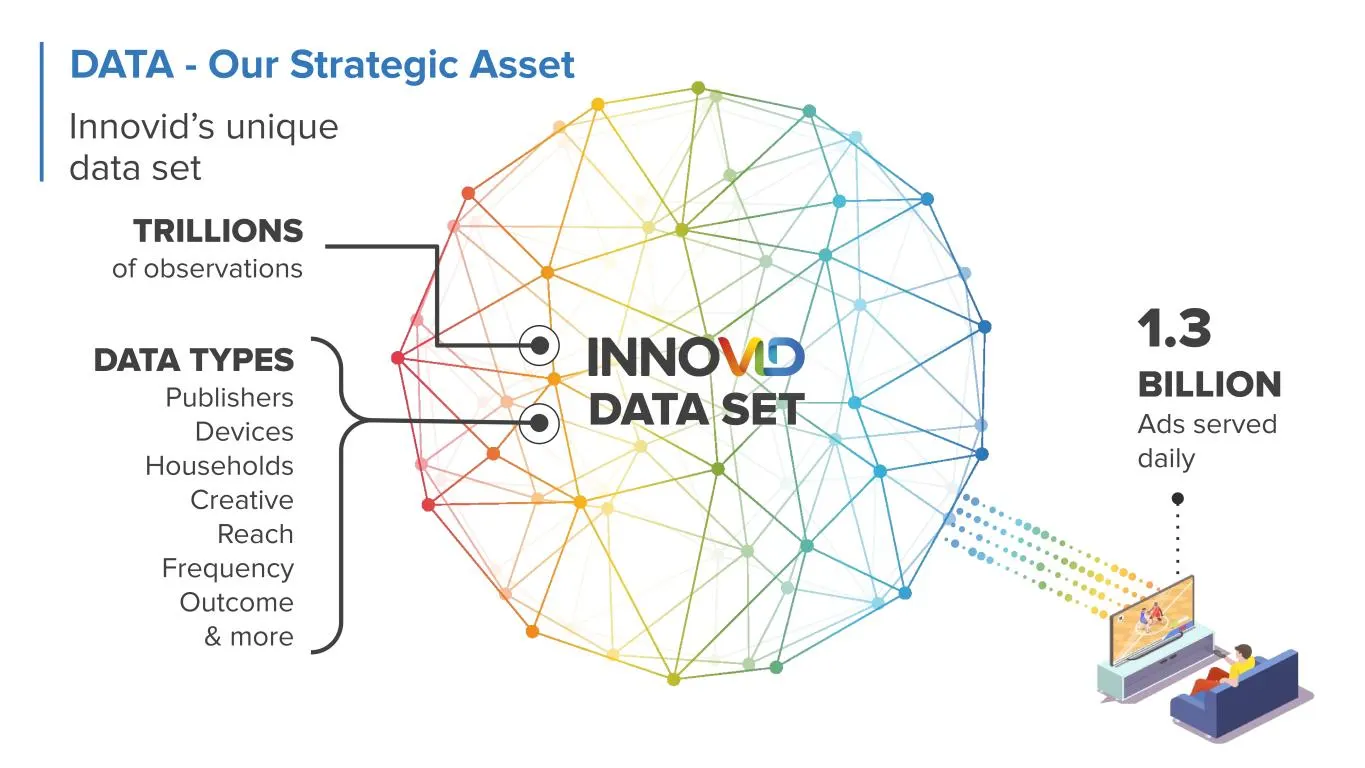
DATA SET TRILLIONS of observations 1.3 BILLION Ads served daily DATA TYPES Publishers Devices Households Creative Reach Frequency Outcome & more Innovid’s unique data set DATA - Our Strategic Asset
Slide 24: AI Runs on Data
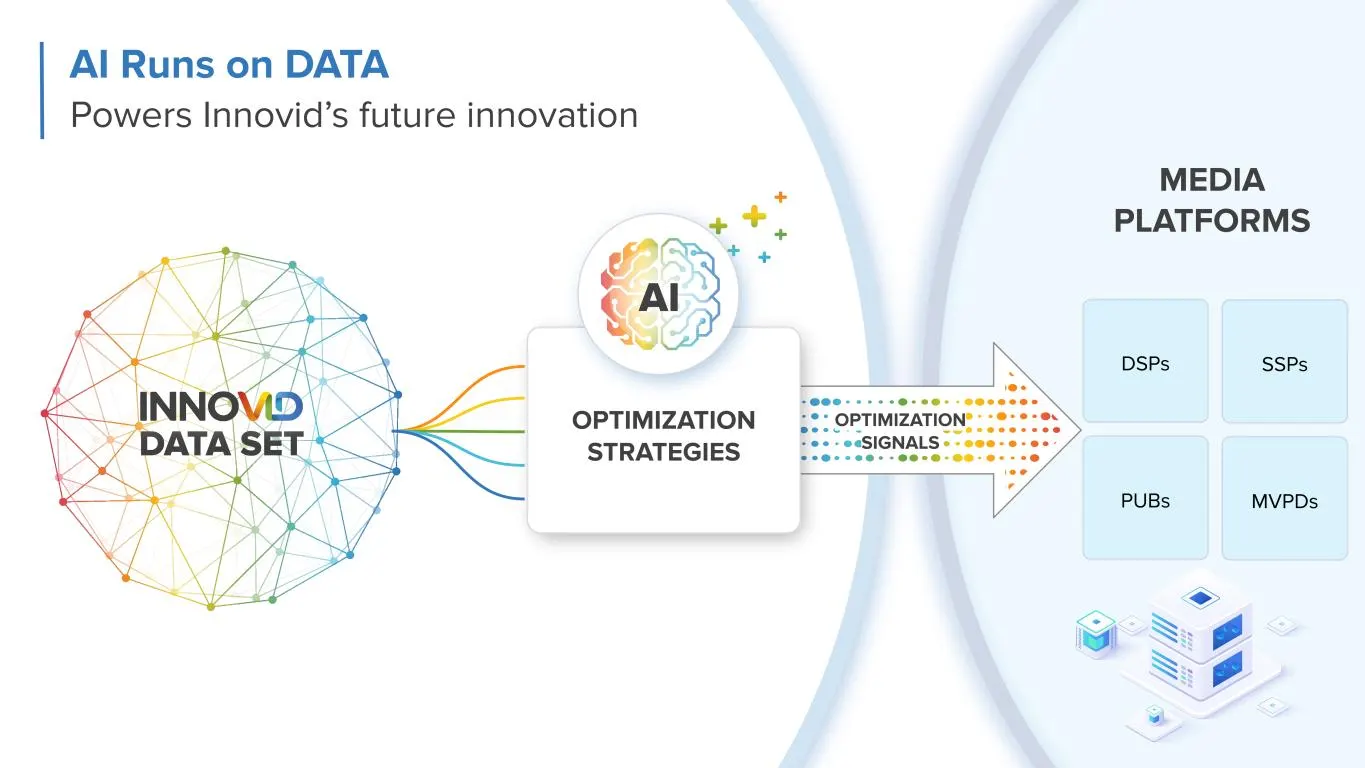
OPTIMIZATION STRATEGIES AI OPTIMIZATION SIGNALSDATA SET AI Runs on DATA Powers Innovid’s future innovation SSPs MVPDs DSPs PUBs MEDIA PLATFORMS
Slide 25: Powering the future of TV, today
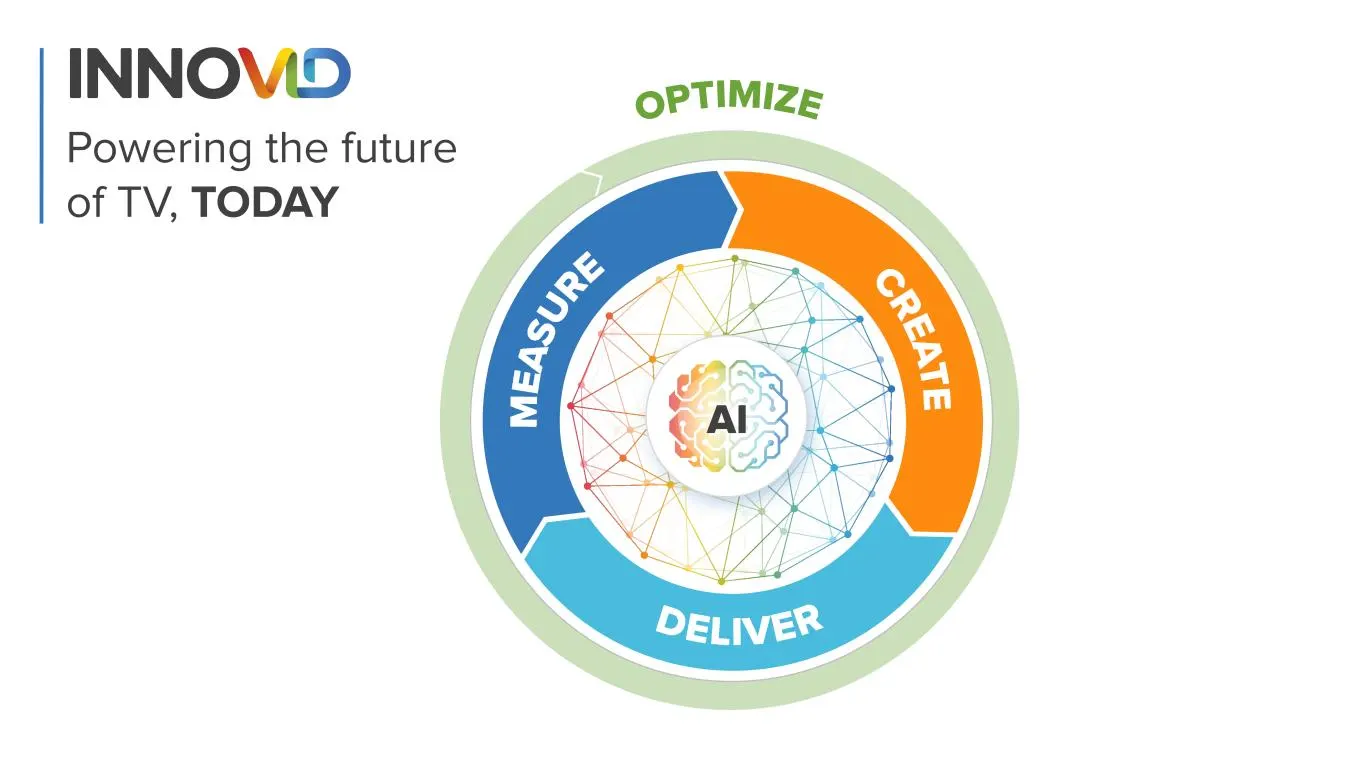
Powering the future of TV, TODAY AI
Slide 26: Powering the Future of TV Advertising
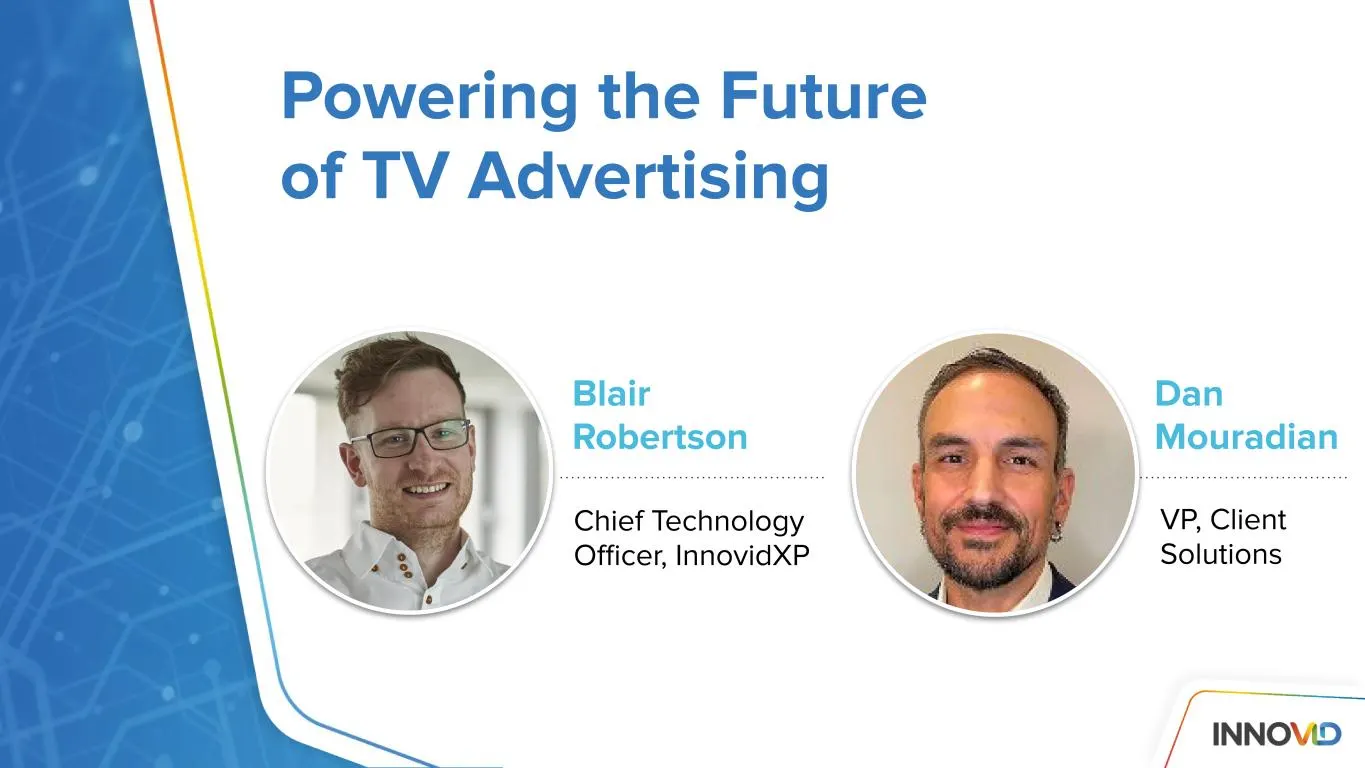
Powering the Future of TV Advertising VP, Client Solutions Blair Robertson Chief Technology Officer, InnovidXP Dan Mouradian
Slide 27: One platform powering the future of TV advertising
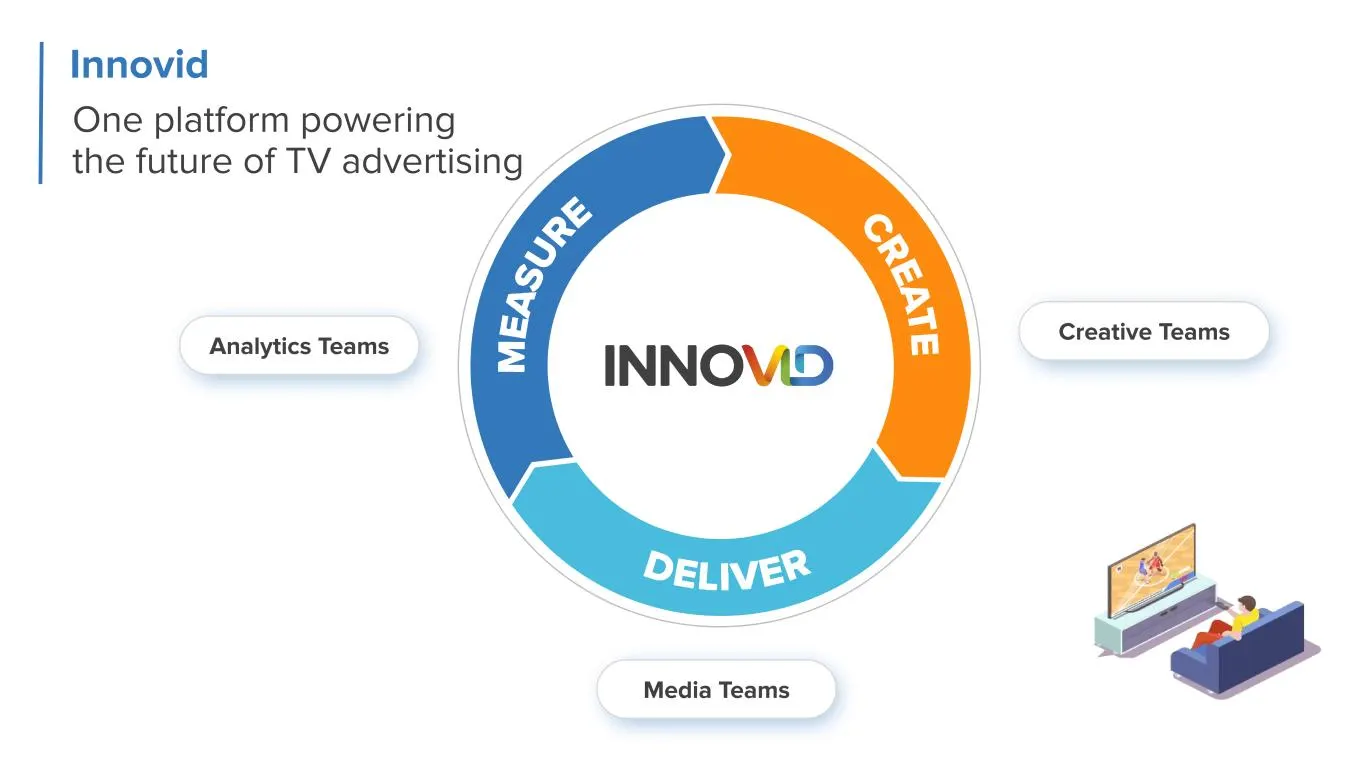
Innovid One platform powering the future of TV advertising Analytics Teams Media Teams Creative Teams
Slide 28: Enabling creative storytelling: evolution of TV creative
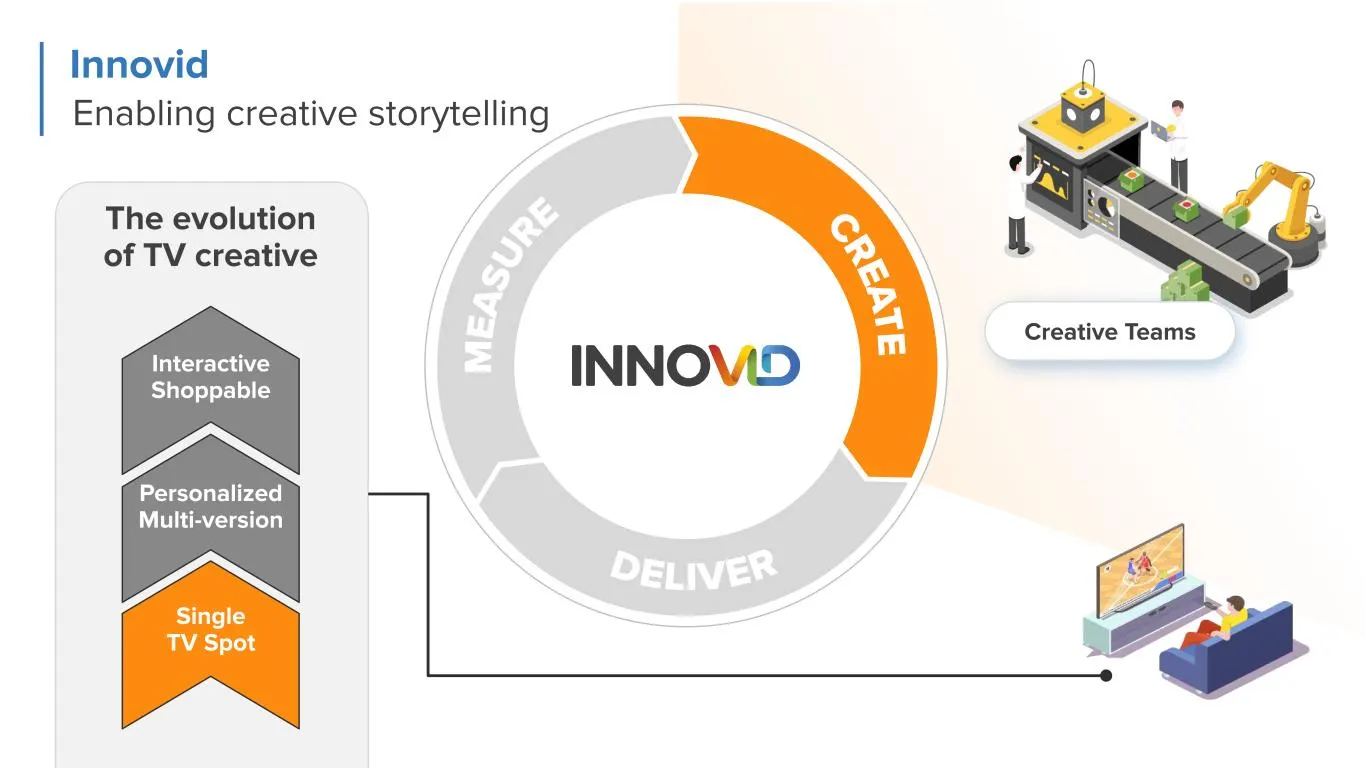
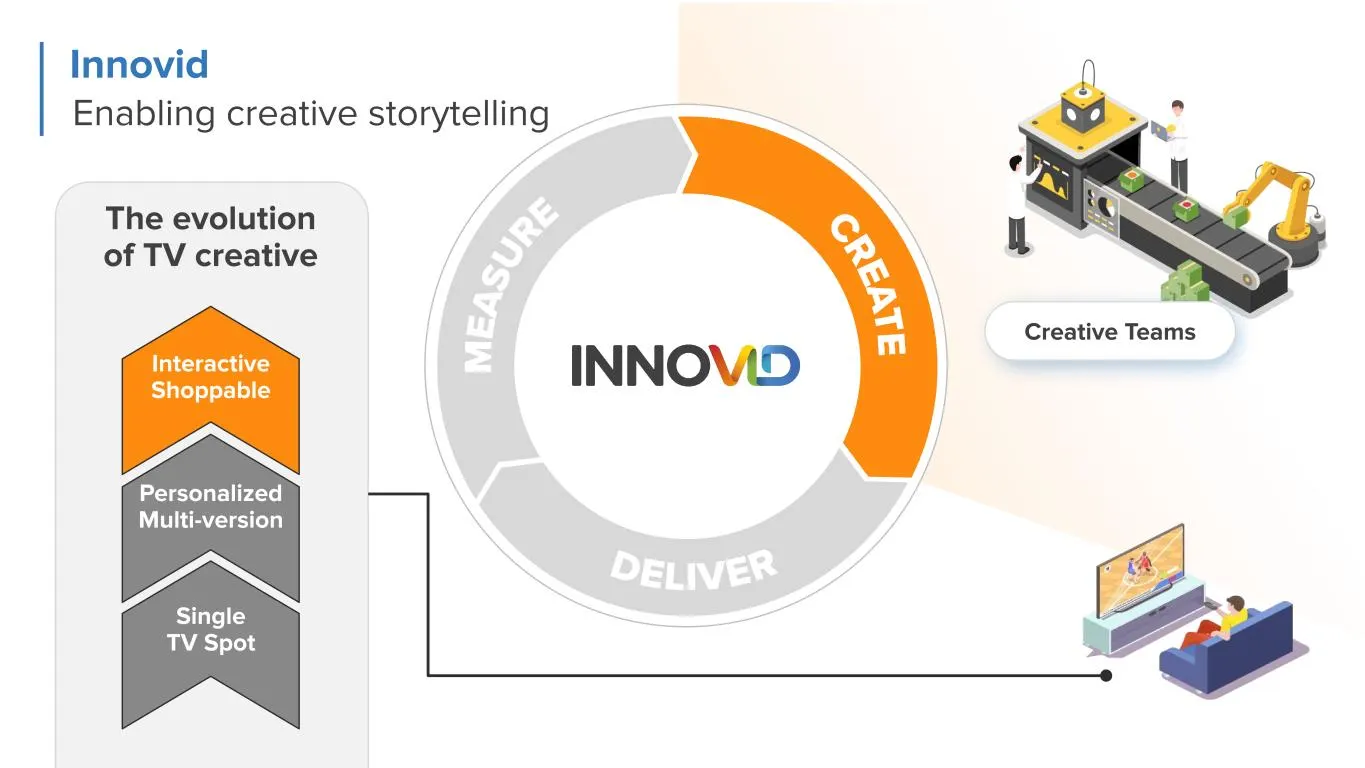
Innovid Enabling creative storytelling The evolution of TV creative Single TV Spot Personalized Multi-version Interactive Shoppable Creative Teams
Slide 29: Enabling creative storytelling: evolution of TV creative
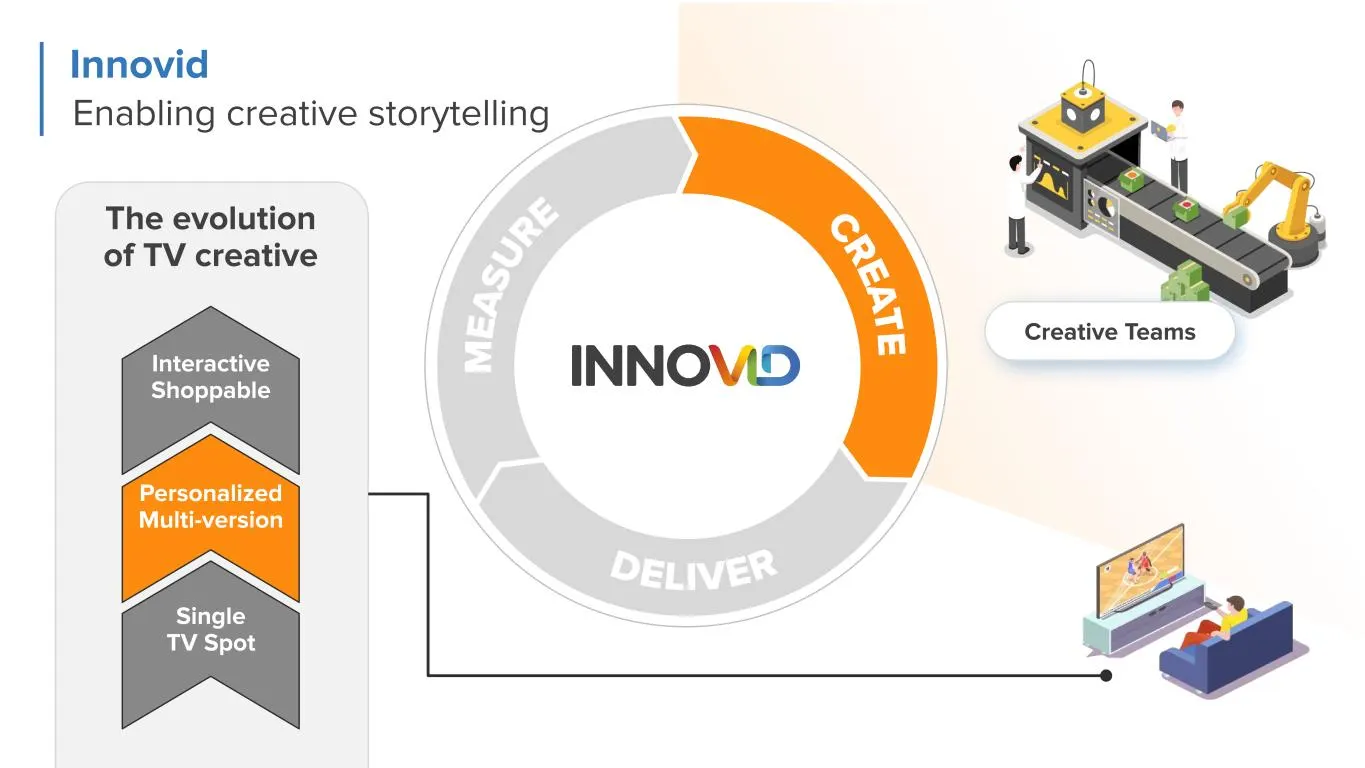
Innovid Enabling creative storytelling The evolution of TV creative Single TV Spot Personalized Multi-version Interactive Shoppable Creative Teams
Slide 30: Enabling creative storytelling: evolution of TV creative
Innovid Enabling creative storytelling The evolution of TV creative Single TV Spot Personalized Multi-version Interactive Shoppable Creative Teams
Slide 31: CTV Campaign Management for Media Teams
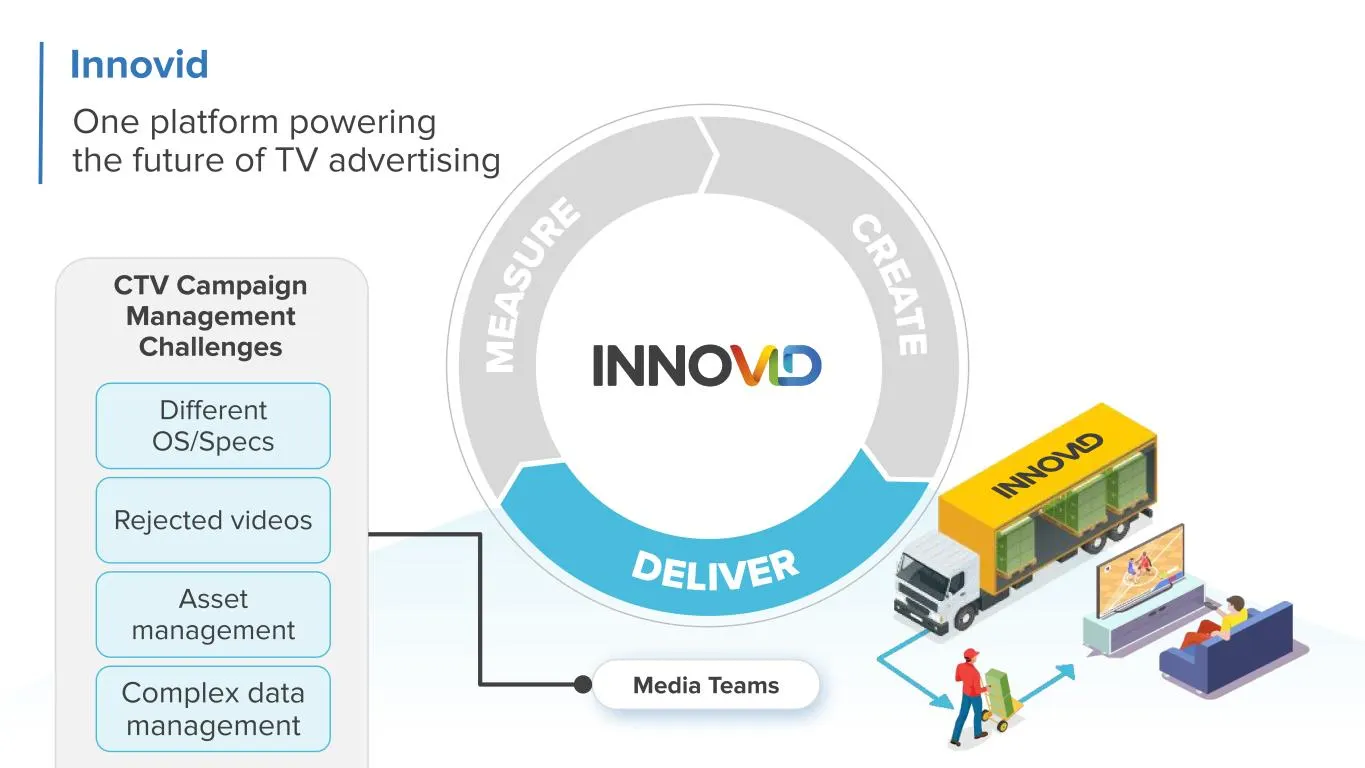
One platform powering the future of TV advertising Innovid Media Teams CTV Campaign Management Challenges Different OS/Specs Rejected videos Asset management Complex data management
Slide 32: Media Analysts prove and improve
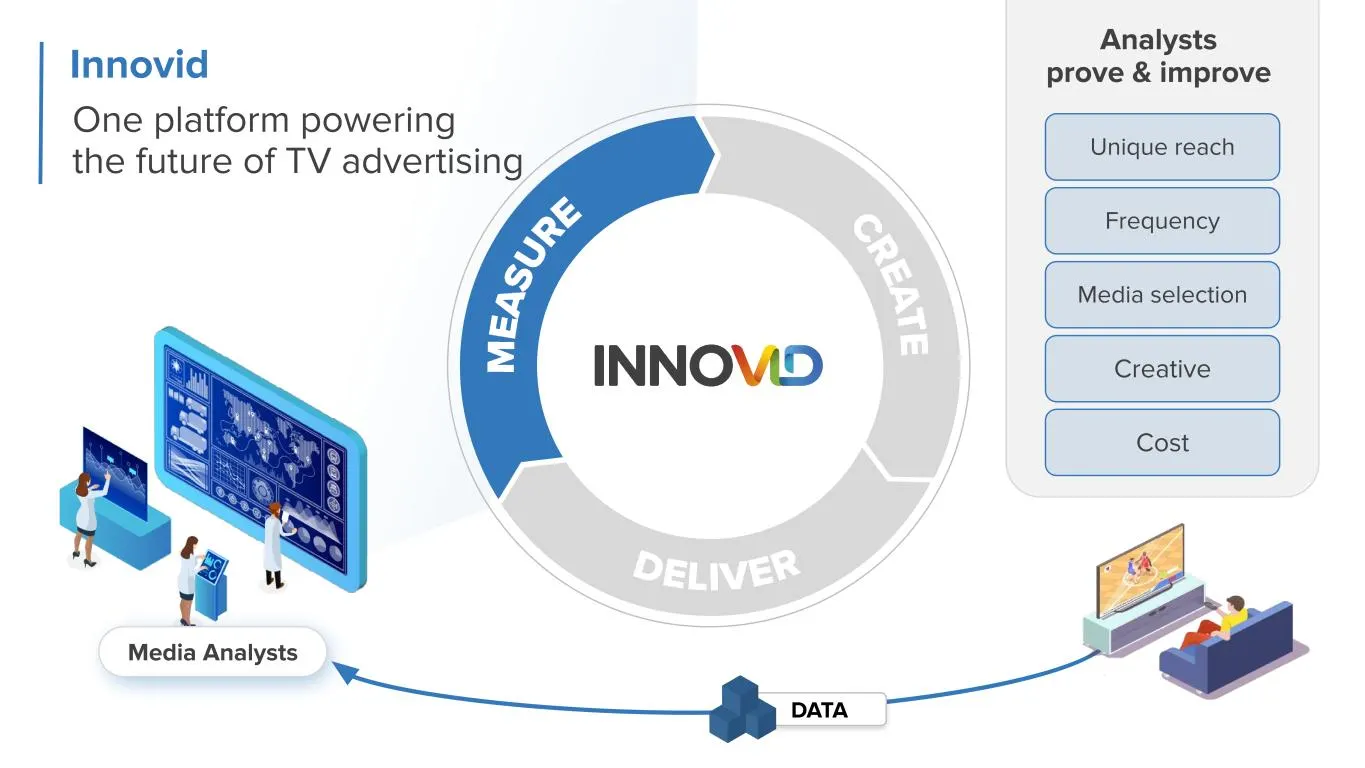
One platform powering the future of TV advertising Innovid DATA Media Analysts Analysts prove & improve Unique reach Frequency Media selection Creative Cost
Slide 33: Built for the future of TV
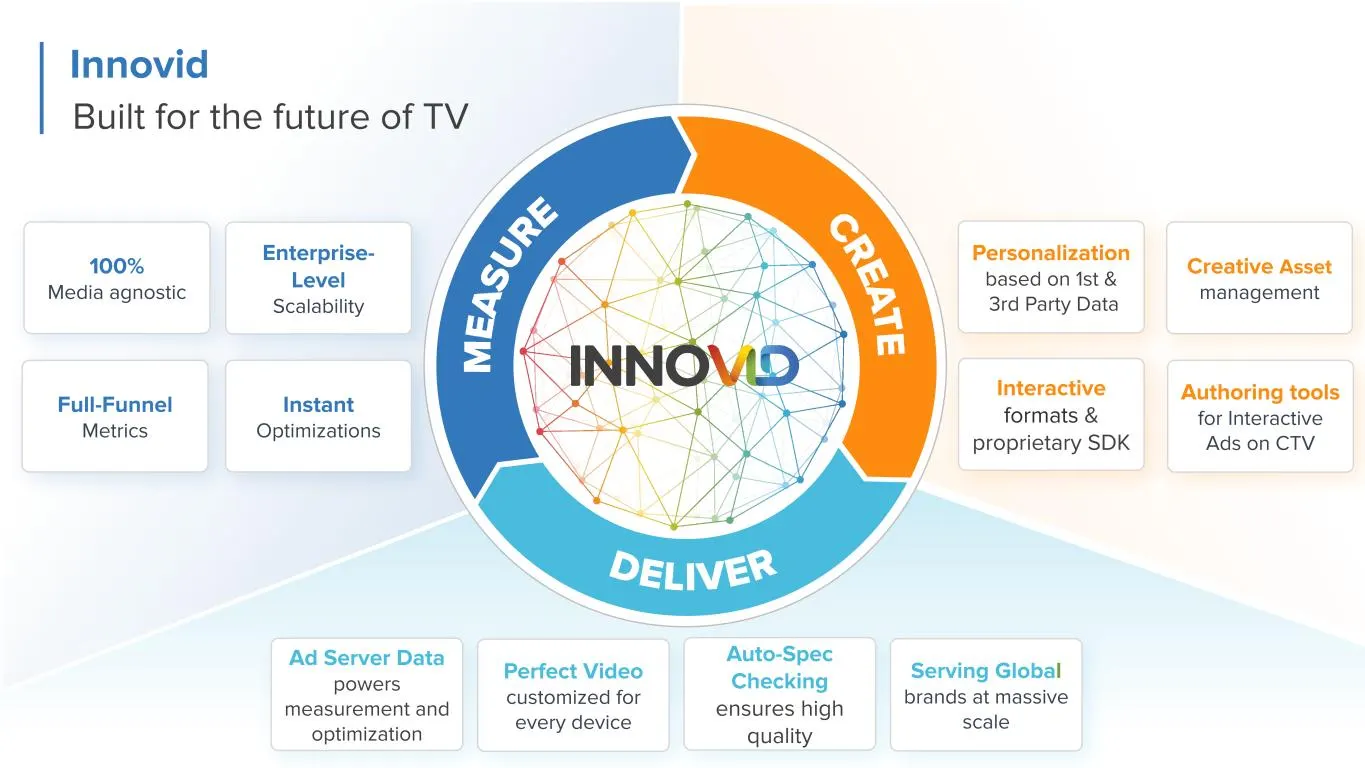
Innovid Built for the future of TV Creative Asset management Personalization based on 1st & 3rd Party Data Authoring tools for Interactive Ads on CTV Interactive formats & proprietary SDK 100% Media agnostic Full-Funnel Metrics Instant Optimizations Enterprise- Level Scalability Perfect Video custom
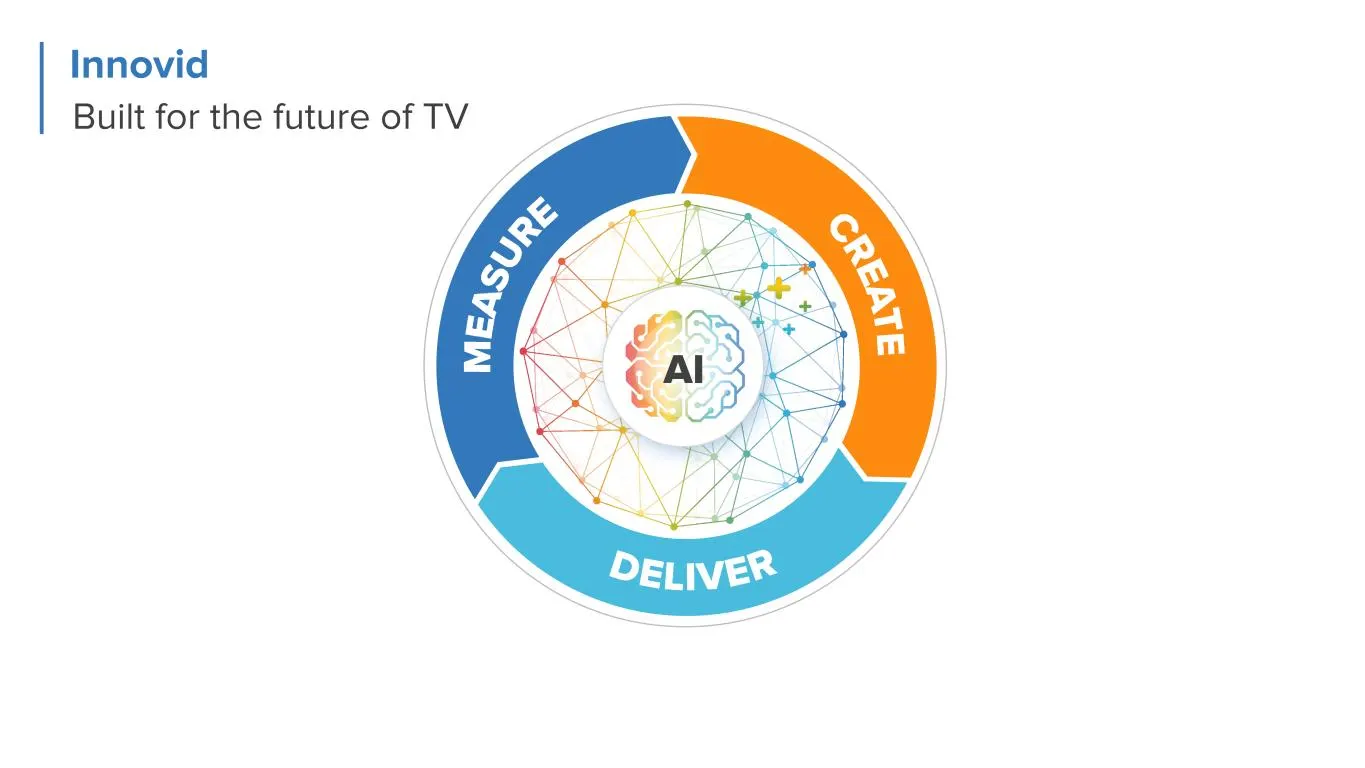
Slide 34: Built for the future of TV: AI
Innovid Built for the future of TV AI
Slide 35: Capturing the Market Momentum
Capturing the Market Momentum Dave Helmreich Chief Commercial Officer
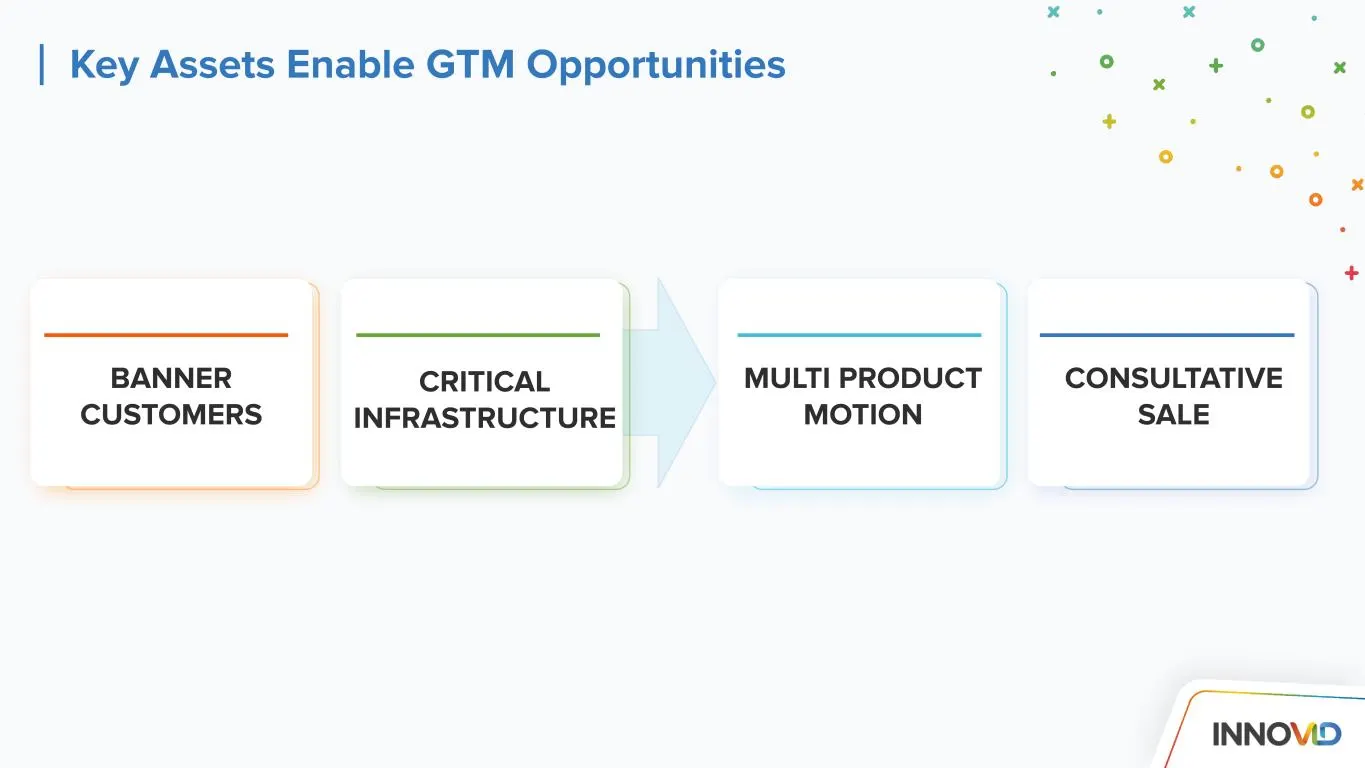
Slide 36: Key Assets Enable GTM Opportunities
Key Assets Enable GTM Opportunities MULTI PRODUCT MOTION CONSULTATIVE SALE BANNER CUSTOMERS CRITICAL INFRASTRUCTURE
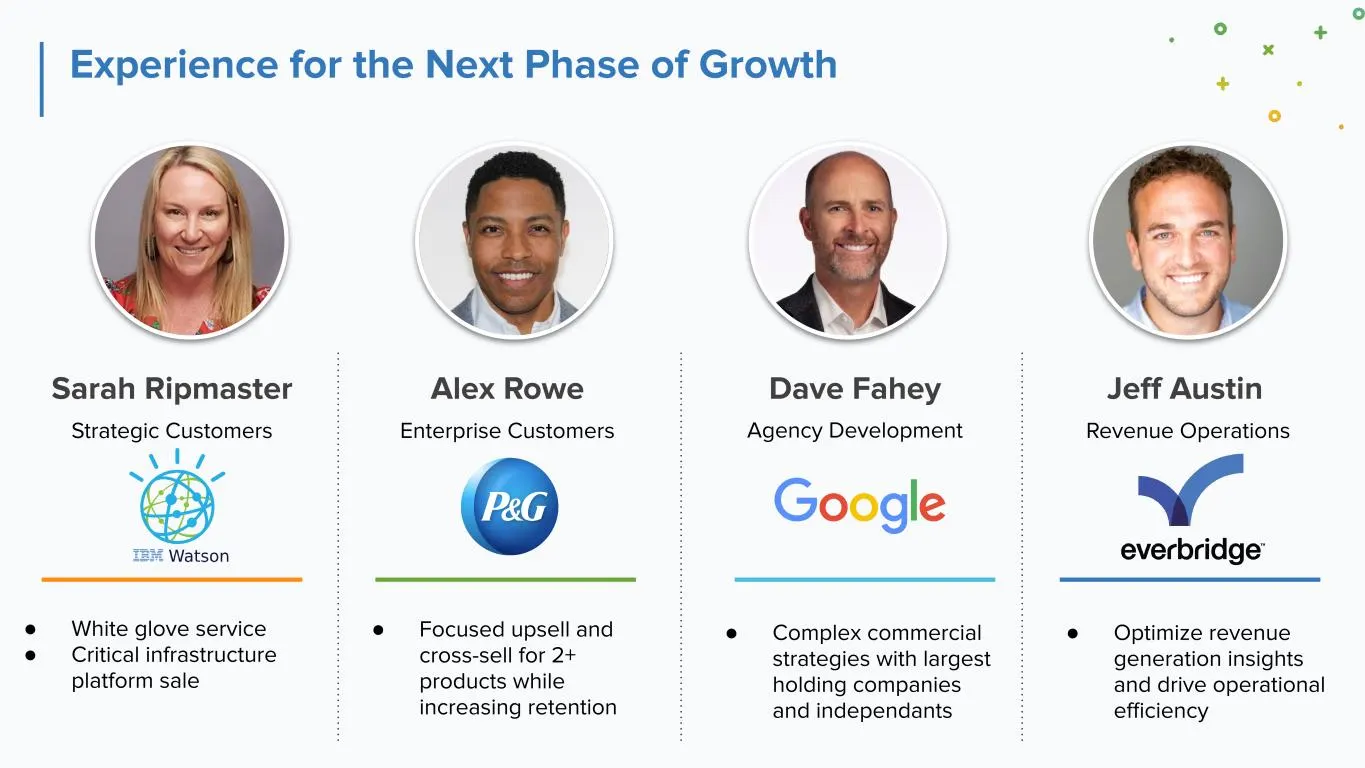
Slide 37: Experience for the Next Phase of Growth
Experience for the Next Phase of Growth Sarah Ripmaster Alex Rowe Dave Fahey Jeff Austin Enterprise Customers Agency Development Revenue OperationsStrategic Customers ● White glove service ● Critical infrastructure platform sale ● Complex commercial strategies with largest holding companies and inde
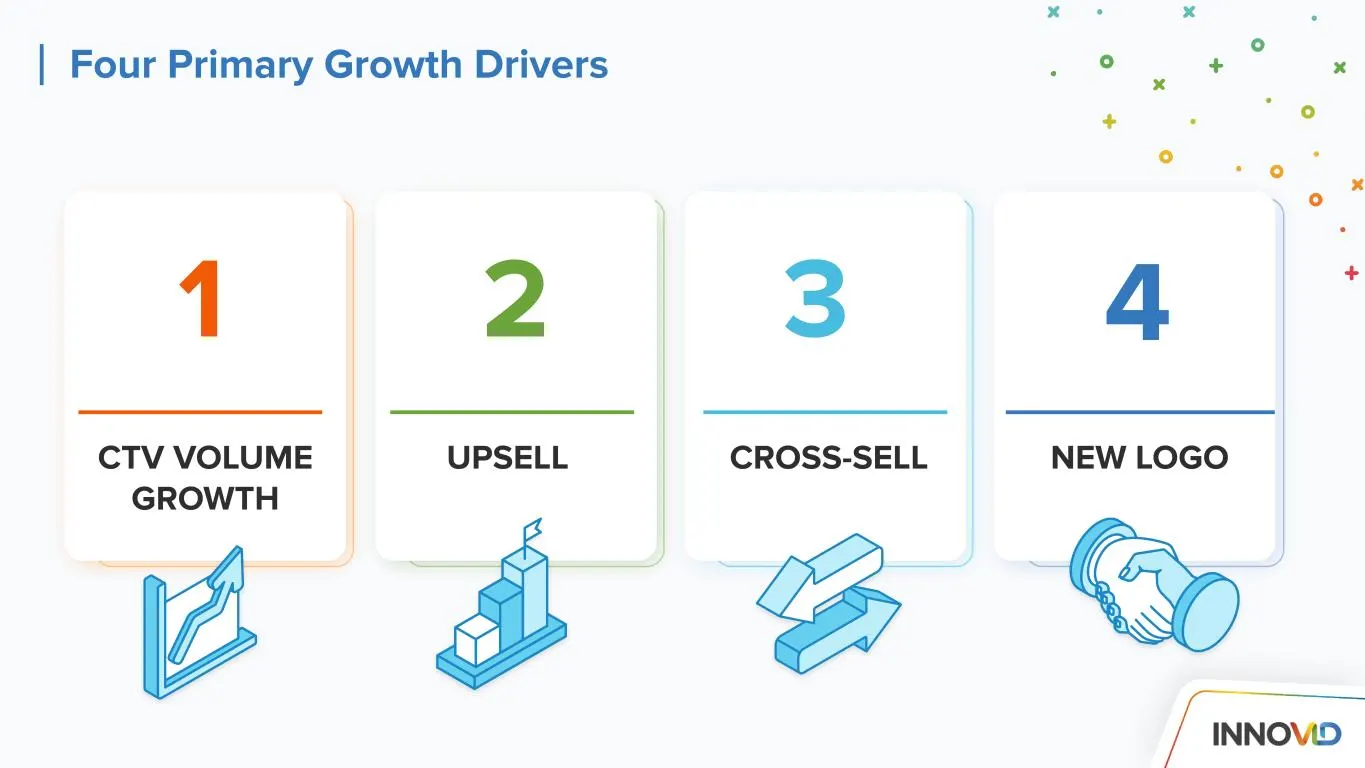
Slide 38: Four Primary Growth Drivers
Four Primary Growth Drivers CTV VOLUME GROWTH CROSS-SELLUPSELL NEW LOGO 1 32 4
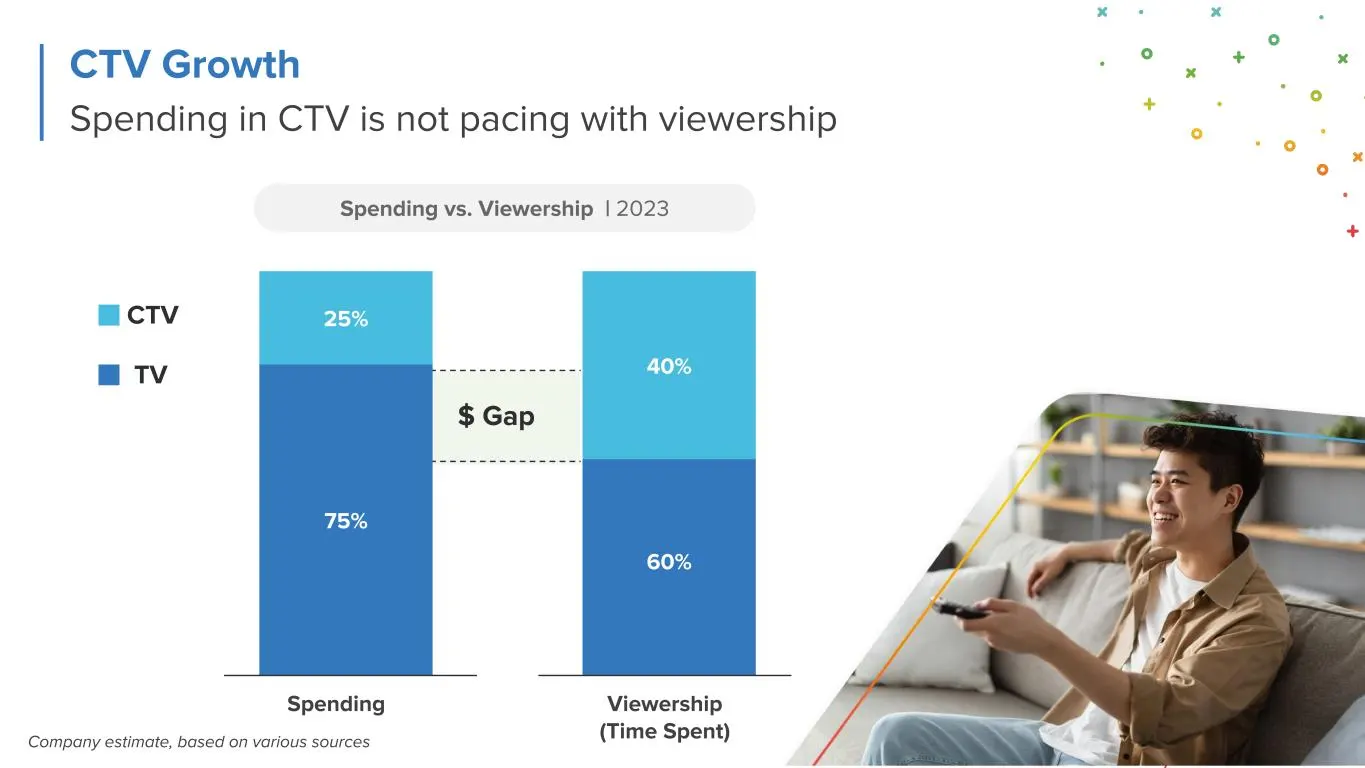
Slide 39: Spending vs. Viewership 2023
Company estimate, based on various sources Spending vs. Viewership | 2023 60% 40% Viewership (Time Spent) Spending Spending in CTV is not pacing with viewership CTV Growth TV CTV 25% 75% $ Gap
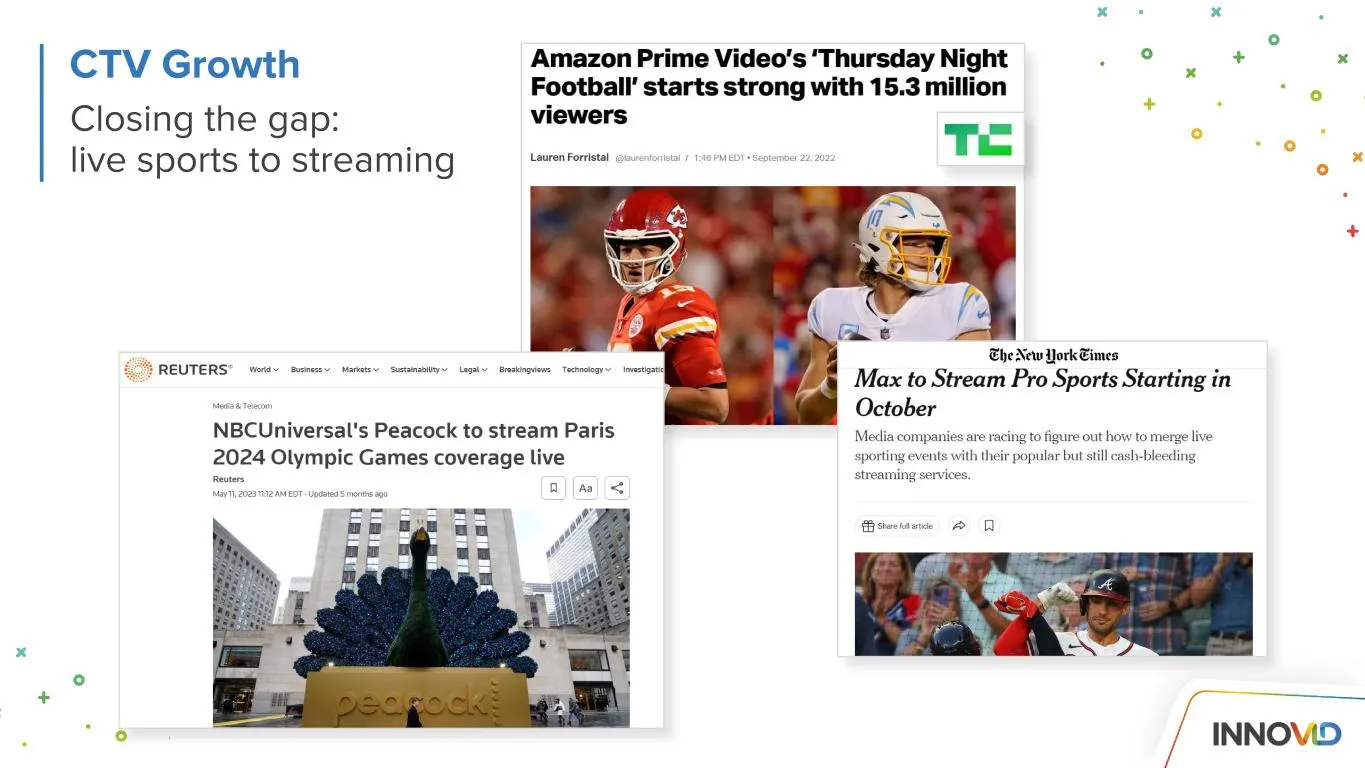
Slide 40: Closing the gap: live sports to streaming
Closing the gap: live sports to streaming CTV Growth
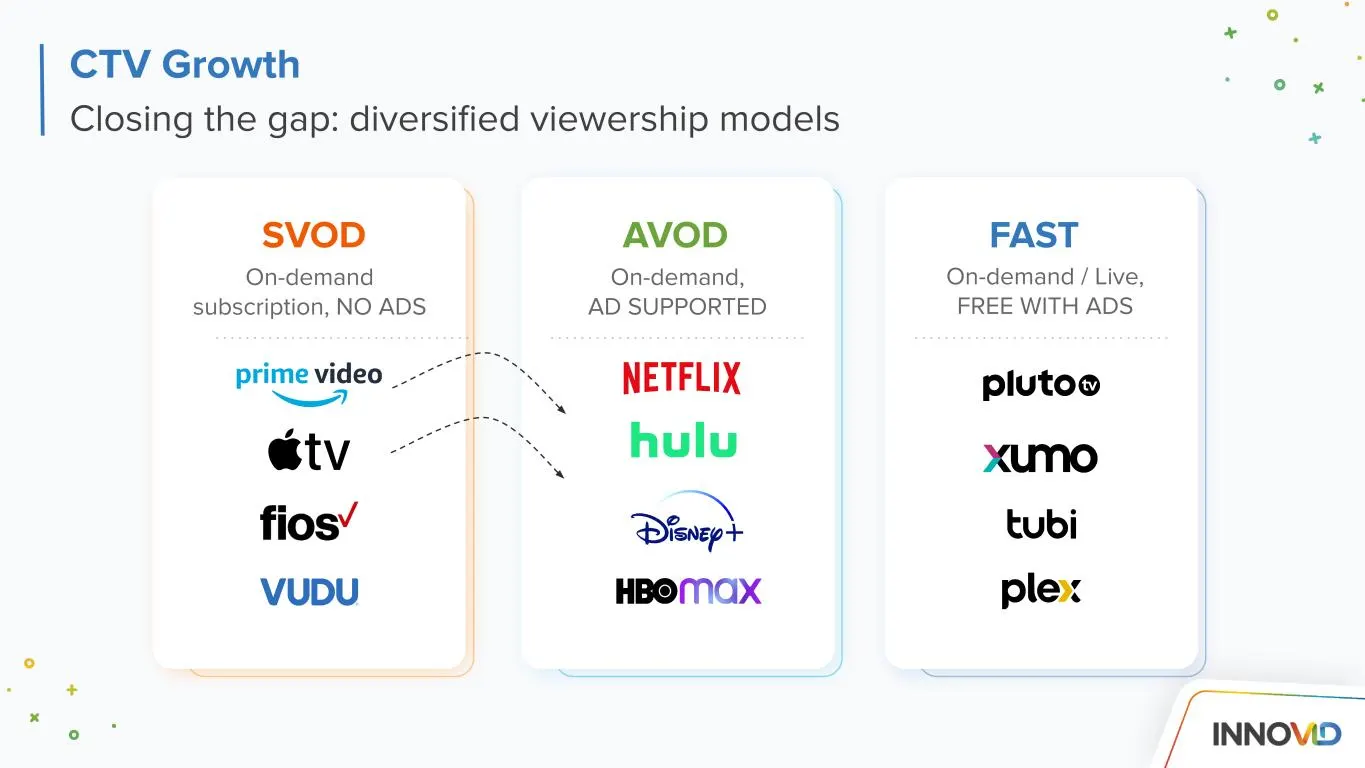
Slide 41: Closing the gap: diversified viewership models
Closing the gap: diversified viewership models CTV Growth SVOD AVOD FAST On-demand subscription, NO ADS On-demand, AD SUPPORTED On-demand / Live, FREE WITH ADS
Slide 42: Existing customer loyalty
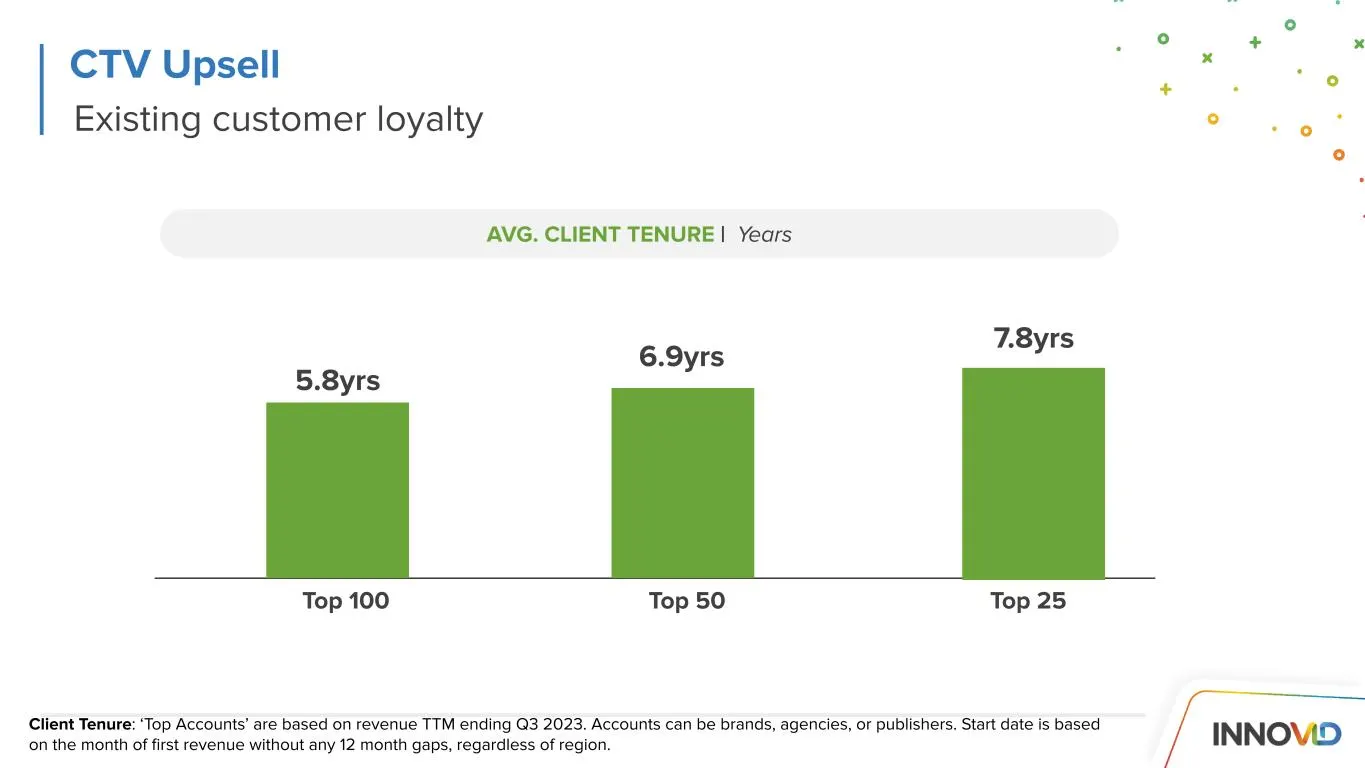
Existing customer loyalty CTV Upsell 6.9yrs AVG. CLIENT TENURE | Years Top 50 Client Tenure: ‘Top Accounts’ are based on revenue TTM ending Q3 2023. Accounts can be brands, agencies, or publishers. Start date is based on the month of first revenue without any 12 month gaps, regardless of region. Top
Slide 43: Customer Highlight: Upsell
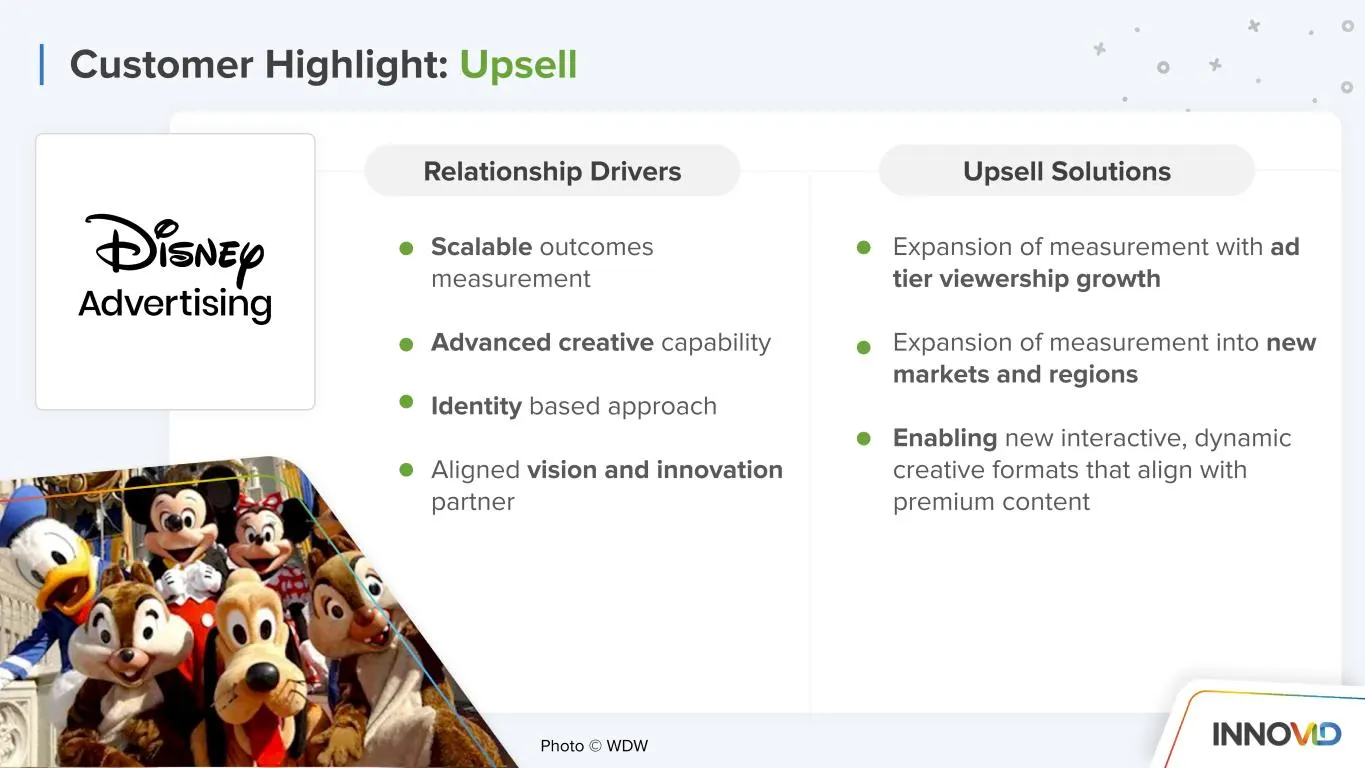
Scalable outcomes measurement Advanced creative capability Identity based approach Aligned vision and innovation partner Expansion of measurement with ad tier viewership growth Expansion of measurement into new markets and regions Enabling new interactive, dynamic creative formats that align with pr
Slide 44: CTV Cross-Sell Case Study
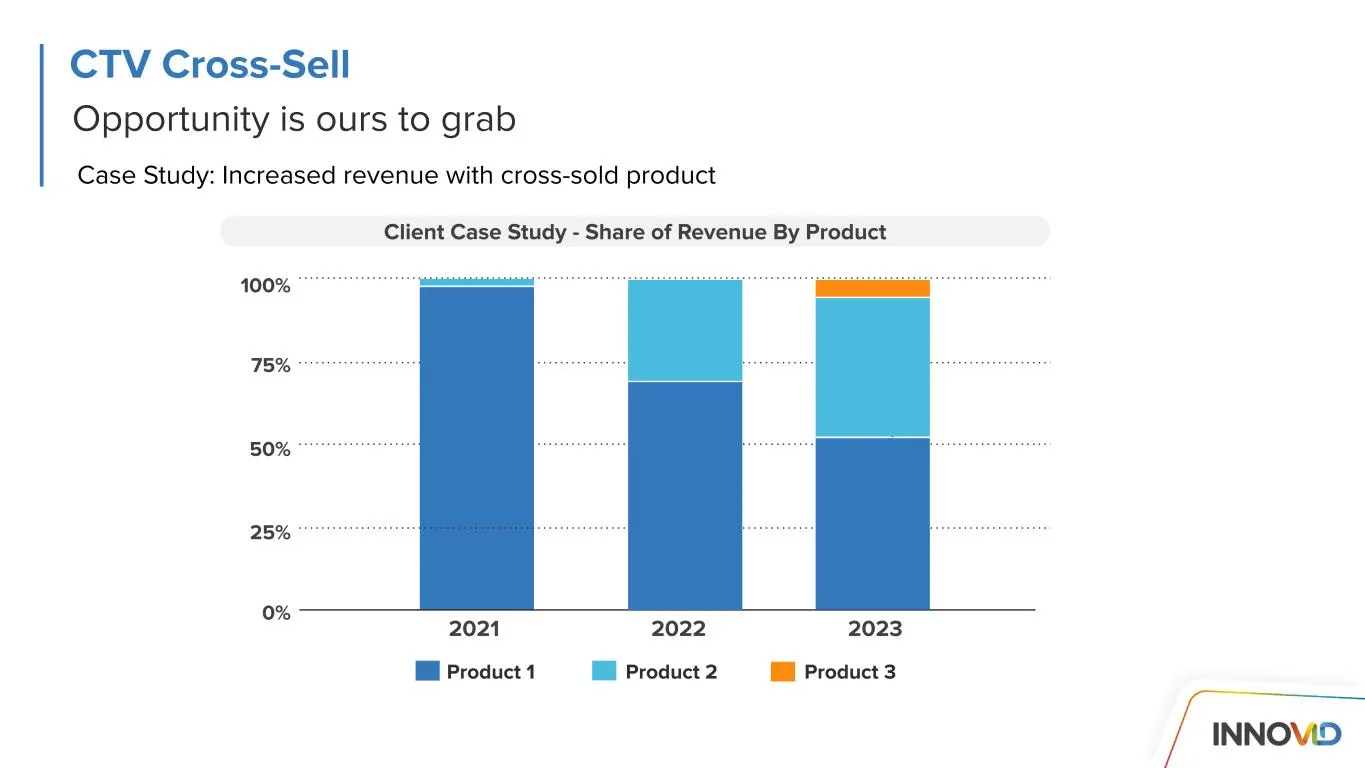
Opportunity is ours to grab CTV Cross-Sell Case Study: Increased revenue with cross-sold product 18% 8% 2022 2023 Q3 50% 75% 100% 25% 0% 2021 2022 2023 Client Case Study - Share of Revenue By Product Product 1 Product 2 Product 3
Slide 45: Customer Highlight: Cross-Sell
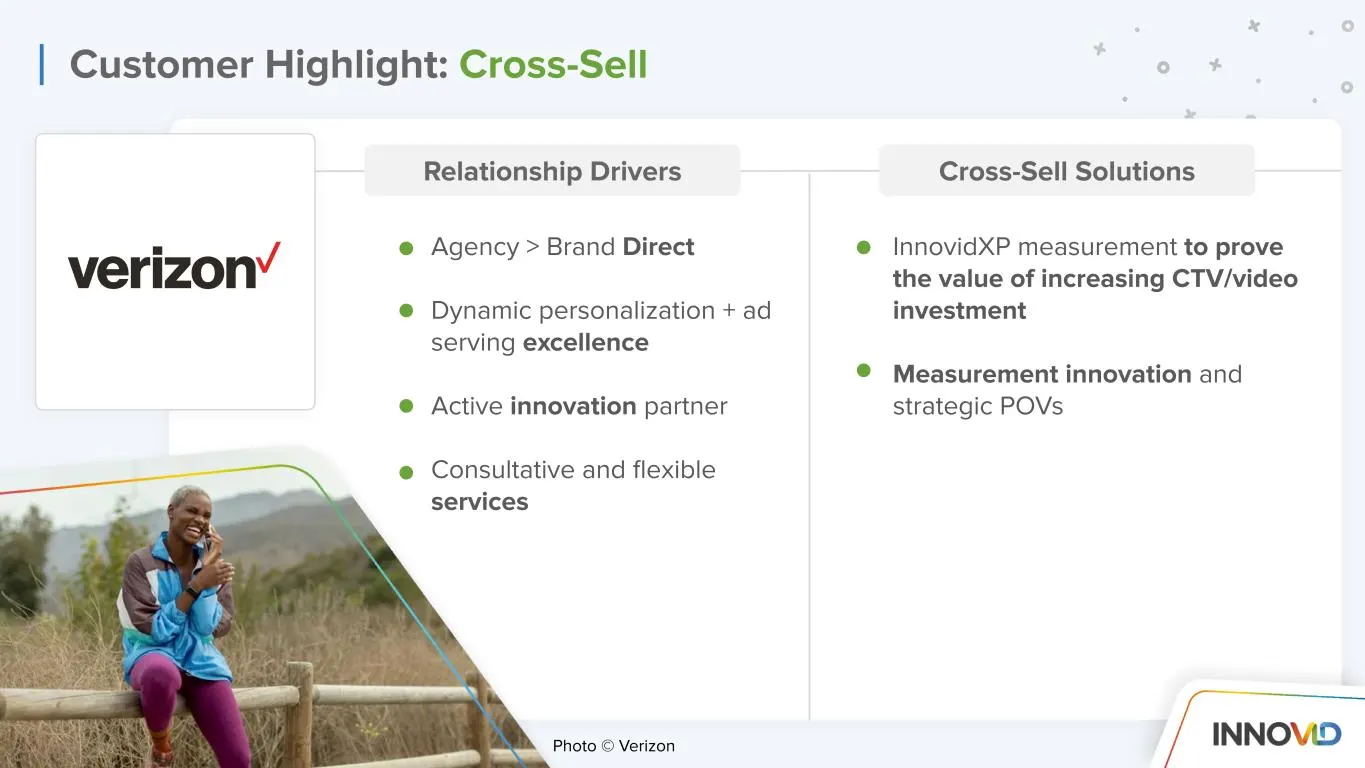
Agency > Brand Direct Dynamic personalization + ad serving excellence Active innovation partner Consultative and flexible services InnovidXP measurement to prove the value of increasing CTV/video investment Measurement innovation and strategic POVs Customer Highlight: Cross-Sell Relationship Drivers
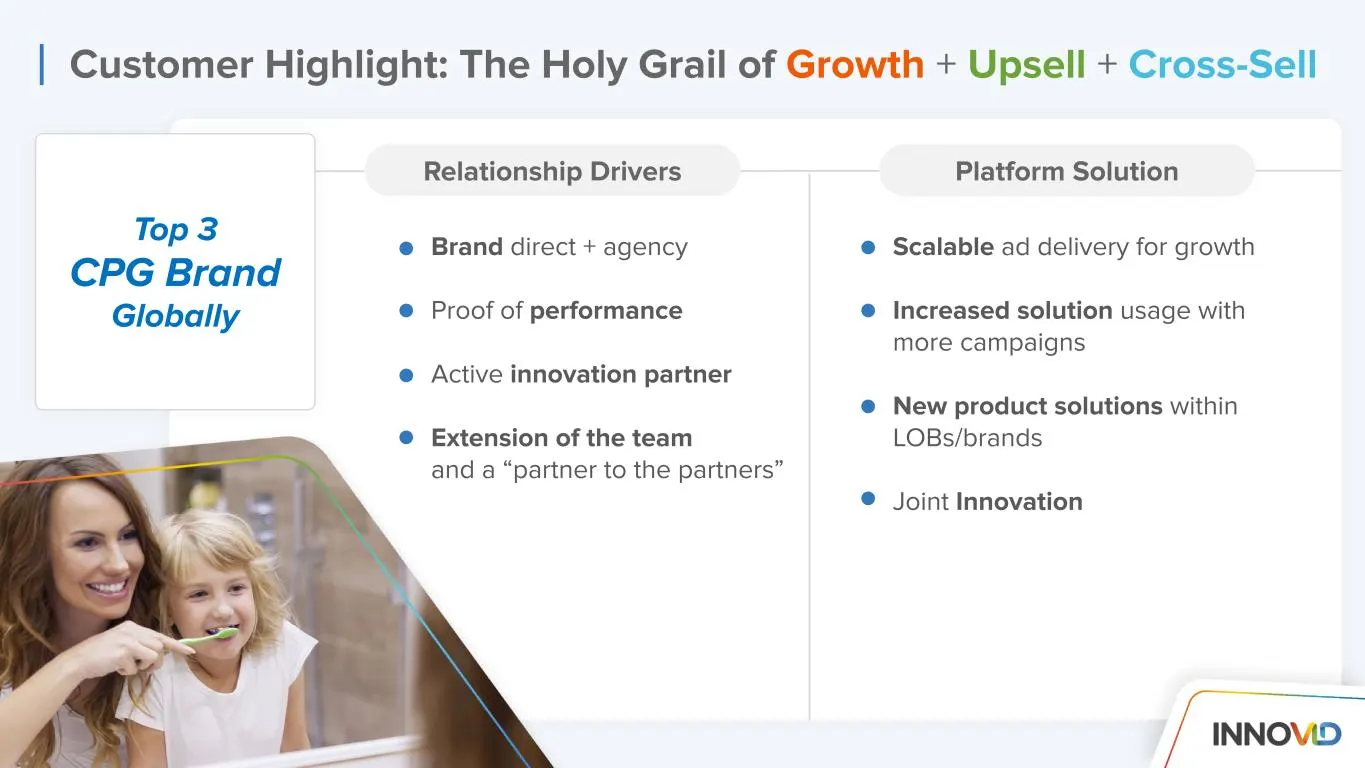
Slide 46: Customer Highlight: Growth + Upsell + Cross-Sell
Brand direct + agency Proof of performance Active innovation partner Extension of the team and a “partner to the partners” Scalable ad delivery for growth Increased solution usage with more campaigns New product solutions within LOBs/brands Joint Innovation Customer Highlight: The Holy Grail of Grow
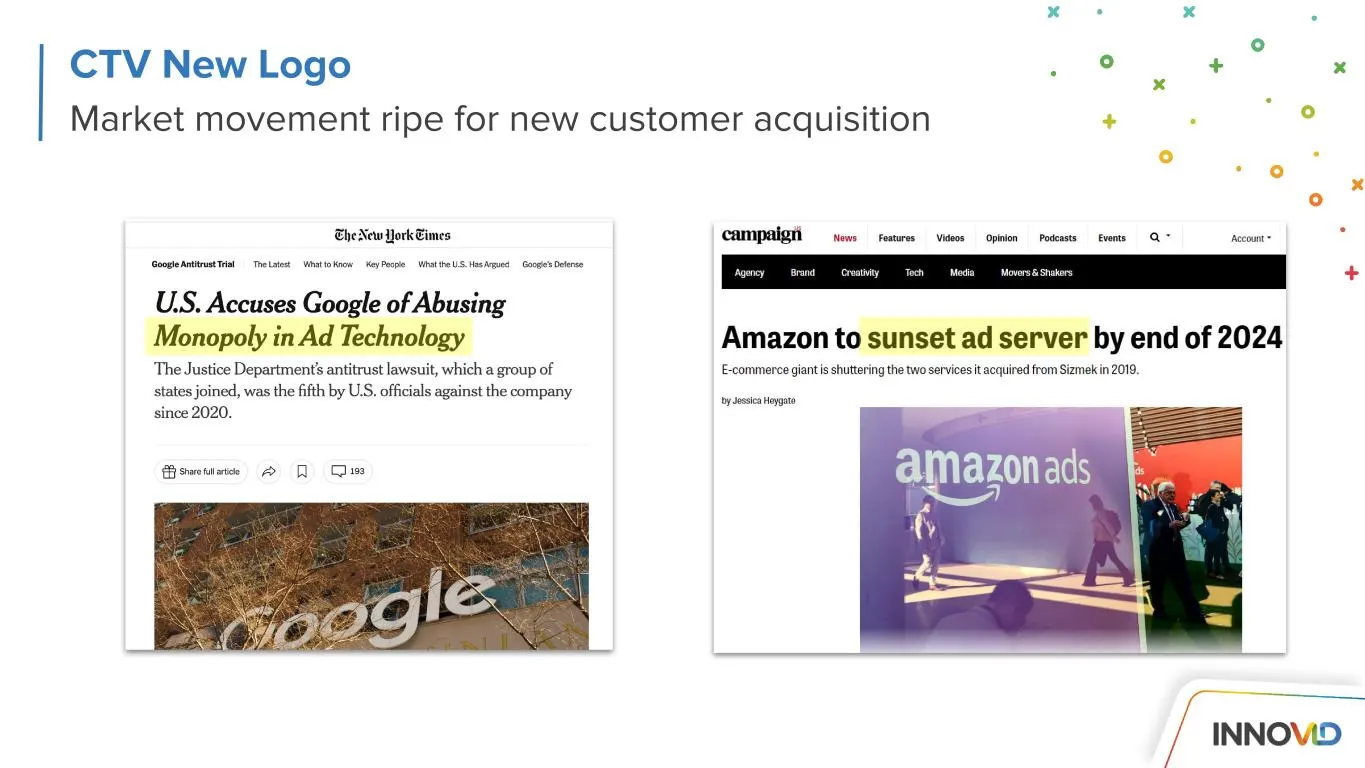
Slide 47: CTV New Logo
Market movement ripe for new customer acquisition CTV New Logo
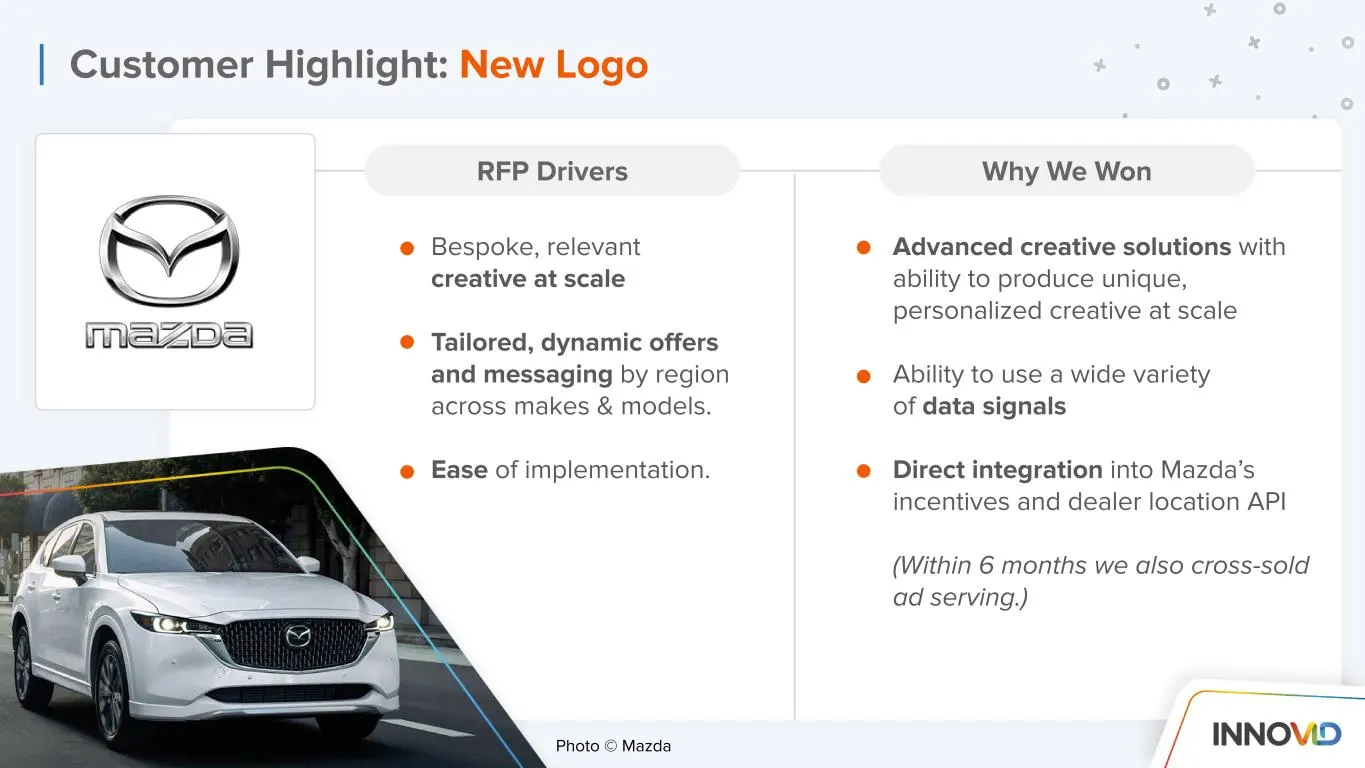
Slide 48: Customer Highlight: New Logo
RFP Drivers Why We Won Bespoke, relevant creative at scale Tailored, dynamic offers and messaging by region across makes & models. Ease of implementation. Advanced creative solutions with ability to produce unique, personalized creative at scale Ability to use a wide variety of data signals Direct i
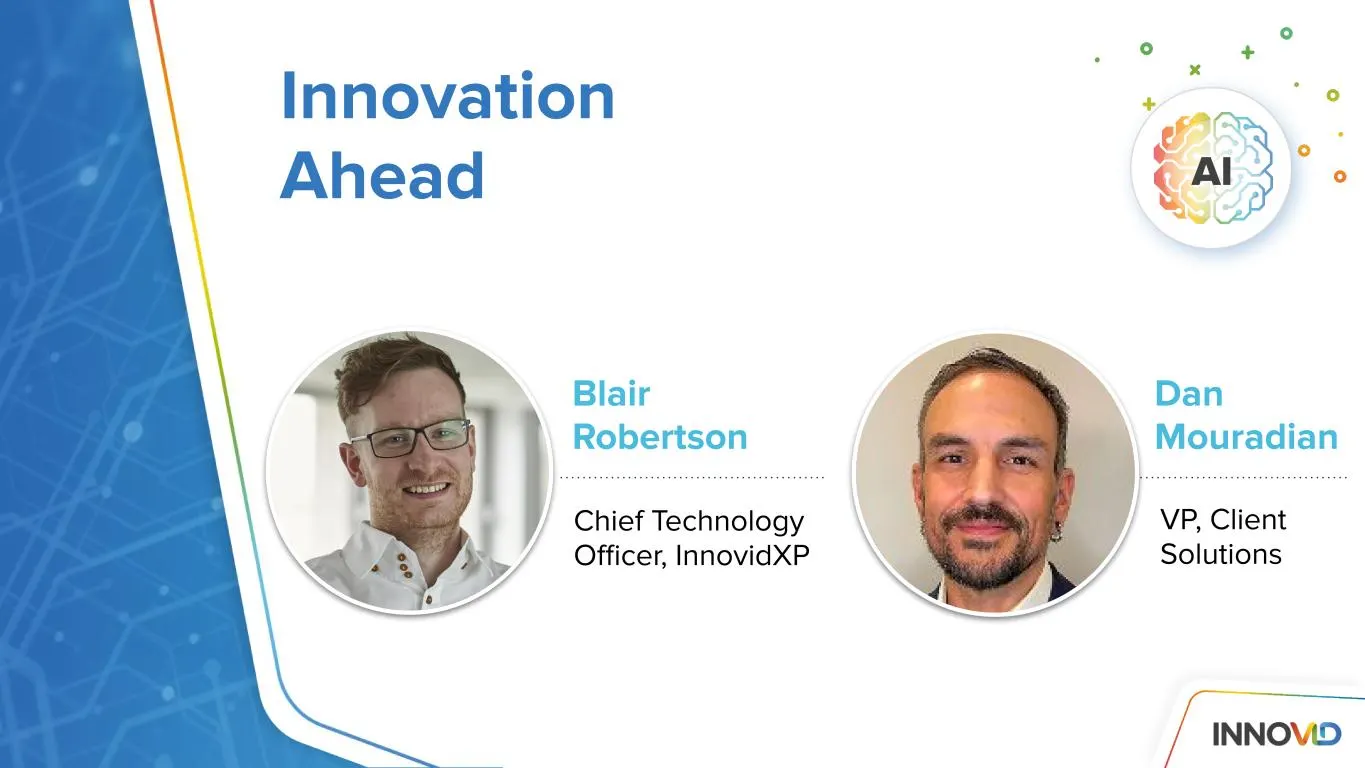
Slide 49: Innovation Ahead
Innovation Ahead VP, Client Solutions Blair Robertson Chief Technology Officer, InnovidXP Dan Mouradian AI
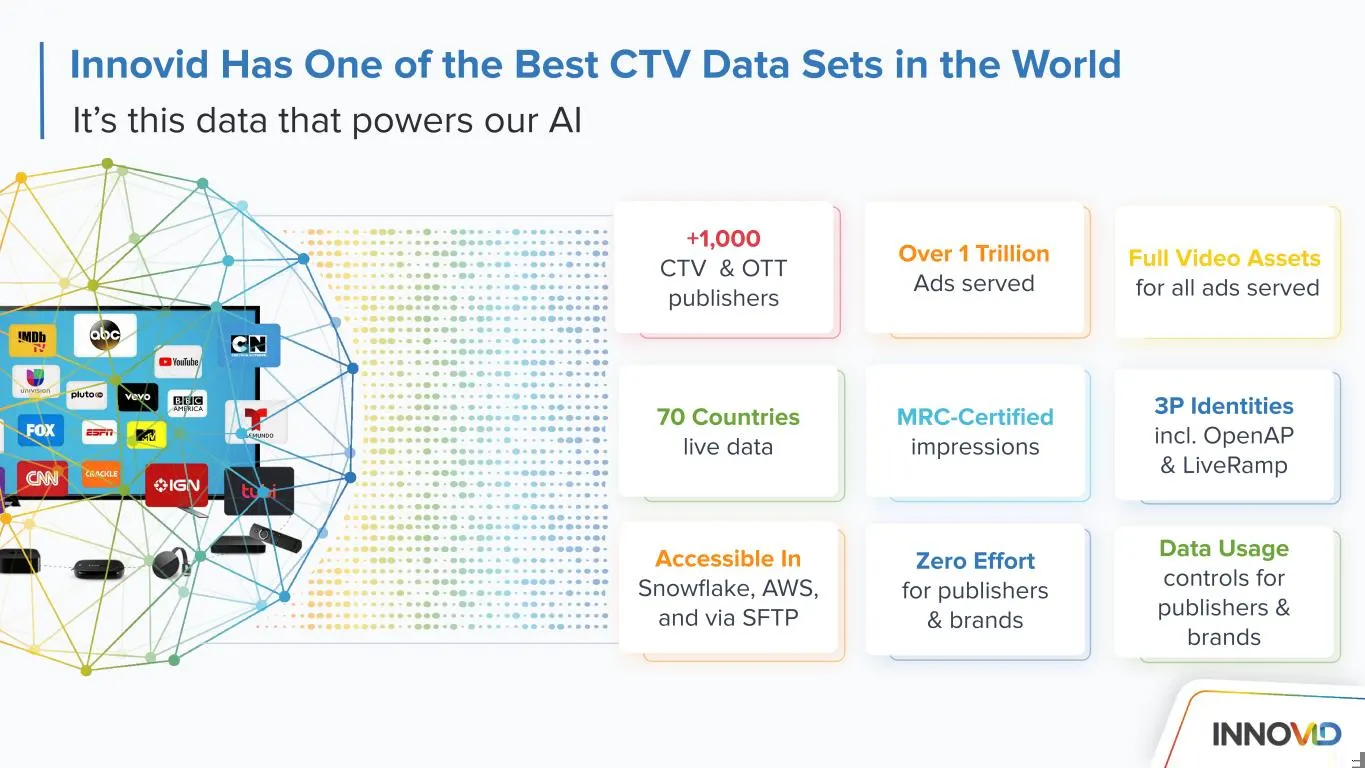
Slide 50: Innovid Has One of the Best CTV Data Sets in the World
ה Innovid Has One of the Best CTV Data Sets in the World It’s this data that powers our AI +1,000 CTV & OTT publishers Over 1 Trillion Ads served 70 Countries live data MRC-Certified impressions Accessible In Snowflake, AWS, and via SFTP Zero Effort for publishers & brands Full Video Assets for all
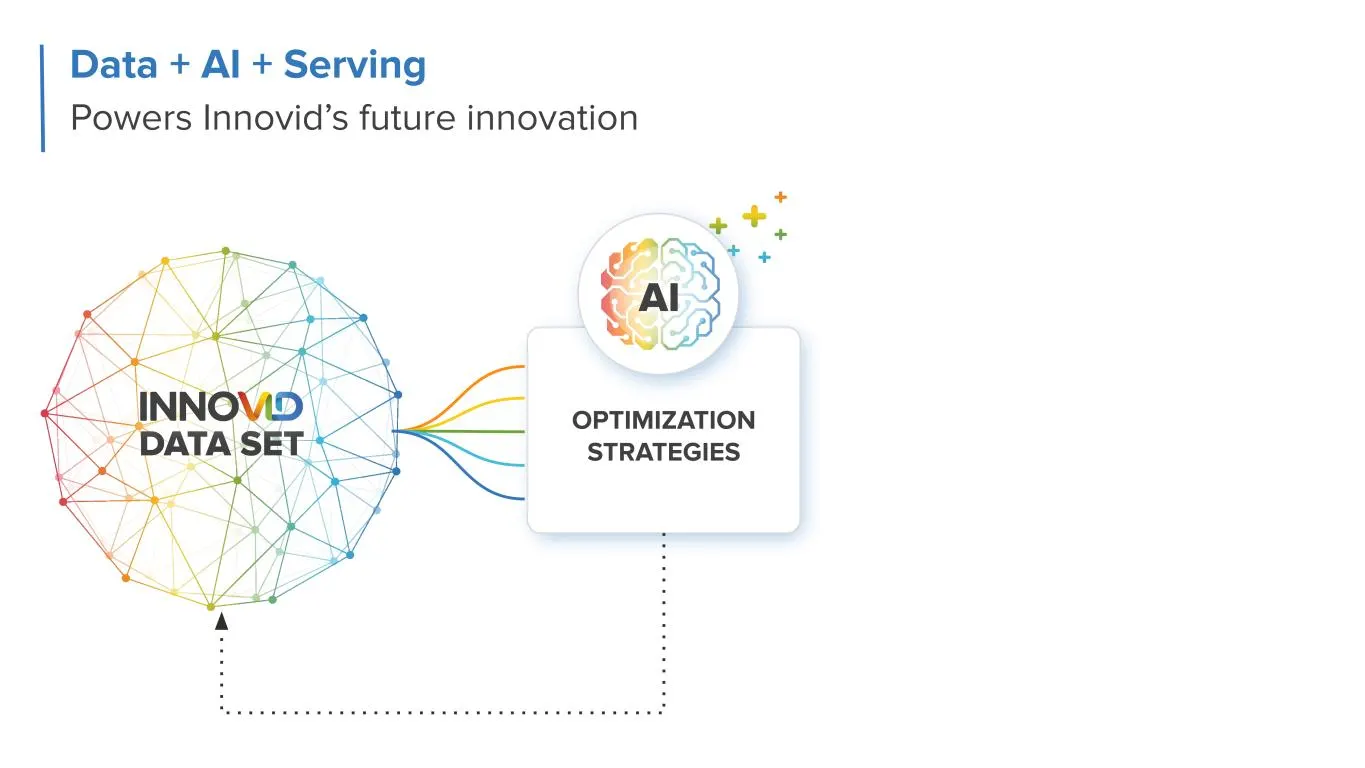
Slide 51: Data + AI + Serving Powers Innovid's future innovation
Data + AI + Serving Powers Innovid’s future innovation OPTIMIZATION STRATEGIES AI DATA SET
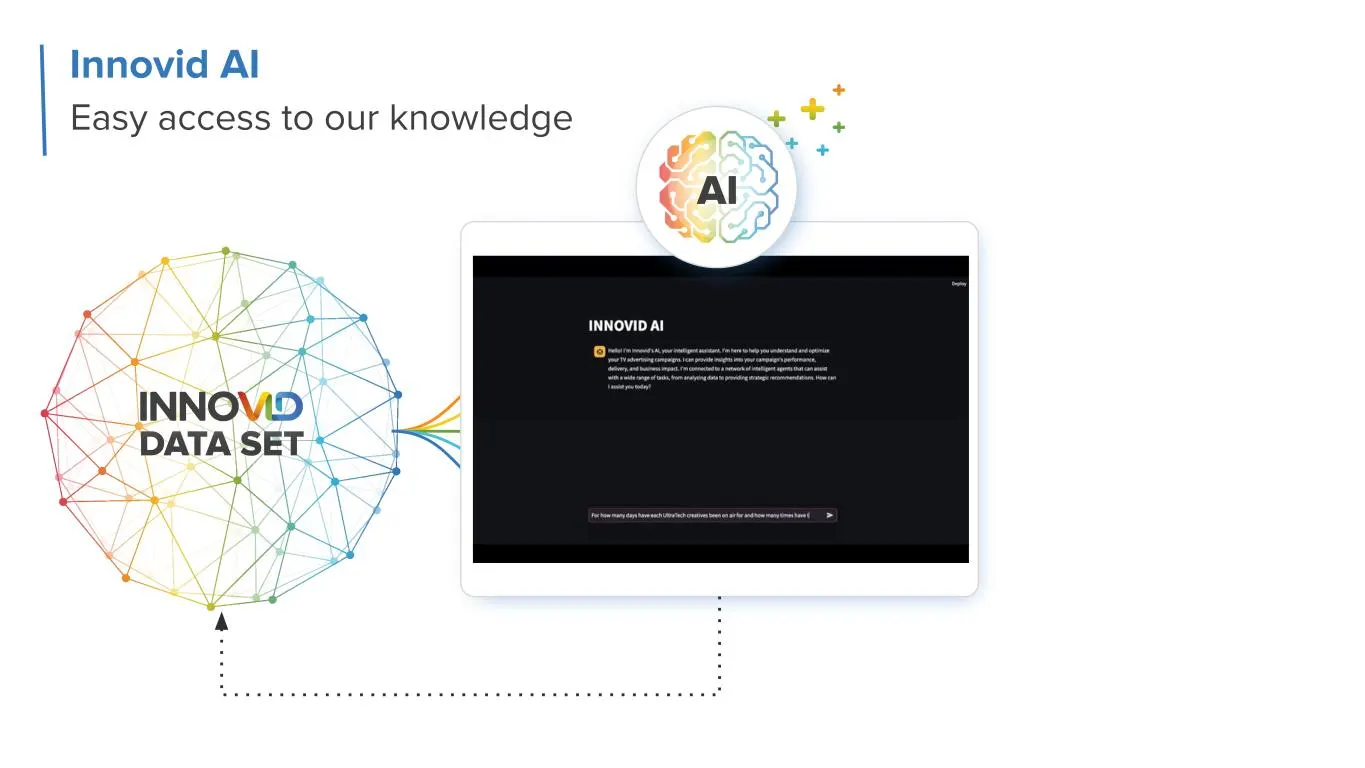
Slide 52: Innovid AI: Easy access to our knowledge
Innovid AI Easy access to our knowledge DATA SET AI
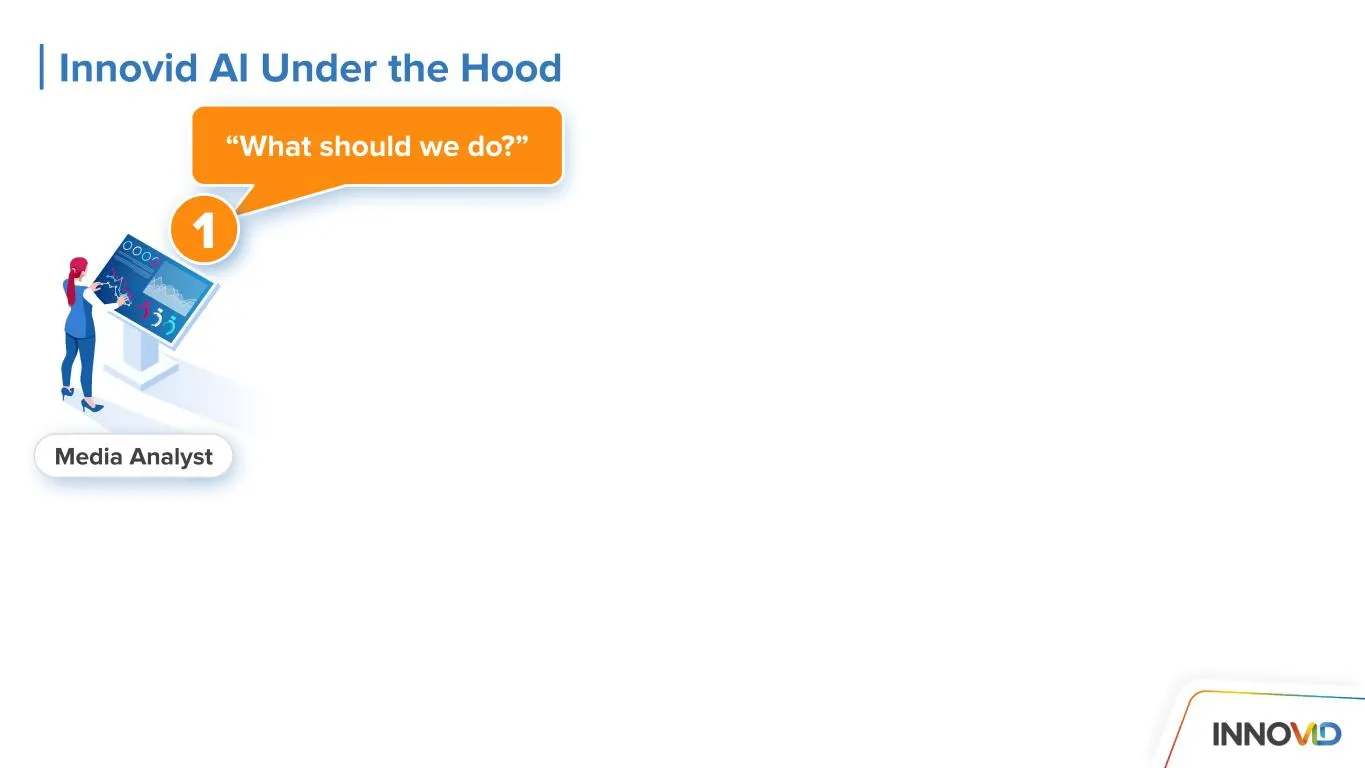
Slide 53: Innovid AI Under the Hood
“What should we do?” 11 Media Analyst Innovid AI Under the Hood
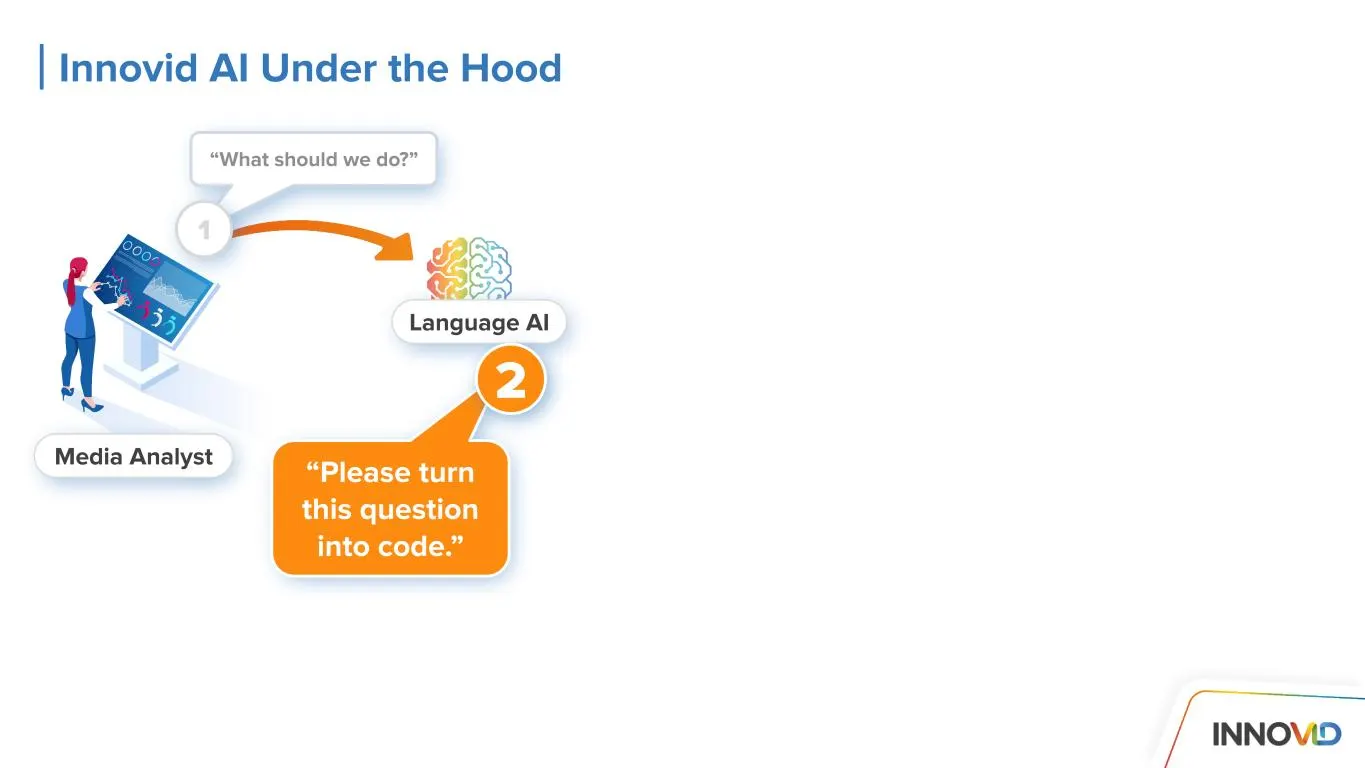
Slide 54: Innovid AI Under the Hood
Innovid AI Under the Hood Media Analyst Language AI “Please turn this question into code.” 2 “What should we do?” 1
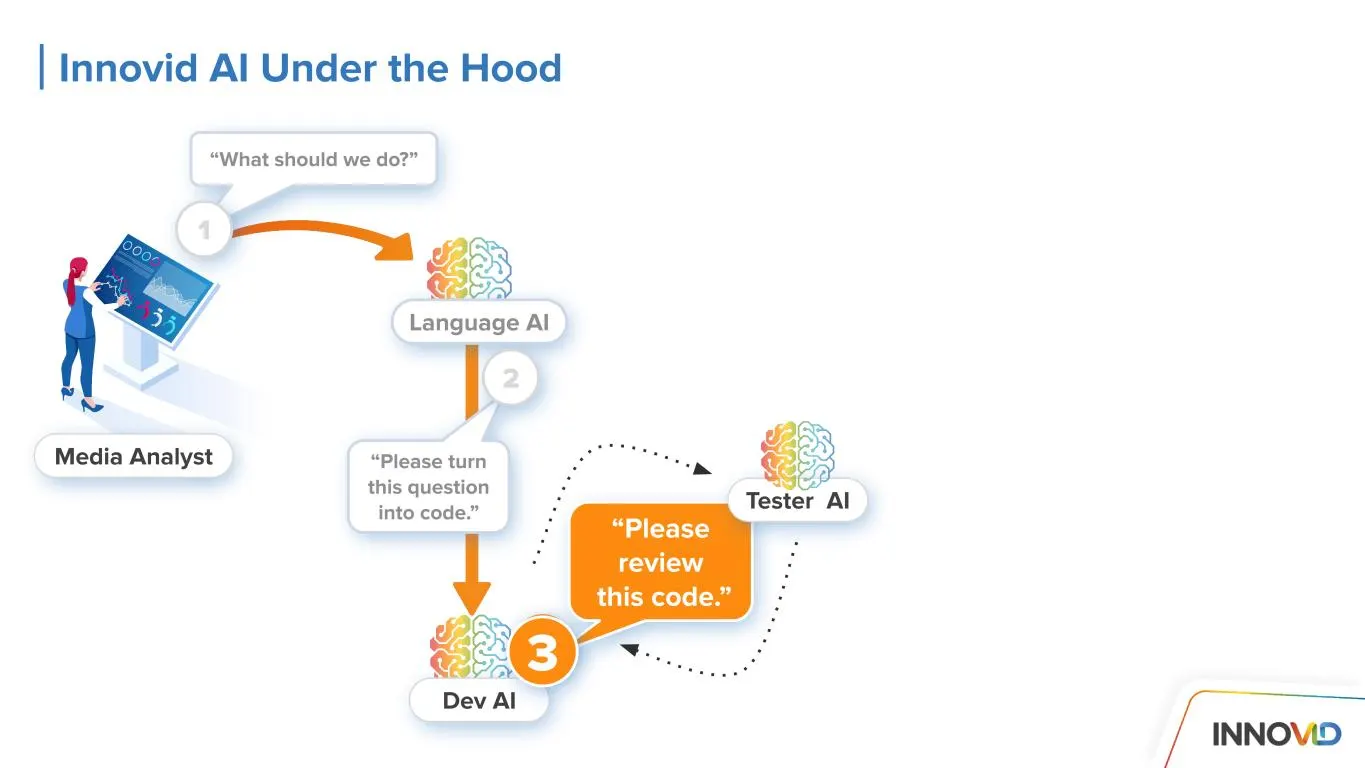
Slide 55: Innovid AI Under the Hood
Language AI “Please turn this question into code.” “Please review this code.” Tester AI Dev AI 33 Media Analyst 2 “What should we do?” 1 Innovid AI Under the Hood
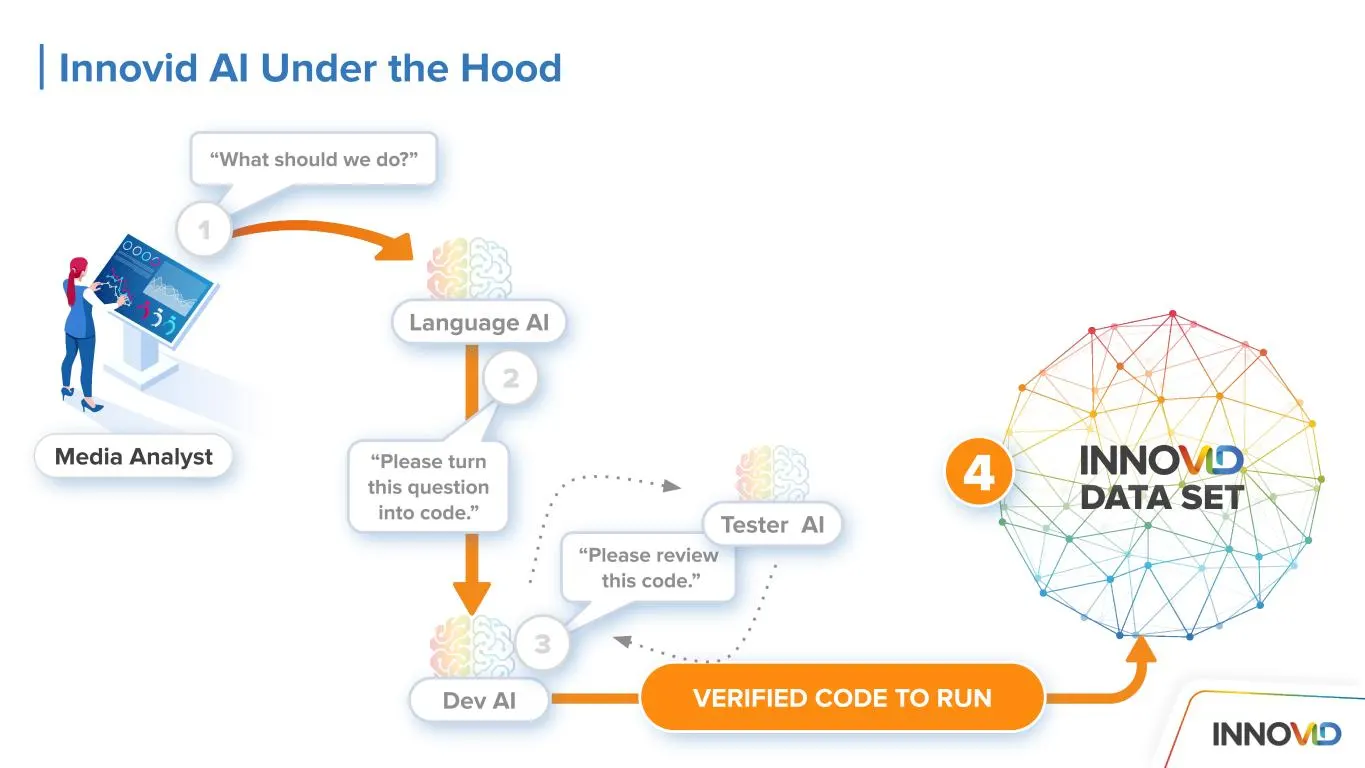
Slide 56: Innovid AI Under the Hood
“Please turn this question into code.” “Please review this code.” Language AI Tester AI Dev AI VERIFIED CODE TO RUN Media Analyst “What should we do?” 2 3 1 4 Innovid AI Under the Hood DATA SET
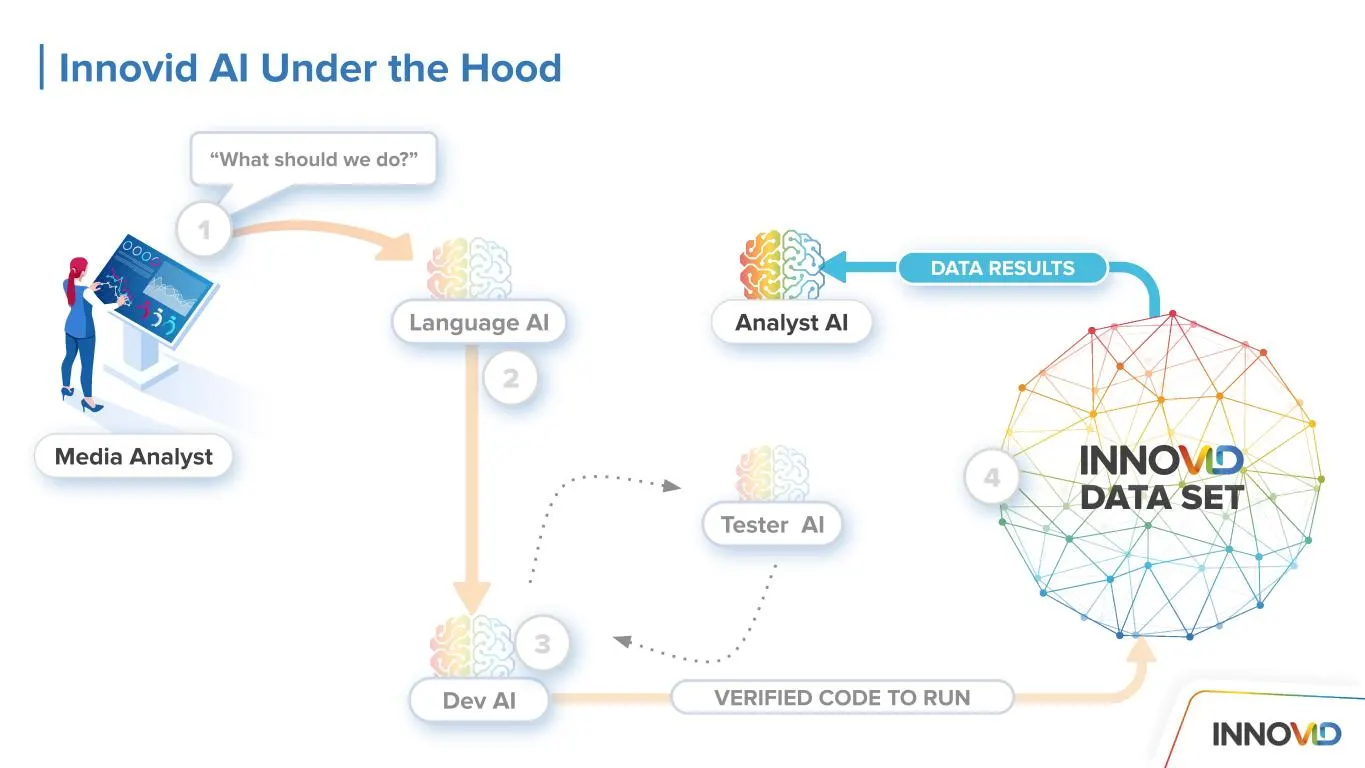
Slide 57: Innovid AI Under the Hood
Language AI Analyst AI Dev AI DATA RESULTS Media Analyst Tester AI “What should we do?” 2 OPTIMIZED CODE TO RUN 3 4 1 VERIFIED CODE TO RUN Innovid AI Under the Hood DATA SET
Slide 58: Innovid AI Under the Hood
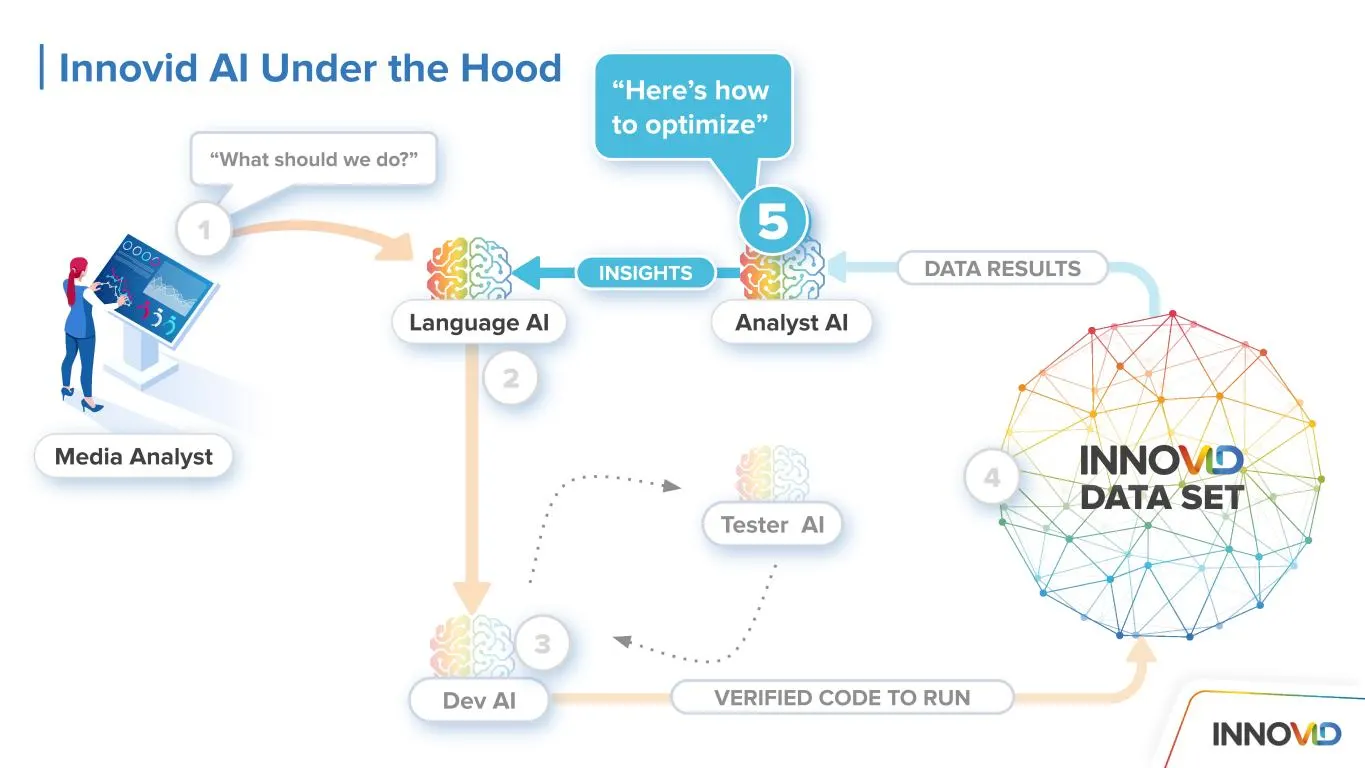
DATA RESULTS “Here’s how to optimize” Analyst AI 5 INSIGHTS 5 Language AI Dev AI Media Analyst Tester AI “What should we do?” 2 OPTIMIZED CODE TO RUN 3 4 1 VERIFIED CODE TO RUN Innovid AI Under the Hood DATA SET
Slide 59: Innovid AI Under the Hood
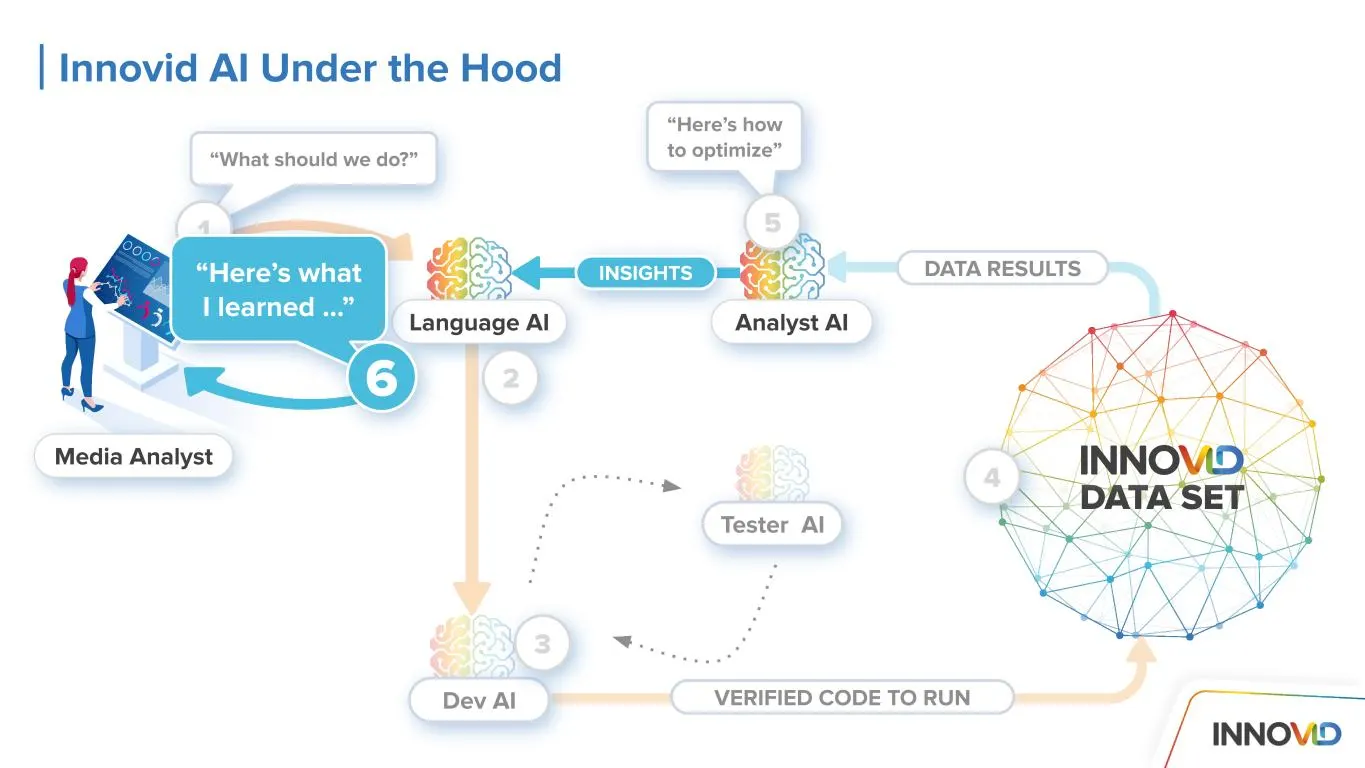
DATA RESULTS Analyst AILanguage AI Dev AI Media Analyst Tester AI “What should we do?” 2 OPTIMIZED CODE TO RUN 3 4 1 VERIFIED CODE TO RUN “Here’s what I learned …” 6 Innovid AI Under the Hood INSIGHTS DATA SET “Here’s how to optimize” 5
Slide 60: Innovid AI Under the Hood
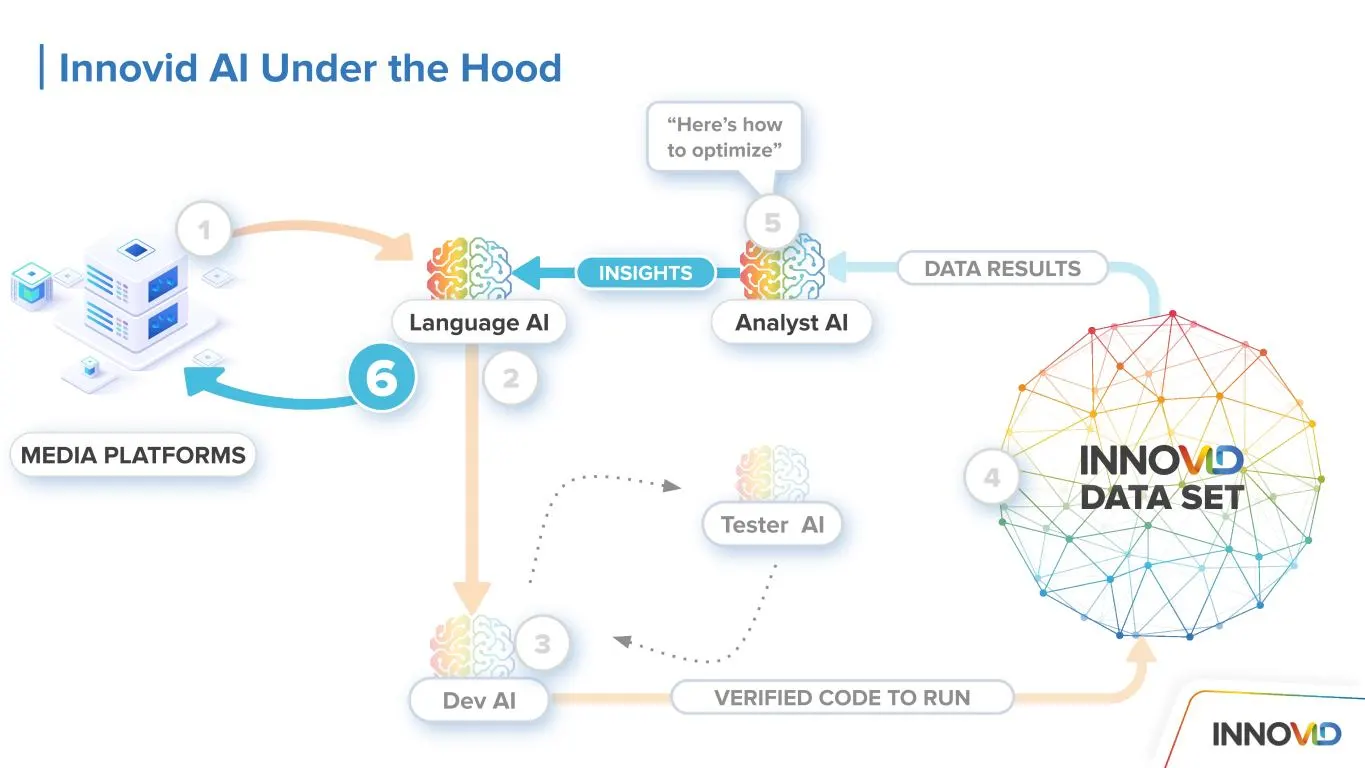
DATA RESULTS “Here’s how to optimize” Analyst AILanguage AI Dev AI MEDIA PLATFORMS Tester AI 2 OPTIMIZED CODE TO RUN 3 4 1 VERIFIED CODE TO RUN 6 Innovid AI Under the Hood INSIGHTS 5 DATA SET
Slide 61: Data + AI + Serving Powers Innovid's future innovation
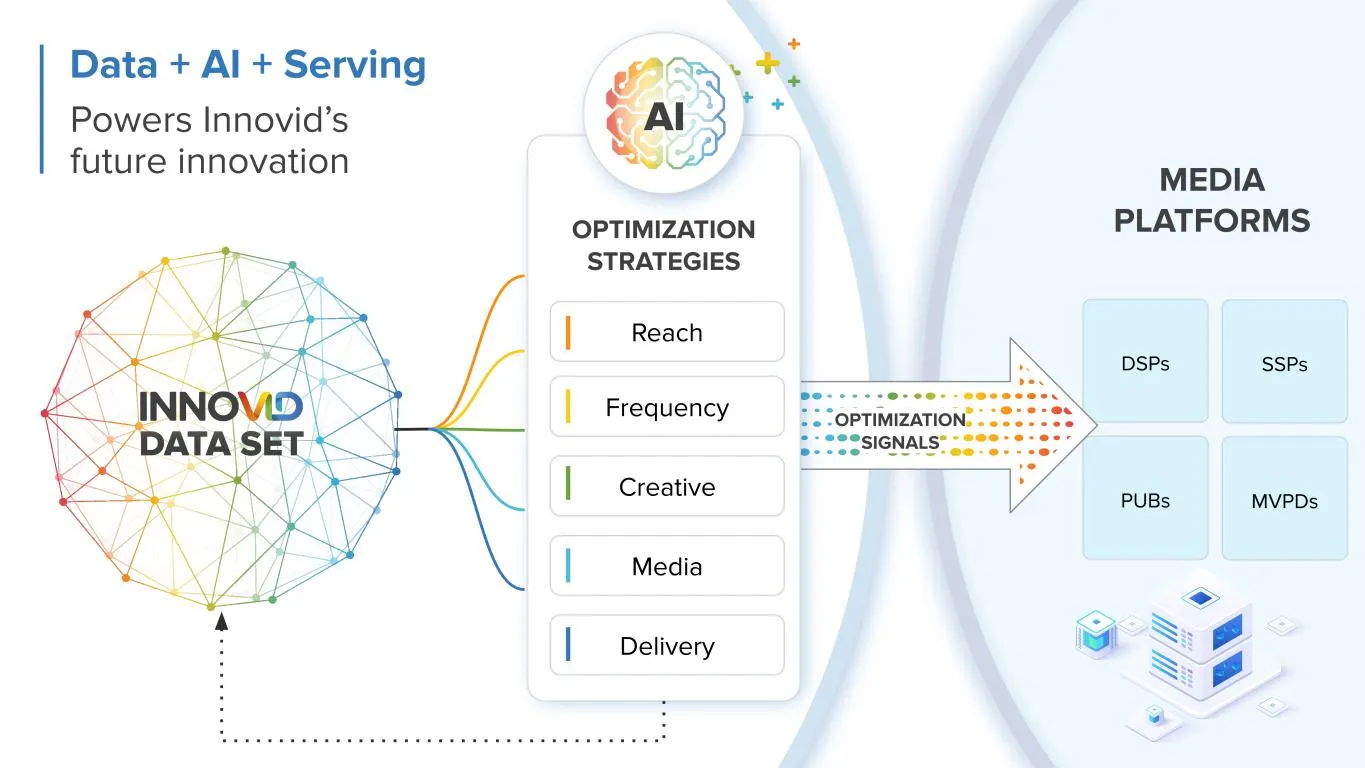
SSPs MVPDs DSPs PUBs MEDIA PLATFORMS Data + AI + Serving Powers Innovid’s future innovation OPTIMIZATION STRATEGIES Frequency Creative Media Delivery Reach AI DATA SET OPTIMIZATION SIGNALS
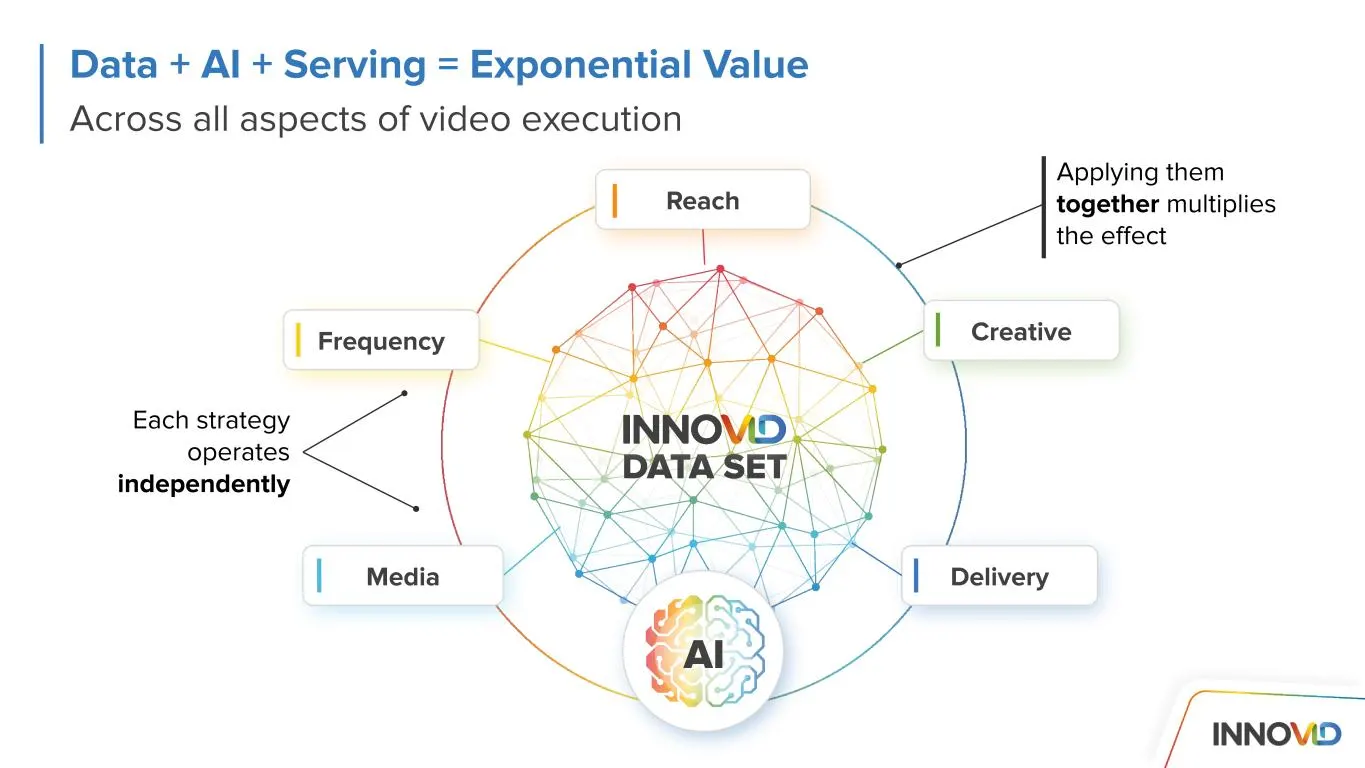
Slide 62: Data + AI + Serving = Exponential Value
Across all aspects of video execution Reach Each strategy operates independently Applying them together multiplies the effect Delivery Data + AI + Serving = Exponential Value CreativeFrequency Media AI DATA SET
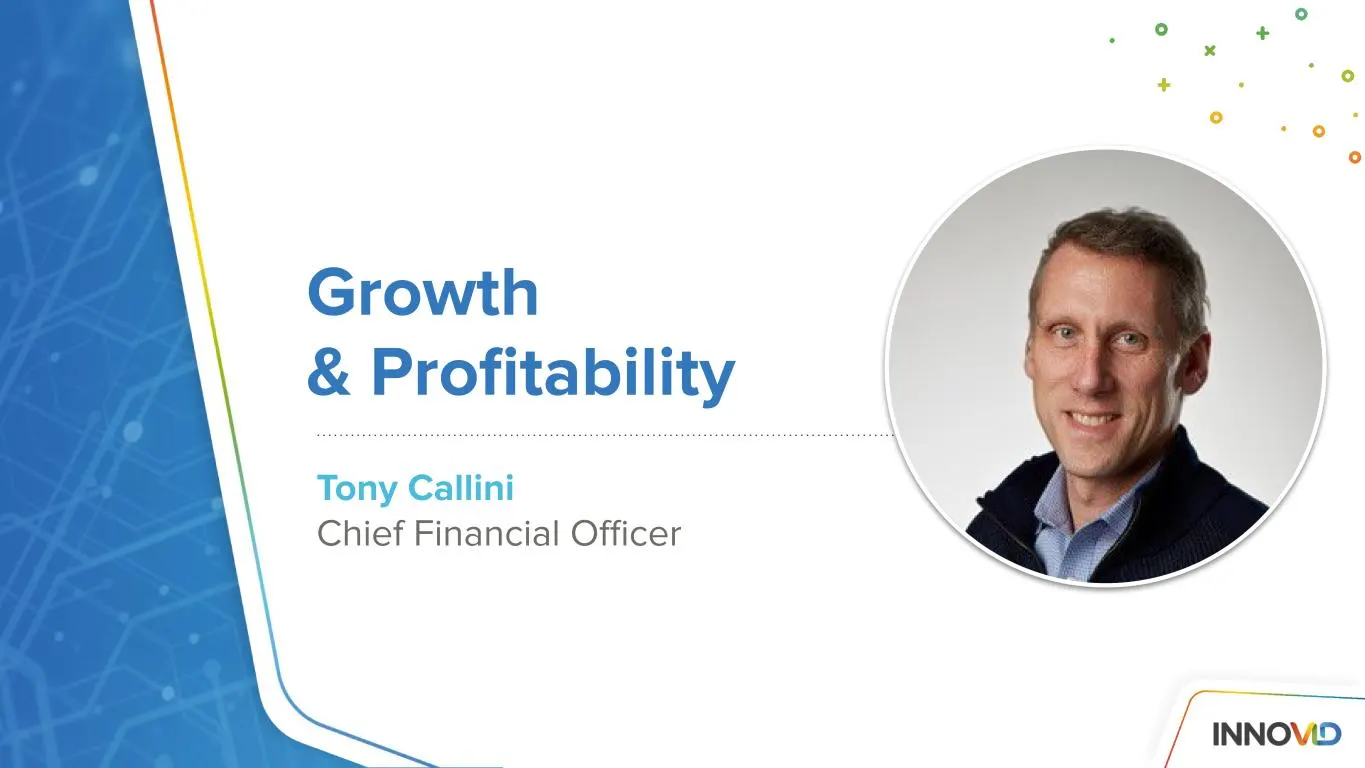
Slide 63: Growth & Profitability
Growth & Profitability Tony Callini Chief Financial Officer
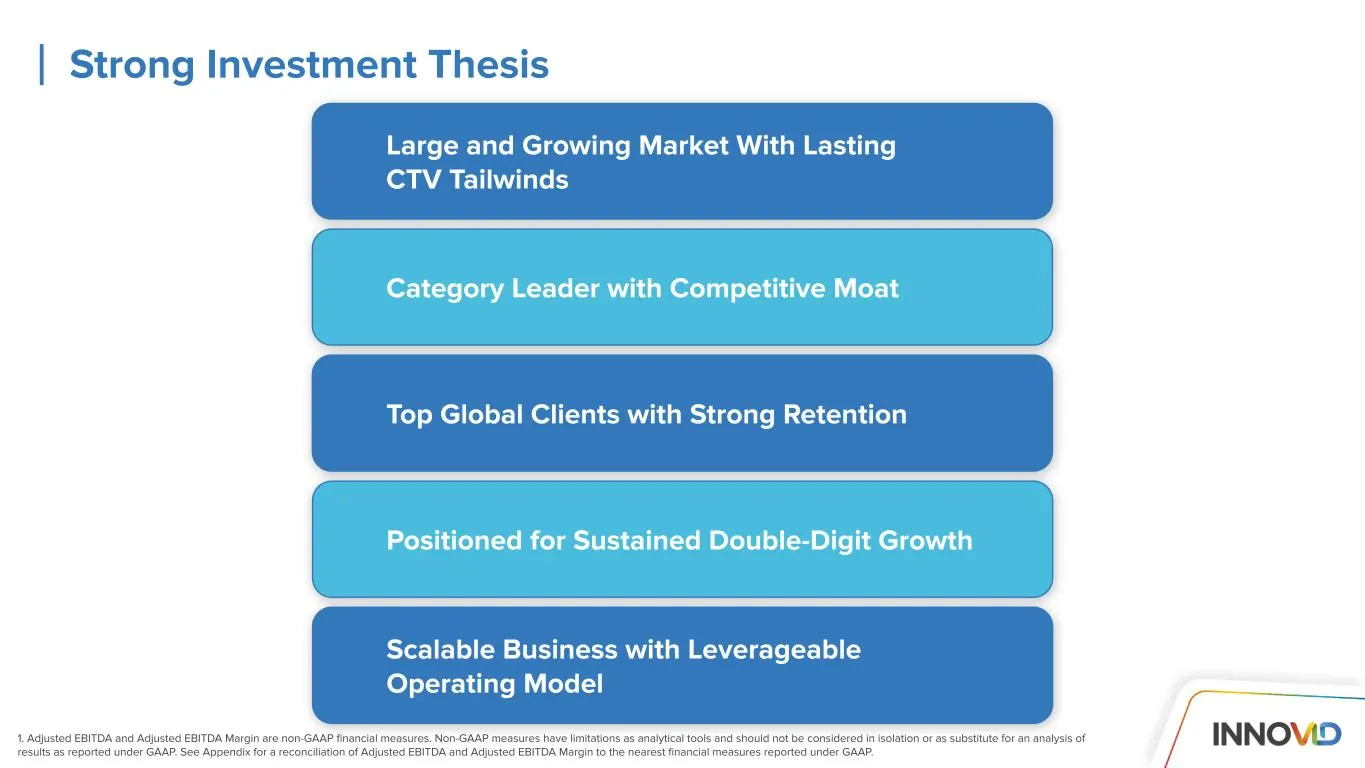
Slide 64: Strong Investment Thesis
1. Adjusted EBITDA and Adjusted EBITDA Margin are non-GAAP financial measures. Non-GAAP measures have limitations as analytical tools and should not be considered in isolation or as substitute for an analysis of results as reported under GAAP. See Appendix for a reconciliation of Adjusted EBITDA and
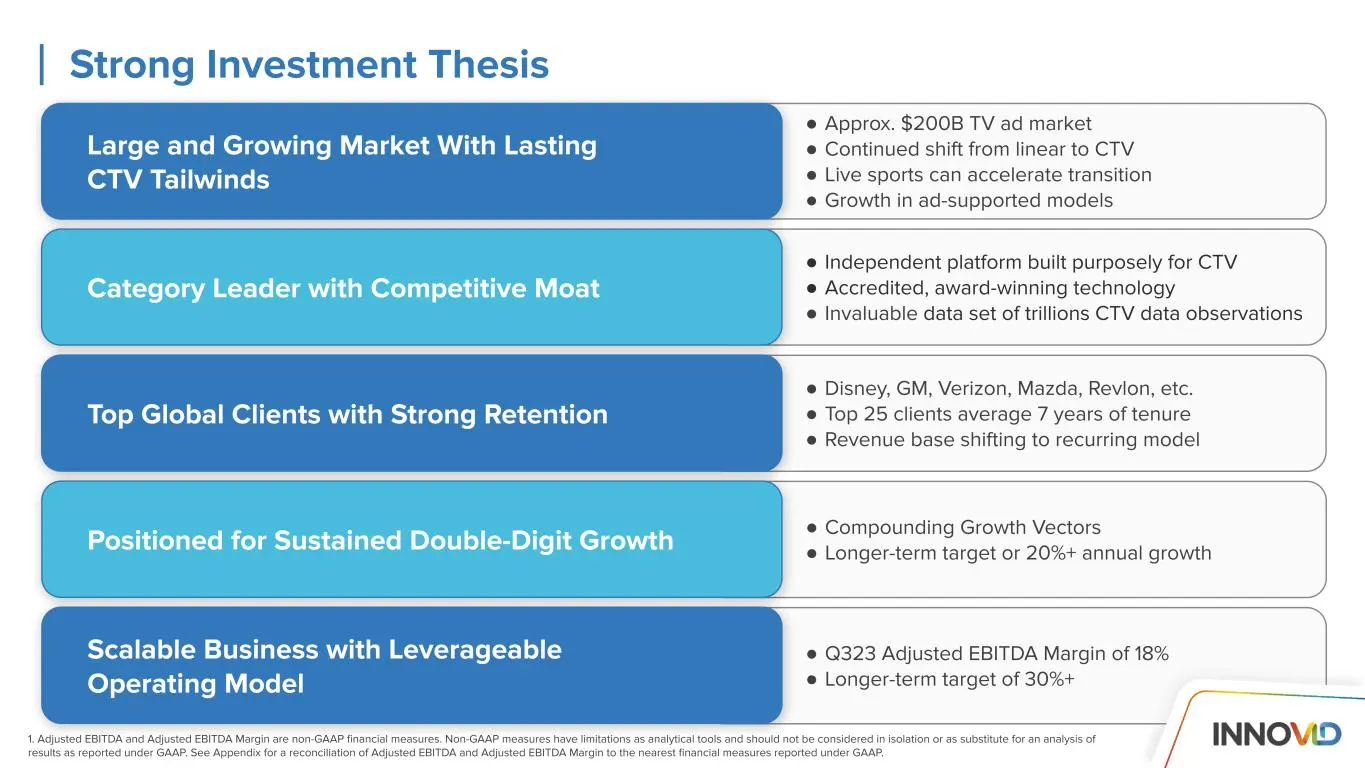
Slide 65: Investment thesis detail
● Approx. $200B TV ad market ● Continued shift from linear to CTV ● Live sports can accelerate transition ● Growth in ad-supported models ● Independent platform built purposely for CTV ● Accredited, award-winning technology ● Invaluable data set of trillions CTV data observations ● Disney, GM, Veriz
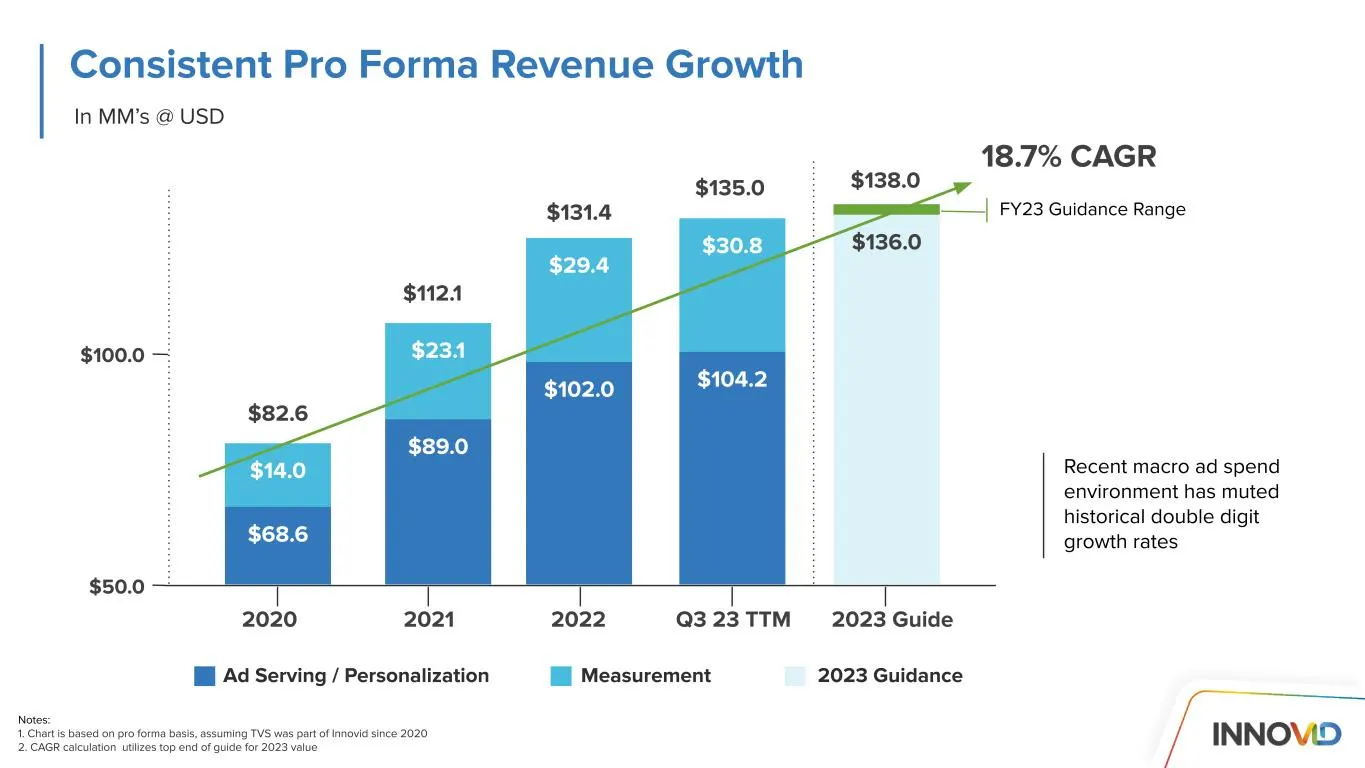
Slide 66: Consistent Pro Forma Revenue Growth
In MM’s @ USD Notes: 1. Chart is based on pro forma basis, assuming TVS was part of Innovid since 2020 2. CAGR calculation utilizes top end of guide for 2023 value Recent macro ad spend environment has muted historical double digit growth rates Consistent Pro Forma Revenue Growth $68.6 2021 $14.0 $8
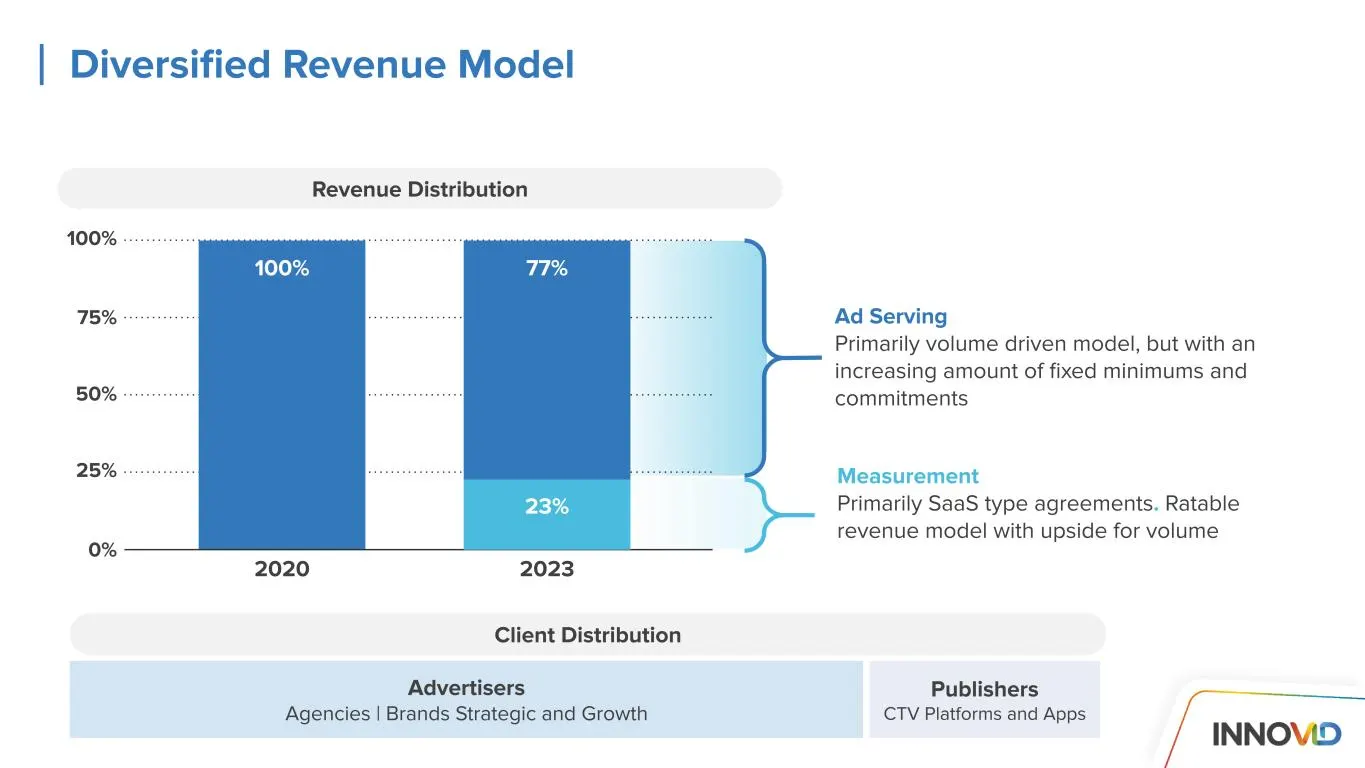
Slide 67: Diversified Revenue Model
Advertisers Agencies | Brands Strategic and Growth Diversified Revenue Model 100% 23% 2023 77% 2020 75% 100% 25% 0% 50% Revenue Distribution Ad Serving Primarily volume driven model, but with an increasing amount of fixed minimums and commitments Measurement Primarily SaaS type agreements. Ratable r
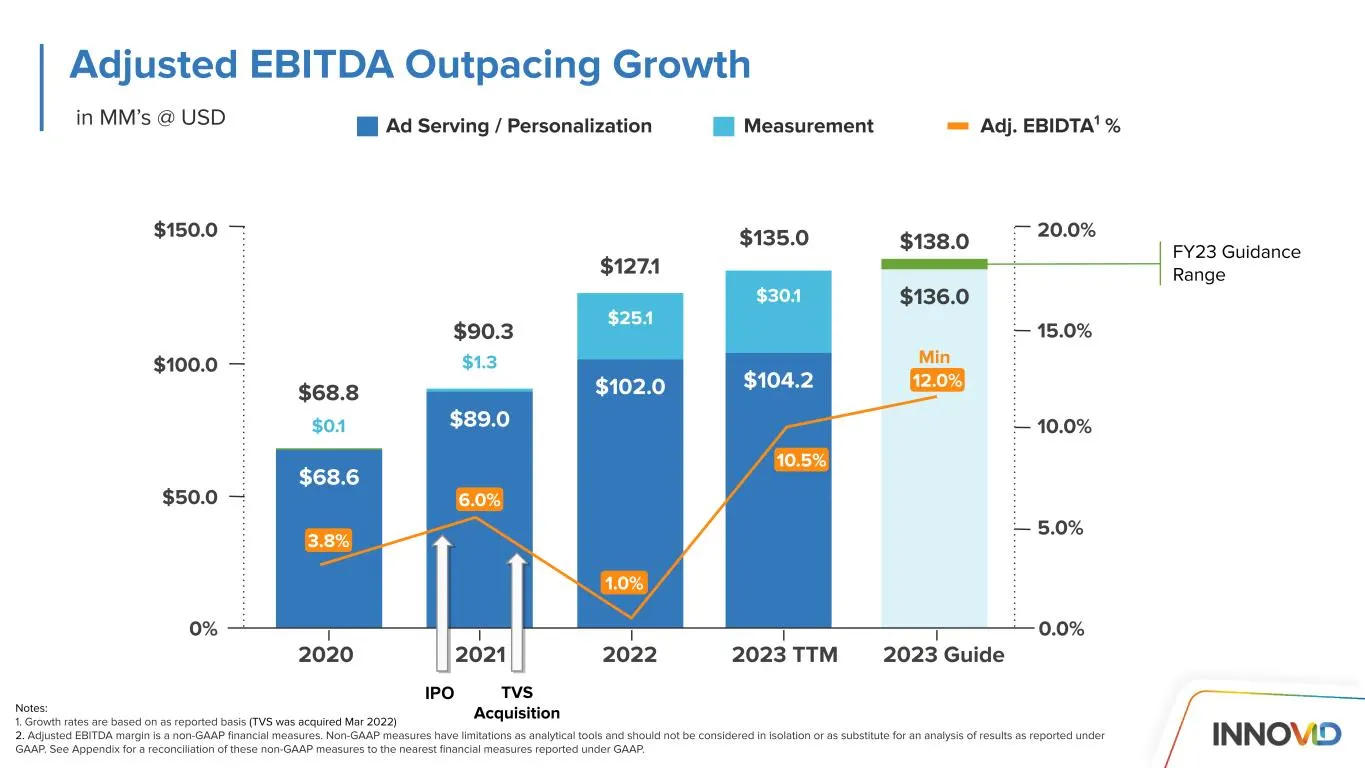
Slide 68: Adjusted EBITDA Outpacing Growth
$25.1 $30.1 Notes: 1. Growth rates are based on as reported basis (TVS was acquired Mar 2022) 2. Adjusted EBITDA margin is a non-GAAP financial measures. Non-GAAP measures have limitations as analytical tools and should not be considered in isolation or as substitute for an analysis of results as re
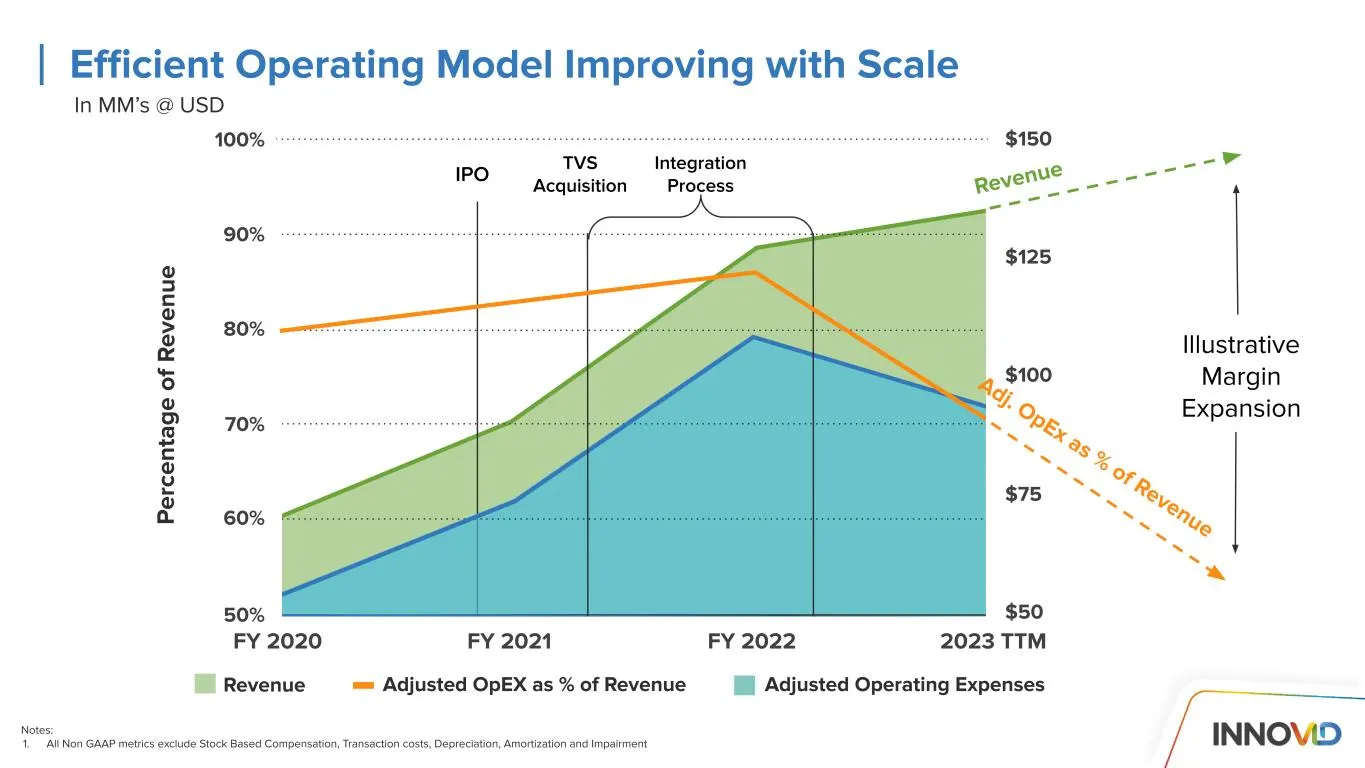
Slide 69: Efficient Operating Model Improving with Scale
Notes: 1. All Non GAAP metrics exclude Stock Based Compensation, Transaction costs, Depreciation, Amortization and Impairment IPO TVS Acquisition Integration Process Efficient Operating Model Improving with Scale 90% 100% 70% 60% Revenue Adjusted Operating ExpensesAdjusted OpEX as % of Revenue FY 20
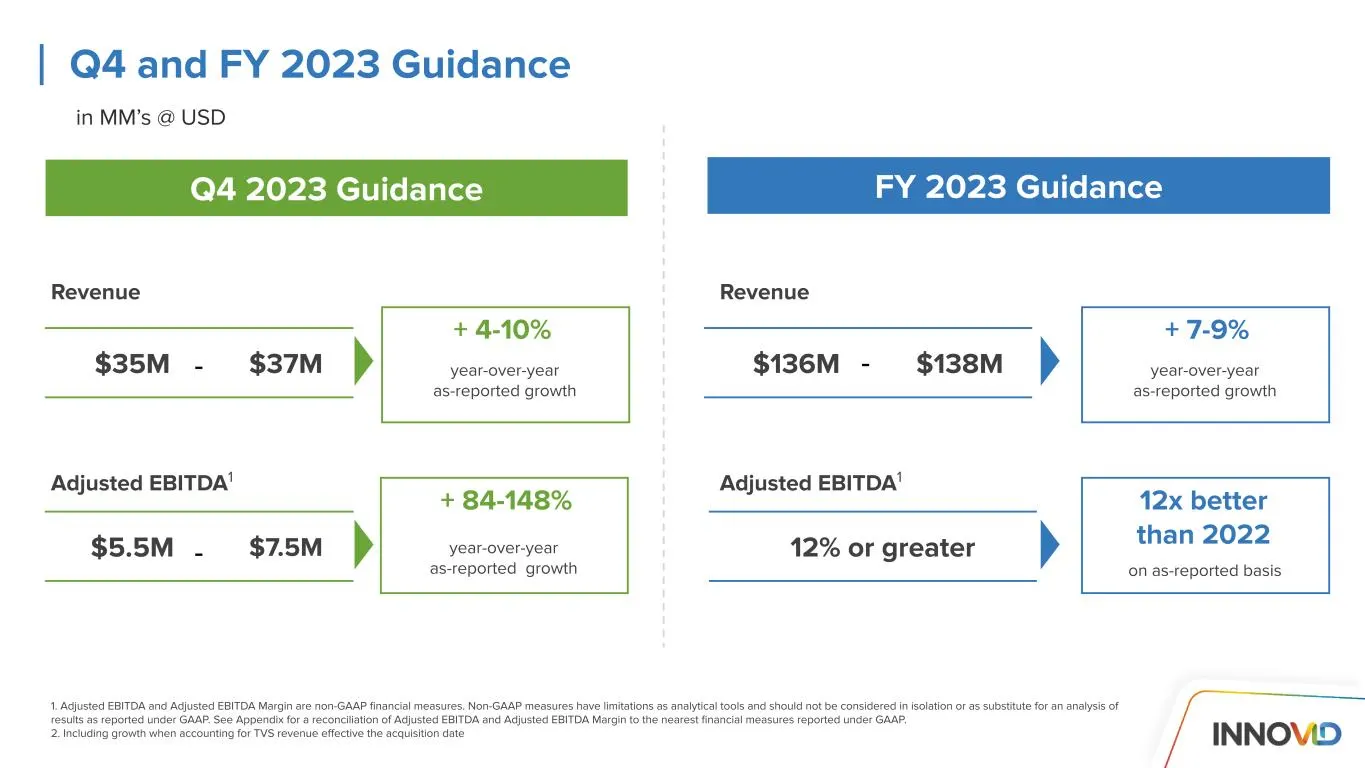
Slide 70: Q4 and FY 2023 Guidance
hdd FY 2023 GuidanceQ4 2023 Guidance $35M $37M Revenue + 4-10% year-over-year as-reported growth $5.5M $7.5M Adjusted EBITDA1 $136M $138M Revenue 12% or greater Adjusted EBITDA1 1. Adjusted EBITDA and Adjusted EBITDA Margin are non-GAAP financial measures. Non-GAAP measures have limitations as analy
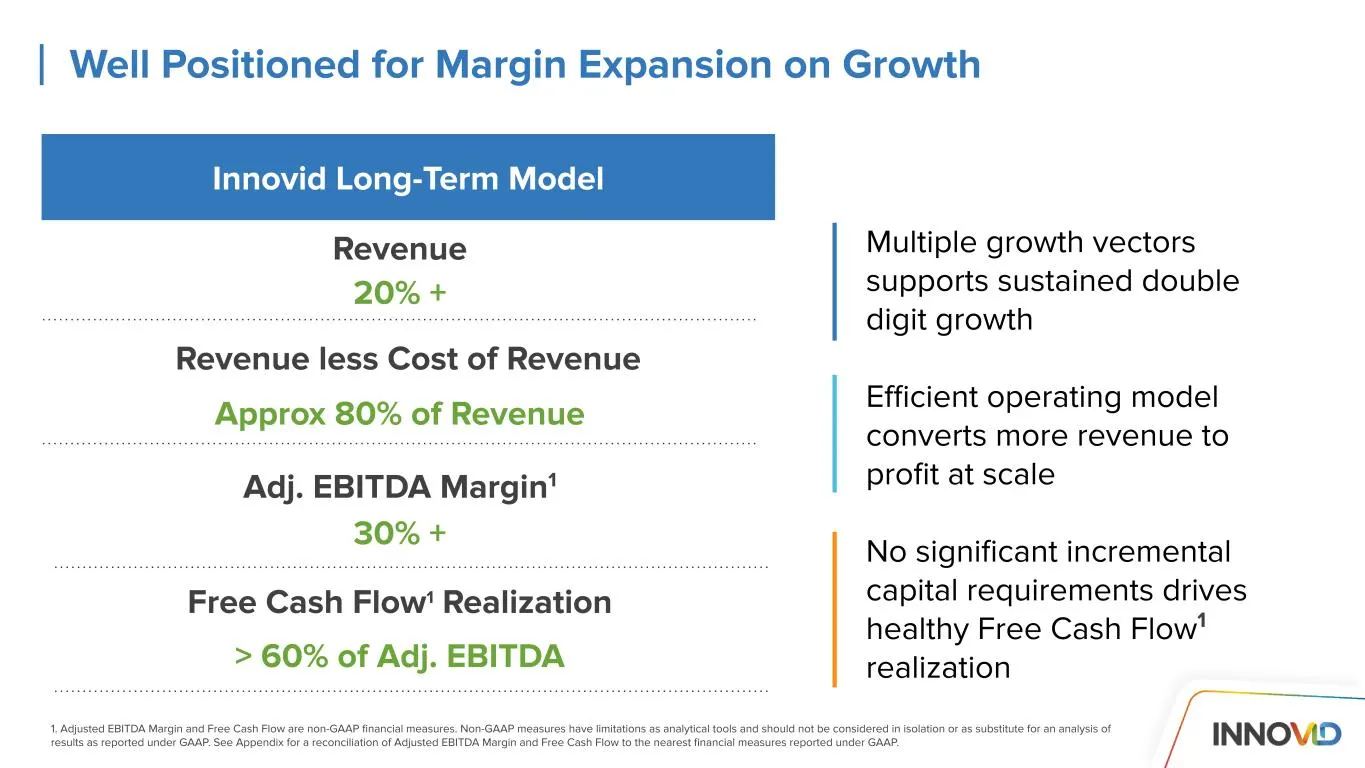
Slide 71: Well Positioned for Margin Expansion on Growth
Multiple growth vectors supports sustained double digit growth Efficient operating model converts more revenue to profit at scale No significant incremental capital requirements drives healthy Free Cash Flow1 realization Well Positioned for Margin Expansion on Growth Innovid Long-Term Model Revenue
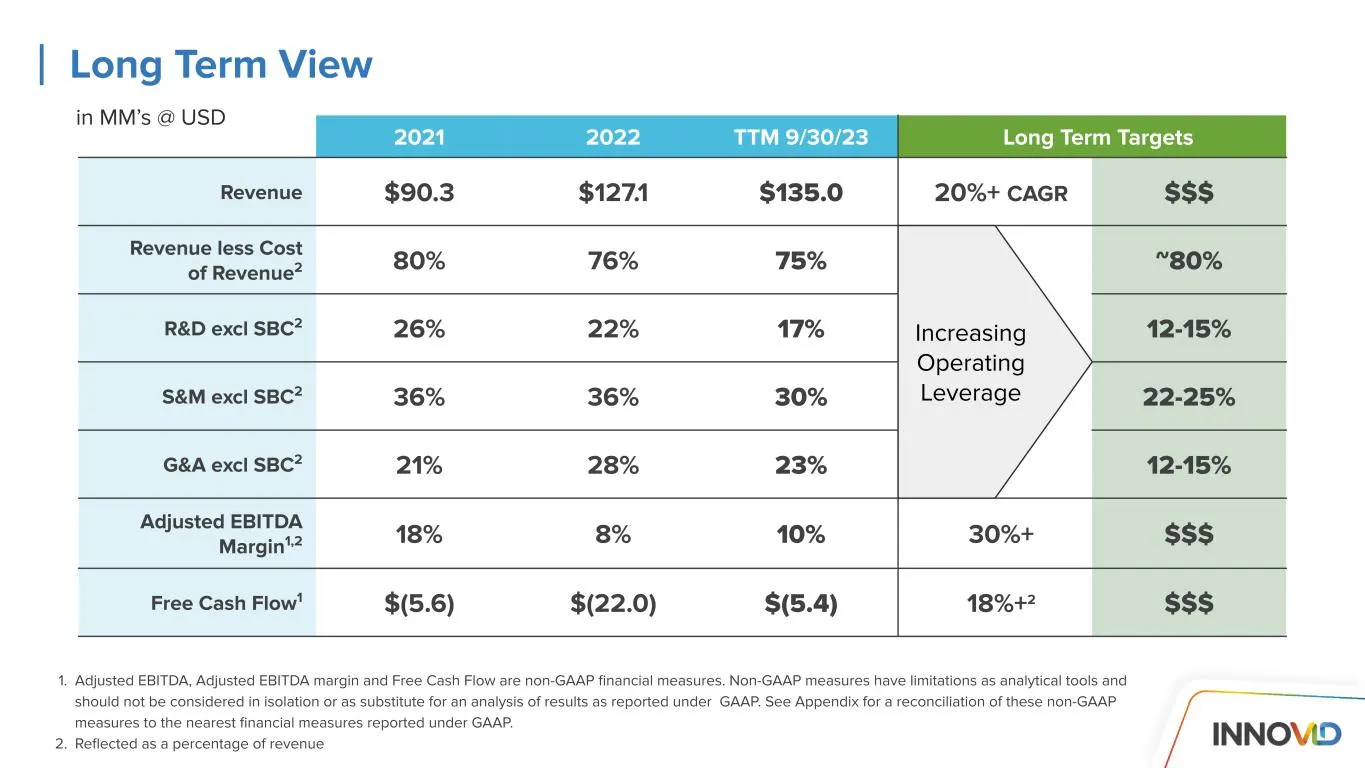
Slide 72: Increasing Operating Leverage: Long Term View
1. Adjusted EBITDA, Adjusted EBITDA margin and Free Cash Flow are non-GAAP financial measures. Non-GAAP measures have limitations as analytical tools and should not be considered in isolation or as substitute for an analysis of results as reported under GAAP. See Appendix for a reconciliation of the
Slide 73: Thank You.
Thank You.
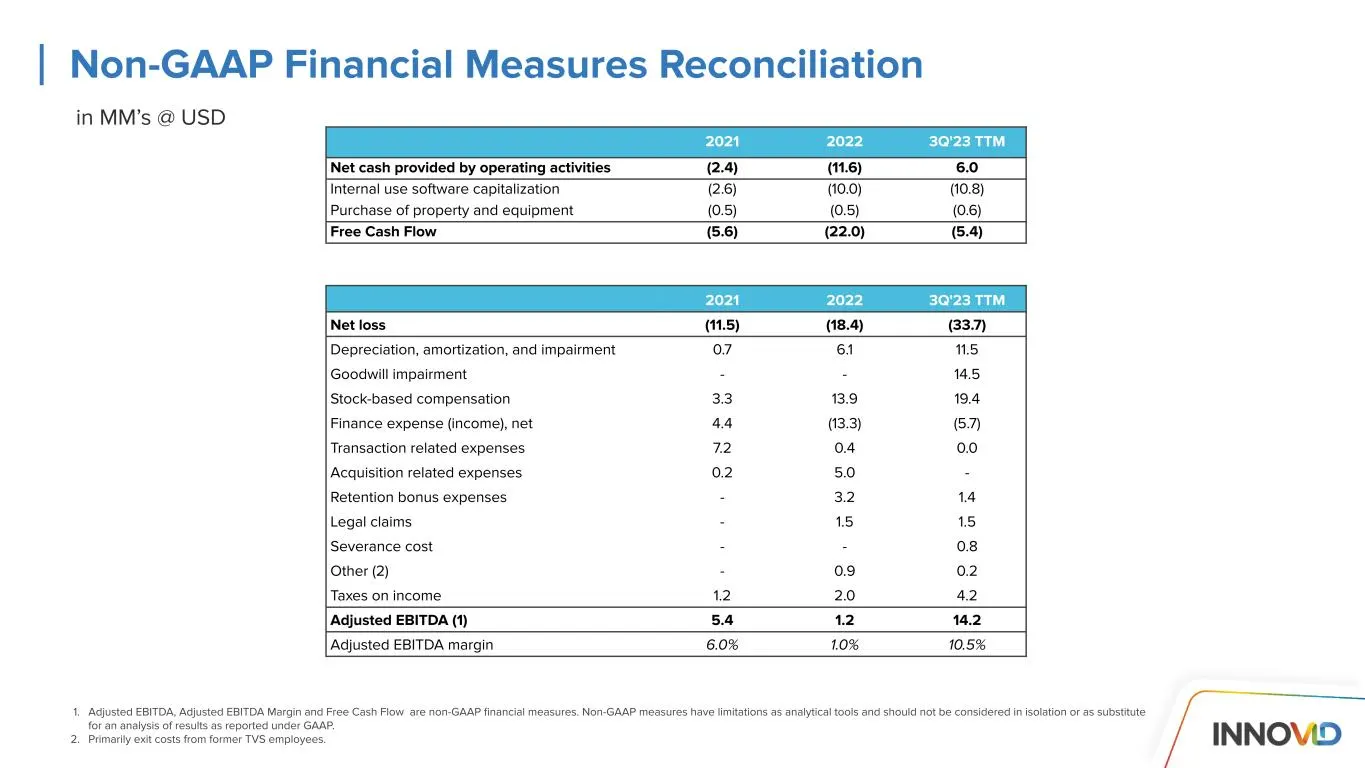
Slide 74: Non-GAAP Financial Measures Reconciliation
1. Adjusted EBITDA, Adjusted EBITDA Margin and Free Cash Flow are non-GAAP financial measures. Non-GAAP measures have limitations as analytical tools and should not be considered in isolation or as substitute for an analysis of results as reported under GAAP. 2. Primarily exit costs from former TVS
Source: SEC EDGAR · 8-K filed Nov 30, 2023