DEX ONE — R.H. Donnelley — JPMorgan High Yield Conference 2006
36 slides from DEX ONE's conference presentation, Feb 6, 2006

Slide 1: RHDonnelley JPMorgan High Yield Conference February 6, 2006
RHDonnelley JPMorgan High Yield Conference February 6, 2006
Slide 2: Safe Harbor Statement
Safe Harbor Statement Certain statements contained in this presentation regarding RHD's future operating results or performance or business plans or prospects and any other statements not constituting historical fact are "forward-looking statements" subject to the safe harbor created by the Private
Slide 3: Introduction
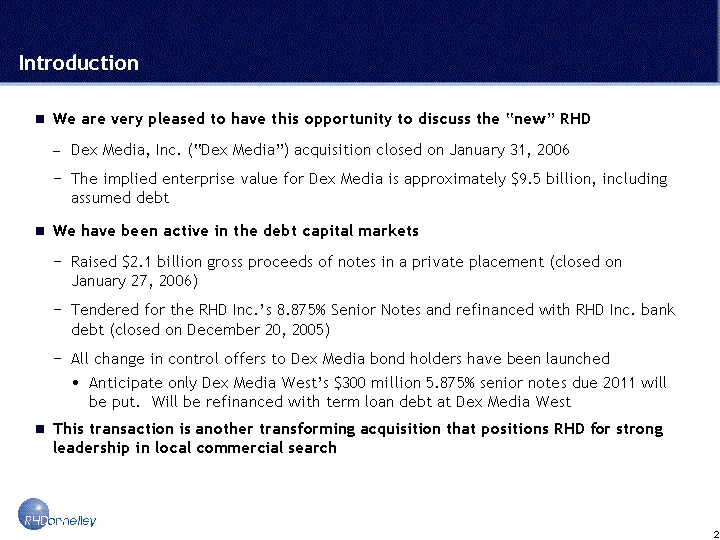
Introduction We are very pleased to have this opportunity to discuss the "new" RHD Dex Media, Inc. ("Dex Media") acquisition closed on January 31, 2006 The implied enterprise value for Dex Media is approximately $9.5 billion, including assumed debt We have been active in the debt capital markets Rai
Slide 4: Strategic Rationale for Dex Acquisition
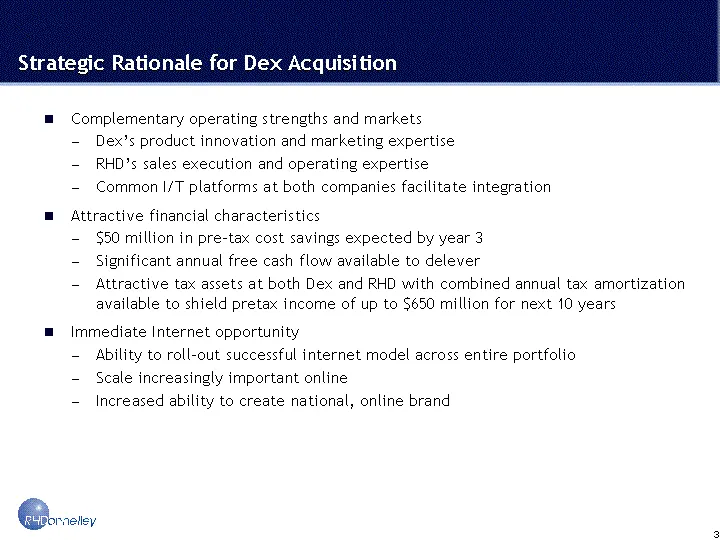
Strategic Rationale for Dex Acquisition Complementary operating strengths and markets Dex's product innovation and marketing expertise RHD's sales execution and operating expertise Common I/T platforms at both companies facilitate integration Attractive financial characteristics $50 million in pre-t
Slide 5: Substantial Scale and Reach
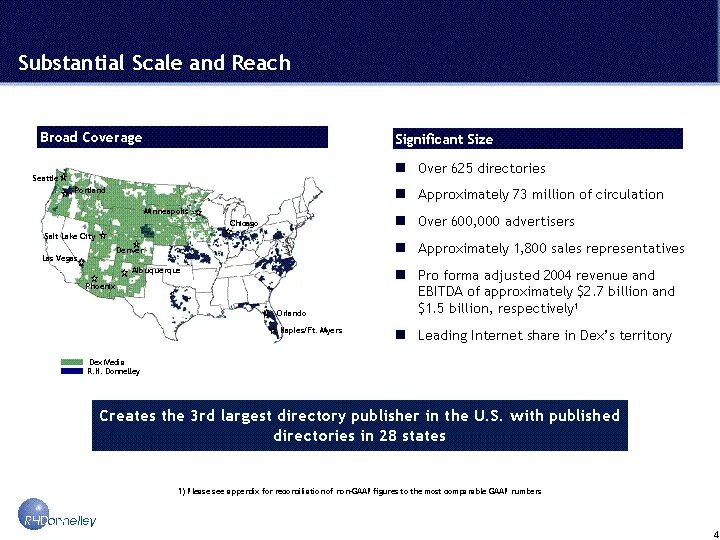
Substantial Scale and Reach Broad Coverage Over 625 directories Approximately 73 million of circulation Over 600,000 advertisers Approximately 1,800 sales representatives Pro forma adjusted 2004 revenue and EBITDA of approximately $2.7 billion and $1.5 billion, respectively1 Leading Internet share i
Slide 6: RHD's Strong Track Record of Sales Execution
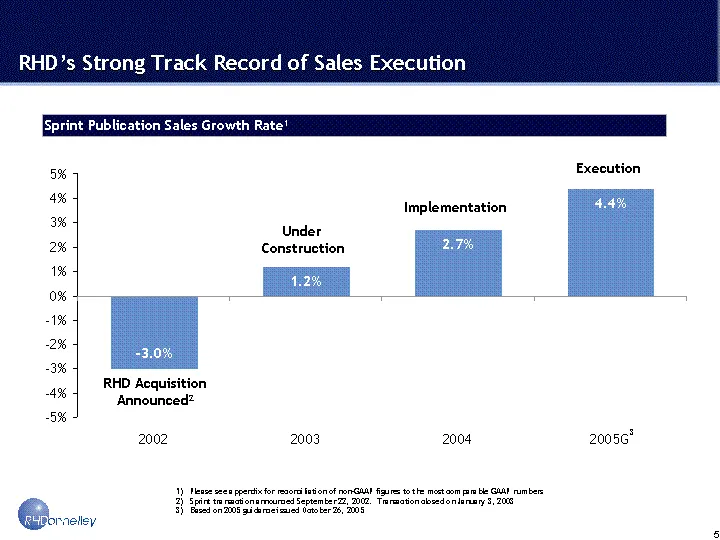
Sprint Pub Sales Growth 2005G 0.044 2004 0.027 2003 0.012 2002 -0.03 RHD Acquisition Announced2 Under Construction Implementation Execution RHD's Strong Track Record of Sales Execution Sprint Publication Sales Growth Rate1 3 Please see appendix for reconciliation of non-GAAP figures to the most comp
Slide 7: Successful Model For Digital Expansion Across Combined Platform
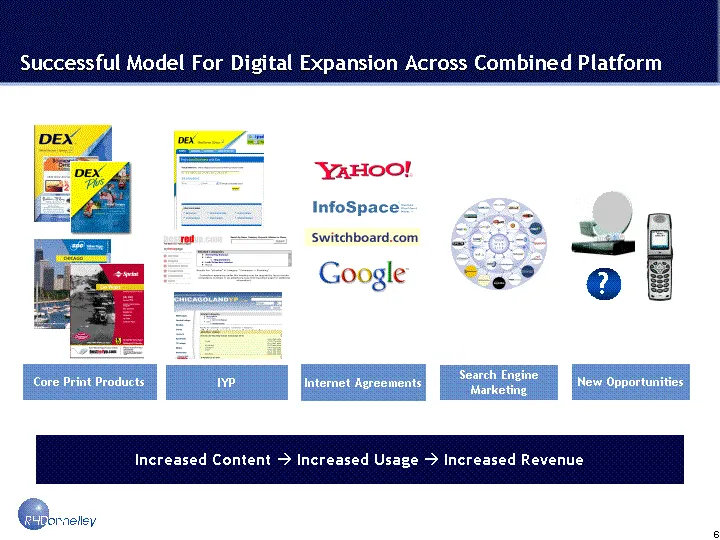
Successful Model For Digital Expansion Across Combined Platform Core Print Products Internet Agreements Search Engine Marketing IYP New Opportunities ? Increased Content ? Increased Usage ? Increased Revenue
Slide 8: Business Highlights
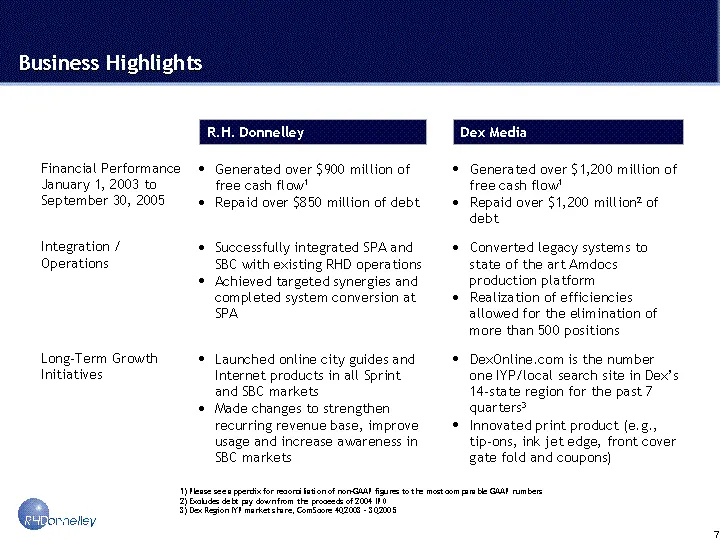
Business Highlights Please see appendix for reconciliation of non-GAAP figures to the most comparable GAAP numbers Excludes debt pay down from the proceeds of 2004 IPO 3) Dex Region IYP market share, ComScore 4Q2003 - 3Q2005 R.H. Donnelley Dex Media
Slide 9: Strong Industry Fundamentals
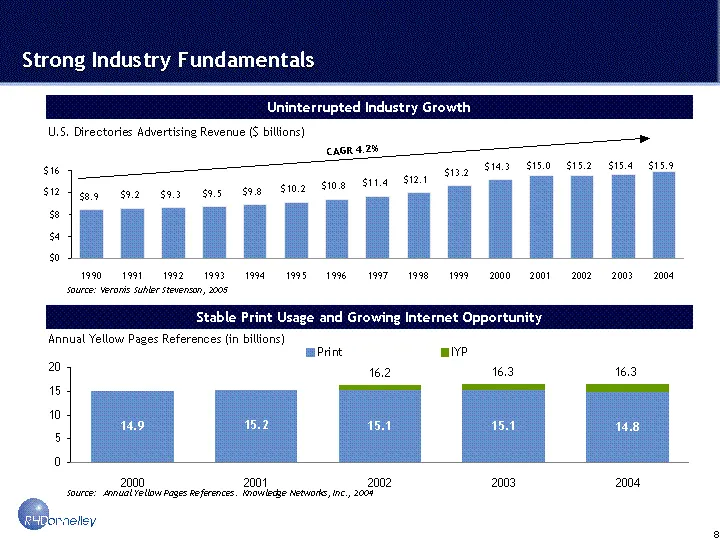
Revenue 1990 8.9 1991 9.2 1992 9.3 1993 9.5 1994 9.8 1995 10.2 1996 10.8 1997 11.4 1998 12.1 1999 13.2 2000 14.3 2001 15 2002 15.2 2003 15.36 2004 15.928 Source: Veronis Suhler Stevenson, 2005 Strong Industry Fundamentals Uninterrupted Industry Growth CAGR 4.2% Print IYP 2000 14.9 2001 15.2 2002 15.
Slide 10: Attractive Market Characteristics
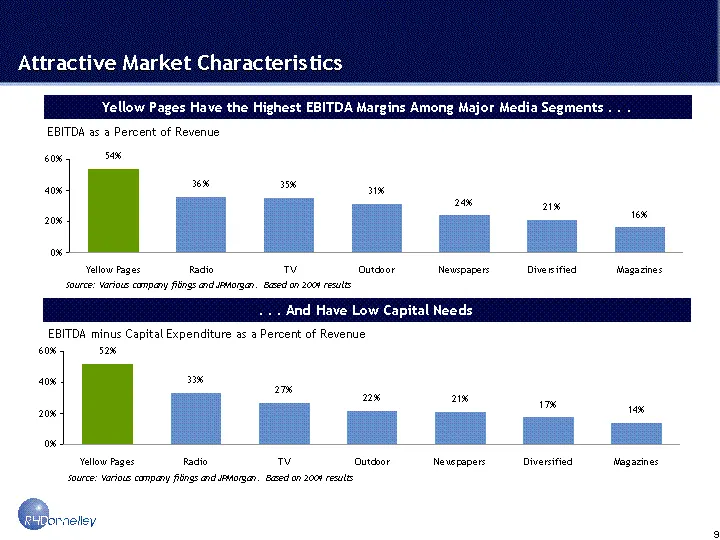
Industry Avg. EBITDA Margin Yellow Pages 0.538 Radio 0.361 TV 0.35 Outdoor 0.314 Newspapers 0.242 Diversified 0.21 Magazines 0.163 Source: Various company filings and JPMorgan. Based on 2004 results Industry Avg. EBITDA Margin Yellow Pages 0.52 Radio 0.333 TV 0.268 Outdoor 0.22 Newspapers 0.21 Diver
Slide 11: Incumbent Competitive Advantage
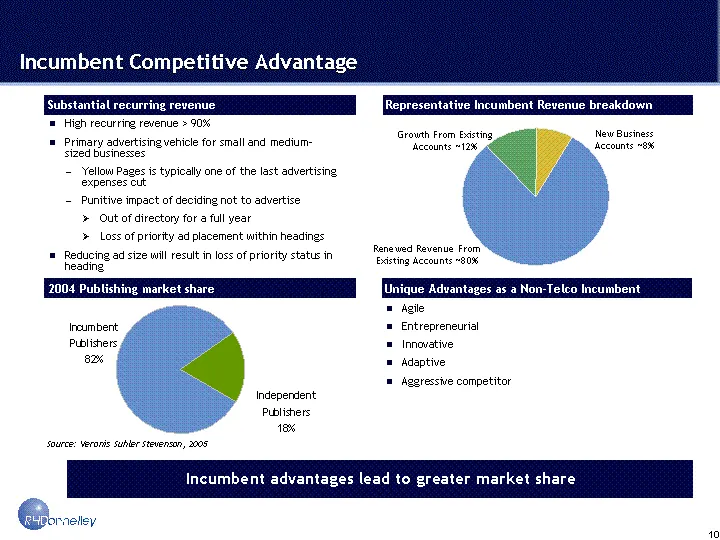
Renewed Revenue From Existing Accounts 0.8 Growth From Existing Accounts 0.12 New Business Accounts 0.08 Renewed Revenue From Existing Accounts ~80% Growth From Existing Accounts ~12% New Business Accounts ~8% Incumbent Competitive Advantage 2004 Publishing market share Unique Advantages as a Non-Te

Slide 12: Financial Update
Financial Update
Slide 13: Recent Bond Issuances
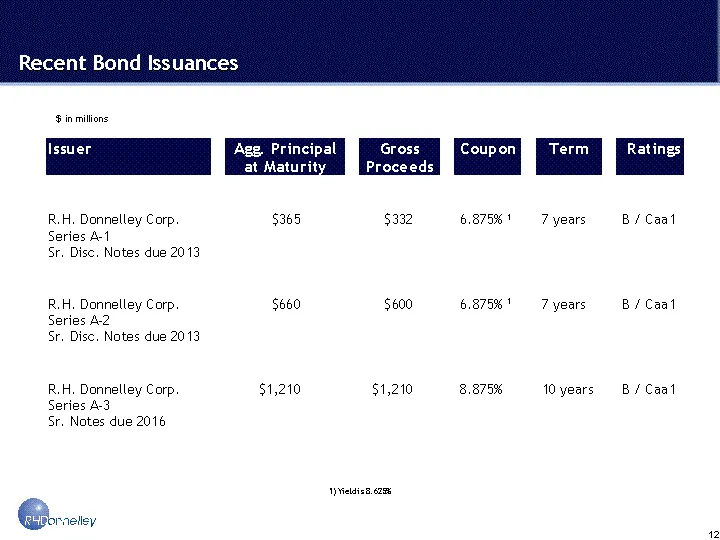
Recent Bond Issuances 1) Yield is 8.625% $ in millions
Slide 14: Pro Forma Capital Structure
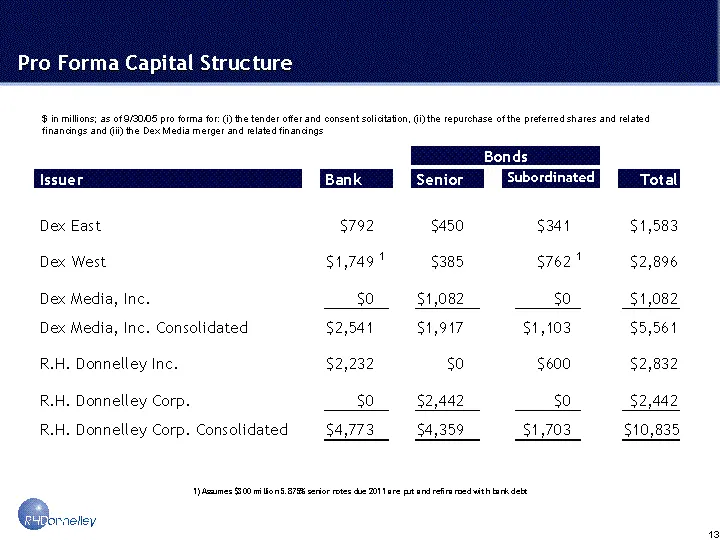
Pro Forma Capital Structure 1) Assumes $300 million 5.875% senior notes due 2011 are put and refinanced with bank debt $ in millions; as of 9/30/05 pro forma for: (i) the tender offer and consent solicitation, (ii) the repurchase of the preferred shares and related financings and (iii) the Dex Media
Slide 15: Historical Financial Overview
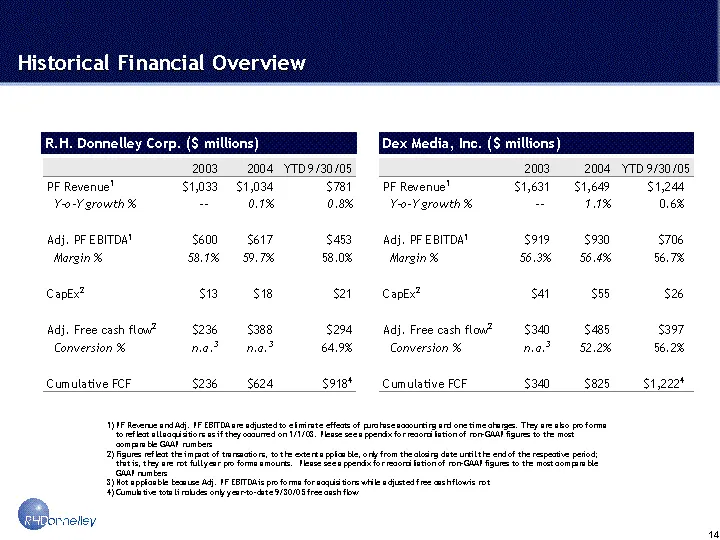
Historical Financial Overview R.H. Donnelley Corp. ($ millions) Dex Media, Inc. ($ millions) 1) PF Revenue and Adj. PF EBITDA are adjusted to eliminate effects of purchase accounting and one time charges. They are also pro forma to reflect all acquisitions as if they occurred on 1/1/03. Please see a
Slide 16: Strong Track Record of Debt Repayment
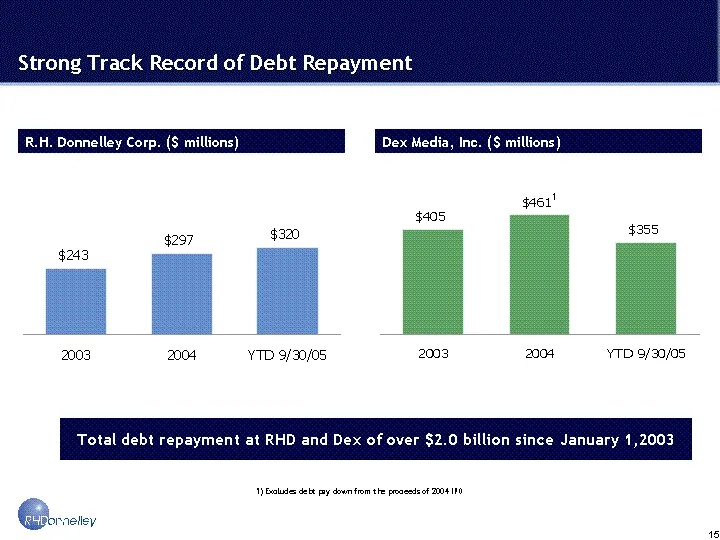
Strong Track Record of Debt Repayment Date Column 3 Column 4 Column 5 Column 6 Column 7 Column 8 Column 9 Column 10 Column 11 Column 12 Column 13 Column 14 Column 15 Column 16 12/31/2003 243 12/31/2004 297 YTD 9/30/05 320 R.H. Donnelley Corp. ($ millions) Dex Media, Inc. ($ millions) Date Column 3 C
Slide 17: Exceptional Cash Flow: Valuable Tax Benefits
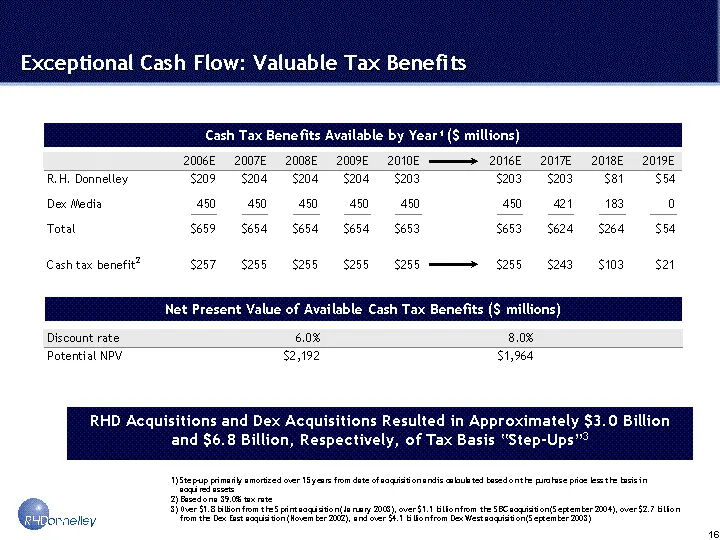
1) Step-up primarily amortized over 15 years from date of acquisition and is calculated based on the purchase price less the basis in acquired assets 2) Based on a 39.0% tax rate 3) Over $1.8 billion from the Sprint acquisition (January 2003), over $1.1 billion from the SBC acquisition (September 20
Slide 18: Key Investment Considerations
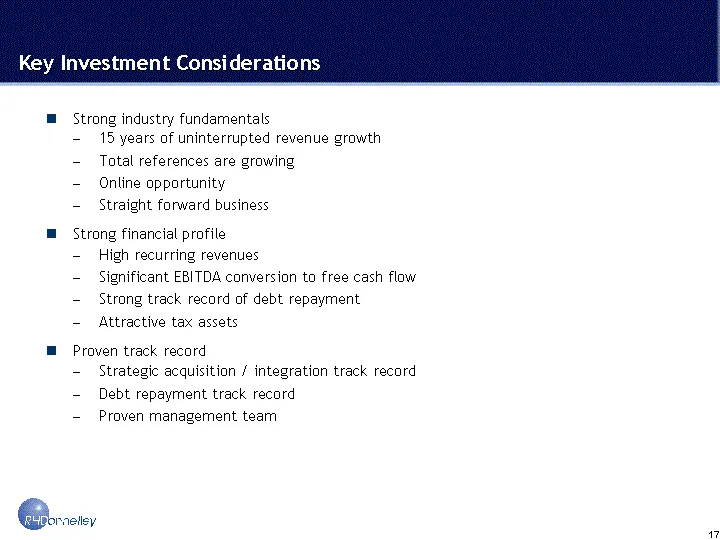
Key Investment Considerations Strong industry fundamentals 15 years of uninterrupted revenue growth Total references are growing Online opportunity Straight forward business Strong financial profile High recurring revenues Significant EBITDA conversion to free cash flow Strong track record of debt r

Slide 19: RH Donnelley
RH Donnelley

Slide 20: Appendix
Appendix
Slide 21: Index of schedules
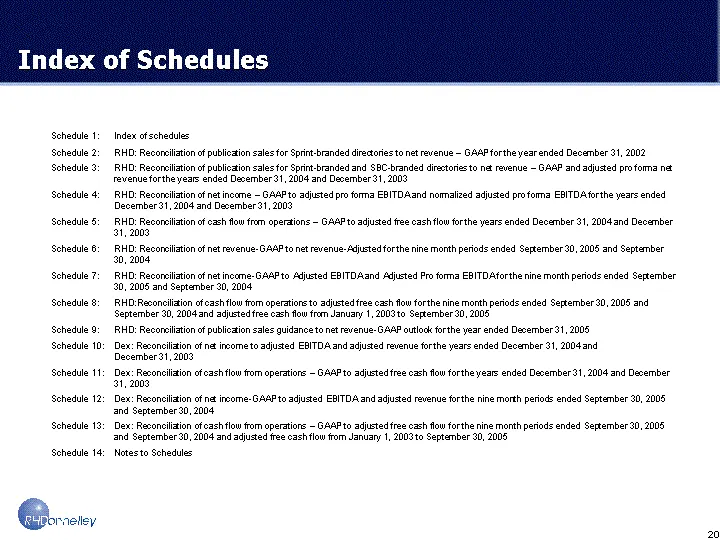
Schedule 1: Index of schedules Schedule 2: RHD: Reconciliation of publication sales for Sprint-branded directories to net revenue - GAAP for the year ended December 31, 2002 Schedule 3: RHD: Reconciliation of publication sales for Sprint-branded and SBC-branded directories to net revenue - GAAP and
Slide 22: RHD: Reconciliation Of Pub. Sales To Net Revenue - FY02
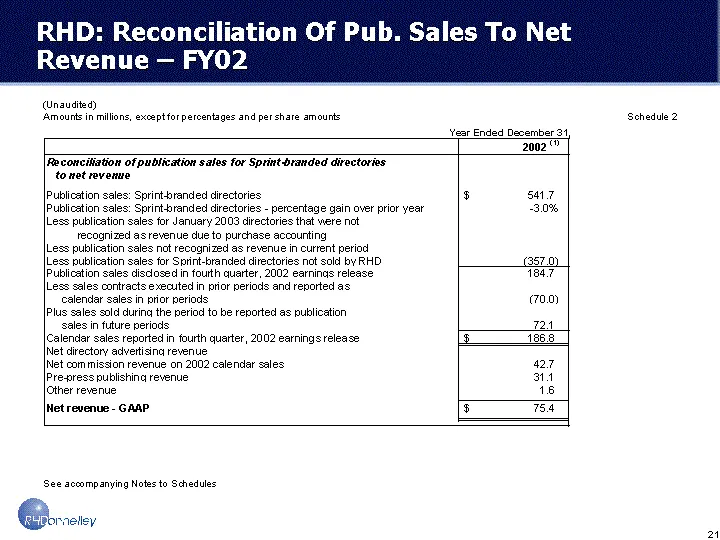
RHD: Reconciliation Of Pub. Sales To Net Revenue - FY02 (Unaudited) Amounts in millions, except for percentages and per share amounts See accompanying Notes to Schedules Schedule 2
Slide 23: RHD: Reconciliation Of Pub. Sales To Net Revenue - FY03 & FY04
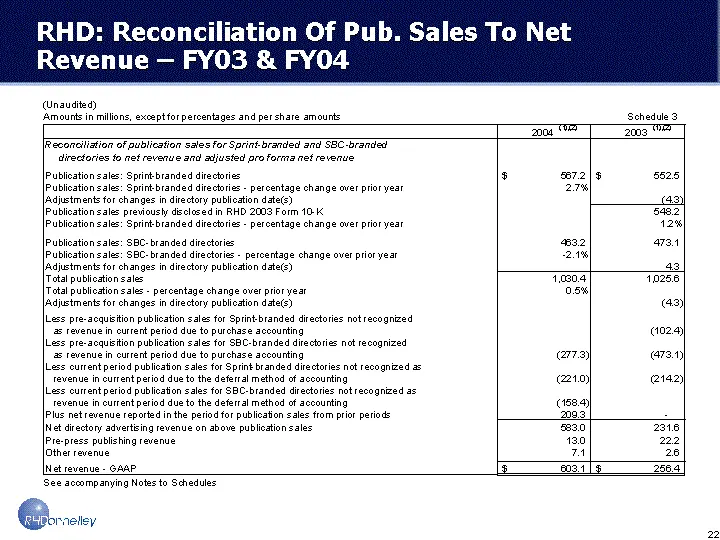
RHD: Reconciliation Of Pub. Sales To Net Revenue - FY03 & FY04 (Unaudited) Amounts in millions, except for percentages and per share amounts See accompanying Notes to Schedules Schedule 3
Slide 24: RHD: Reconciliation Of Pub. Sales To Net Revenue - FY03 & FY04 Cont'd
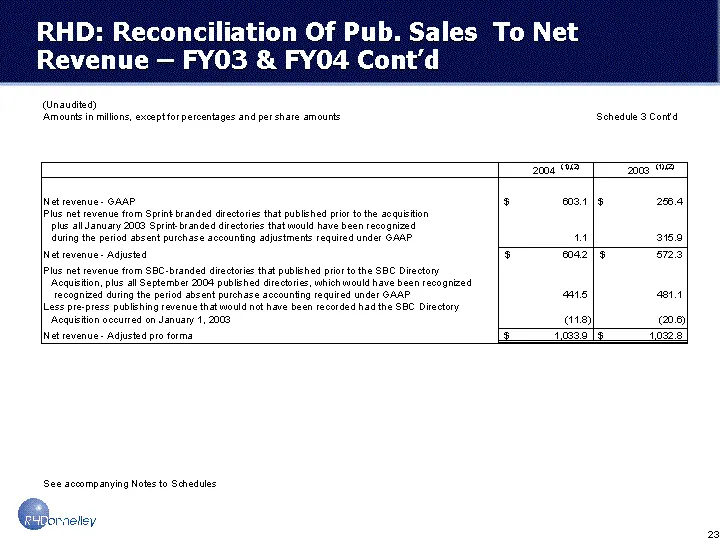
RHD: Reconciliation Of Pub. Sales To Net Revenue - FY03 & FY04 Cont'd (Unaudited) Amounts in millions, except for percentages and per share amounts See accompanying Notes to Schedules Schedule 3 Cont'd
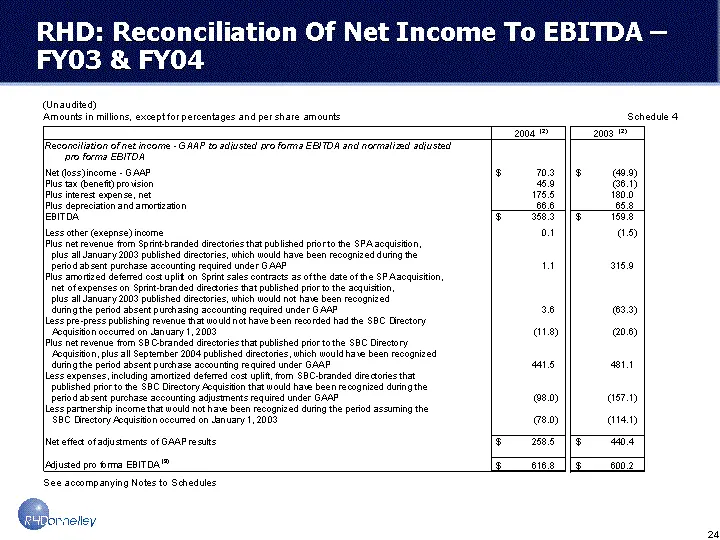
Slide 25: RHD: Reconciliation Of Net Income To EBITDA - FY03 & FY04
RHD: Reconciliation Of Net Income To EBITDA - FY03 & FY04 (Unaudited) Amounts in millions, except for percentages and per share amounts See accompanying Notes to Schedules Schedule 4
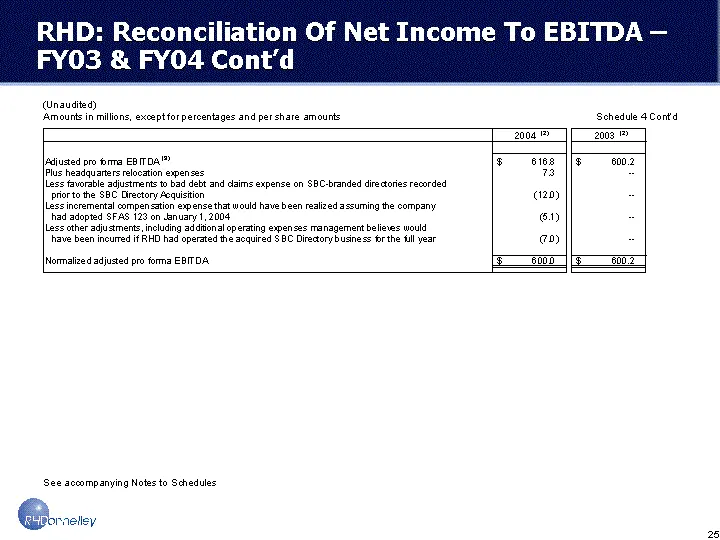
Slide 26: RHD: Reconciliation Of Net Income To EBITDA - FY03 & FY04 Cont'd
RHD: Reconciliation Of Net Income To EBITDA - FY03 & FY04 Cont'd (Unaudited) Amounts in millions, except for percentages and per share amounts See accompanying Notes to Schedules Schedule 4 Cont'd
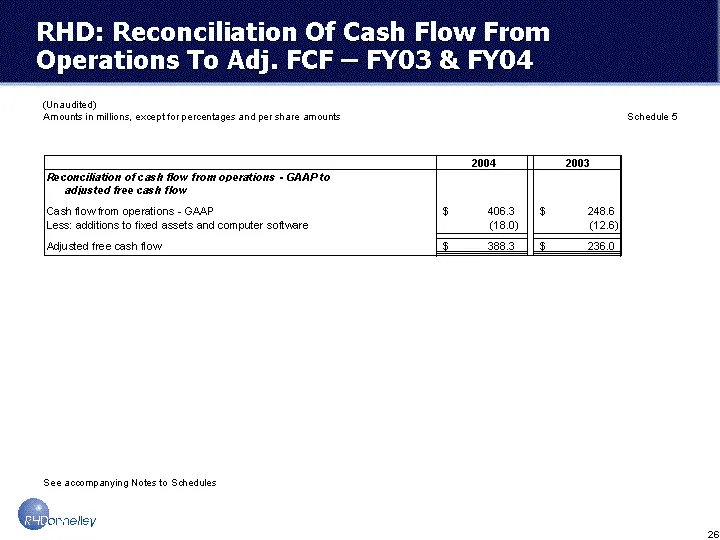
Slide 27: RHD: Reconciliation Of Cash Flow From Operations To Adj. FCF
RHD: Reconciliation Of Cash Flow From Operations To Adj. FCF - FY03 & FY04 (Unaudited) Amounts in millions, except for percentages and per share amounts See accompanying Notes to Schedules Schedule 5
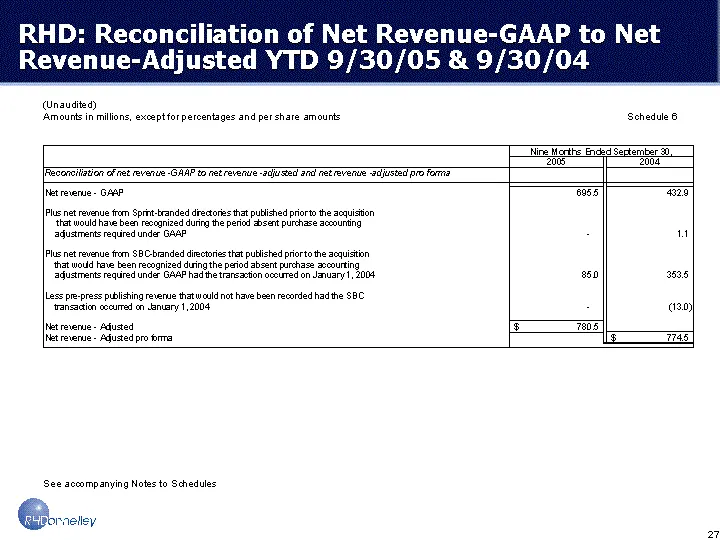
Slide 28: RHD: Reconciliation of Net Revenue-GAAP to Net Revenue-Adjusted YTD
RHD: Reconciliation of Net Revenue-GAAP to Net Revenue-Adjusted YTD 9/30/05 & 9/30/04 (Unaudited) Amounts in millions, except for percentages and per share amounts See accompanying Notes to Schedules Schedule 6
Slide 29: RHD: Reconciliation of Net Income-GAAP to Adj. EBITDA YTD
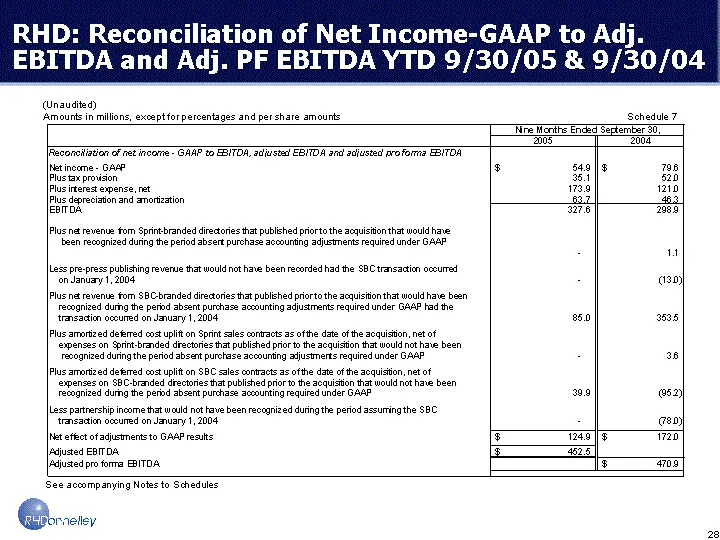
RHD: Reconciliation of Net Income-GAAP to Adj. EBITDA and Adj. PF EBITDA YTD 9/30/05 & 9/30/04 (Unaudited) Amounts in millions, except for percentages and per share amounts See accompanying Notes to Schedules Schedule 7
Slide 30: RHD: Reconciliation of Non-GAAP Measures
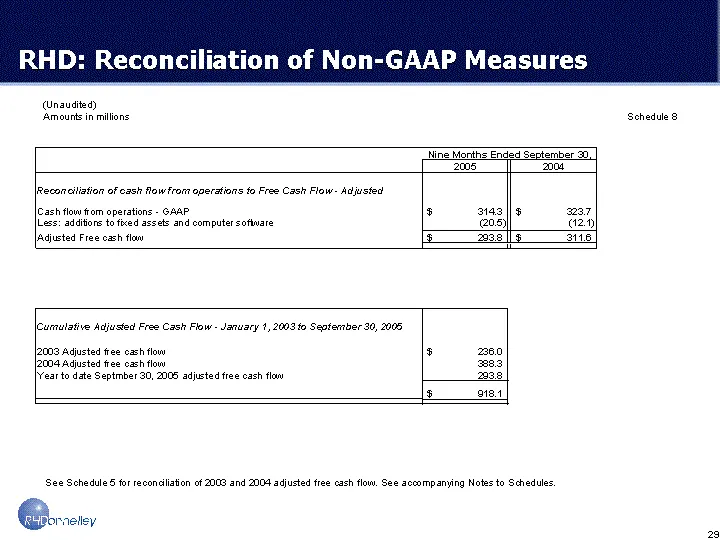
RHD: Reconciliation of Non-GAAP Measures (Unaudited) Amounts in millions See Schedule 5 for reconciliation of 2003 and 2004 adjusted free cash flow. See accompanying Notes to Schedules. Schedule 8
Slide 31: RHD: Reconciliation Of Guidance - FY05
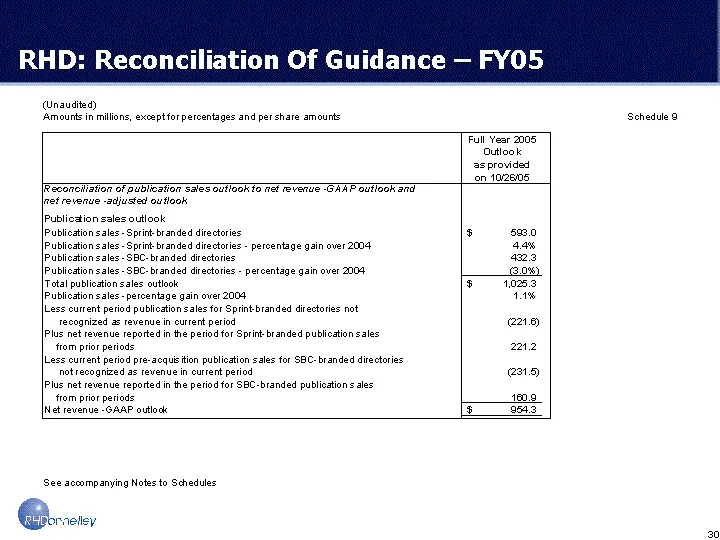
RHD: Reconciliation Of Guidance - FY05 (Unaudited) Amounts in millions, except for percentages and per share amounts See accompanying Notes to Schedules Schedule 9
Slide 32: Dex: Reconciliation Of Net Income to EBITDA & Revenue - FY03 & FY04
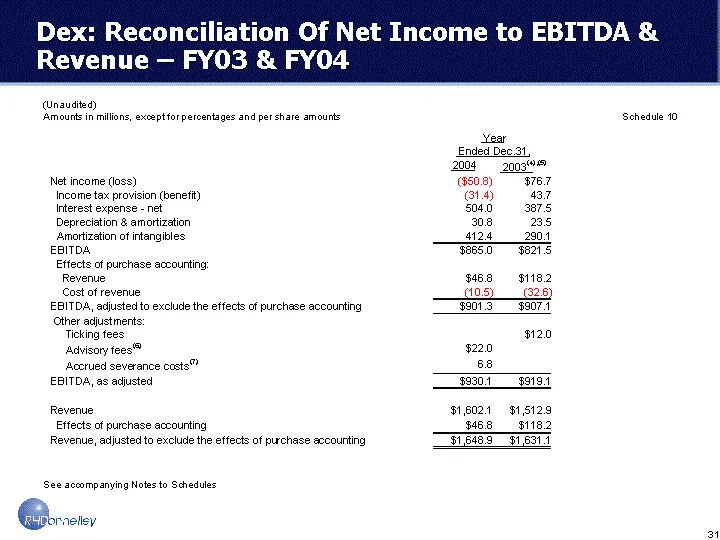
Dex: Reconciliation Of Net Income to EBITDA & Revenue - FY03 & FY04 (Unaudited) Amounts in millions, except for percentages and per share amounts See accompanying Notes to Schedules Schedule 10 2004 2003 (4) ,(5) Net income (loss) ($50.8) $76.7 Income tax provision (benefit) (31.4) 43.7 Interest exp
Slide 33: Dex: Reconciliation Of Net Income to EBITDA & Revenue - YTD
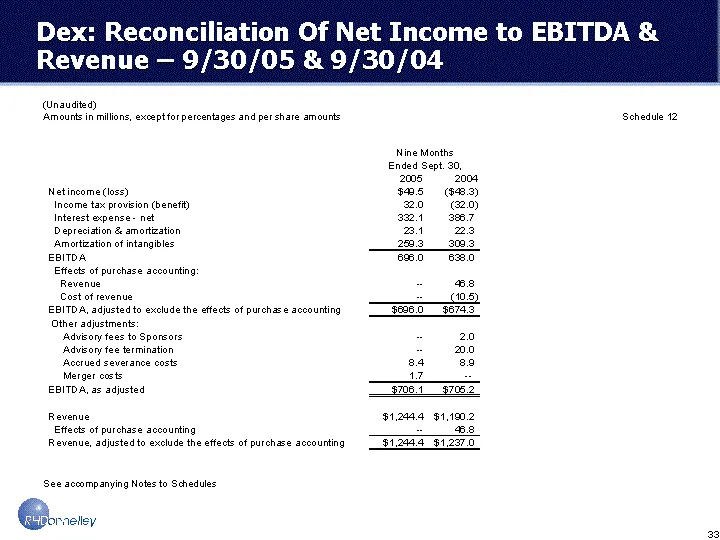
Dex: Reconciliation Of Net Income to EBITDA & Revenue - 9/30/05 & 9/30/04 (Unaudited) Amounts in millions, except for percentages and per share amounts See accompanying Notes to Schedules Schedule 12
Slide 34: Dex: Reconciliation Of Non-GAAP Measures
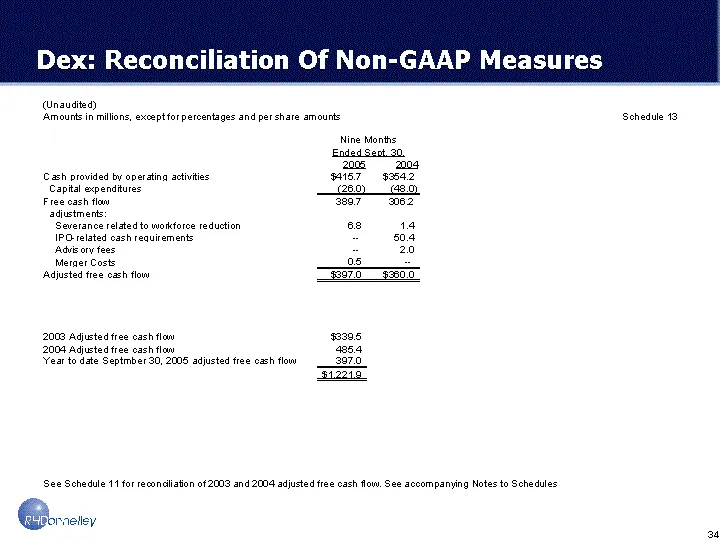
Dex: Reconciliation Of Non-GAAP Measures (Unaudited) Amounts in millions, except for percentages and per share amounts See Schedule 11 for reconciliation of 2003 and 2004 adjusted free cash flow. See accompanying Notes to Schedules Schedule 13
Slide 35: Notes To Schedules
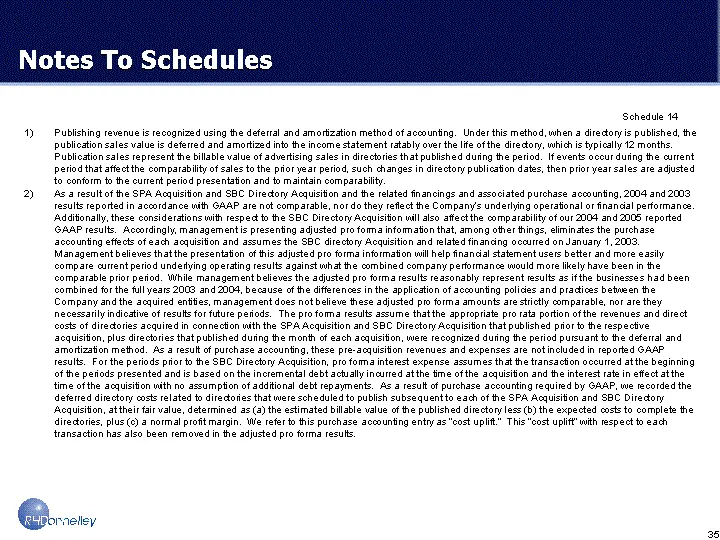
Notes To Schedules Publishing revenue is recognized using the deferral and amortization method of accounting. Under this method, when a directory is published, the publication sales value is deferred and amortized into the income statement ratably over the life of the directory, which is typically 1
Slide 36: Notes To Schedules Cont'd
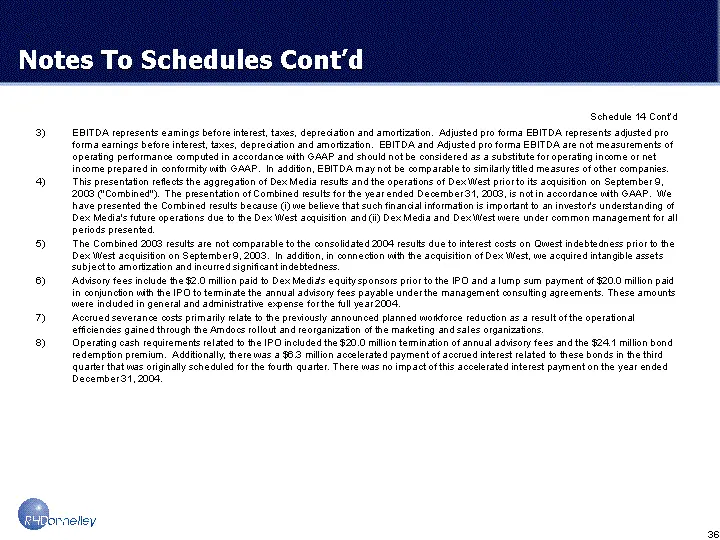
Notes To Schedules Cont'd EBITDA represents earnings before interest, taxes, depreciation and amortization. Adjusted pro forma EBITDA represents adjusted pro forma earnings before interest, taxes, depreciation and amortization. EBITDA and Adjusted pro forma EBITDA are not measurements of operating p
Source: SEC EDGAR · 8-K filed Feb 6, 2006
More decks from DEX ONE Corp
 Q4 2012 Earnings Presentation17 slides · Mar 18, 2013
 Merger or Acquisition (December 2012)42 slides · Dec 6, 2012
 Merger or Acquisition (September 2012)51 slides · Sep 18, 2012
 Merger or Acquisition (August 2012)15 slides · Aug 21, 2012
 Q2 2012 Earnings Presentation16 slides · Jul 25, 2012
 Q1 2012 Earnings Presentation17 slides · Apr 26, 2012