Pacific Mercantile Bancorp — Investor Presentation (January 2019)
23 slides from Pacific Mercantile Bancorp's investor presentation, Jan 28, 2019
Slide 1: January 2019 Investor Presentation
January 2019 INVESTOR PRESENTATION
Slide 2: Forward Looking Statements
FORWARD LOOKING STATEMENTS This presentation contains statements regarding our expectations, beliefs and views about our future financial performance and our business, trends and expectations regarding the markets in which we operate, and our future plans. Those statements constitute “forward-lookin
Slide 3: Corporate Overview
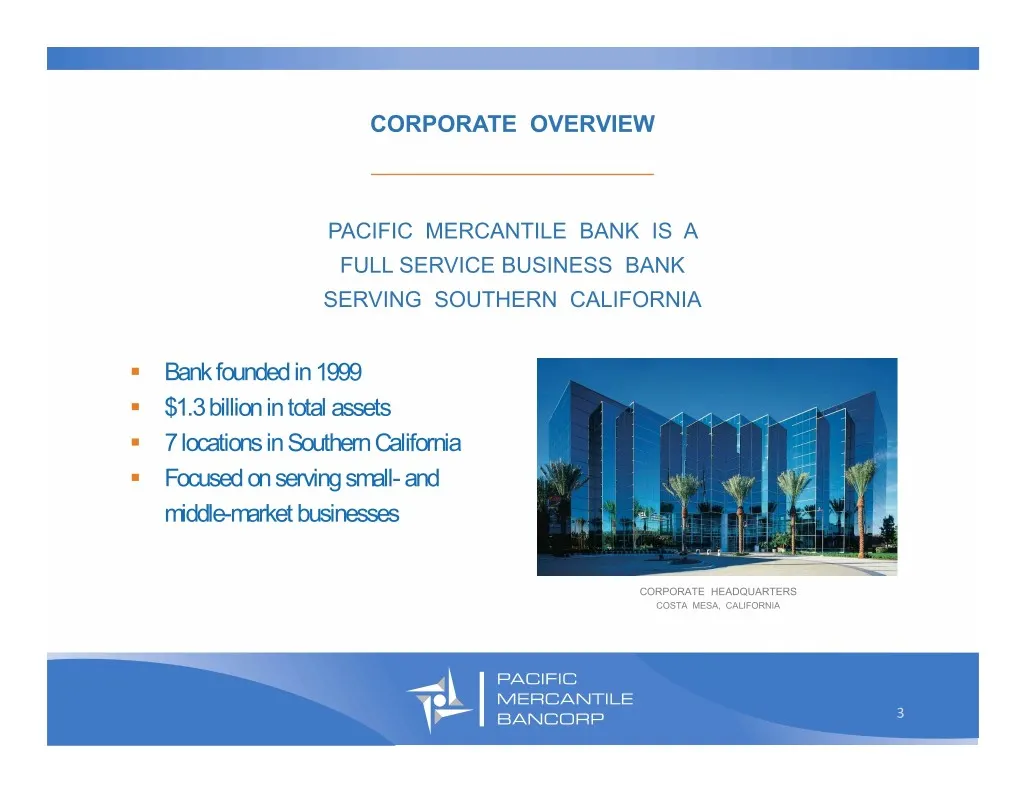
CORPORATE OVERVIEW _________________________________ PACIFIC MERCANTILE BANK IS A FULL SERVICE BUSINESS BANK SERVING SOUTHERN CALIFORNIA . Bank founded in 1999 . $1.3 billion in total assets . 7 locations in Southern California . Focused on serving small- and middle-market businesses CORPORATE HEADQ
Slide 4: Investment Highlights
INVESTMENT HIGHLIGHTS _________________________________ . Growing commercial bank operating in attractive Southern California markets . Well defined value proposition drives new client acquisition without compromising on pricing and terms . Favorable shifts in loan and deposit mix adding to franchis
Slide 5: Office Locations
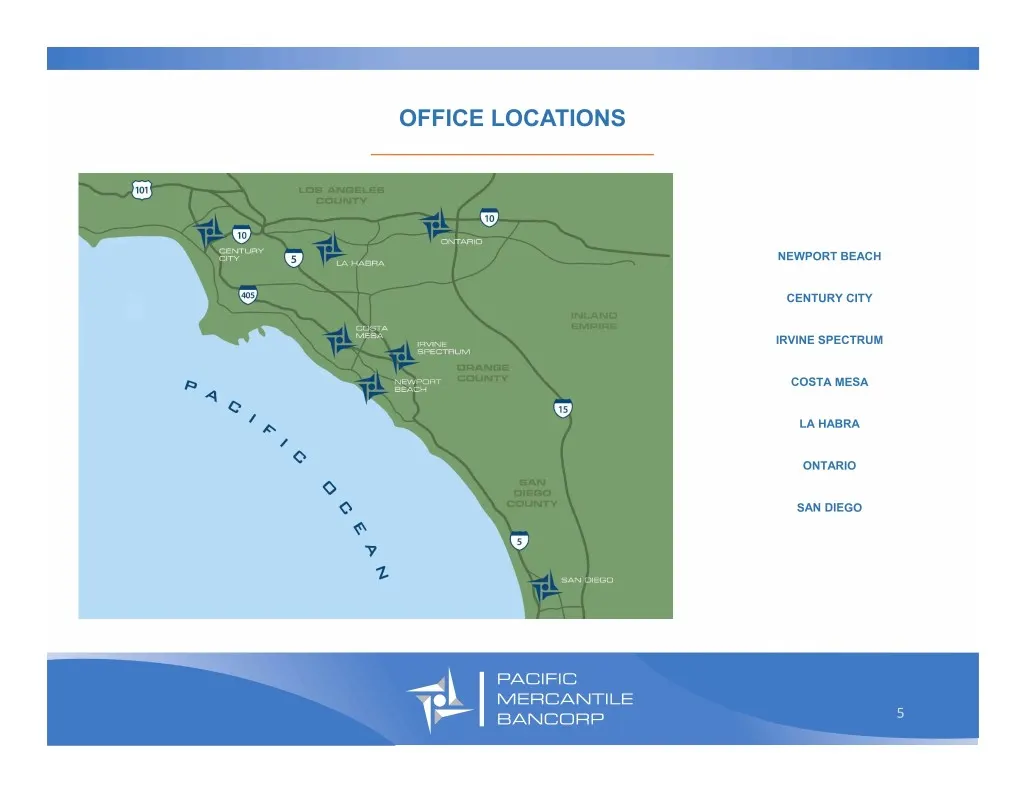
OFFICE LOCATIONS _________________________________ NEWPORT BEACH CENTURY CITY IRVINE SPECTRUM COSTA MESA LA HABRA ONTARIO SAN DIEGO 5
Slide 6: Executive Management Team
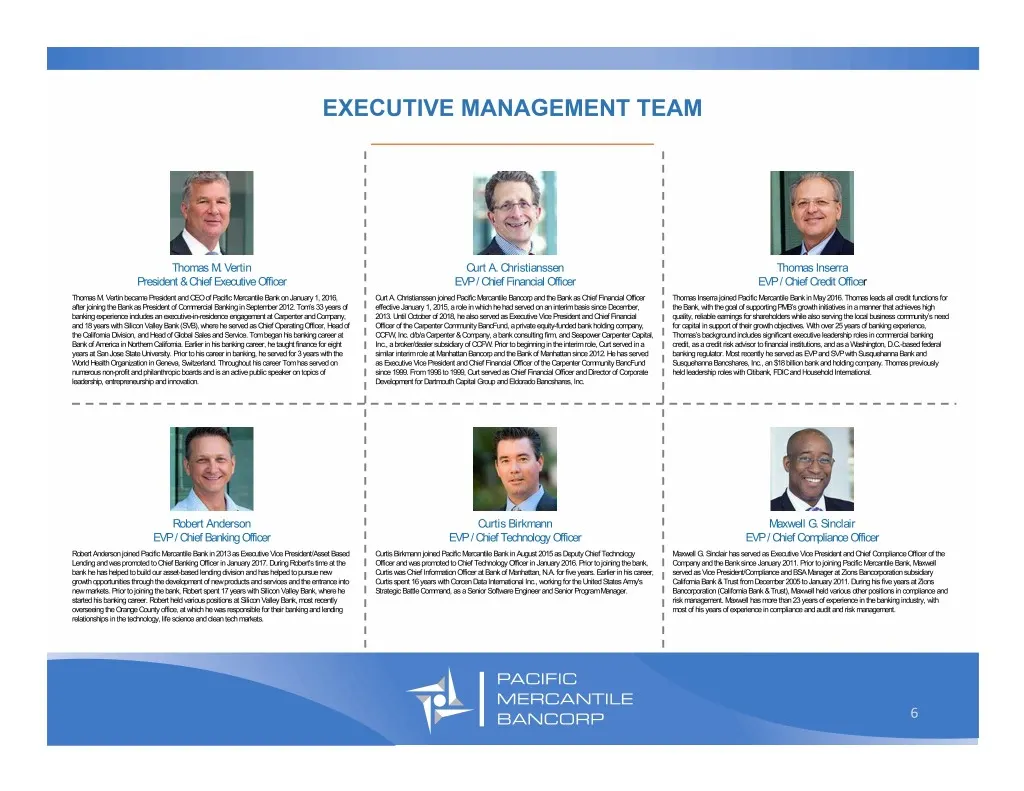
EXECUTIVE MANAGEMENT TEAM _________________________________ Thomas M. Vertin Curt A. Christianssen Thomas Inserra President & Chief Executive Officer EVP / Chief Financial Officer EVP / Chief Credit Officer Thomas M. Vertin became President and CEO of Pacific Mercantile Bank on January 1, 2016, Curt
Slide 7: Board of Directors
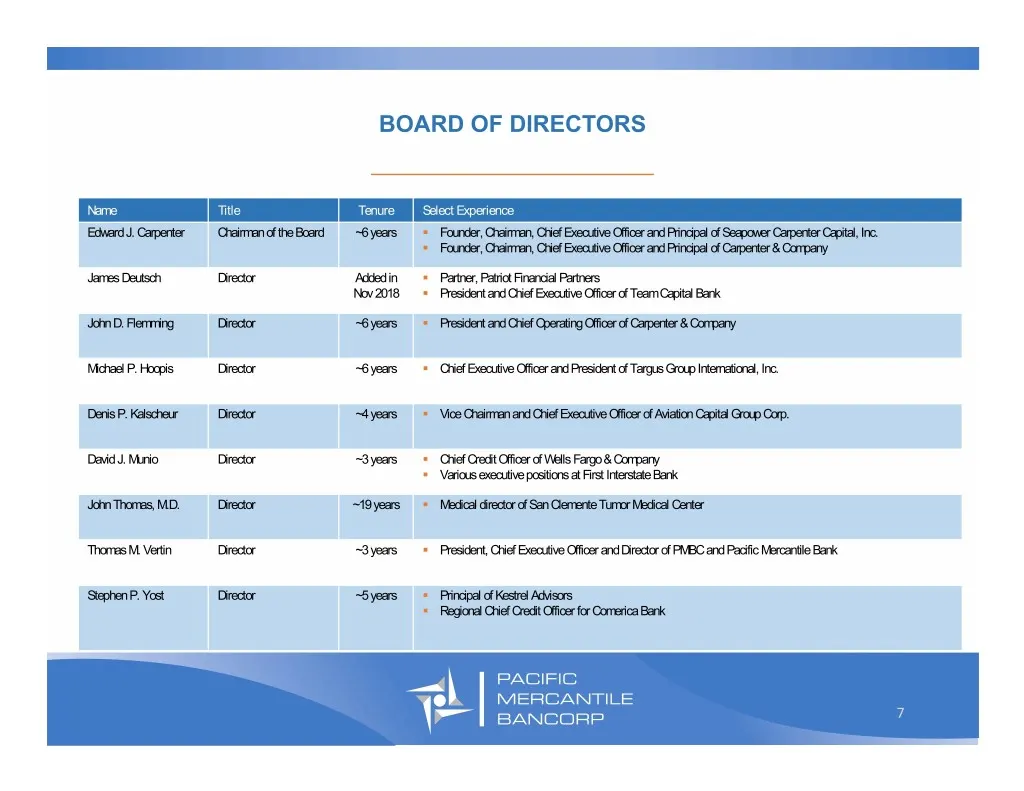
BOARD OF DIRECTORS _________________________________ Name Title Tenure Select Experience Edward J. Carpenter Chairman of the Board ~6 years . Founder, Chairman, Chief Executive Officer and Principal of Seapower Carpenter Capital, Inc. . Founder, Chairman, Chief Executive Officer and Principal of Car
Slide 8: Market Positioning
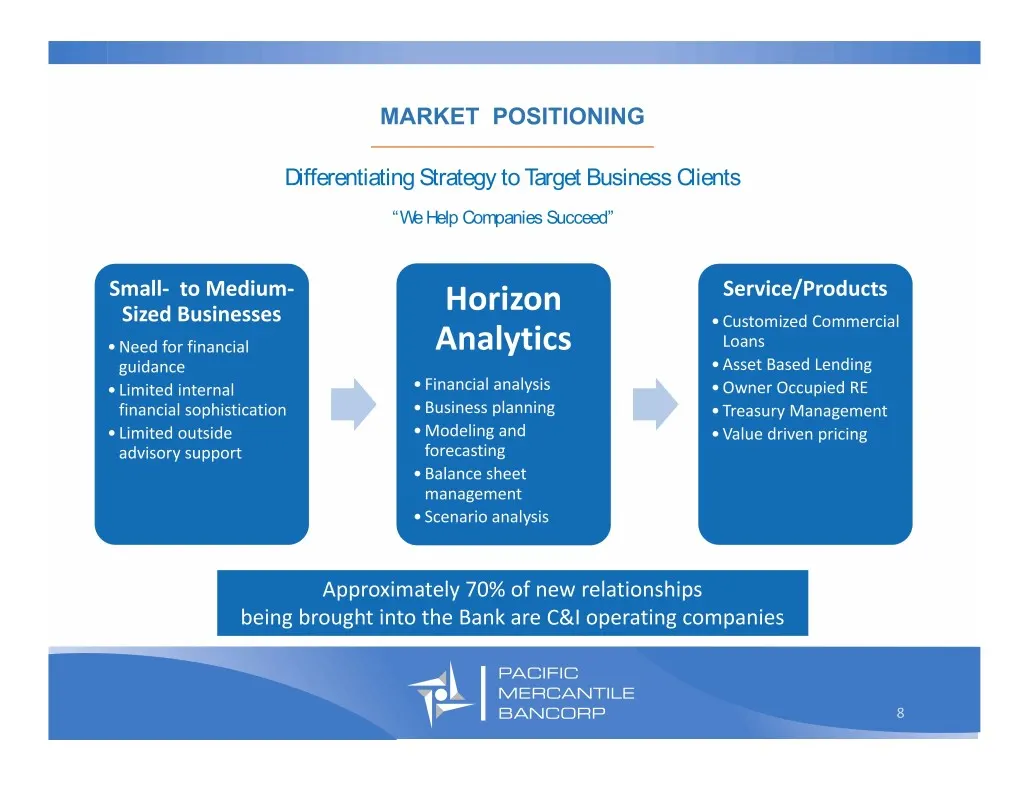
MARKET POSITIONING _________________________________ Differentiating Strategy to Target Business Clients “We Help Companies Succeed” Small‐ to Medium‐ Horizon Service/Products Sized Businesses • Customized Commercial • Need for financial Analytics Loans guidance • Asset Based Lending • Limited inter
Slide 9: Horizon Analytics
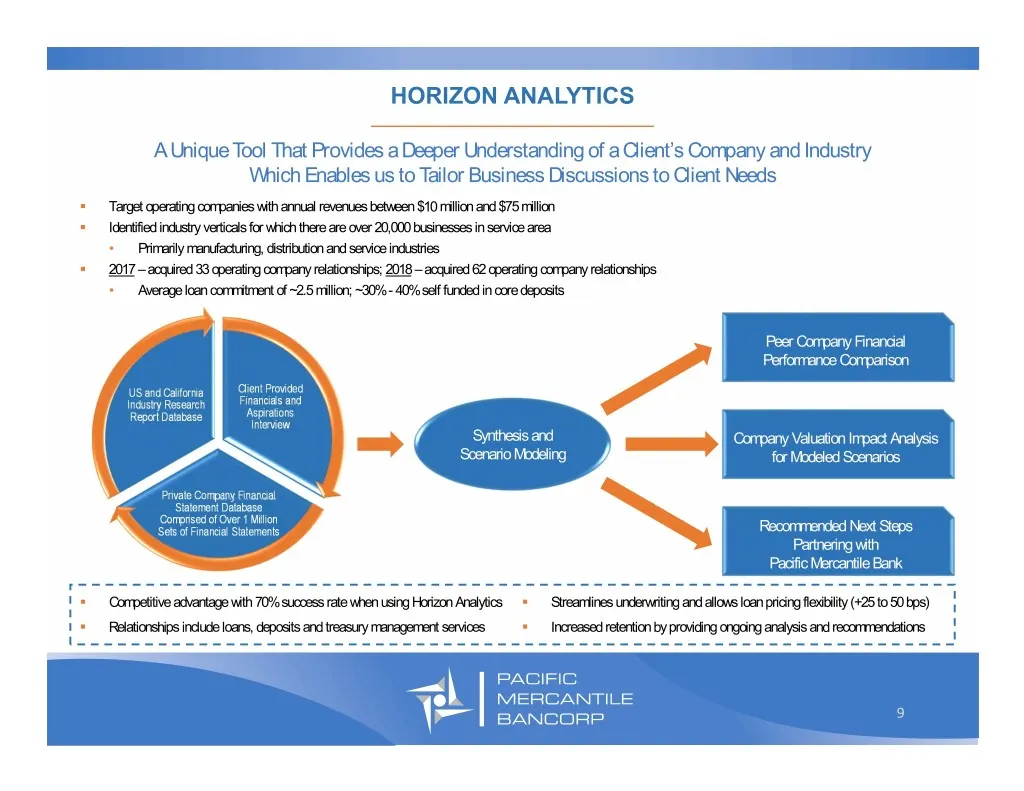
HORIZON ANALYTICS _________________________________ A Unique Tool That Provides a Deeper Understanding of a Client’s Company and Industry Which Enables us to Tailor Business Discussions to Client Needs . Target operating companies with annual revenues between $10 million and $75 million . Identified
Slide 10: Improving Profitability
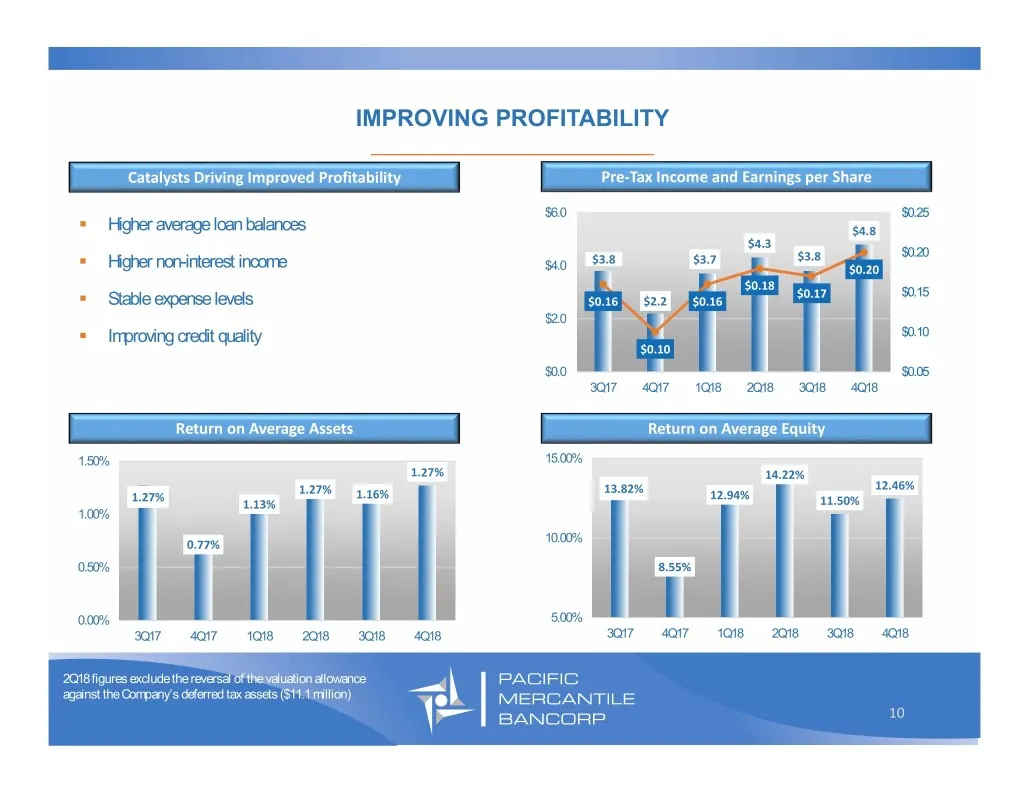
IMPROVING PROFITABILITY _________________________________ Catalysts Driving Improved Profitability Pre‐Tax Income and Earnings per Share $6.0 $0.25 . Higher average loan balances $4.8 $4.3 $0.20 $3.8 $3.7 $3.8 . Higher non-interest income $4.0 $0.20 $0.18 $0.17 $0.15 . Stable expense levels $0.16 $2
Slide 11: Loan Portfolio Focus on Relationship Lending
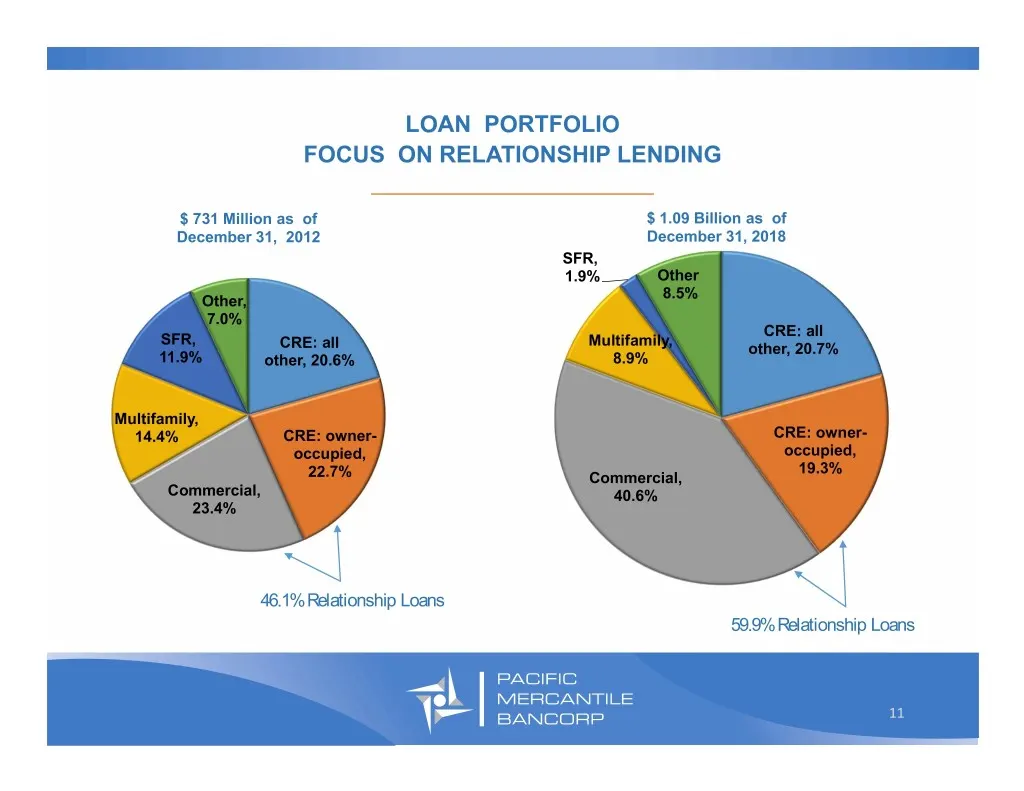
LOAN PORTFOLIO FOCUS ON RELATIONSHIP LENDING _________________________________ $ 731 Million as of $ 1.09 Billion as of December 31, 2012 December 31, 2018 SFR, 1.9% Other 8.5% Other, 7.0% CRE: all SFR, Multifamily, CRE: all other, 20.7% 11.9% other, 20.6% 8.9% Multifamily, 14.4% CRE: owner- CRE: ow
Slide 12: Loan Production Trends
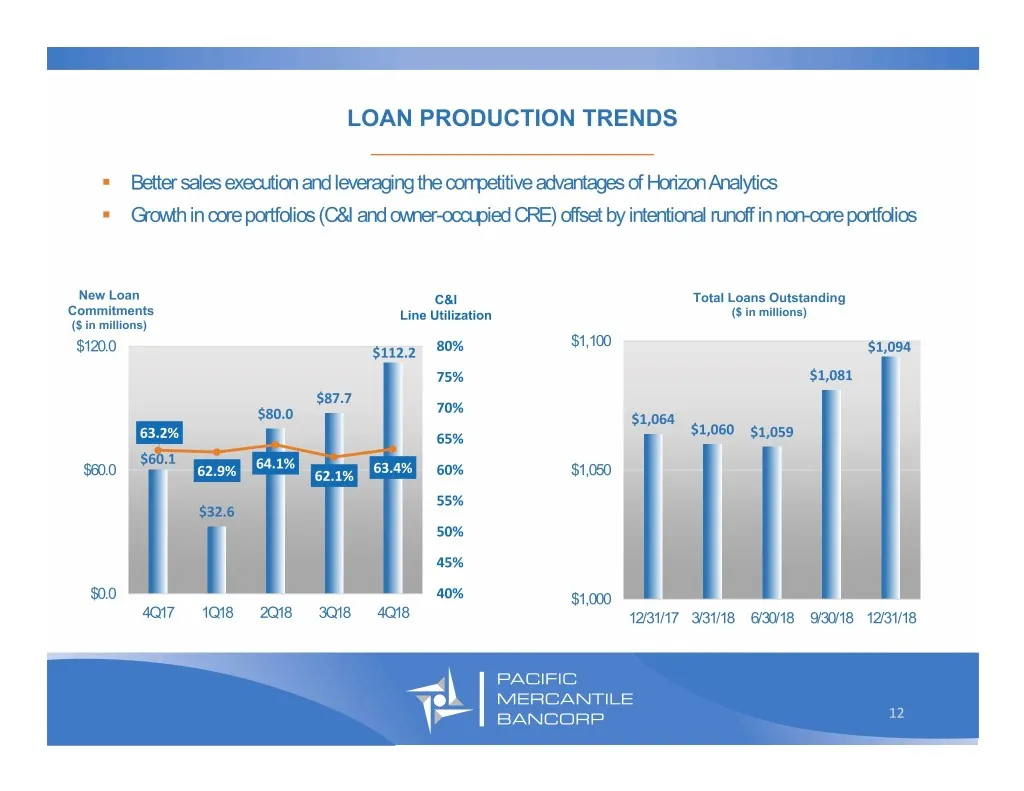
LOAN PRODUCTION TRENDS _________________________________ . Better sales execution and leveraging the competitive advantages of Horizon Analytics . Growth in core portfolios (C&I and owner-occupied CRE) offset by intentional runoff in non-core portfolios New Loan C&I Total Loans Outstanding Commitmen
Slide 13: C&I Driving Loan Growth
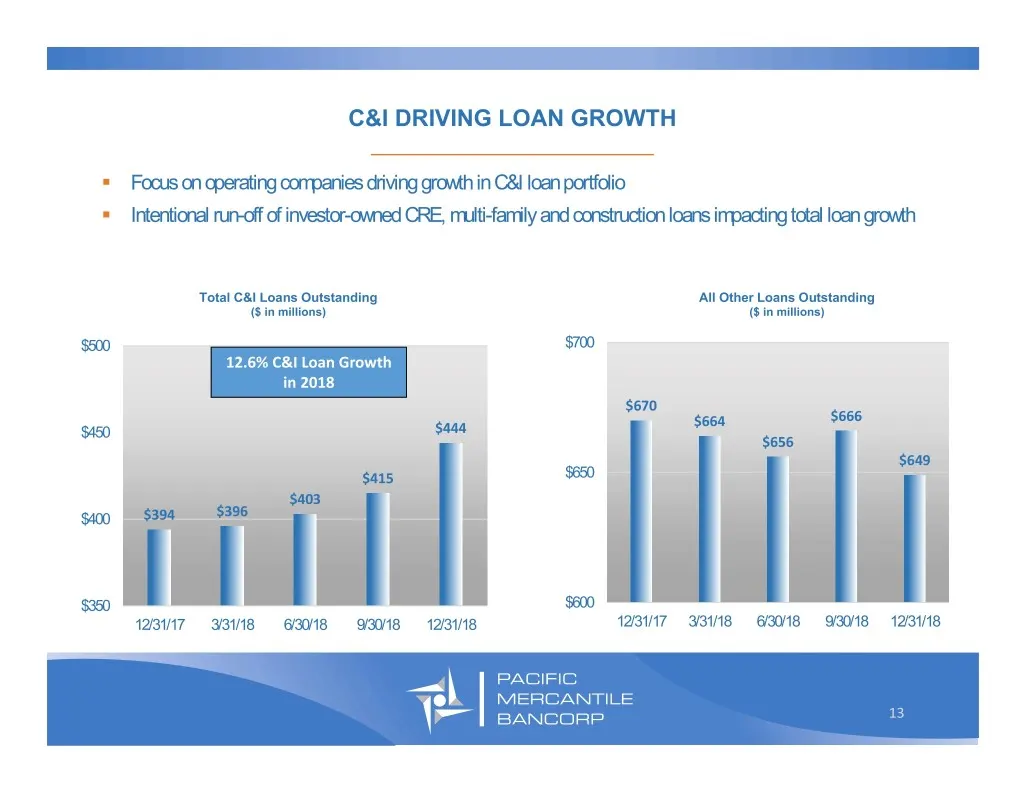
C&I DRIVING LOAN GROWTH _________________________________ . Focus on operating companies driving growth in C&I loan portfolio . Intentional run-off of investor-owned CRE, multi-family and construction loans impacting total loan growth Total C&I Loans Outstanding All Other Loans Outstanding ($ in mil
Slide 14: Loan Repricing Data
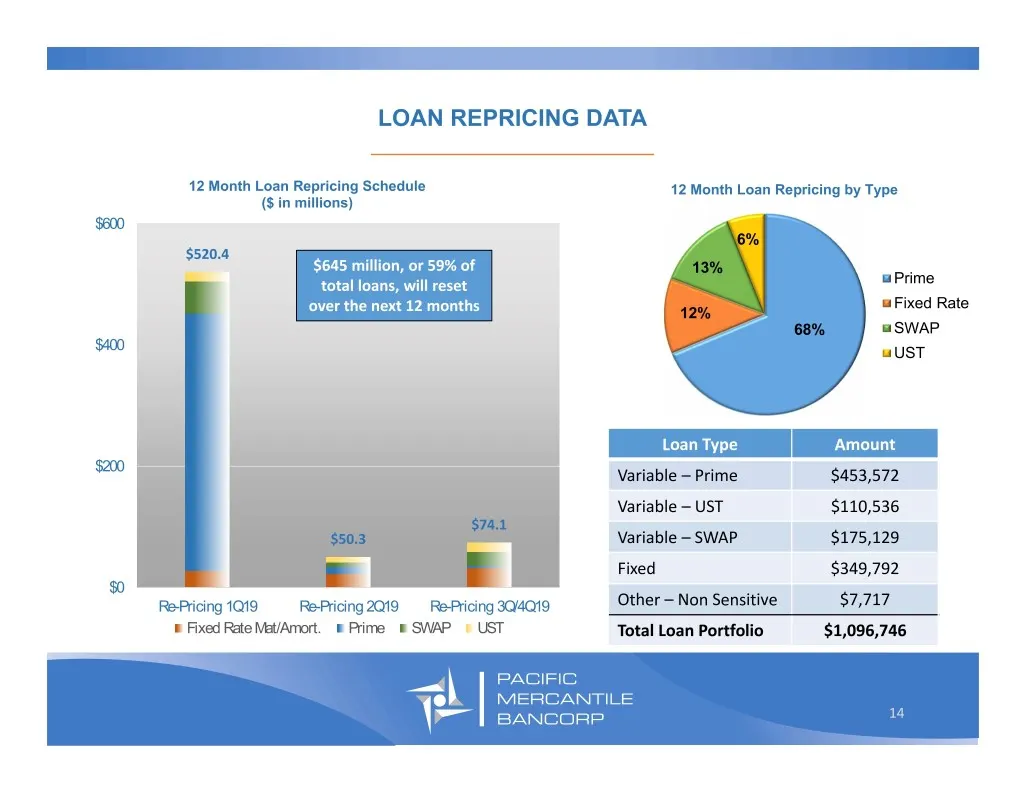
LOAN REPRICING DATA _________________________________ 12 Month Loan Repricing Schedule 12 Month Loan Repricing by Type ($ in millions) $600 6% $520.4 $645 million, or 59% of 13% total loans, will reset Prime Fixed Rate over the next 12 months 12% 68% SWAP $400 UST Loan Type Amount $200 Variable – Pr
Slide 15: Asset Quality
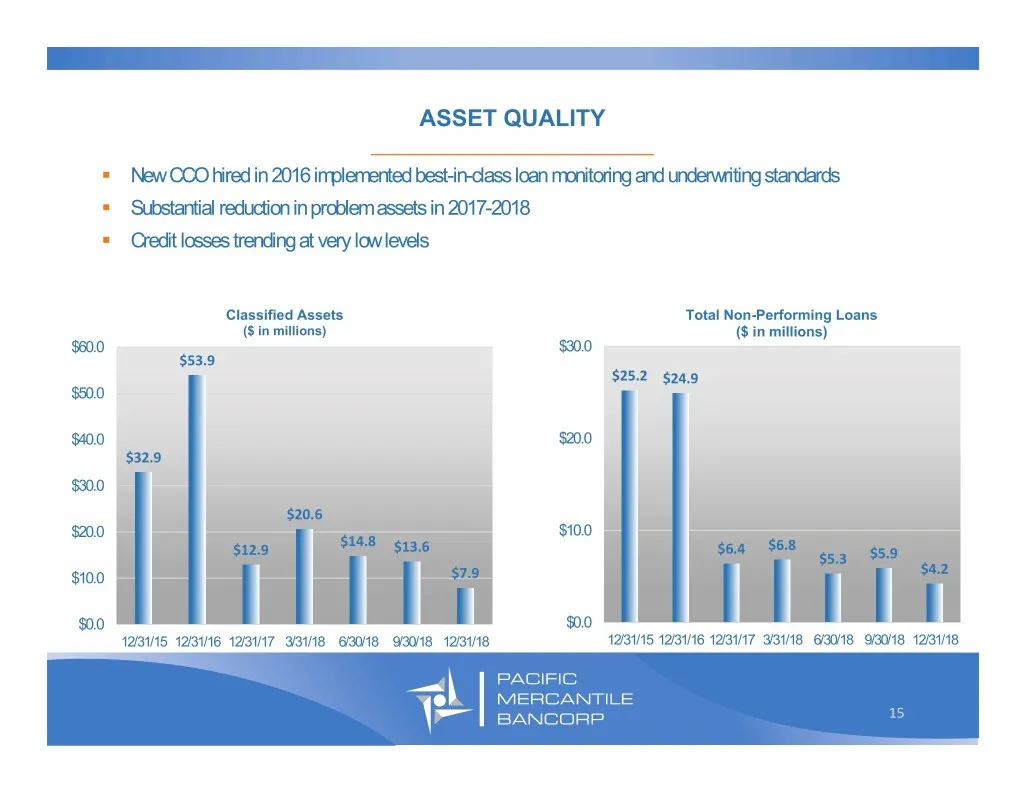
ASSET QUALITY _________________________________ . New CCO hired in 2016 implemented best-in-class loan monitoring and underwriting standards . Substantial reduction in problem assets in 2017-2018 . Credit losses trending at very low levels Classified Assets Total Non-Performing Loans ($ in millions)
Slide 16: Deposit Composition Focused on Core Deposits
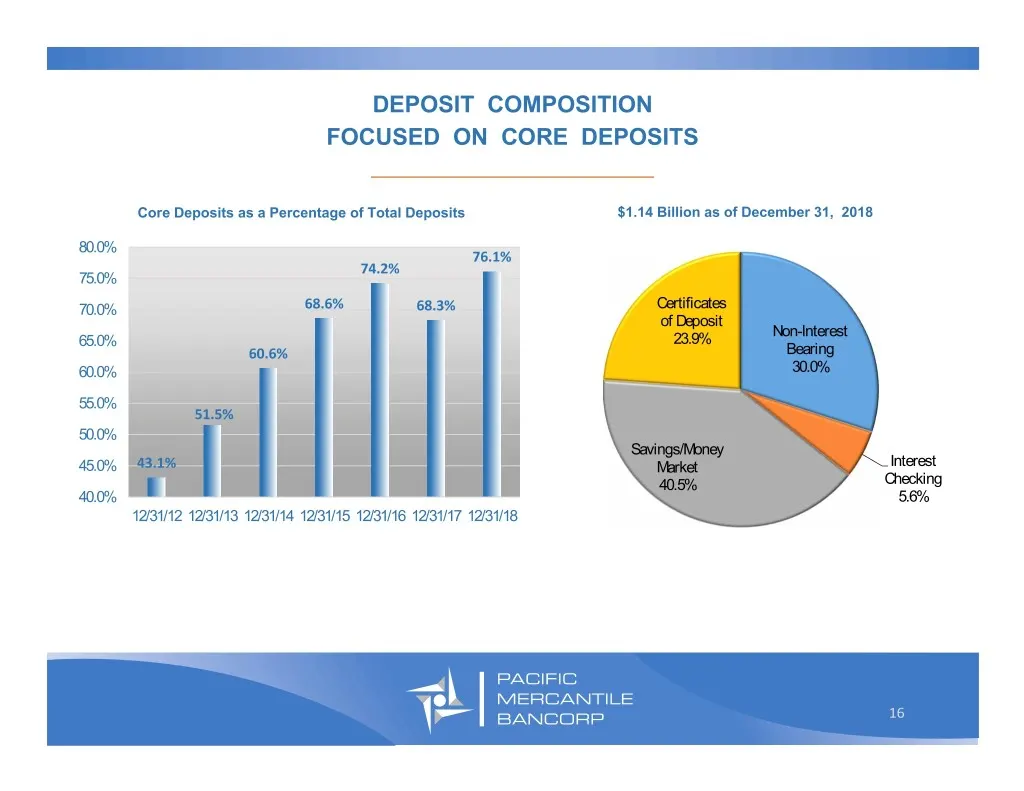
DEPOSIT COMPOSITION FOCUSED ON CORE DEPOSITS _________________________________ Core Deposits as a Percentage of Total Deposits $1.14 Billion as of December 31, 2018 80.0% 76.1% 74.2% 75.0% 70.0% 68.6% 68.3% Certificates of Deposit Non-Interest 65.0% 23.9% 60.6% Bearing 60.0% 30.0% 55.0% 51.5% 50.0%
Slide 17: Improving Funding Profile
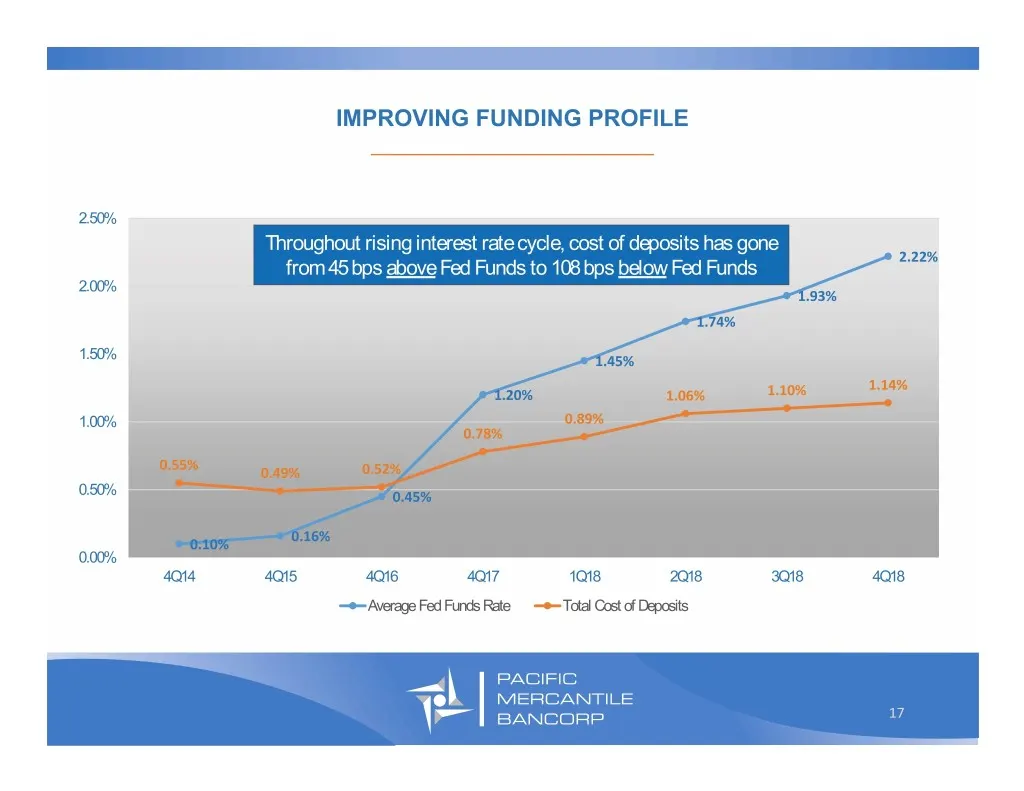
IMPROVING FUNDING PROFILE _________________________________ 2.50% Throughout rising interest rate cycle, cost of deposits has gone 2.22% from 45 bps above Fed Funds to 108 bps below Fed Funds 2.00% 1.93% 1.74% 1.50% 1.45% 1.14% 1.20% 1.06% 1.10% 1.00% 0.89% 0.78% 0.55% 0.49% 0.52% 0.50% 0.45% 0.16%
Slide 18: 2018 Deposit Beta Trend
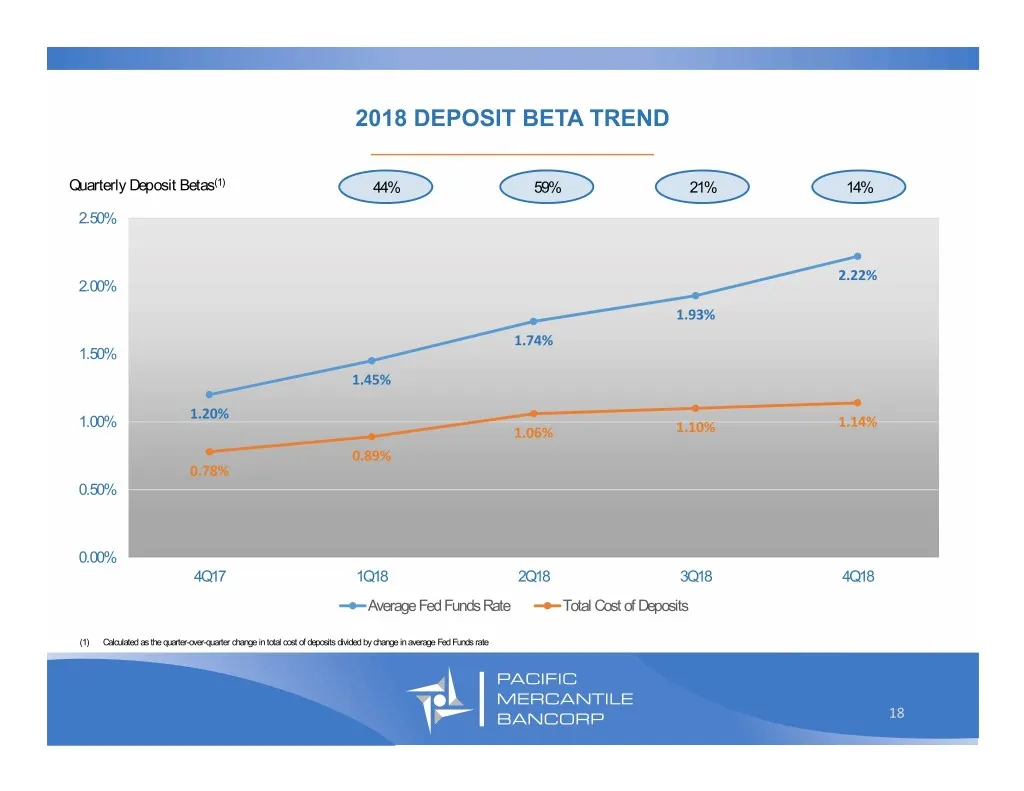
2018 DEPOSIT BETA TREND _________________________________ Quarterly Deposit Betas(1) 44% 59% 21% 14% 2.50% 2.22% 2.00% 1.93% 1.74% 1.50% 1.45% 1.20% 1.00% 1.14% 1.06% 1.10% 0.89% 0.78% 0.50% 0.00% 4Q17 1Q18 2Q18 3Q18 4Q18 Average Fed Funds Rate Total Cost of Deposits (1) Calculated as the quarter-ov
Slide 19: Time Deposit Maturity Schedule
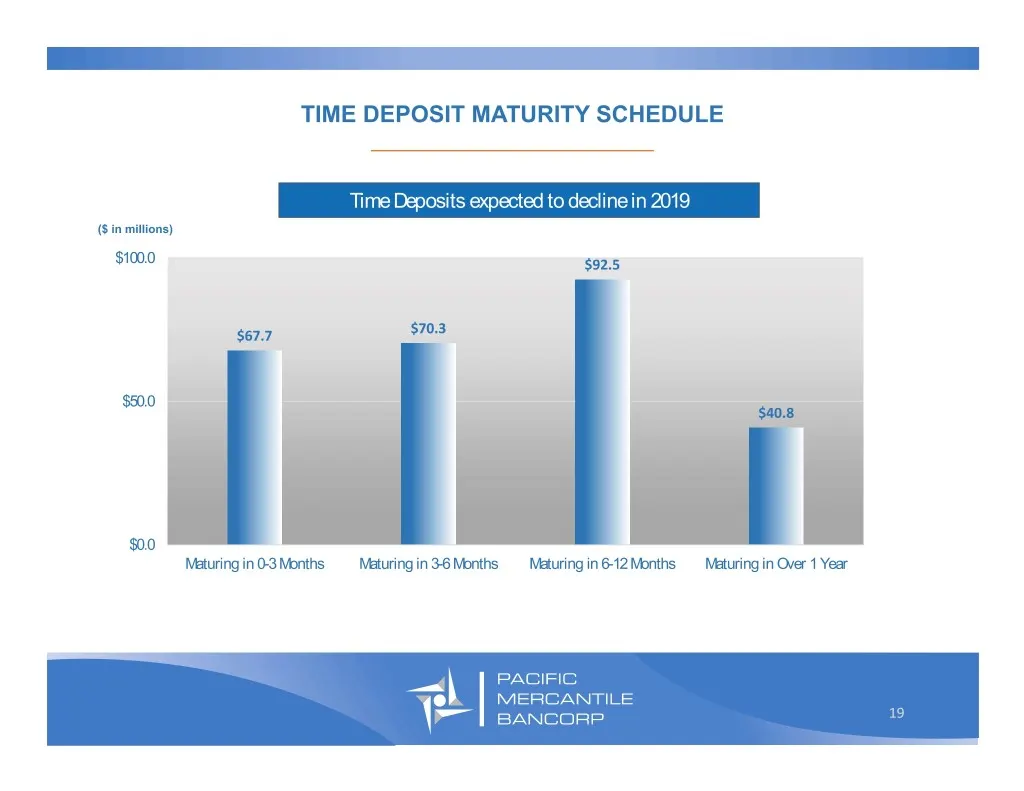
TIME DEPOSIT MATURITY SCHEDULE _________________________________ Time Deposits expected to decline in 2019 ($ in millions) $100.0 $92.5 $67.7 $70.3 $50.0 $40.8 $0.0 Maturing in 0-3 Months Maturing in 3-6 Months Maturing in 6-12 Months Maturing in Over 1 Year 19
Slide 20: Improving Operating Leverage
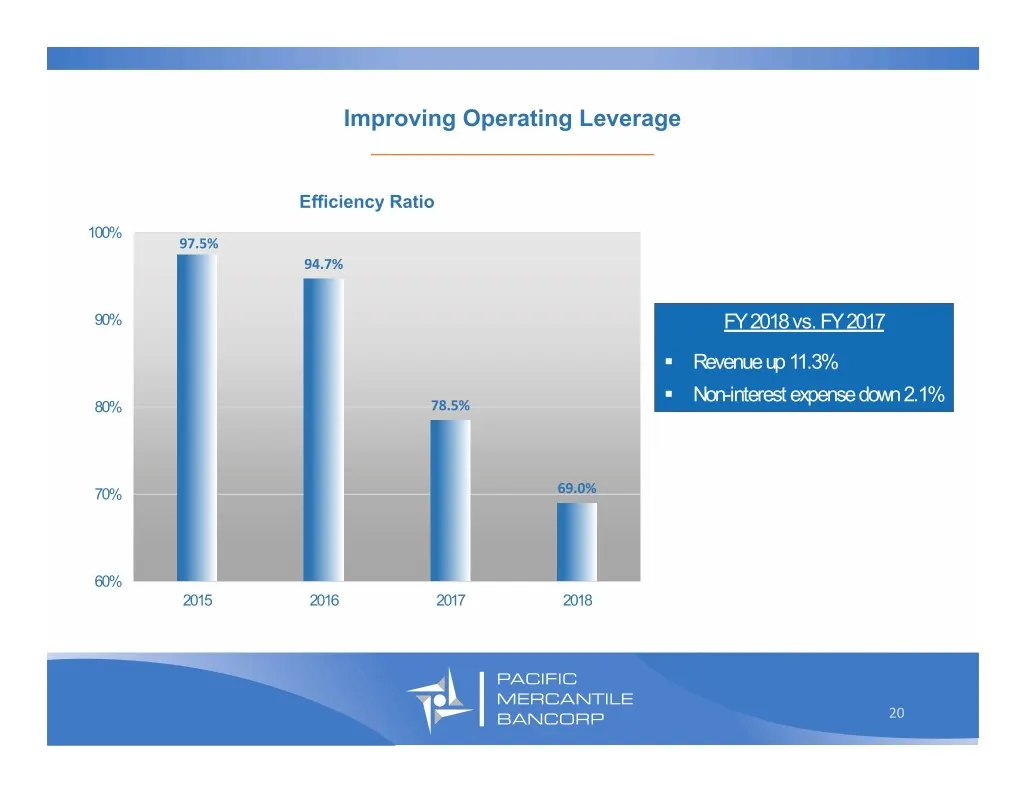
Improving Operating Leverage _________________________________ Efficiency Ratio 100% 97.5% 94.7% 90% FY 2018 vs. FY 2017 . Revenue up 11.3% . Non-interest expense down 2.1% 80% 78.5% 70% 69.0% 60% 2015 2016 2017 2018 20
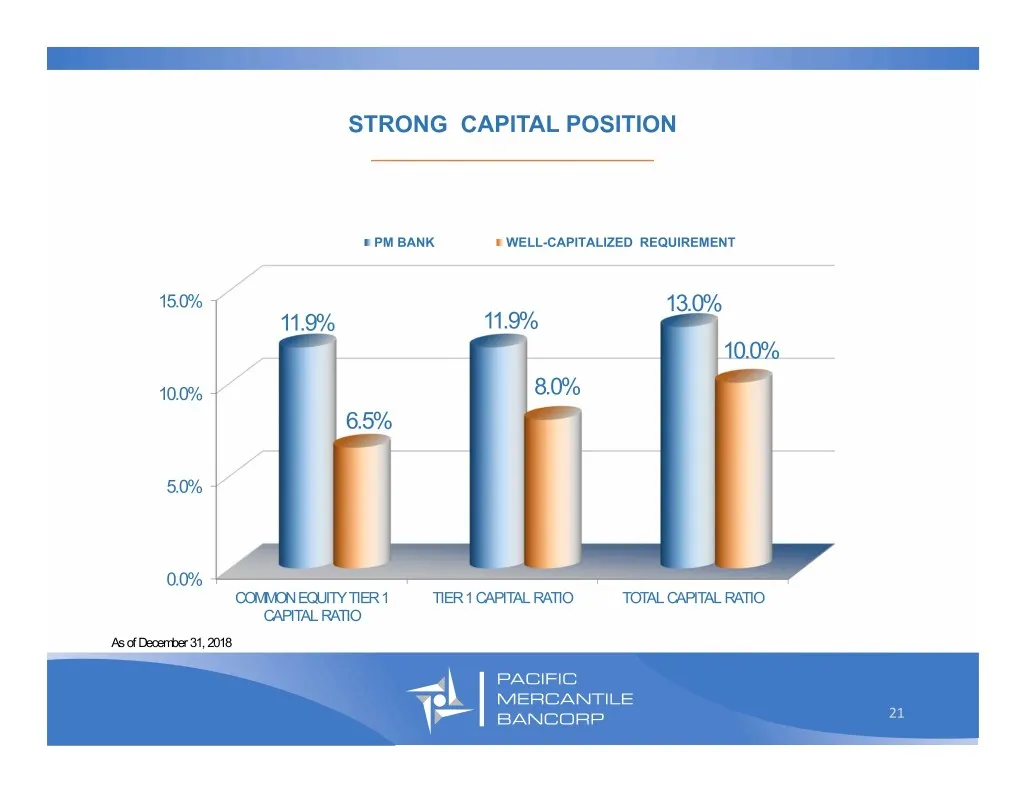
Slide 21: Strong Capital Position
STRONG CAPITAL POSITION _________________________________ PM BANK WELL-CAPITALIZED REQUIREMENT 15.0% 13.0% 11.9% 11.9% 10.0% 10.0% 8.0% 6.5% 5.0% 0.0% COMMON EQUITY TIER 1 TIER 1 CAPITAL RATIO TOTAL CAPITAL RATIO CAPITAL RATIO As of December 31, 2018 21
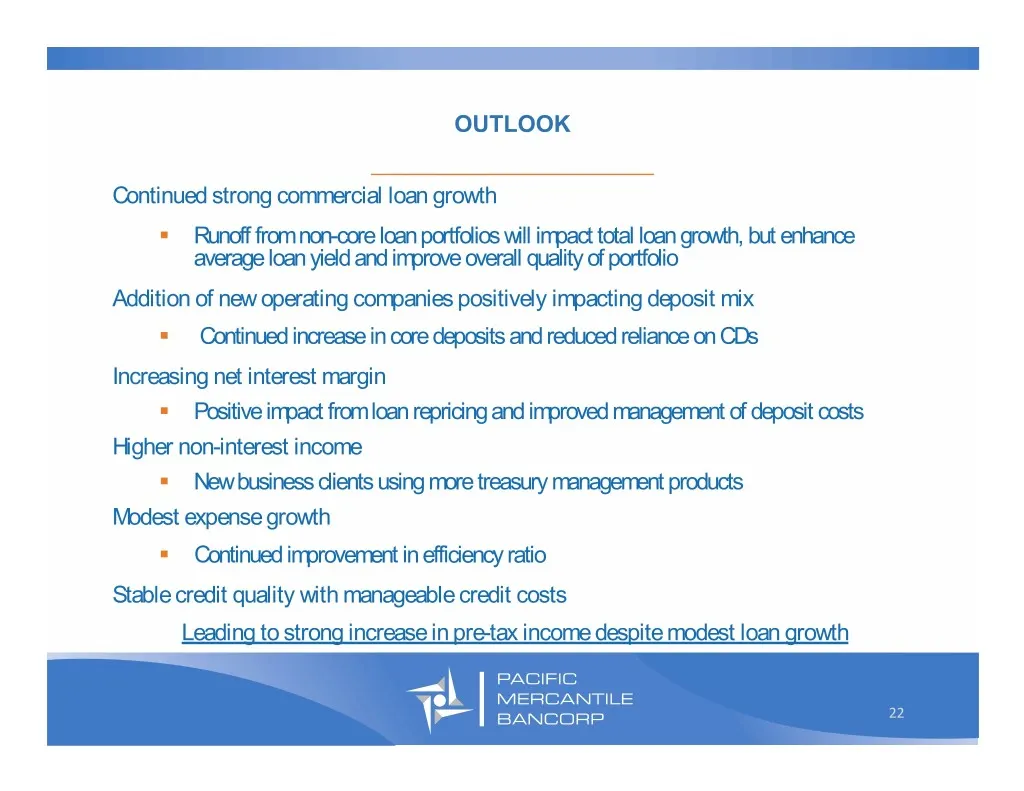
Slide 22: Outlook
OUTLOOK _________________________________ Continued strong commercial loan growth . Runoff from non-core loan portfolios will impact total loan growth, but enhance average loan yield and improve overall quality of portfolio Addition of new operating companies positively impacting deposit mix . Conti
Slide 23: Investor Relations Contact
Investor Relations: Curt Christianssen (714) 438-2531 [email protected] 23
Source: SEC EDGAR · 8-K filed Jan 28, 2019
More decks from Pacific Mercantile Bancorp
 Q1 2021 Earnings Presentation18 slides · Apr 26, 2021
 Merger or Acquisition (March 2021)9 slides · Mar 23, 2021
 Q4 2020 Earnings Presentation22 slides · Jan 25, 2021
 Q3 2020 Earnings Presentation23 slides · Nov 2, 2020
 Corporate Update (September 2020)25 slides · Sep 8, 2020
 Corporate Update (August 2020)25 slides · Aug 5, 2020