Omni Financial Services Inc · OTC:OFSI
Omni Financial Services — Investor Presentation (April 2007)
16 slides from Omni Financial Services's investor presentation, Apr 13, 2007
Slide 1: Omni Financial Services, Inc.
Exhibit 99.1 AY Omni Financial Services, Inc. iy 4
Slide 2: Forward Looking Statements
Forward Looking Statements During the course of this presentation, management may make projections and forward-looking statements regarding events or the future financial performance of Omni Financial Services,Inc. We wish to caution you that these forward-looking statements involve certain risks an
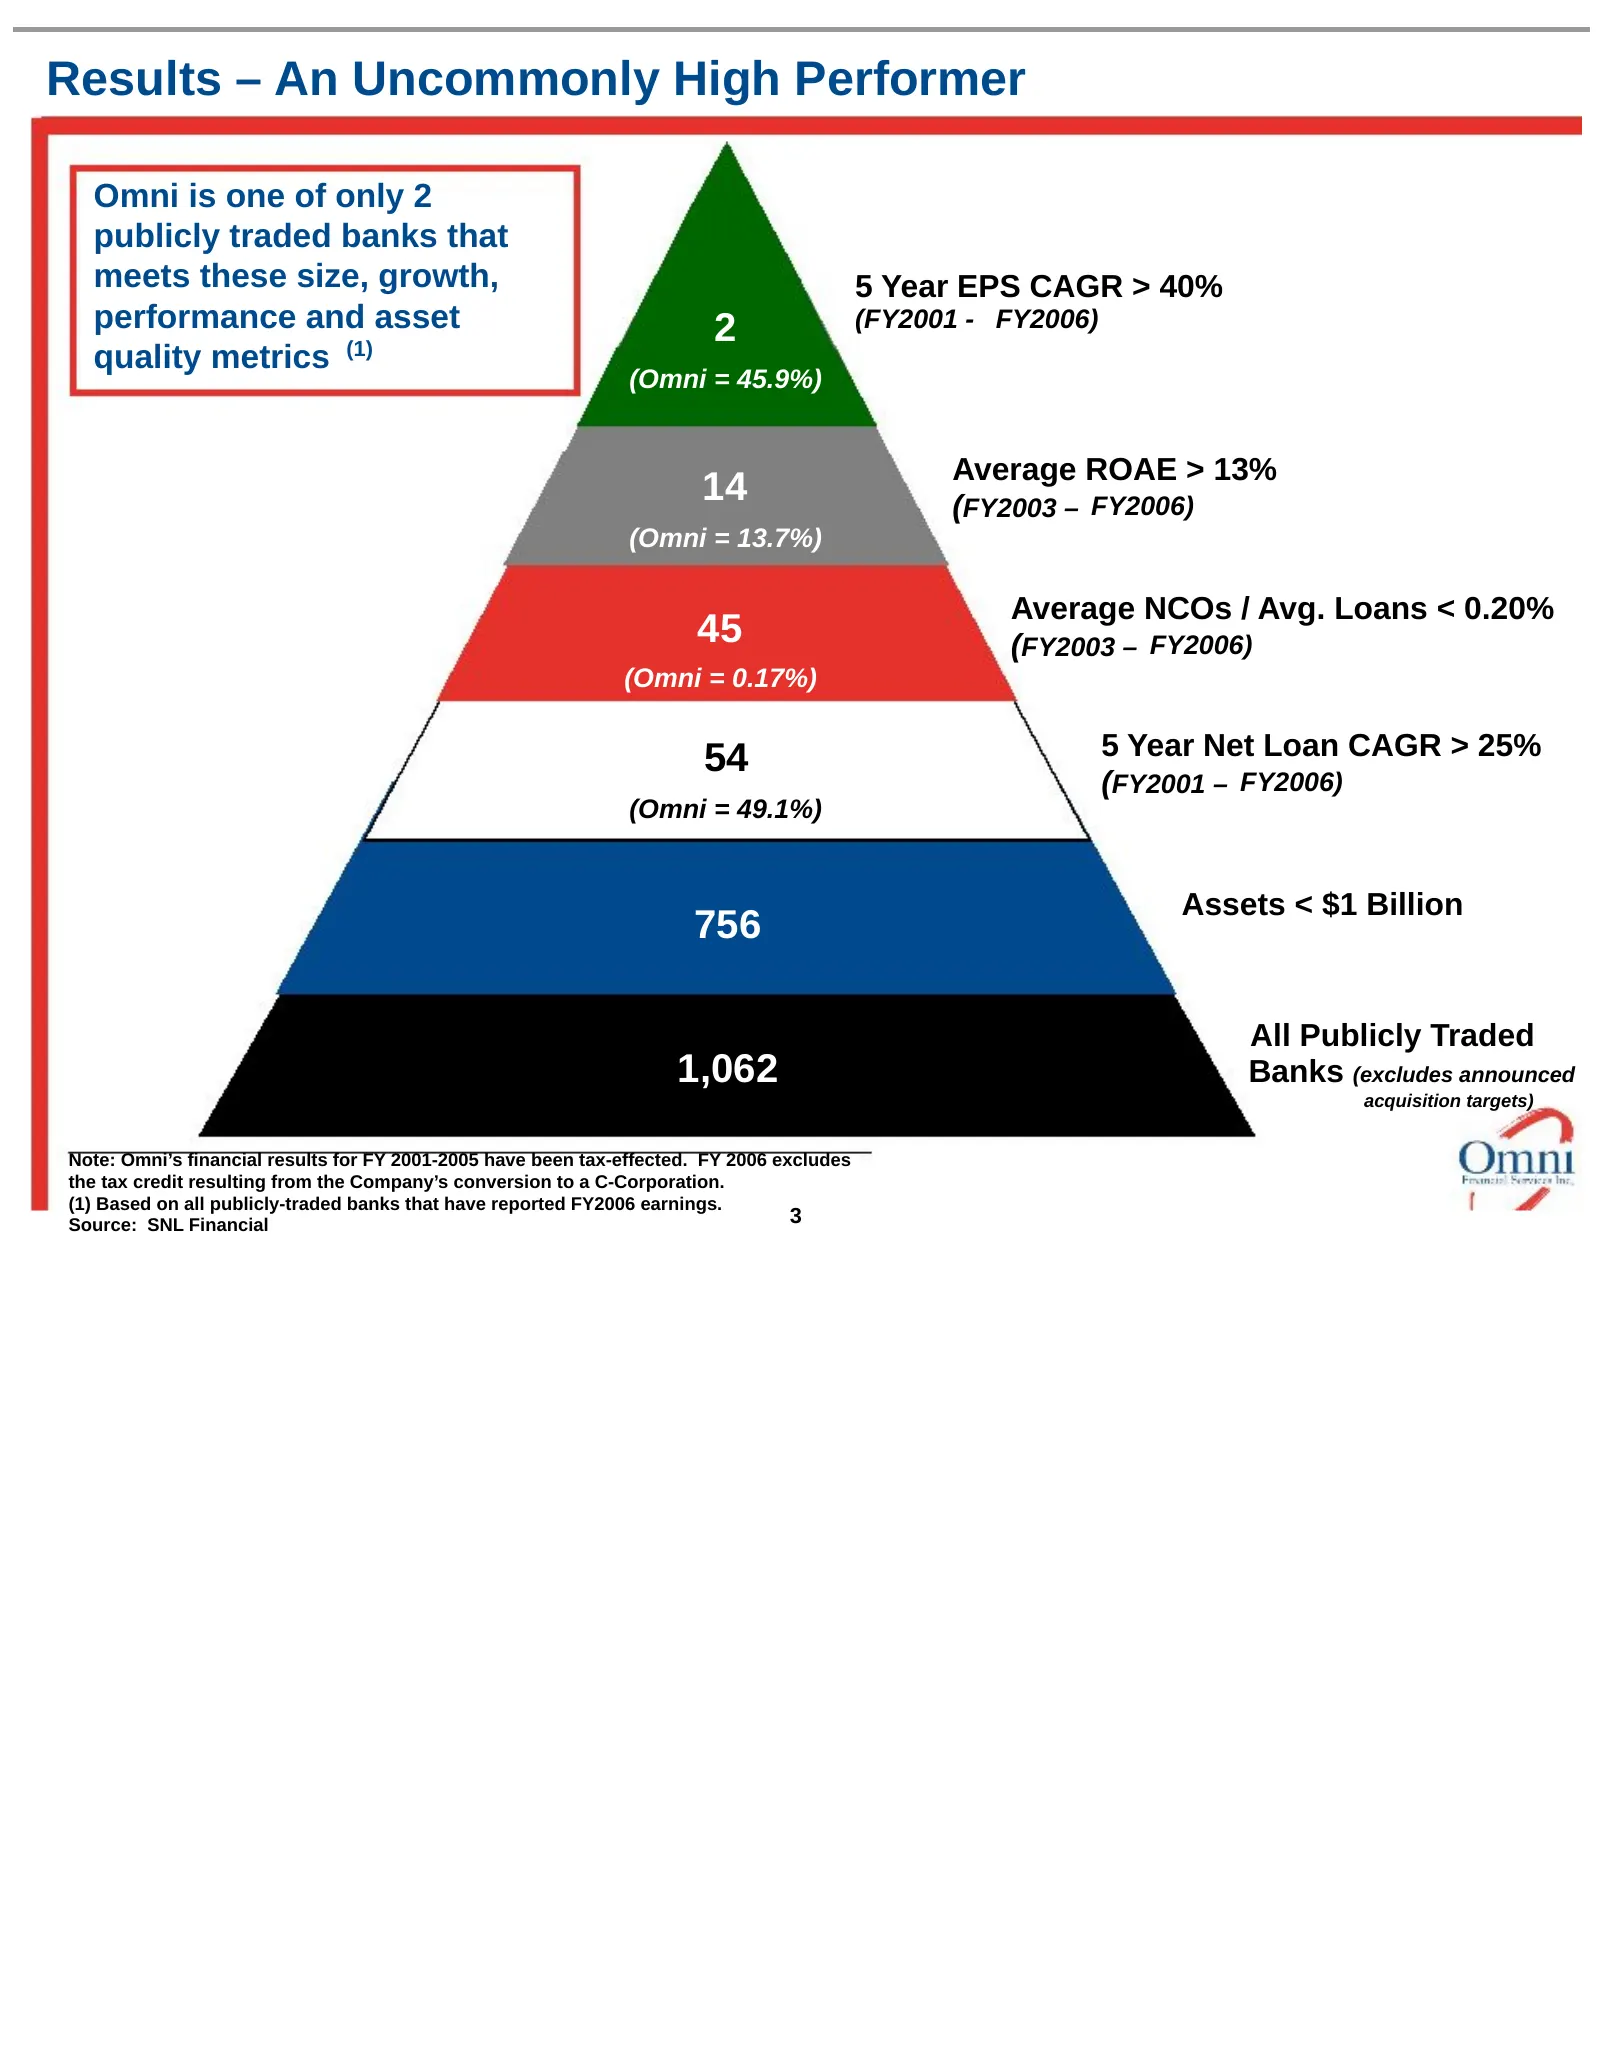
Slide 3: Results – An Uncommonly High Performer
Results – An Uncommonly High Performer Omni is one of only 2 publicly traded banks that meets these size, growth, 5 Year EPS CAGR > 40% performance and asset 2 (FY2001 - FY2006) quality metrics (1) (Omni = 45.9%) Average ROAE > 13% 14 (FY2003 – FY2006) (Omni = 13.7%) Average NCOs / Avg. Loans < 0.20
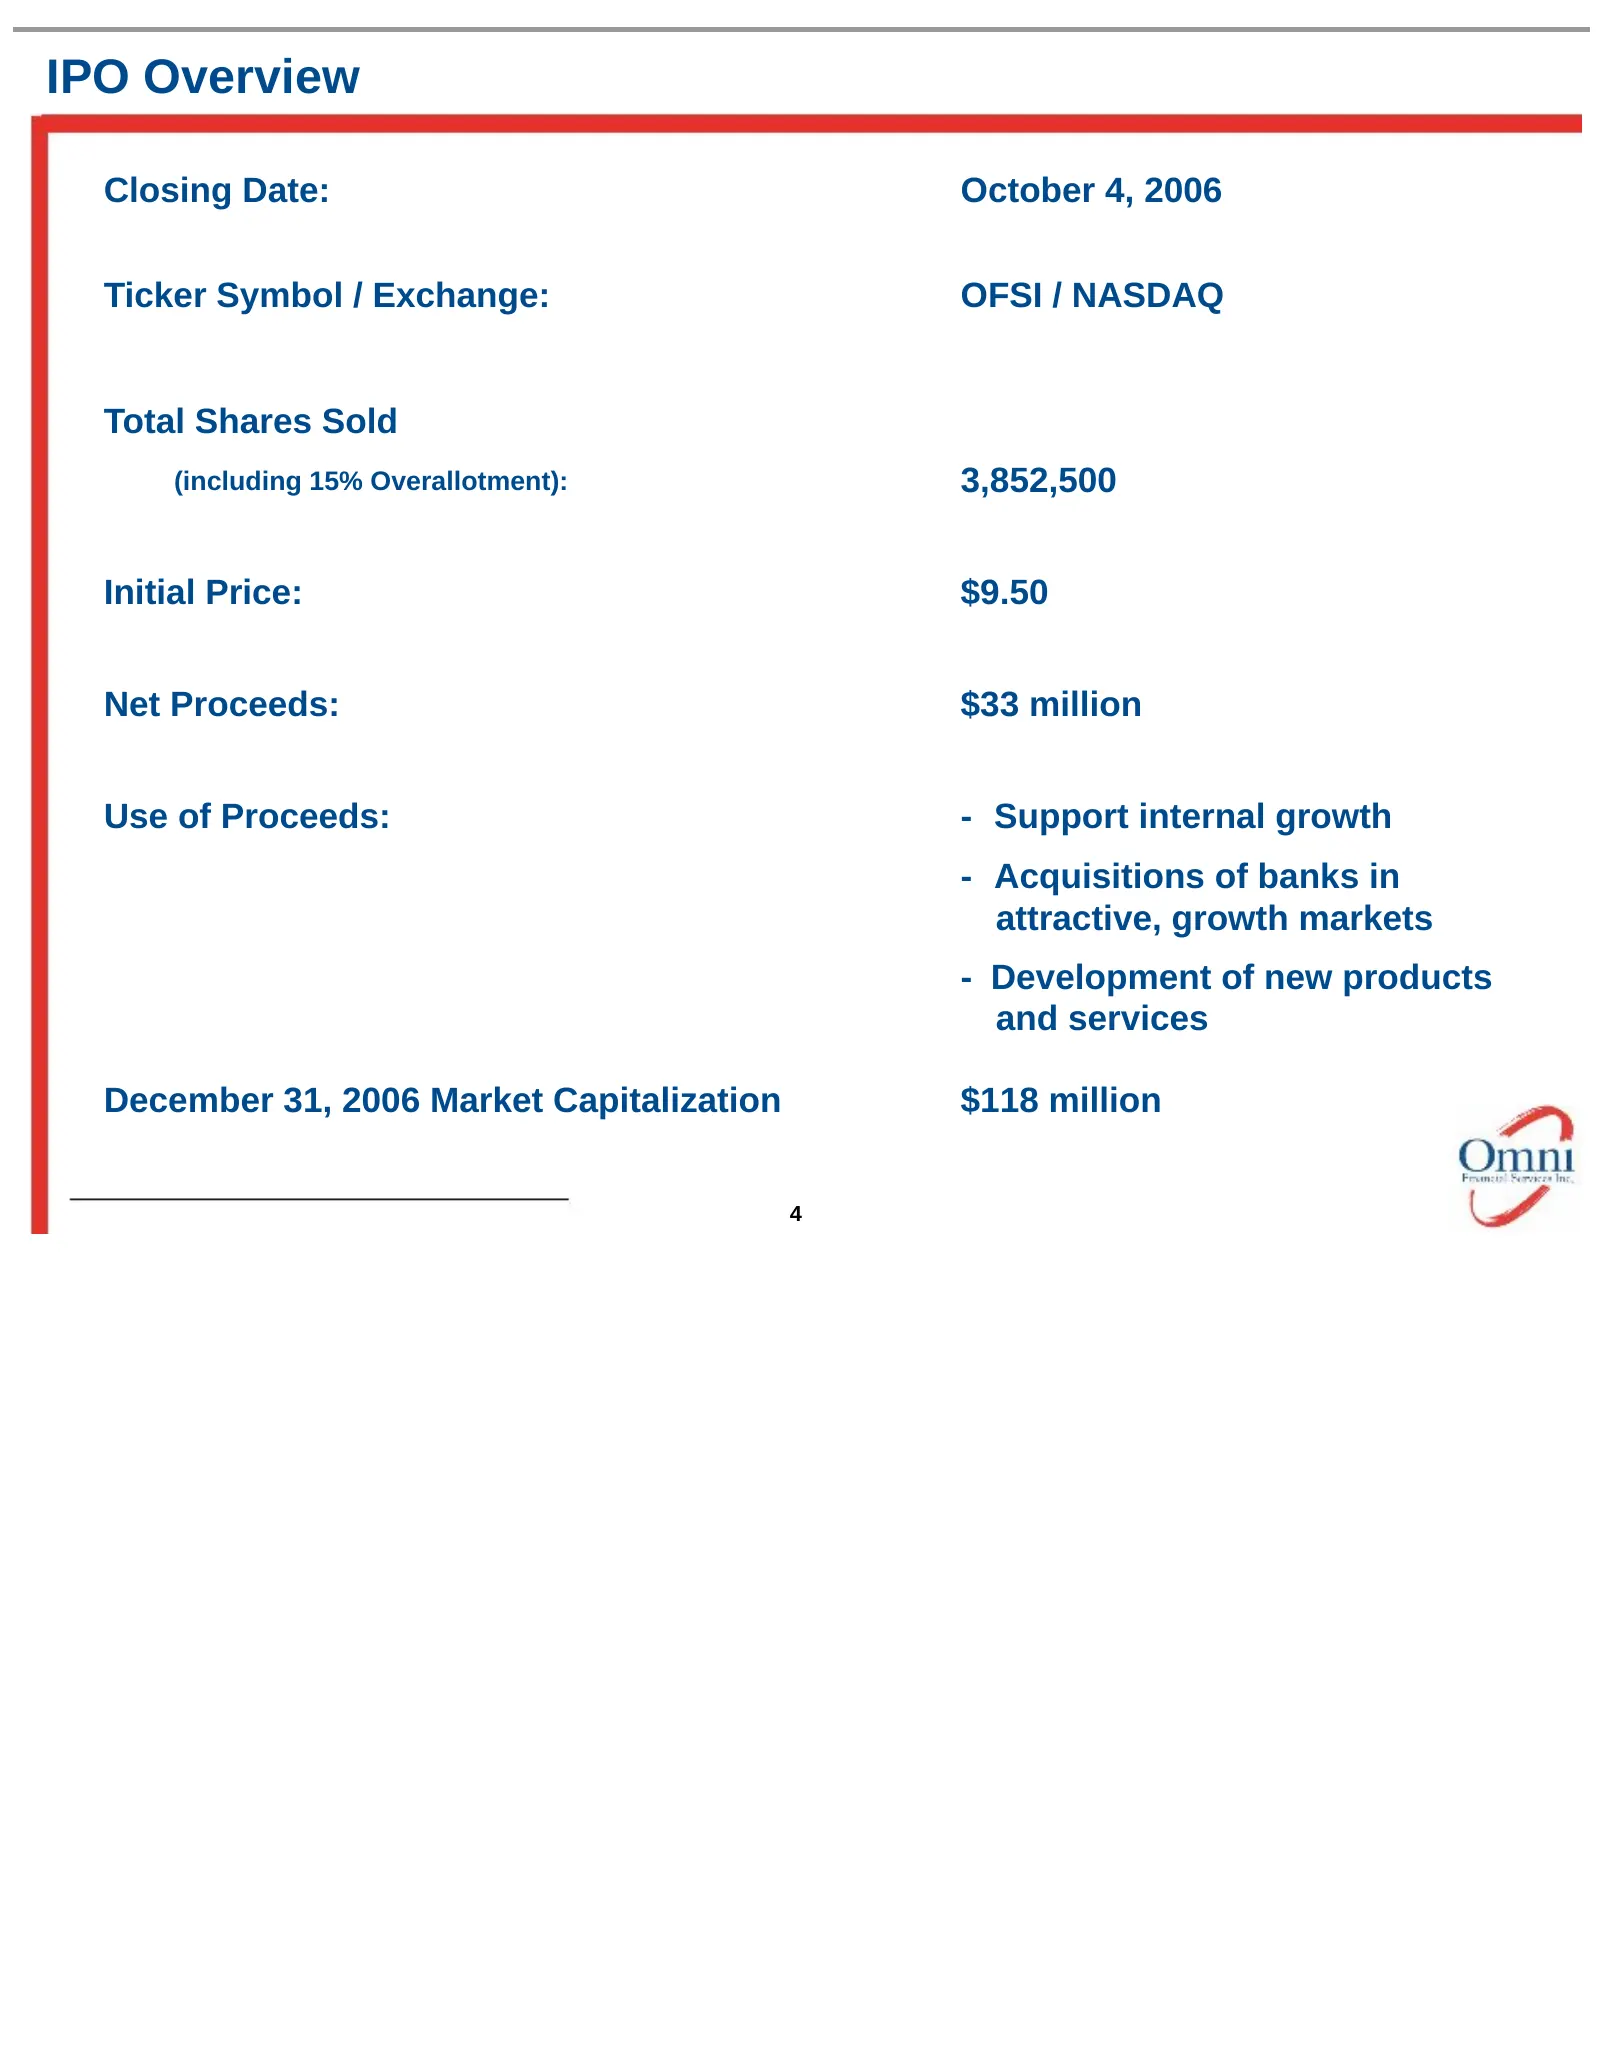
Slide 4: IPO Overview
IPO Overview Closing Date: October 4, 2006 Ticker Symbol / Exchange: OFSI / NASDAQ Total Shares Sold (including 15% Overallotment): 3,852,500 Initial Price: $9.50 Net Proceeds: $33 million Use of Proceeds: - Support internal growth - Acquisitions of banks in attractive, growth markets - Development
Slide 5: Omni - A History of Executing on Opportunities
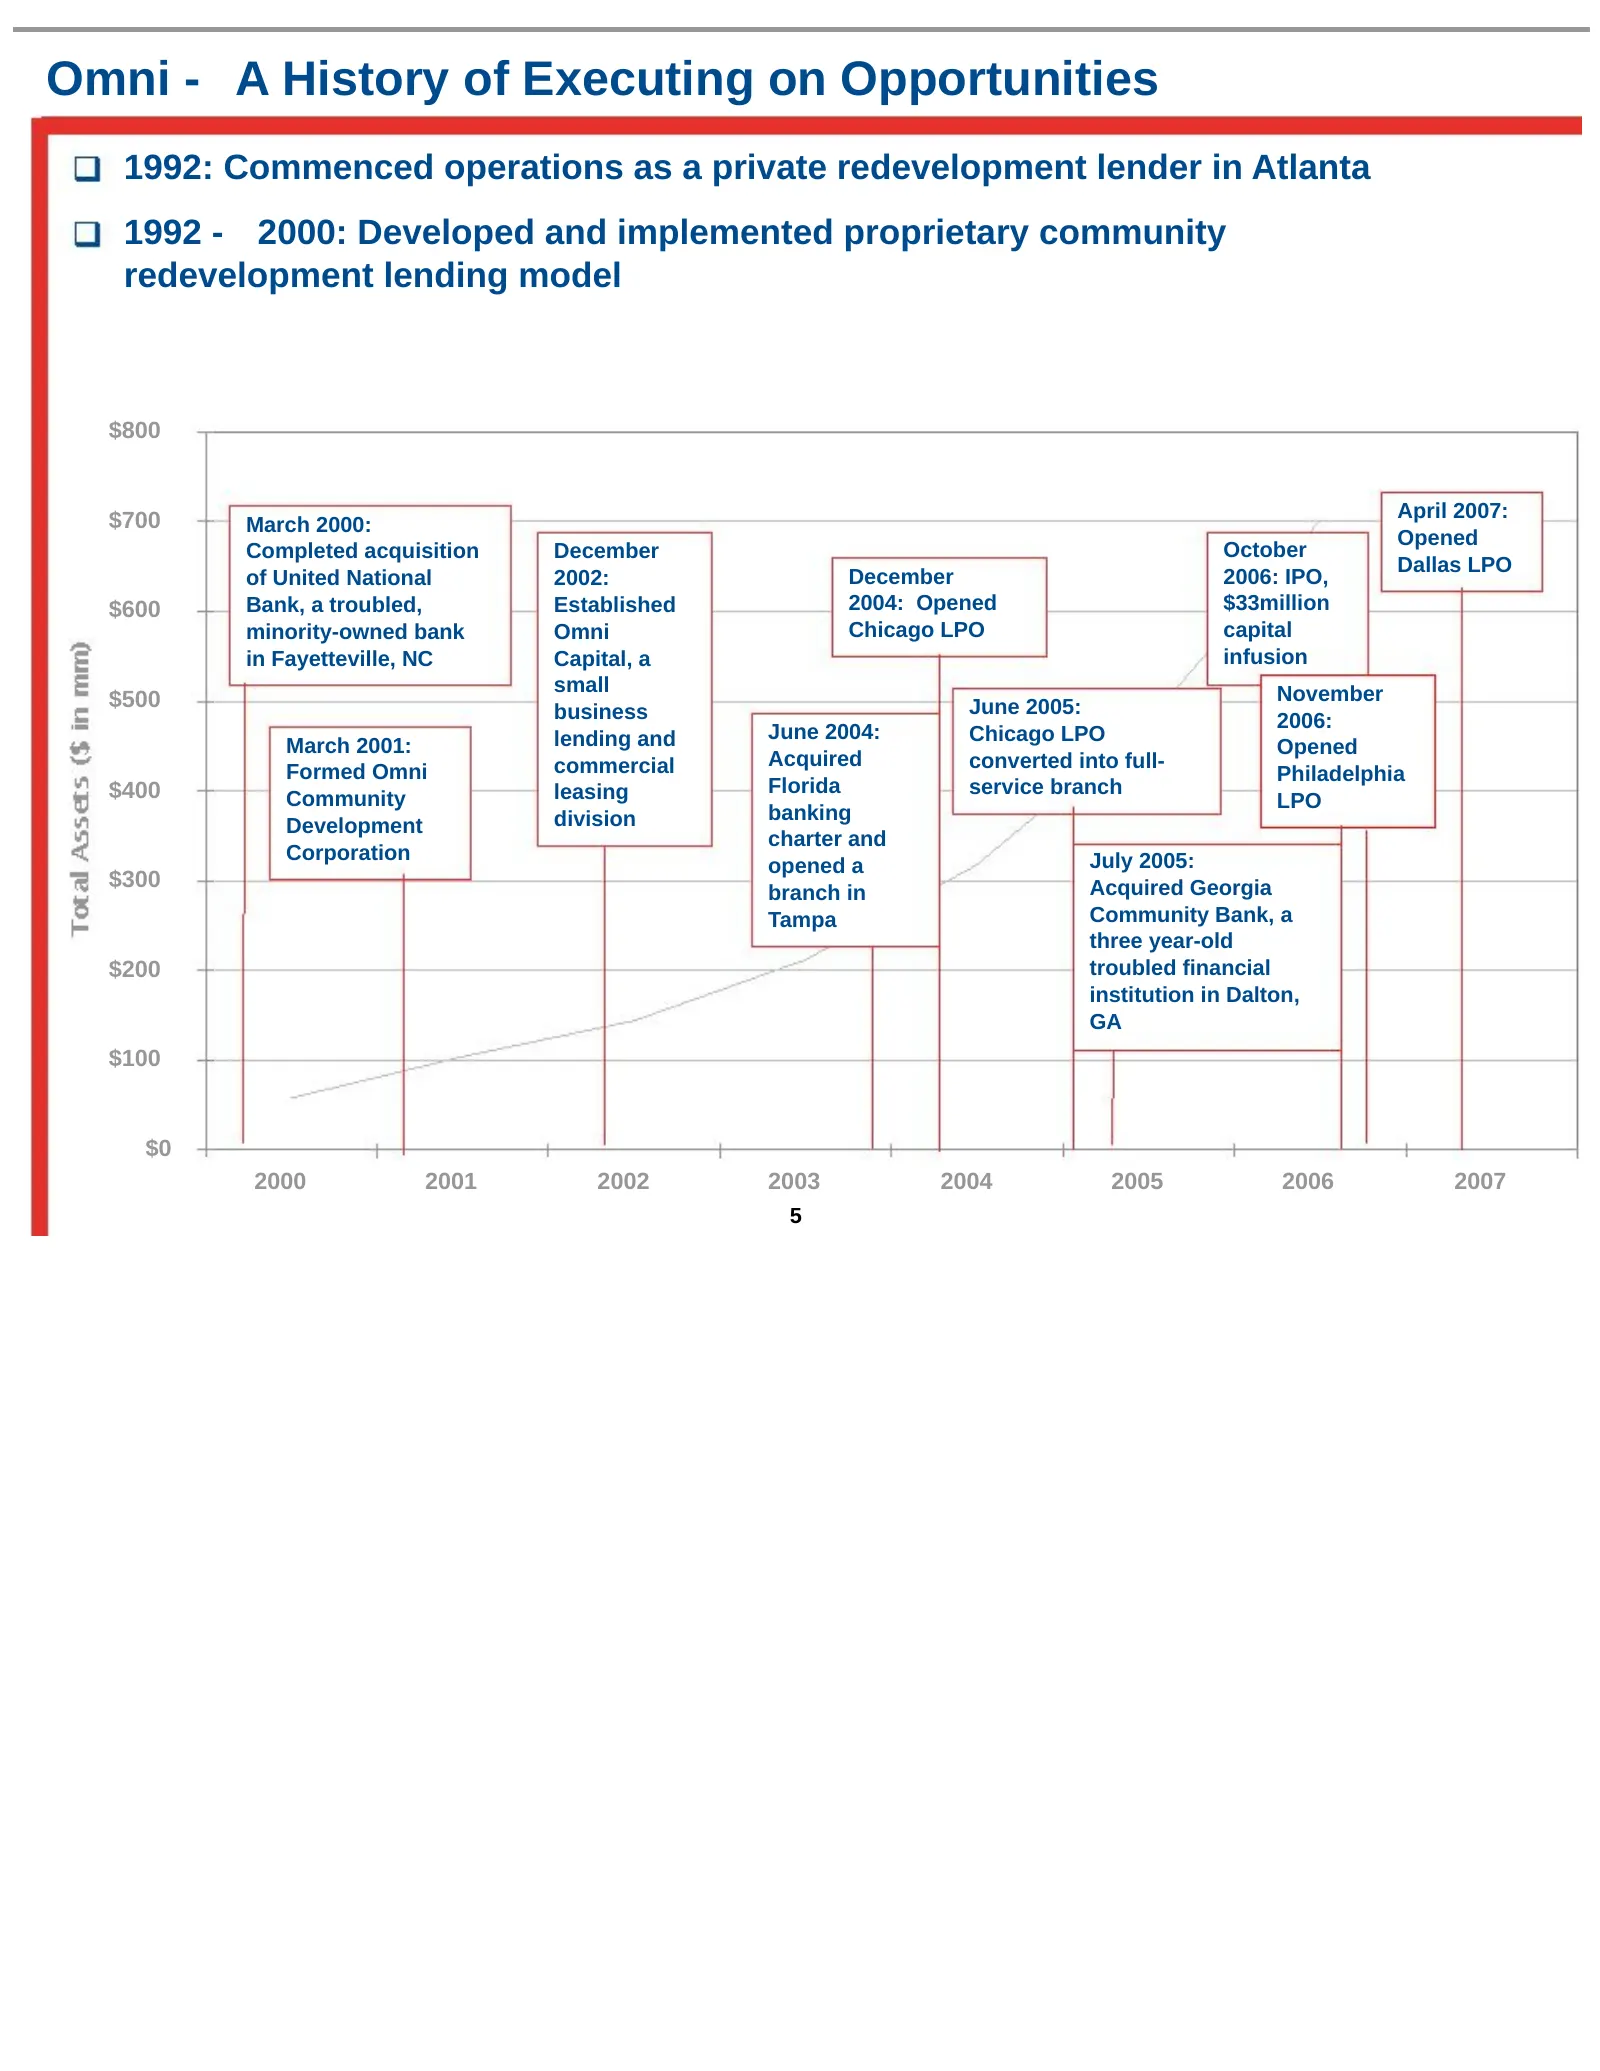
Omni - A History of Executing on Opportunities 1992: Commenced operations as a private redevelopment lender in Atlanta 1992 - 2000: Developed and implemented proprietary community redevelopment lending model $800 $700 April 2007: March 2000: Opened Completed acquisition December October Dallas LPO o
Slide 6: Omni - Our Company Today
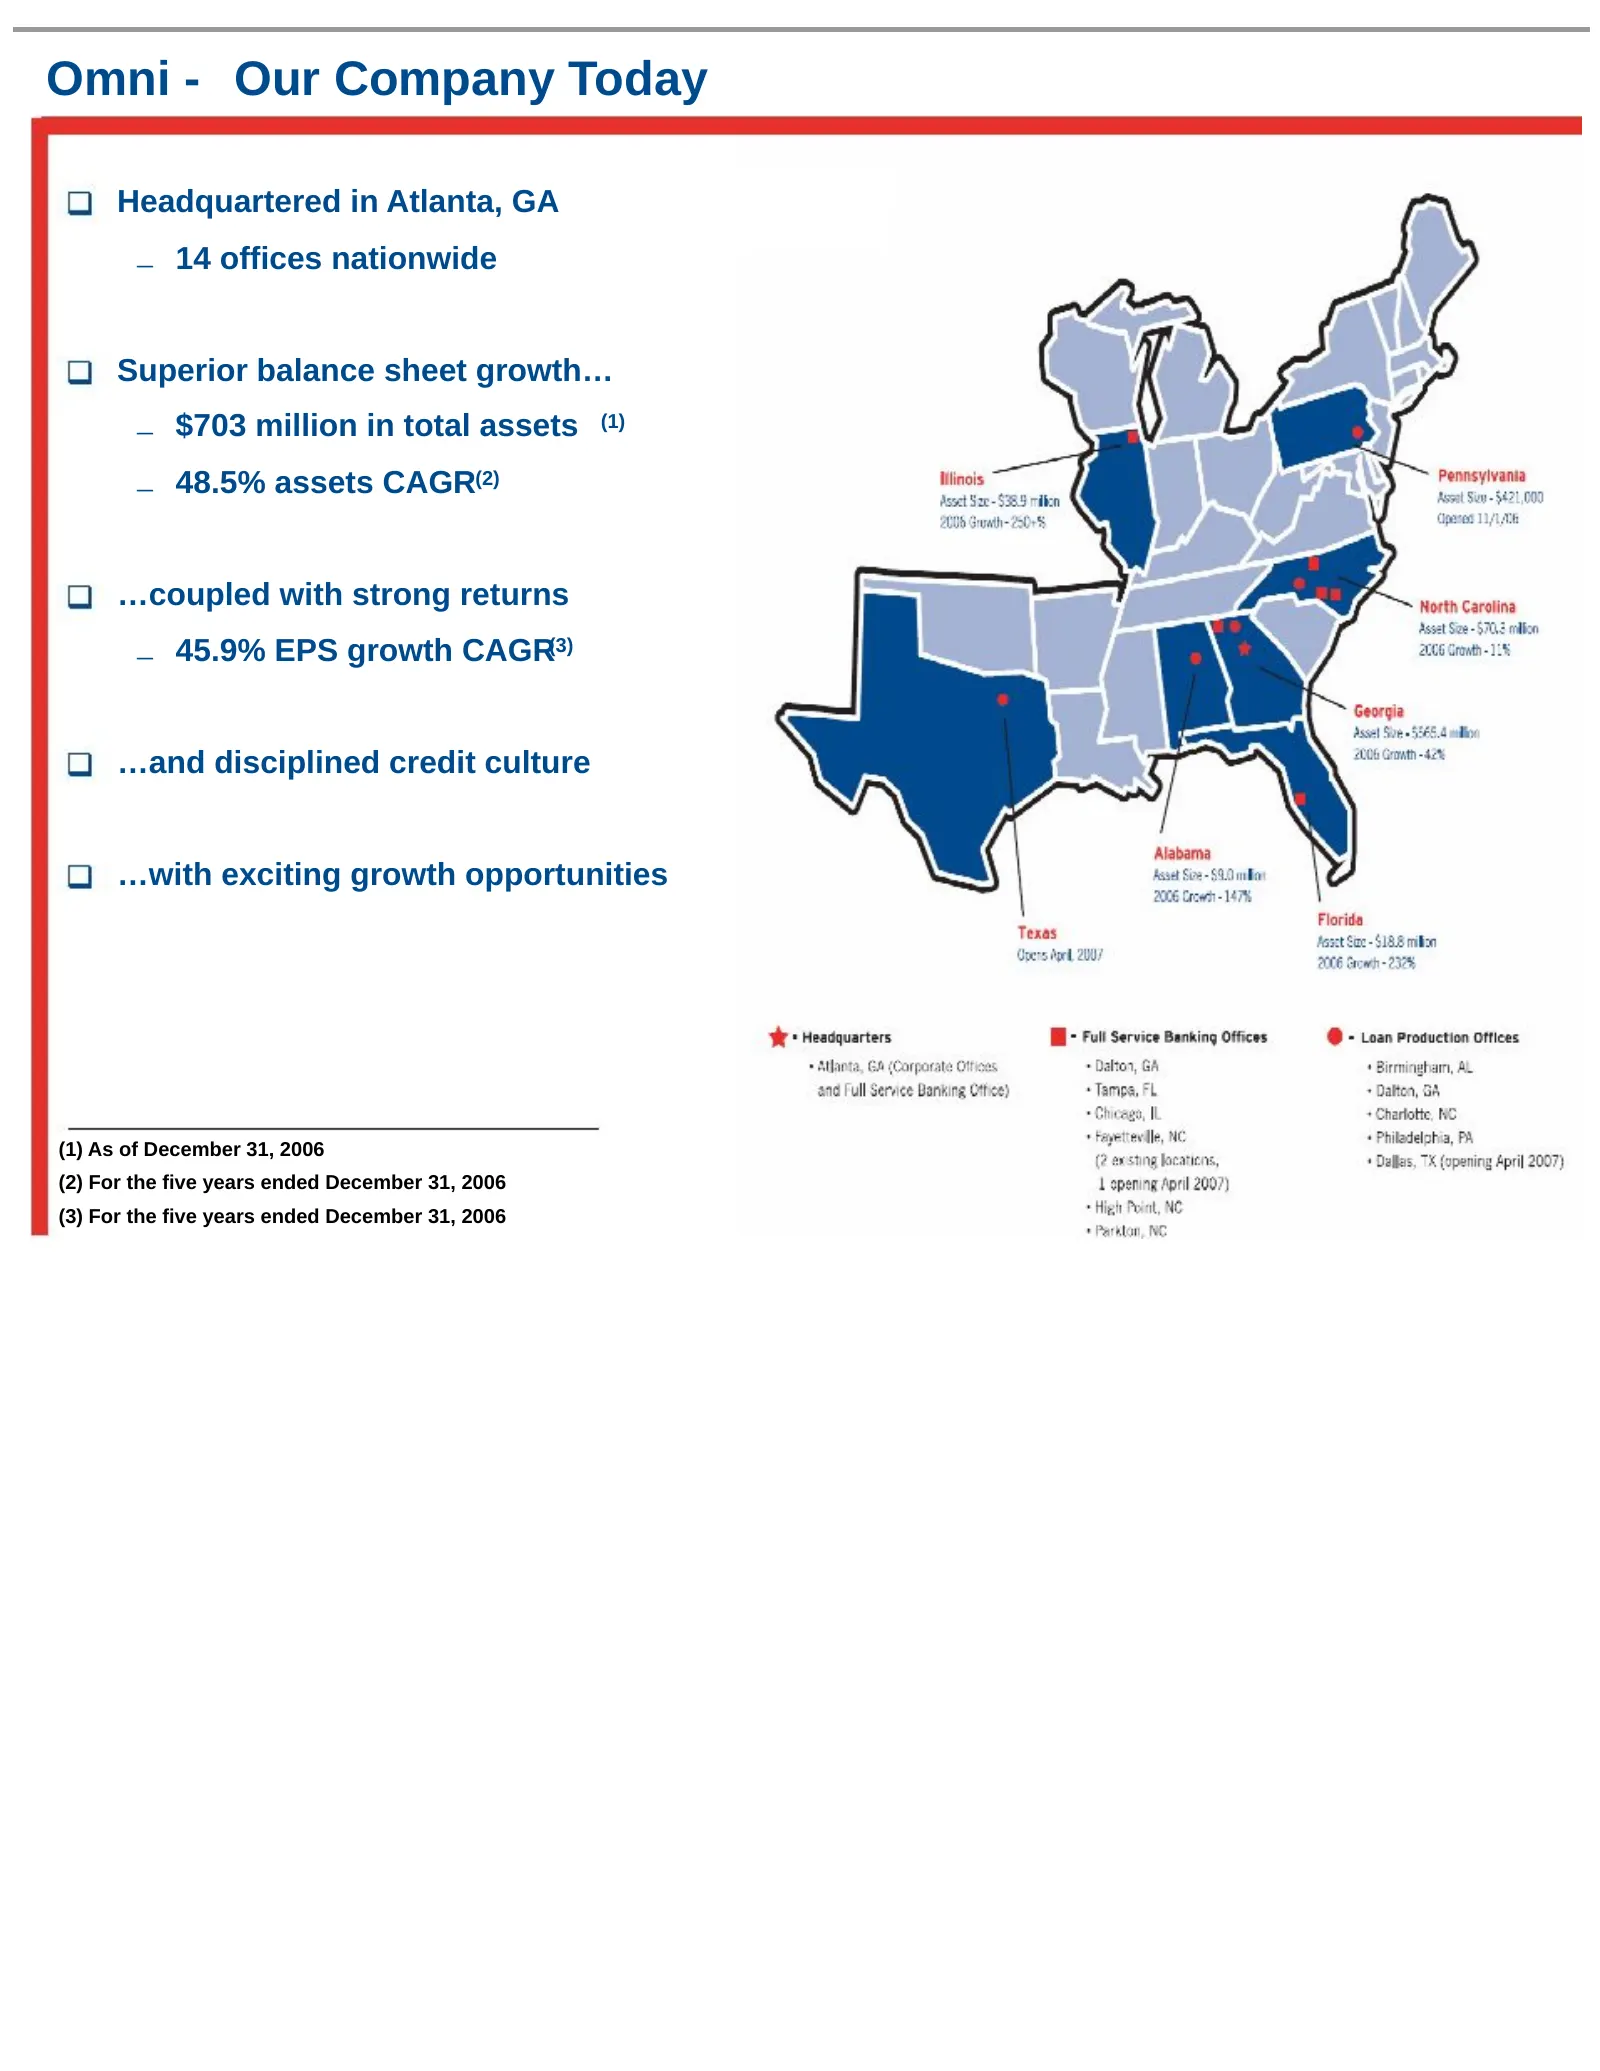
Omni - Our Company Today Headquartered in Atlanta, GA – 14 offices nationwide Superior balance sheet growth… – $703 million in total assets (1) – 48.5% assets CAGR(2) …coupled with strong returns – 45.9% EPS growth CAGR(3) …and disciplined credit culture …with exciting growth opportunities (1) As of
Slide 7: Our Business Lines
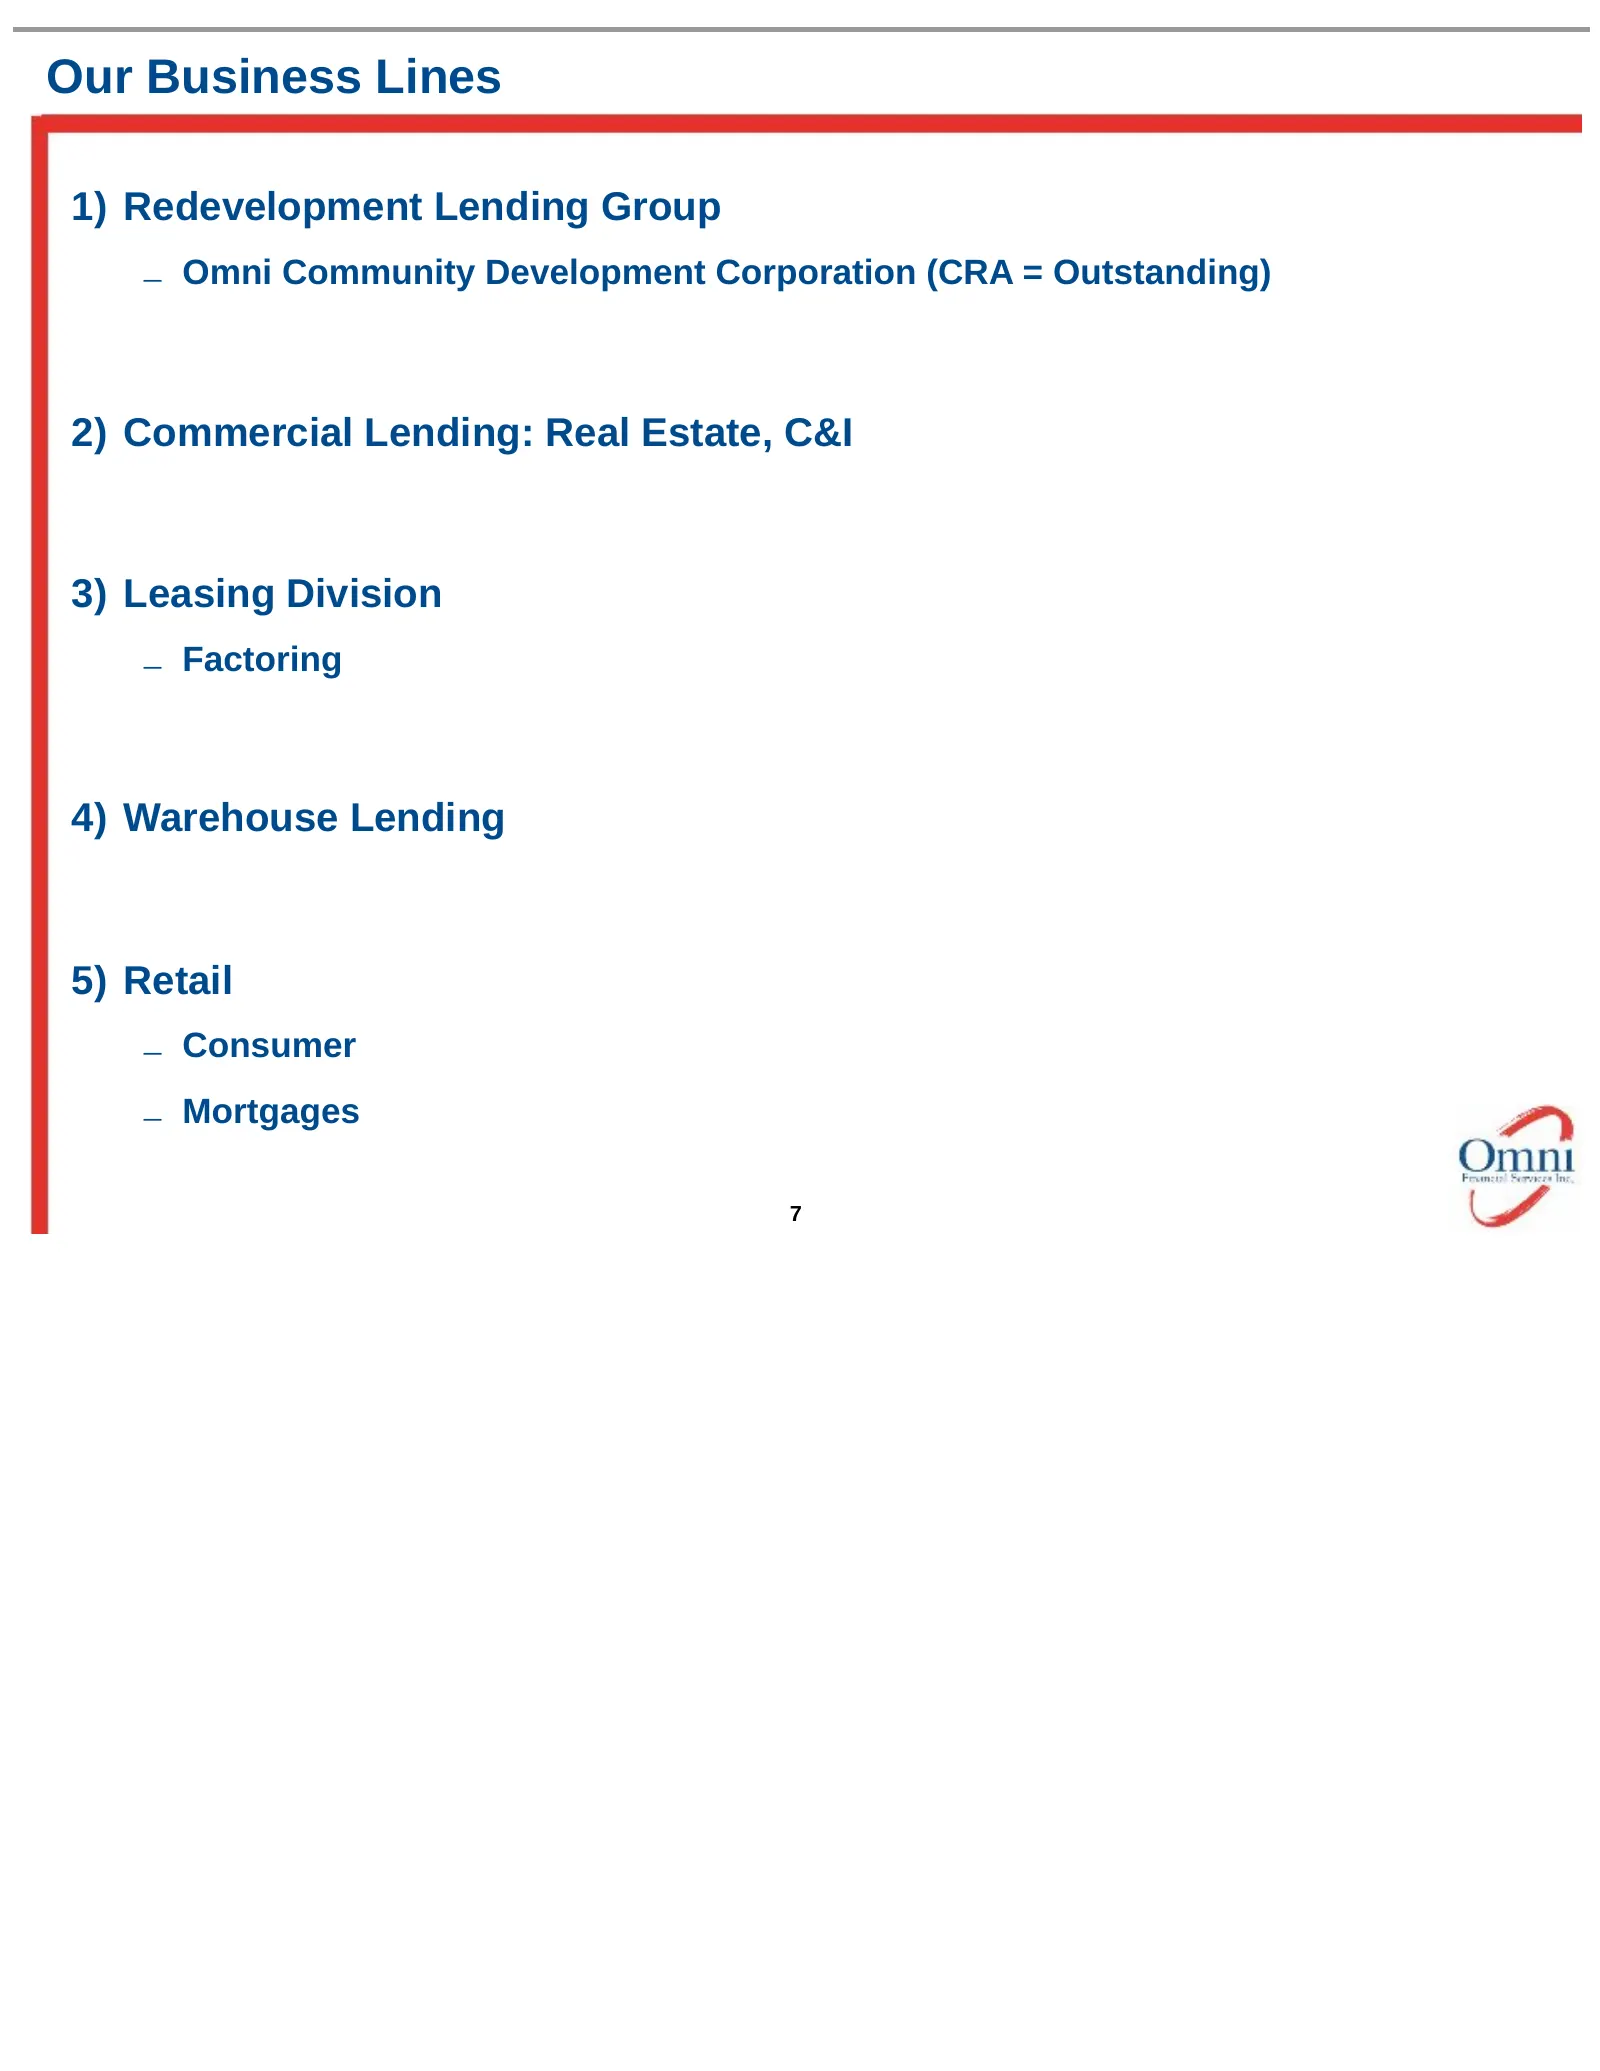
Our Business Lines 1) Redevelopment Lending Group – Omni Community Development Corporation (CRA = Outstanding) 2) Commercial Lending: Real Estate, C&I 3) Leasing Division – Factoring 4) Warehouse Lending 5) Retail – Consumer – Mortgages 7
Slide 8: Core Competencies
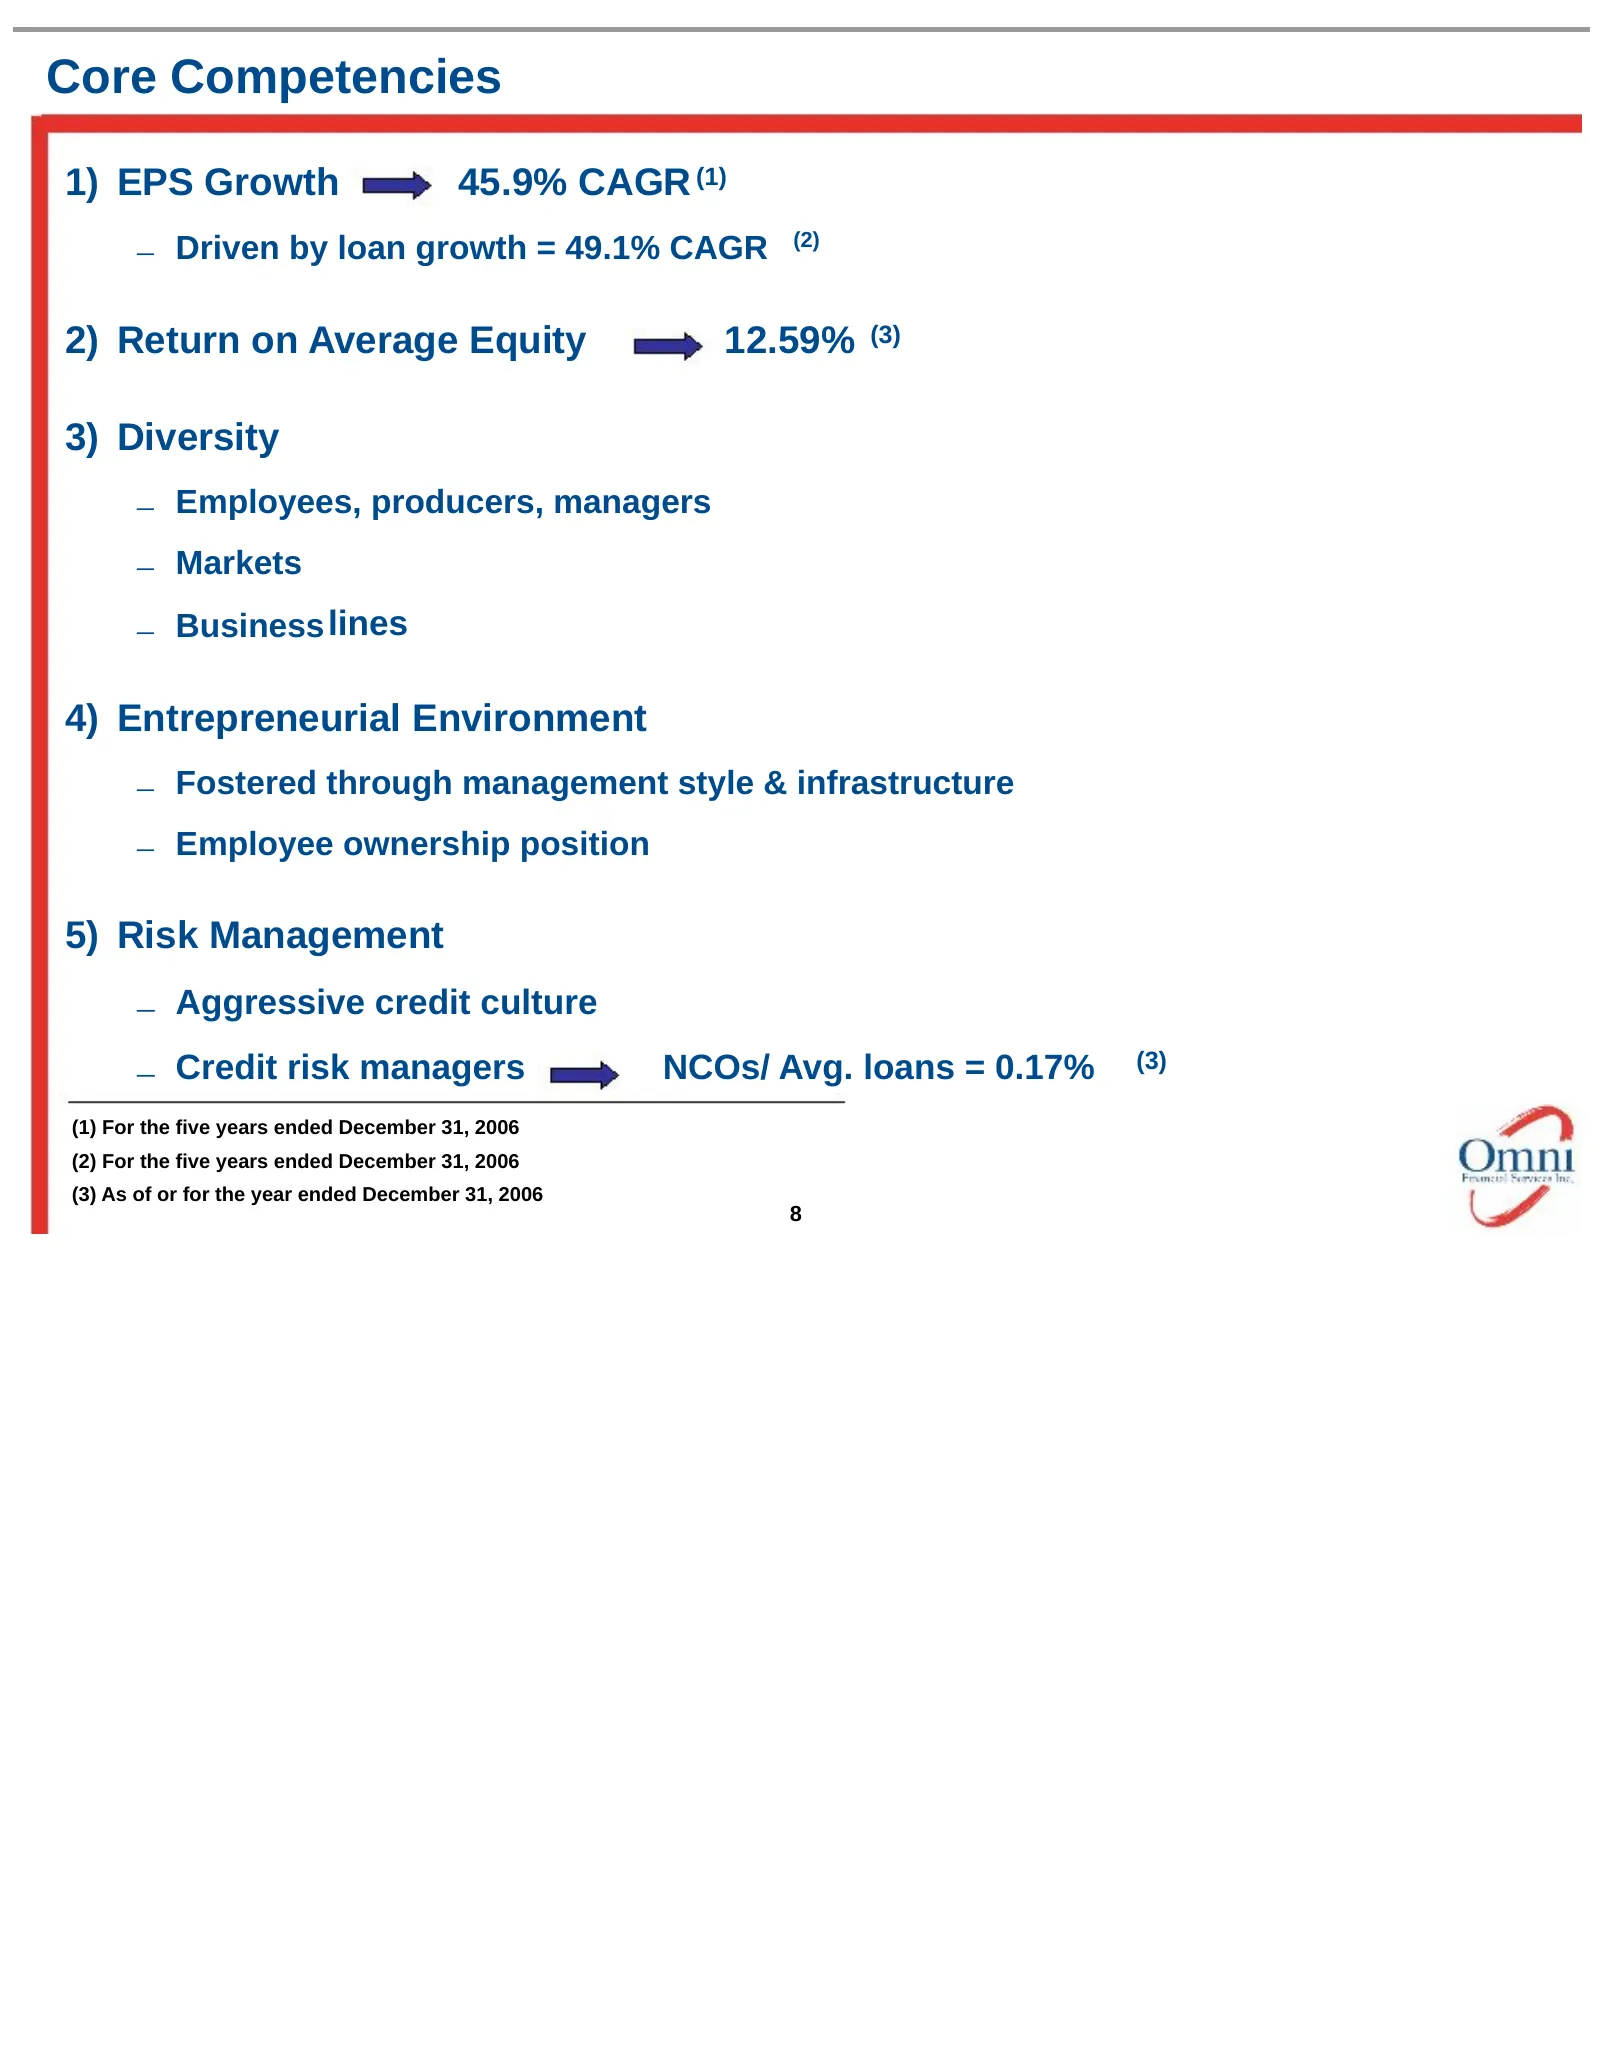
Core Competencies 1) EPS Growth 45.9% CAGR (1) (2) – Driven by loan growth = 49.1% CAGR 2) Return on Average Equity 12.59% (3) 3) Diversity – Employees, producers, managers – Markets – Business lines 4) Entrepreneurial Environment – Fostered through management style & infrastructure – Employee owner
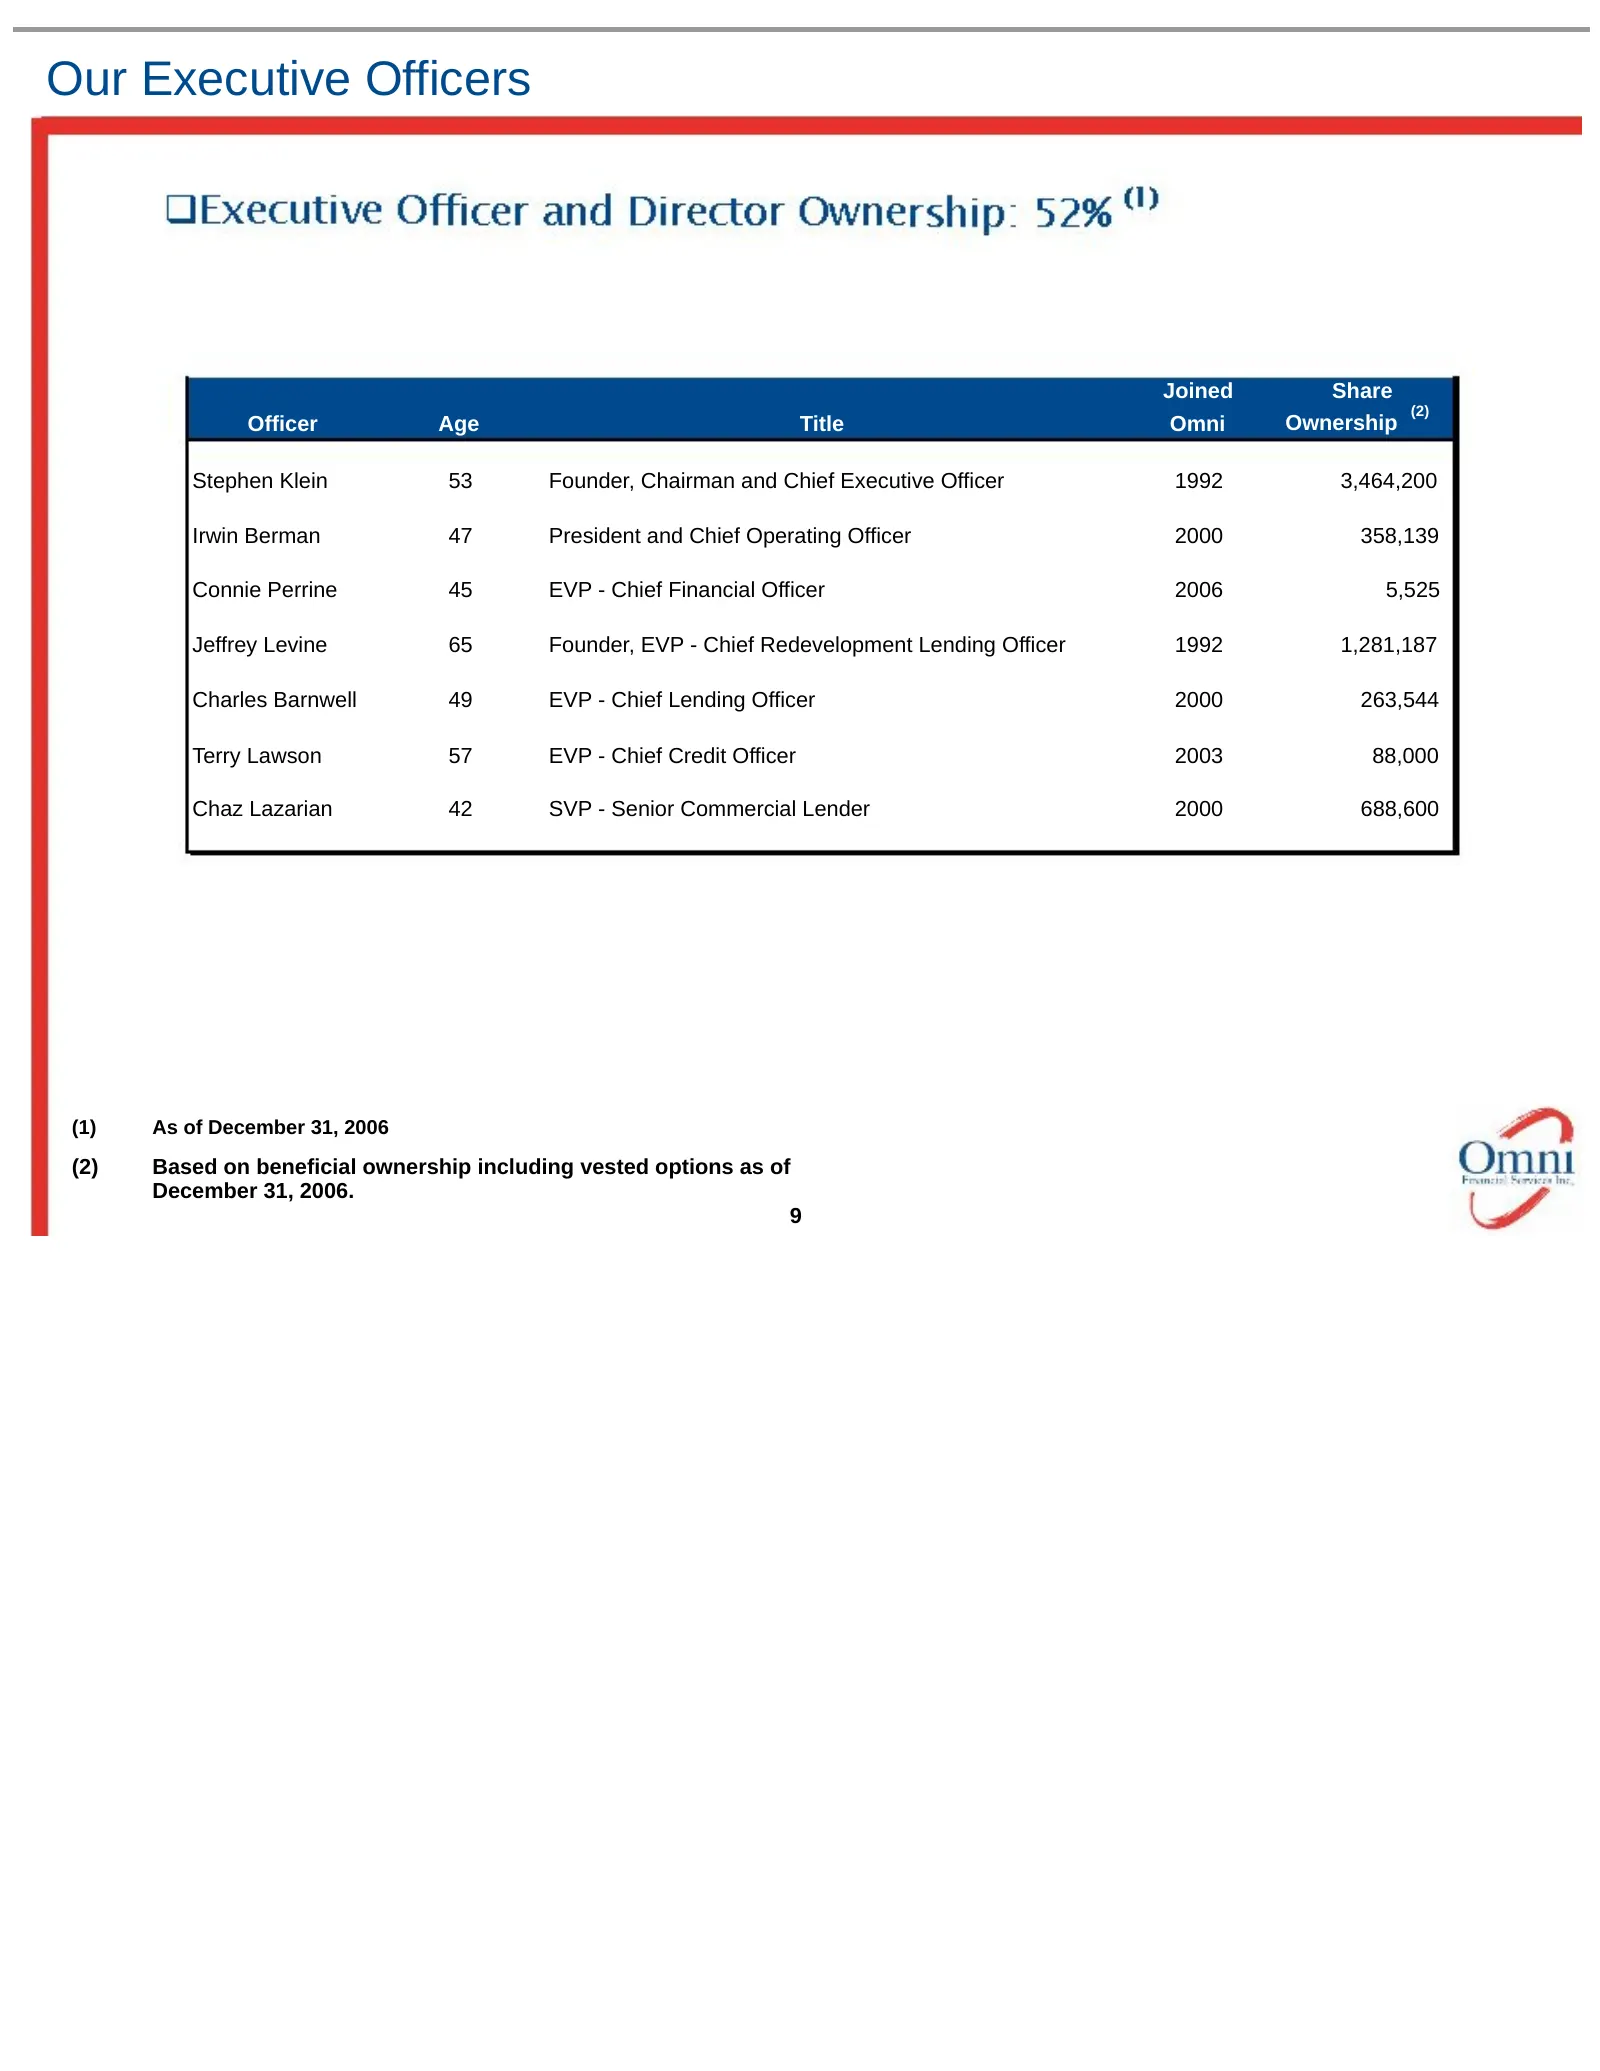
Slide 9: Our Executive Officers
Our Executive Officers Joined Share (2) Officer Age Title Omni Ownership Stephen Klein 53 Founder, Chairman and Chief Executive Officer 1992 3,464,200 Irwin Berman 47 President and Chief Operating Officer 2000 358,139 Connie Perrine 45 EVP - Chief Financial Officer 2006 5,525 Jeffrey Levine 65 Found
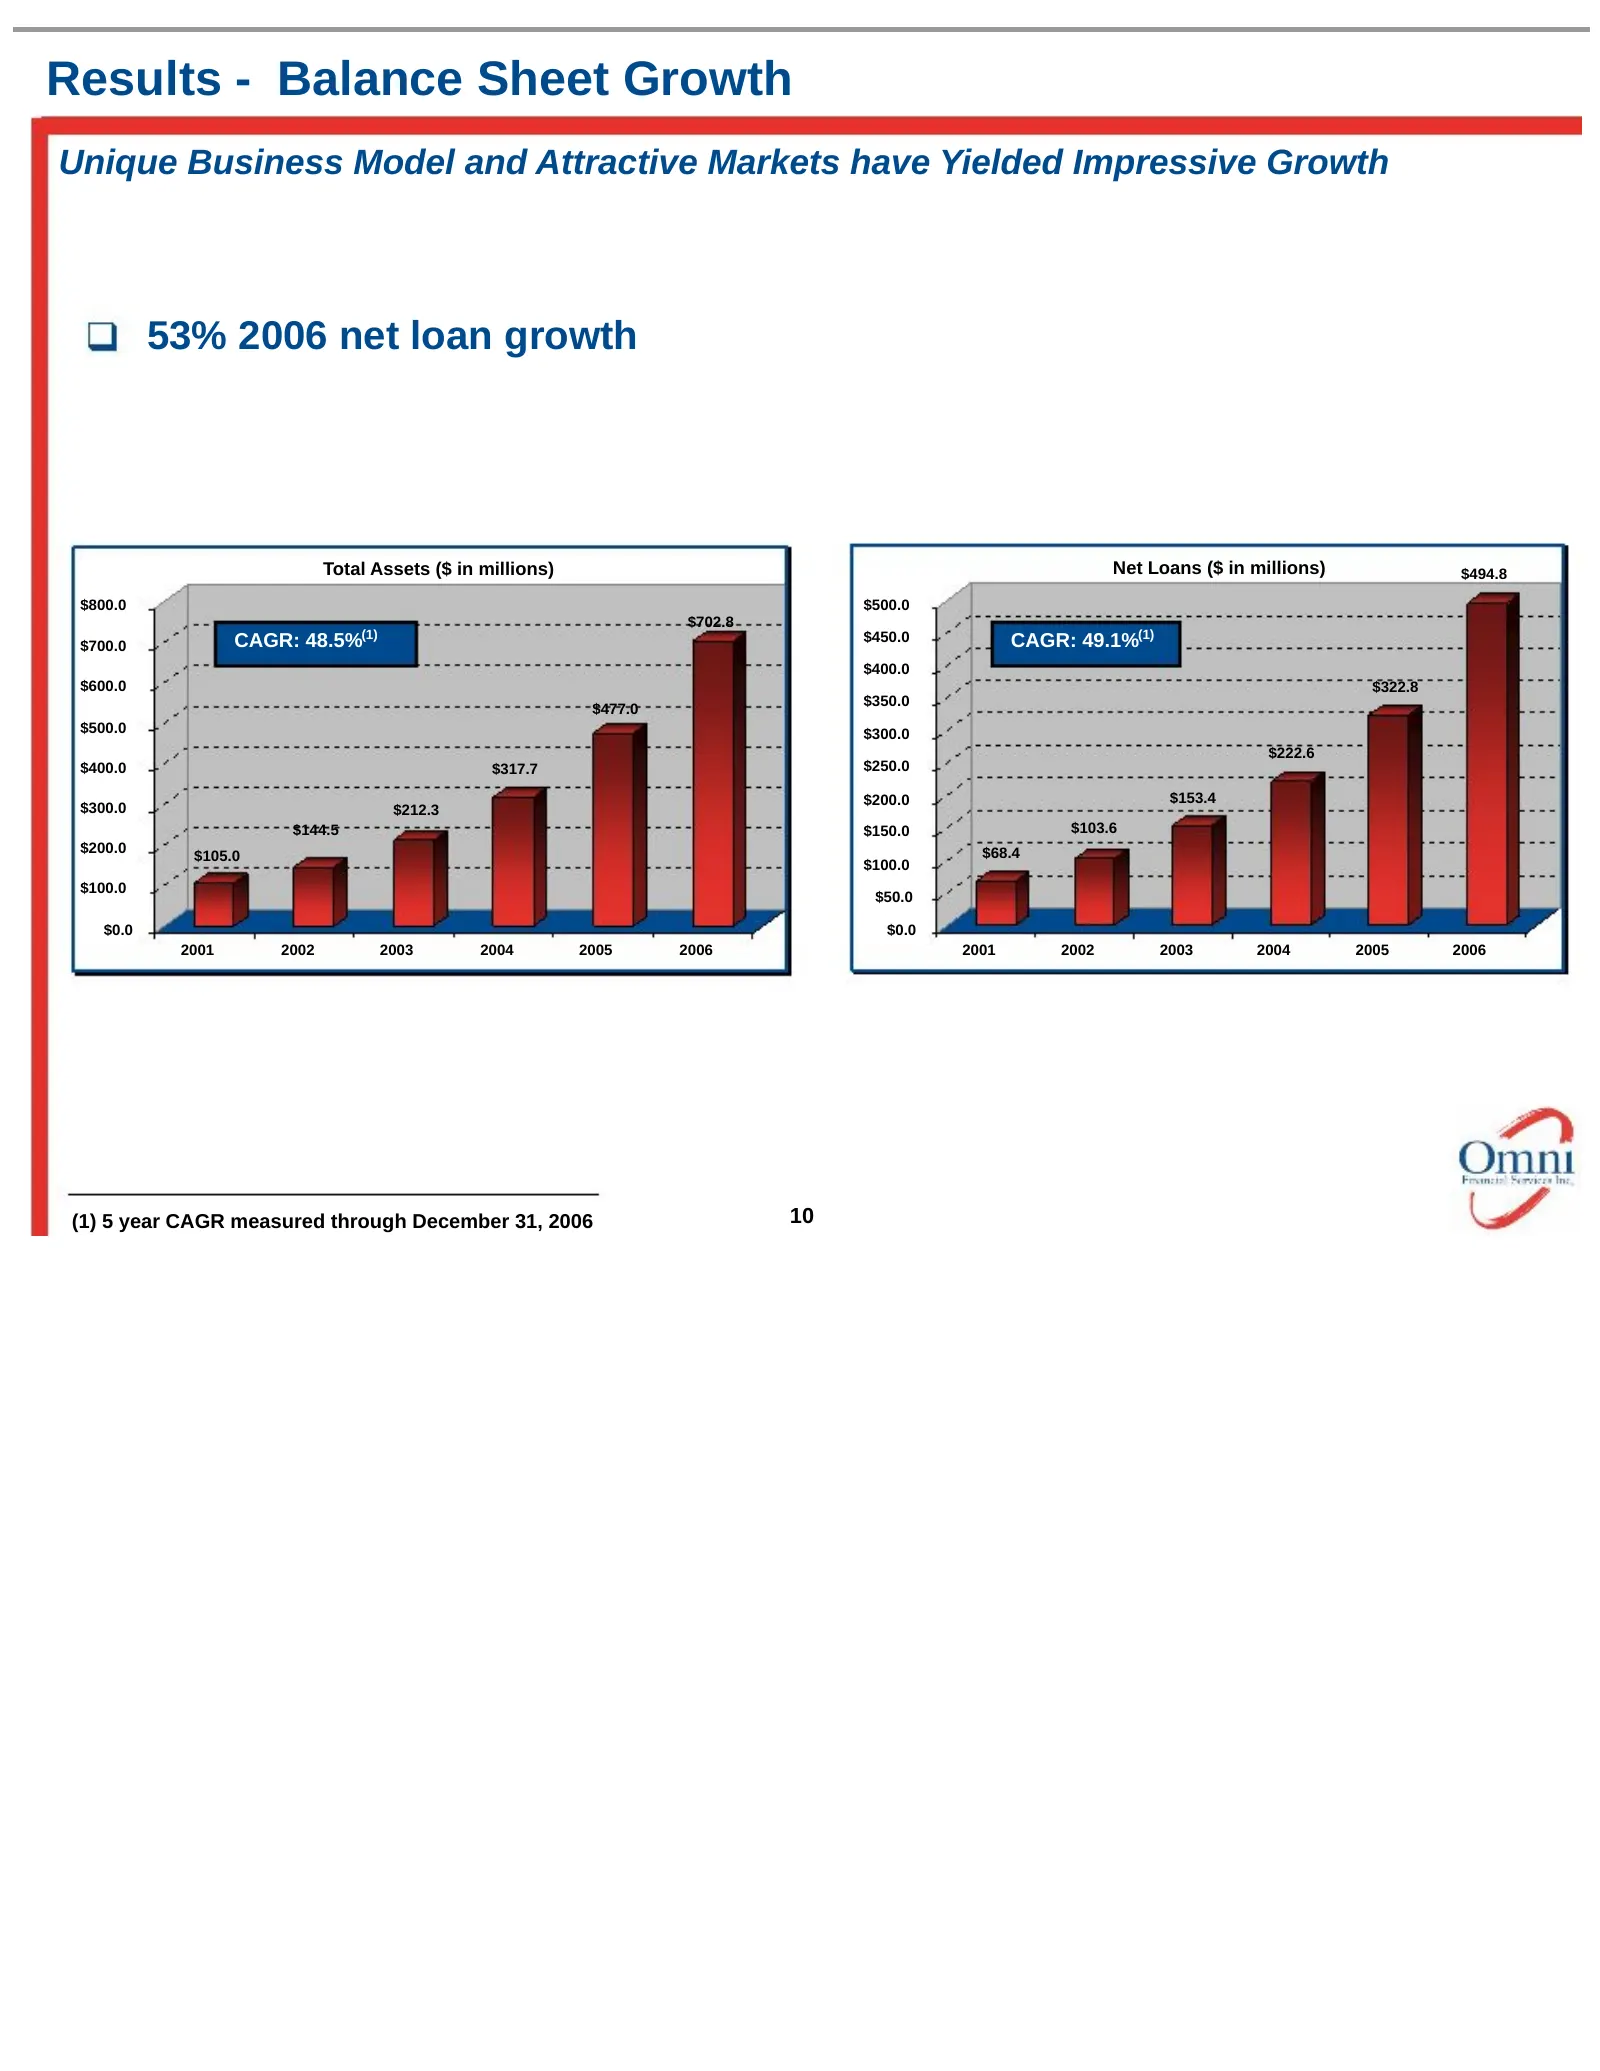
Slide 10: Results - Balance Sheet Growth
Results - Balance Sheet Growth Unique Business Model and Attractive Markets have Yielded Impressive Growth 53% 2006 net loan growth Total Assets ($ in millions) Net Loans ($ in millions) $494.8 $800.0 $500.0 $702.8 $700.0 CAGR: 48.5%(1) $450.0 CAGR: 49.1%(1) $400.0 $600.0 $322.8 $350.0 $477.0 $500.0
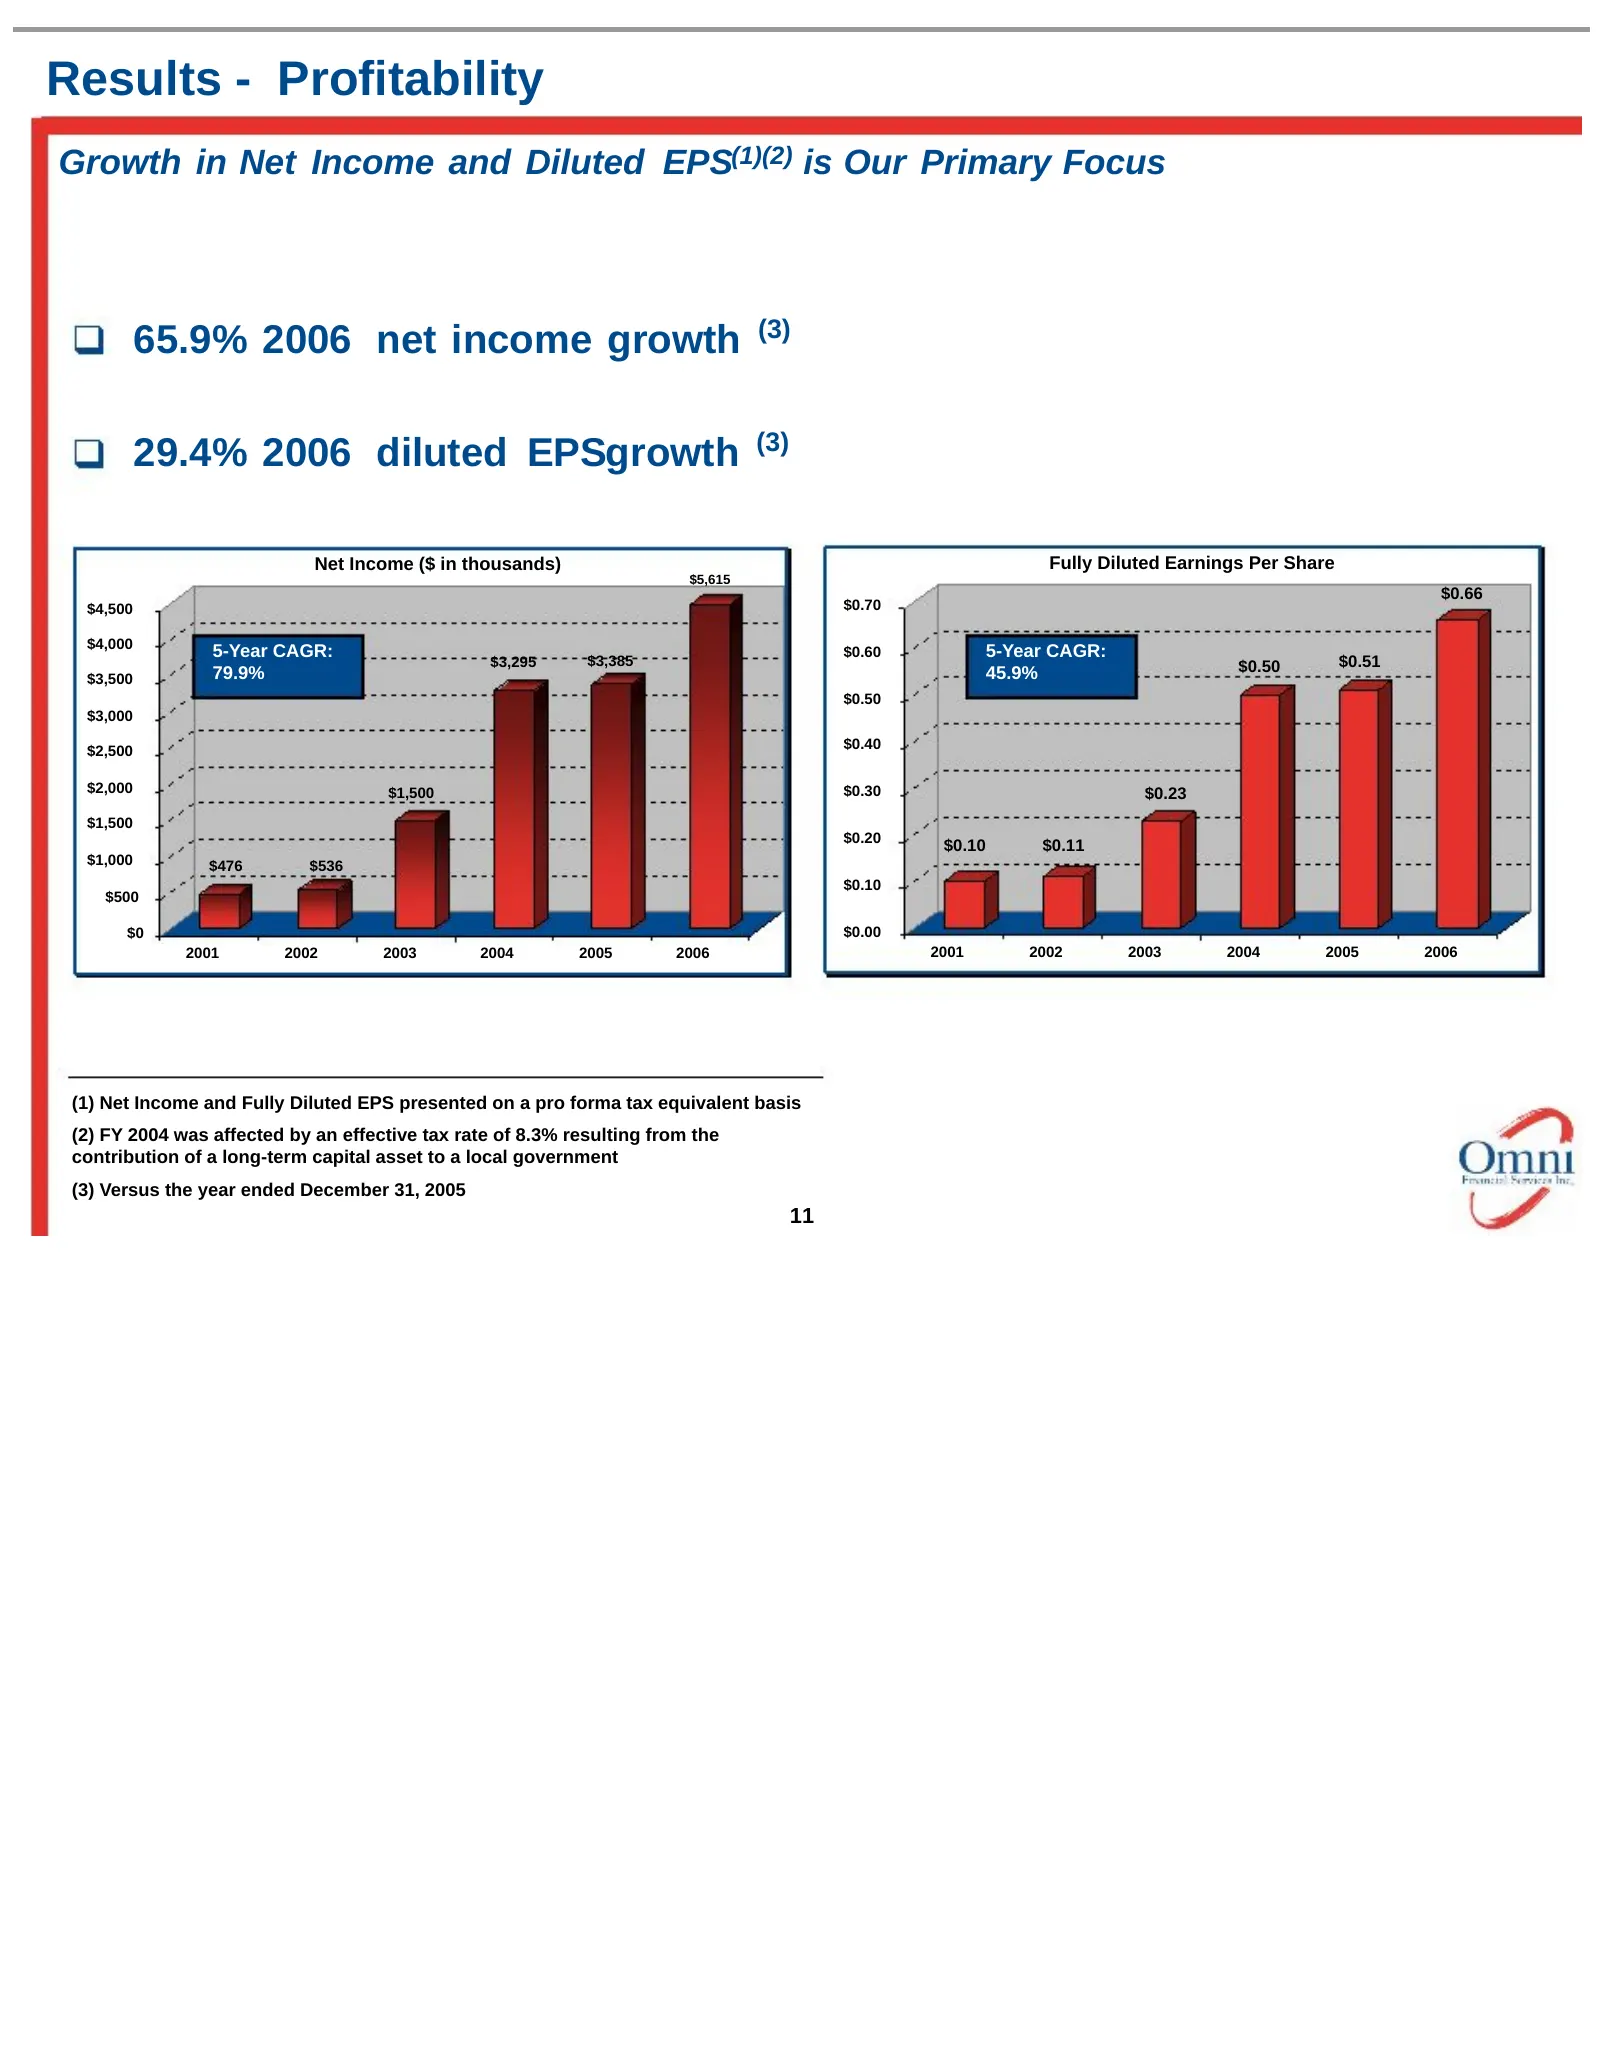
Slide 11: Results - Profitability
Results - Profitability Growth in Net Income and Diluted EPS(1)(2) is Our Primary Focus 65.9% 2006 net income growth (3) 29.4% 2006 diluted EPSgrowth (3) Net Income ($ in thousands) Fully Diluted Earnings Per Share $5,615 $0.66 $4,500 $0.70 $4,000 5-Year CAGR: $3,385 $0.60 5-Year CAGR: $3,295 $0.50
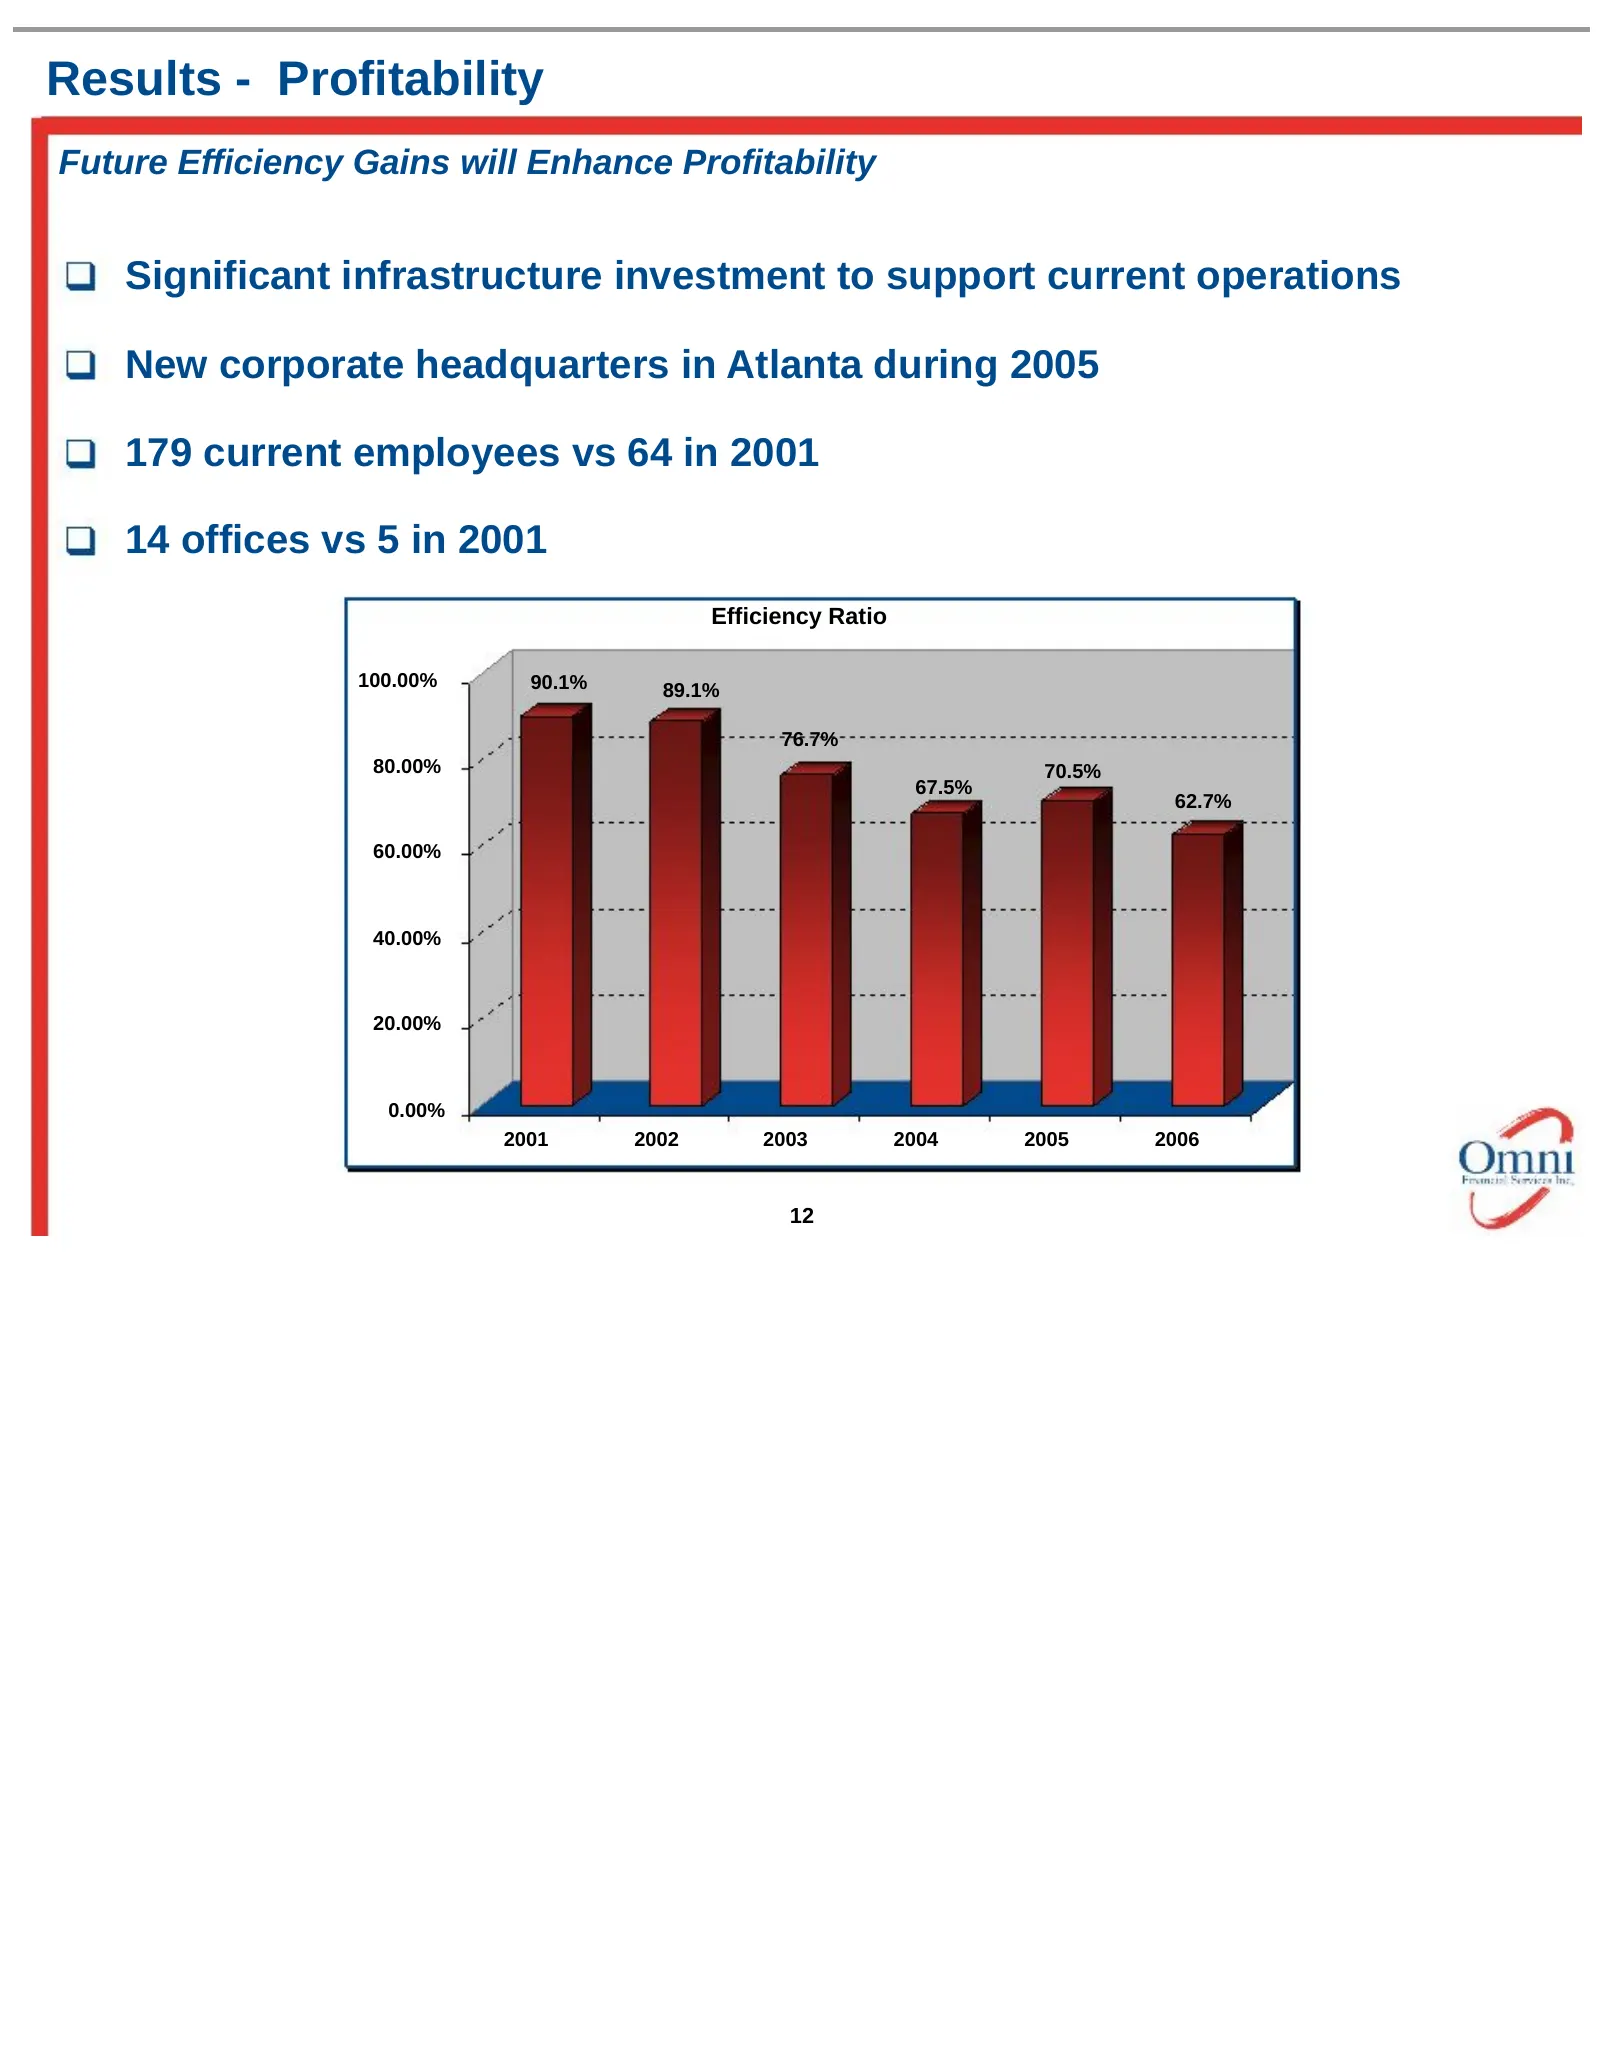
Slide 12: Results - Profitability
Results - Profitability Future Efficiency Gains will Enhance Profitability Significant infrastructure investment to support current operations New corporate headquarters in Atlanta during 2005 179 current employees vs 64 in 2001 14 offices vs 5 in 2001 Efficiency Ratio 100.00% 90.1% 89.1% 76.7% 80.0
Slide 13: Results - Profitability
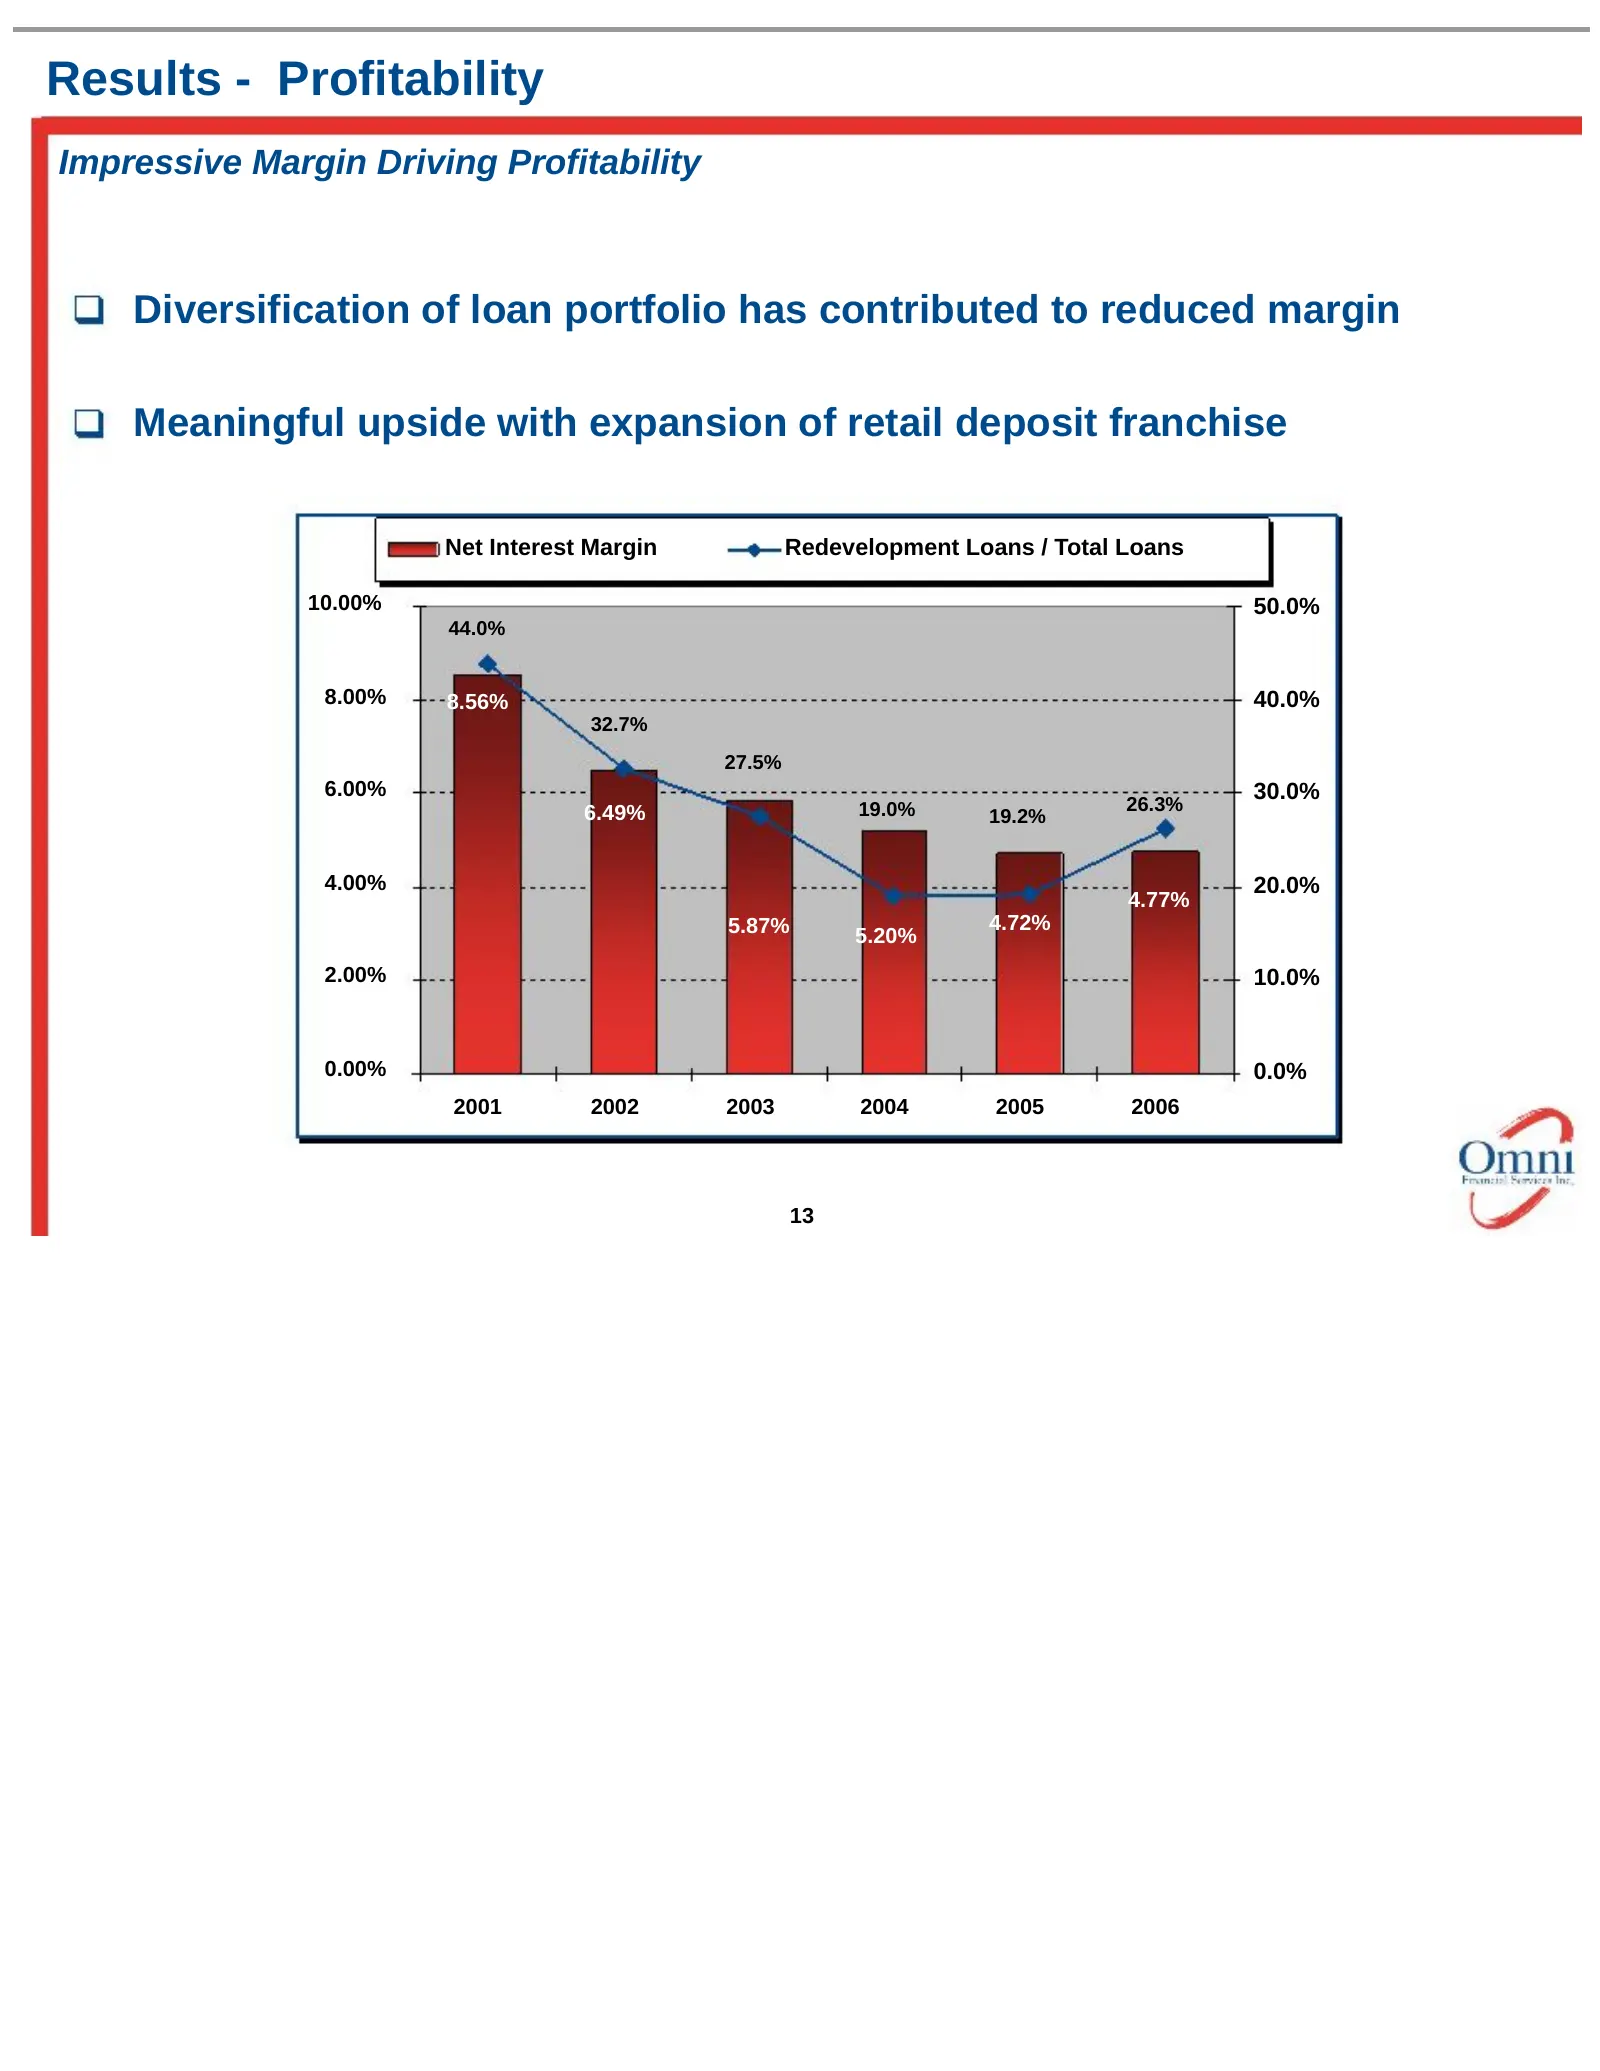
Results - Profitability Impressive Margin Driving Profitability Diversification of loan portfolio has contributed to reduced margin Meaningful upside with expansion of retail deposit franchise Net Interest Margin Redevelopment Loans / Total Loans 10.00% 50.0% 44.0% 8.00% 8.56% 40.0% 32.7% 27.5% 6.00
Slide 14: Results - Profitability
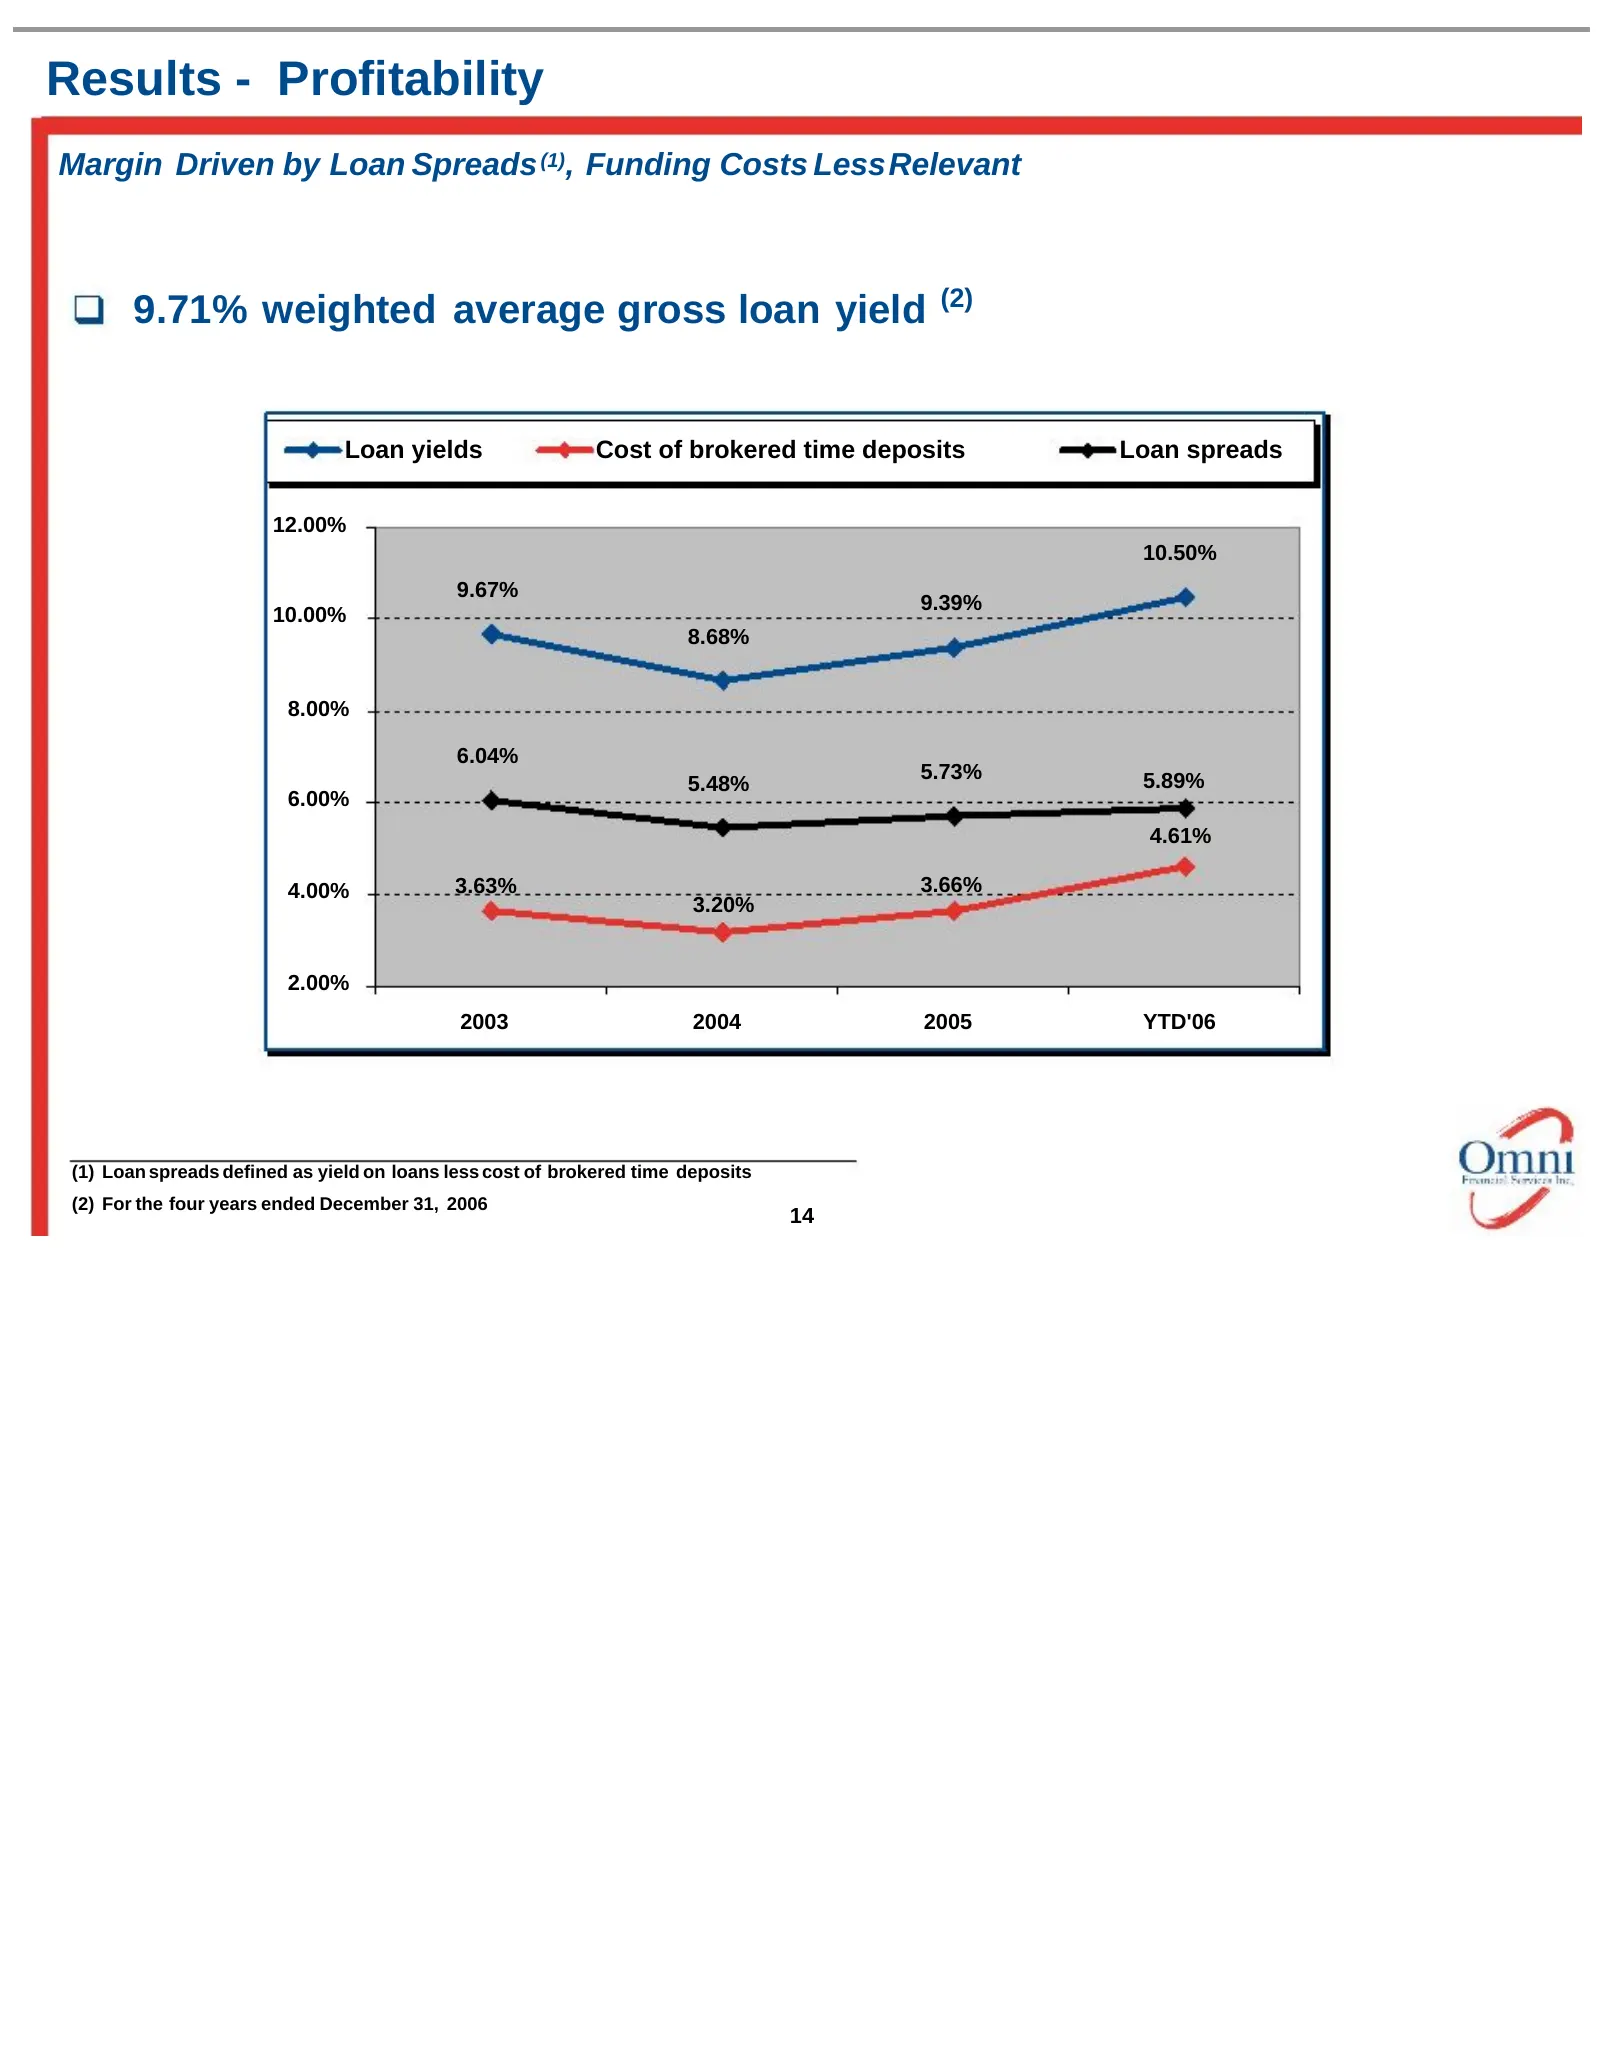
Results - Profitability Margin Driven by Loan Spreads (1), Funding Costs LessRelevant 9.71% weighted average gross loan yield (2) Loan yields Cost of brokered time deposits Loan spreads 12.00% 10.50% 9.67% 9.39% 10.00% 8.68% 8.00% 6.04% 5.73% 5.89% 5.48% 6.00% 4.61% 4.00% 3.63% 3.66% 3.20% 2.00% 200
Slide 15: Results - Stringent Credit Administration
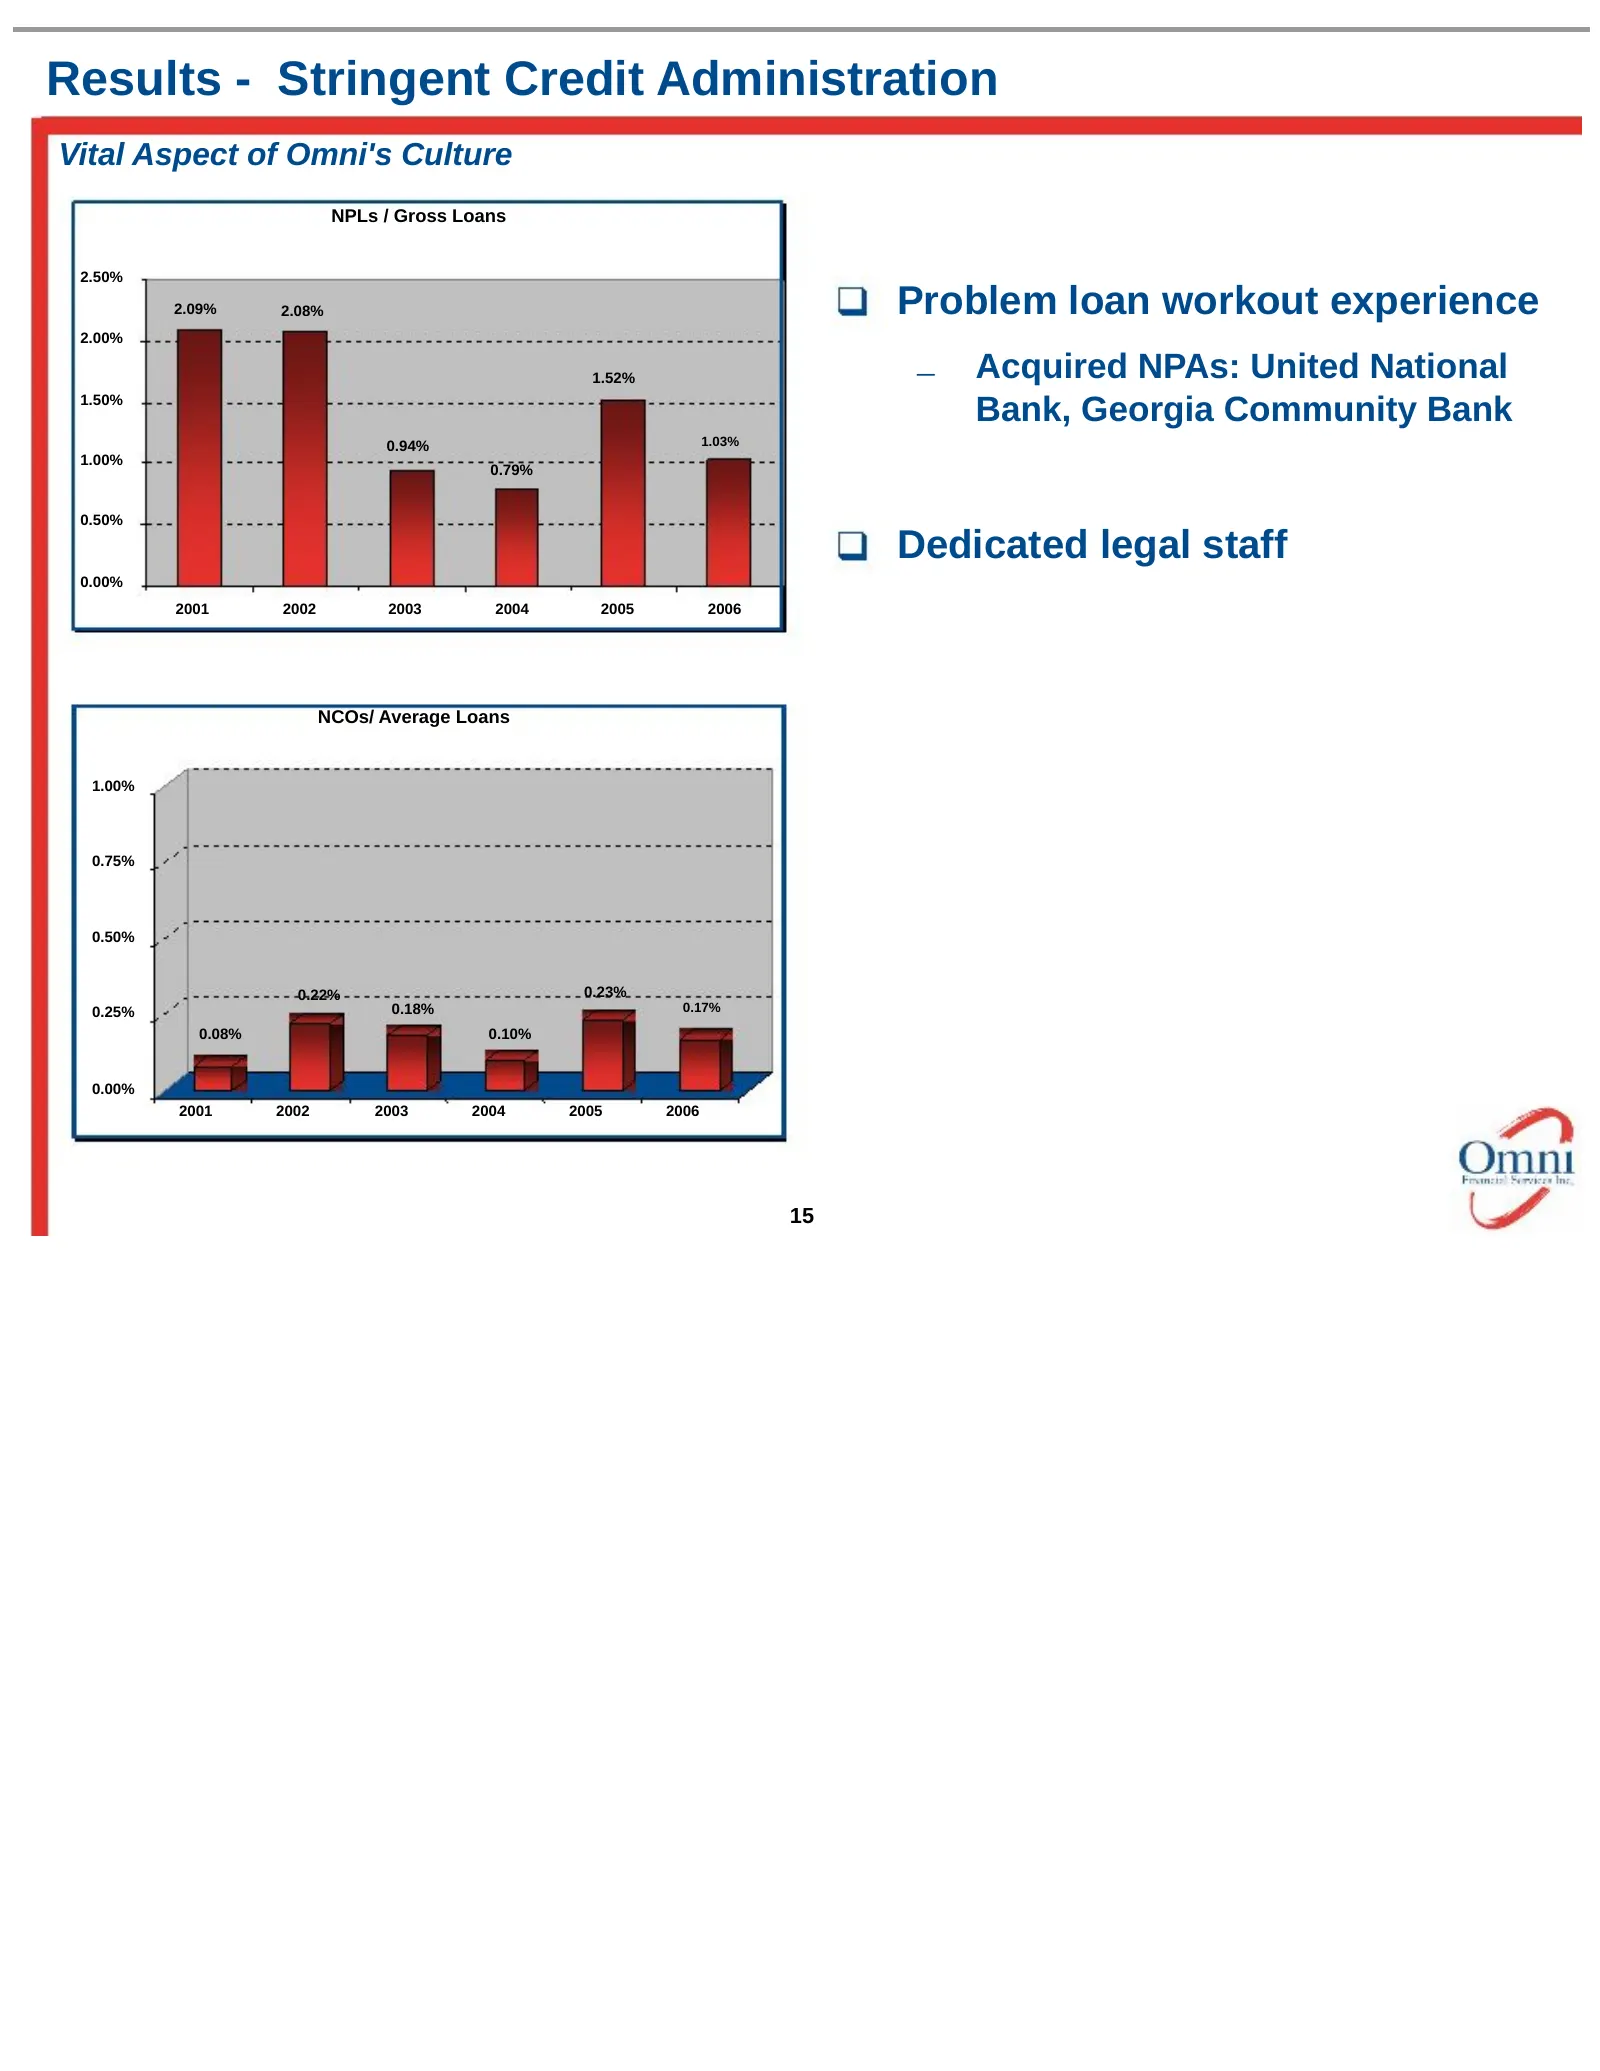
Results - Stringent Credit Administration Vital Aspect of Omni's Culture NPLs / Gross Loans 2.50% 2.09% 2.08% Problem loan workout experience 2.00% 1.52% – Acquired NPAs: United National 1.50% Bank, Georgia Community Bank 0.94% 1.03% 1.00% 0.79% 0.50% Dedicated legal staff 0.00% 2001 2002 2003 2004
Slide 16: Execute on Opportunities
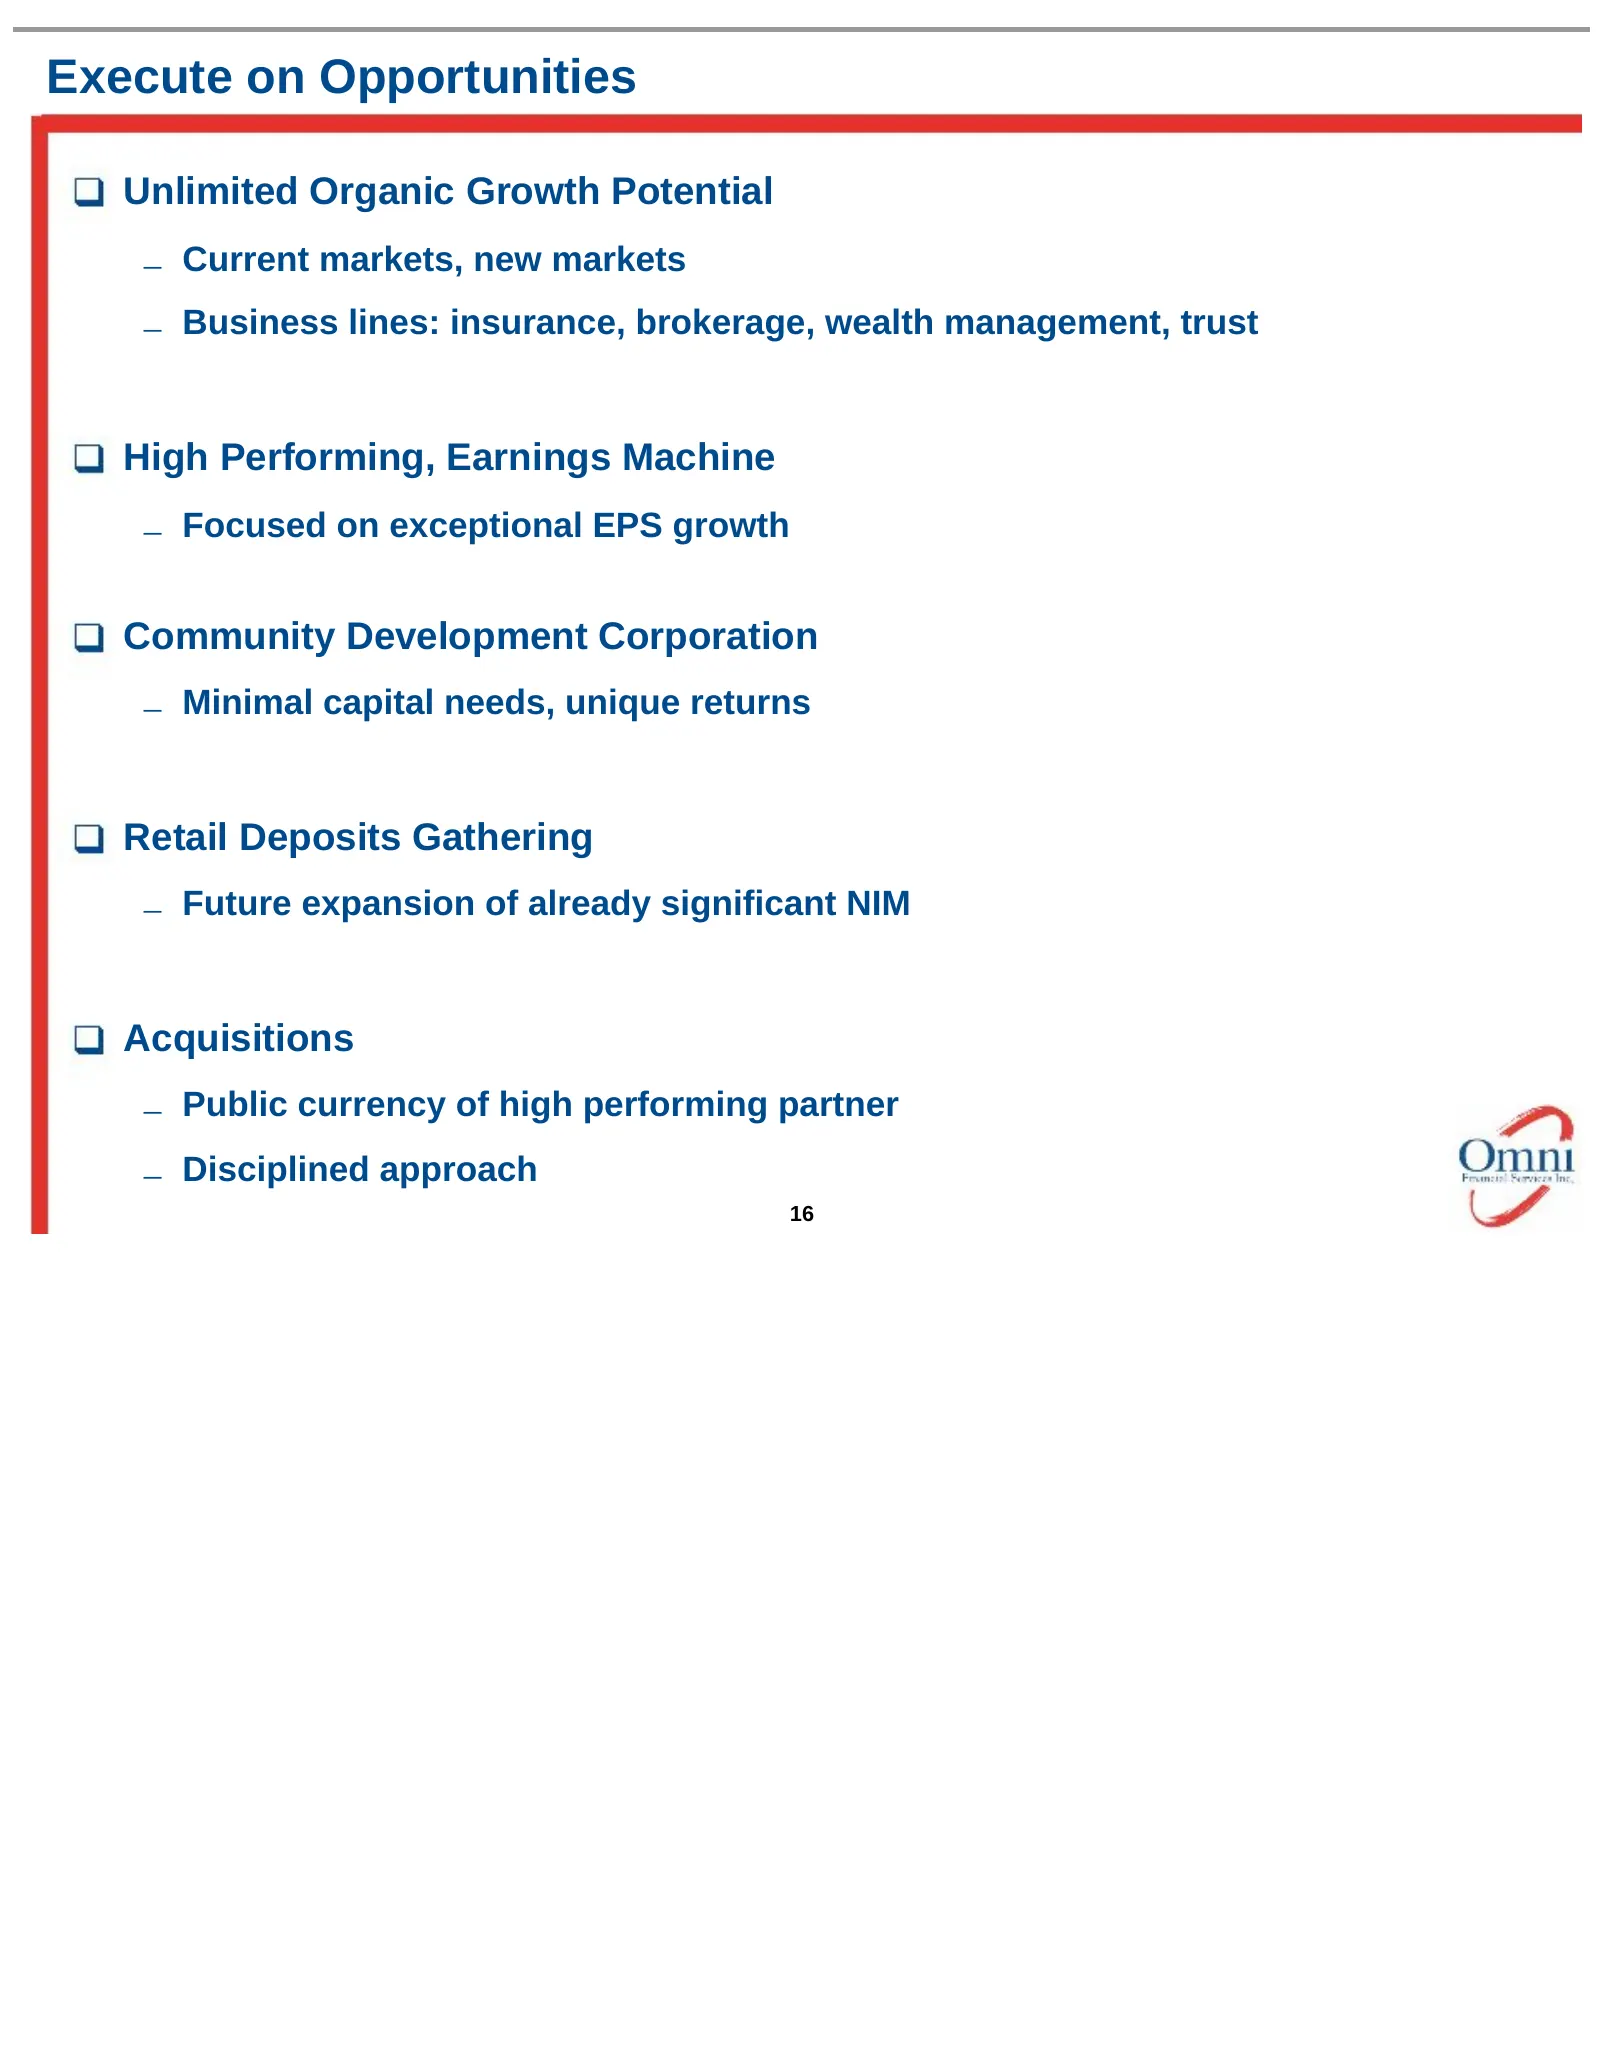
Execute on Opportunities Unlimited Organic Growth Potential – Current markets, new markets – Business lines: insurance, brokerage, wealth management, trust High Performing, Earnings Machine – Focused on exceptional EPS growth Community Development Corporation – Minimal capital needs, unique returns
Source: SEC EDGAR · 8-K filed Apr 13, 2007
More decks from Omni Financial Services Inc
 Investor Presentation (November 2007)7 slides · Nov 13, 2007
 Investor Presentation (August 2007)16 slides · Aug 16, 2007
 Investor Presentation (July 2007)13 slides · Jul 31, 2007
 Investor Presentation (May 2007)18 slides · May 22, 2007
 Sandler O'Neill & Partners 2006 Financial Services Conference17 slides · Nov 15, 2006