Fisher Scientific International Inc
Fisher Scientific International — Baird Growth Stock Conference 2005
26 slides from Fisher Scientific International's conference presentation, May 12, 2005
Slide 1: The World Leader in Serving Science
The World Leader in Serving Science Baird Growth Stock Conference May 12, 2005
Slide 2: Safe Harbor and Regulation G Statement
The Securities and Exchange Commission encourages companies to disclose forward- looking information so that investors can better understand a company's future prospects and make informed investment decisions. This presentation contains these types of statements, which are "forward-looking statement
Slide 3: Investment Highlights
Investment Highlights World leader in growing markets Opportunities for profitable growth Premier global brand Proven track record Strong earnings and cash flow growth 4
Slide 4: World Leader in Growing Markets
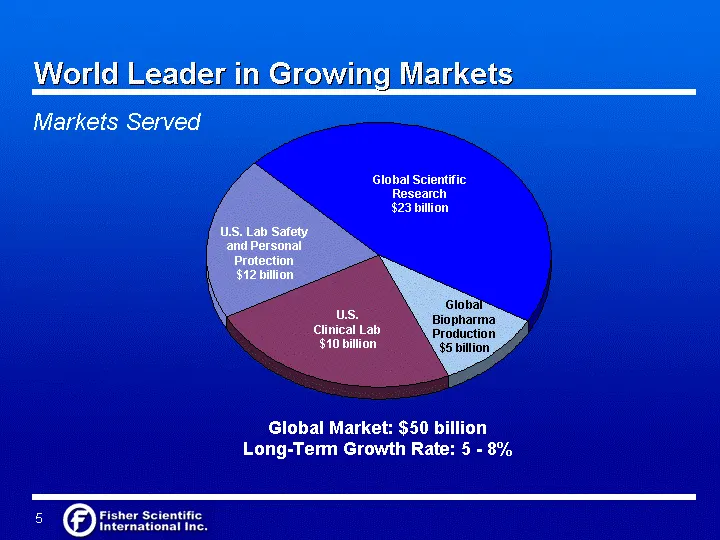
World Leader in Growing Markets Bipharma 5 Safety 12 Clinical 10 Scientific Research 23 U.S. Clinical Lab $10 billion U.S. Lab Safety and Personal Protection $12 billion Global Scientific Research $23 billion Markets Served Global Market: $50 billion Long-Term Growth Rate: 5 - 8% Global Biopharma Pr
Slide 5: World Leader in Growing Markets: Global Scientific Research
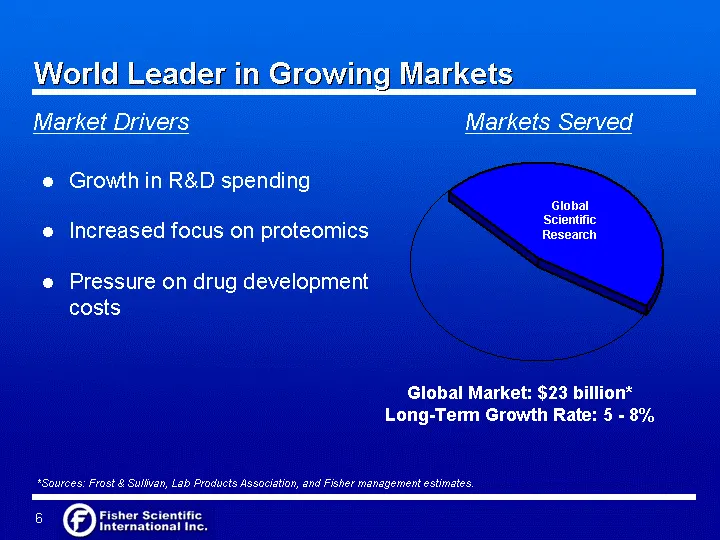
World Leader in Growing Markets Market Drivers Markets Served Global Market: $23 billion* Long-Term Growth Rate: 5 - 8% Growth in R&D spending Increased focus on proteomics Pressure on drug development costs *Sources: Frost & Sullivan, Lab Products Association, and Fisher management estimates. Bipha
Slide 6: World Leader in Growing Markets: Global Biopharma Production
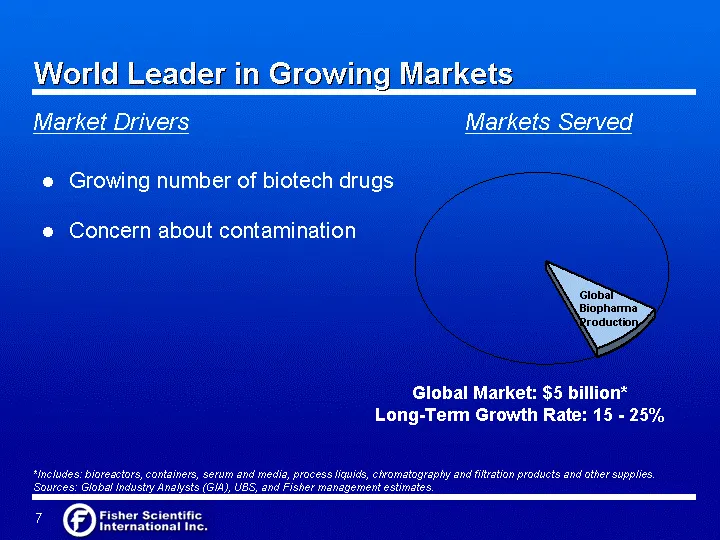
World Leader in Growing Markets Bipharma 5 Safety 12 Clinical 10 Scientific Research 23 Market Drivers Markets Served Global Market: $5 billion* Long-Term Growth Rate: 15 - 25% Growing number of biotech drugs Concern about contamination Global Biopharma Production *Includes: bioreactors, containers,
Slide 7: World Leader in Growing Markets: U.S. Clinical Lab
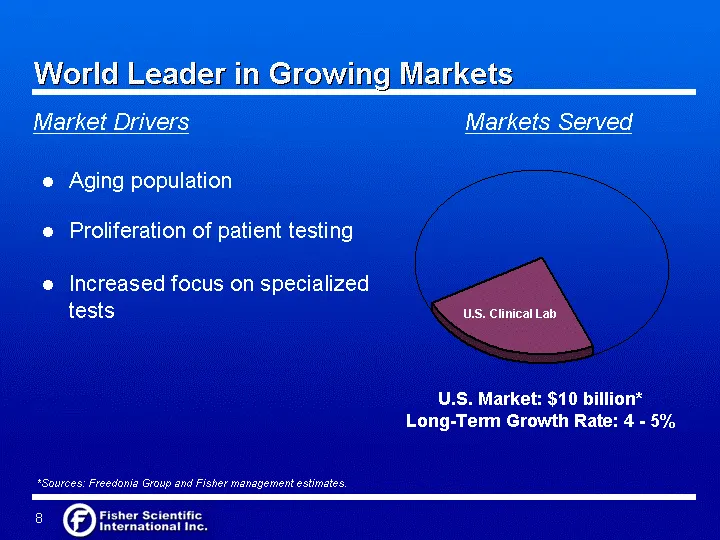
World Leader in Growing Markets Market Drivers Markets Served U.S. Market: $10 billion* Long-Term Growth Rate: 4 - 5% Aging population Proliferation of patient testing Increased focus on specialized tests *Sources: Freedonia Group and Fisher management estimates. Bipharma 5 Safety 12 Clinical 10 Sci
Slide 8: World Leader in Growing Markets: Lab Safety and Personal Protection
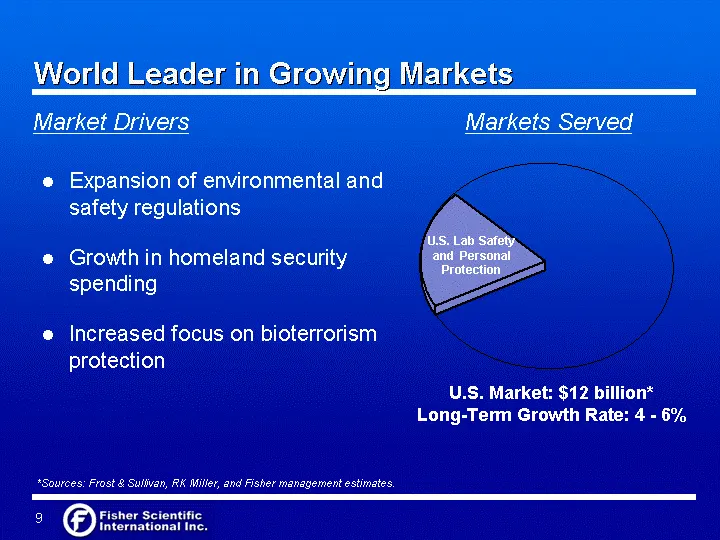
World Leader in Growing Markets Bipharma 5 Safety 12 Clinical 10 Scientific Research 23 U.S. Lab Safety and Personal Protection Market Drivers Markets Served U.S. Market: $12 billion* Long-Term Growth Rate: 4 - 6% Expansion of environmental and safety regulations Growth in homeland security spending
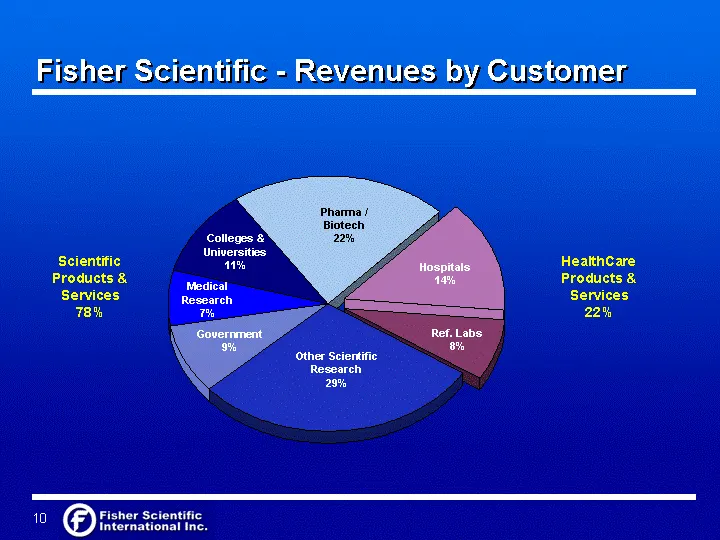
Slide 9: Fisher Scientific - Revenues by Customer
Pharma 0.22 Hospitals 0.14 Reference Labs / Other 0.08 Other 0.29 Government 0.09 Medical Research 0.07 Colleges and Universities 0.11 Fisher Scientific - Revenues by Customer Pharma / Biotech 22% Colleges & Universities 11% Medical Research 7% Other Scientific Research 29% Hospitals 14% Ref. Labs 8
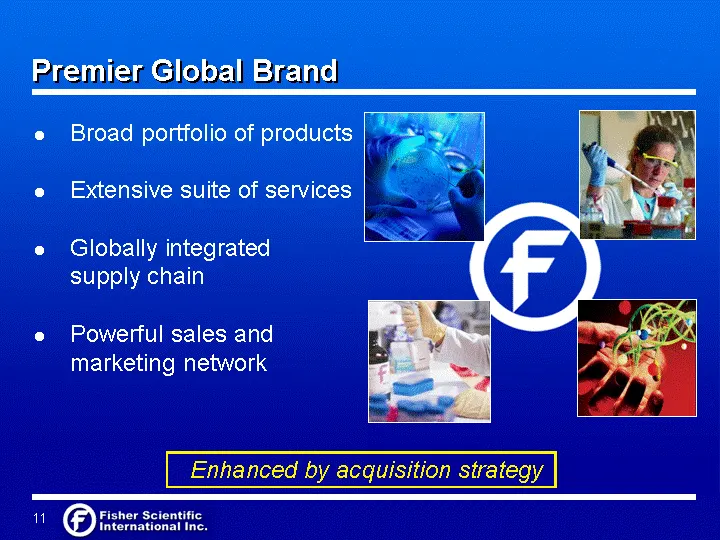
Slide 10: Premier Global Brand
Broad portfolio of products Extensive suite of services Globally integrated supply chain Powerful sales and marketing network Premier Global Brand Enhanced by acquisition strategy
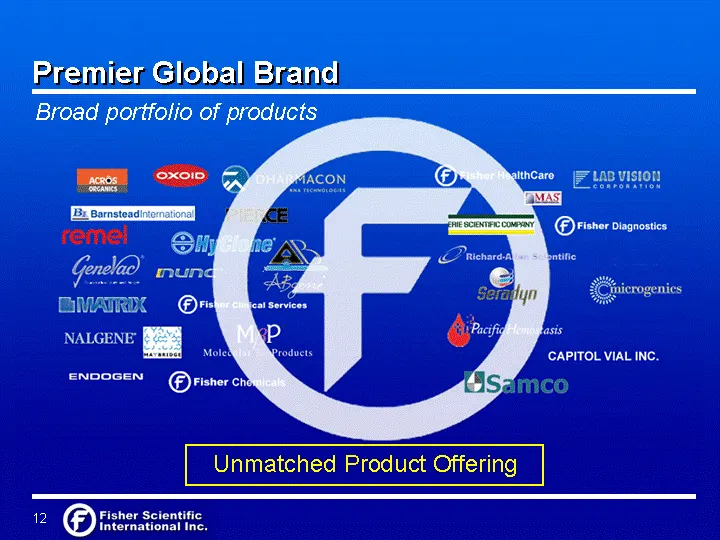
Slide 11: Unmatched Product Offering
Broad portfolio of products Unmatched Product Offering Premier Global Brand 12
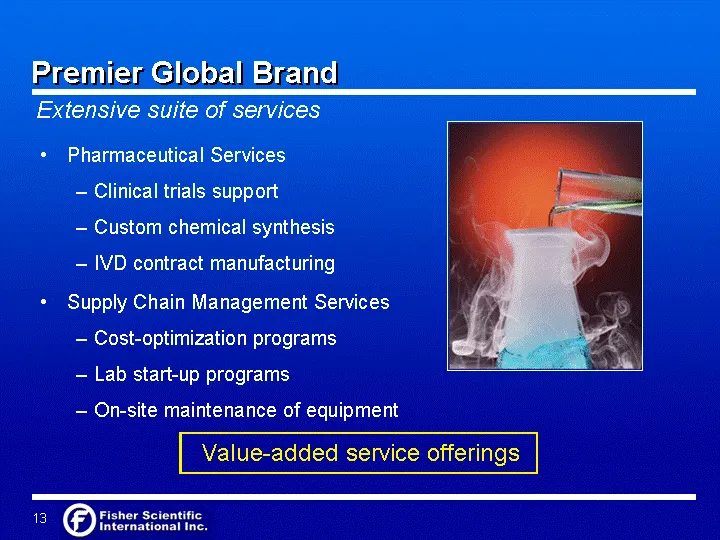
Slide 12: Extensive Suite of Services
Extensive suite of services Supply Chain Management Services Cost-optimization programs Lab start-up programs On-site maintenance of equipment Value-added service offerings Pharmaceutical Services Clinical trials support Custom chemical synthesis IVD contract manufacturing 13 Premier Global Brand
Slide 13: Globally Integrated Supply Chain
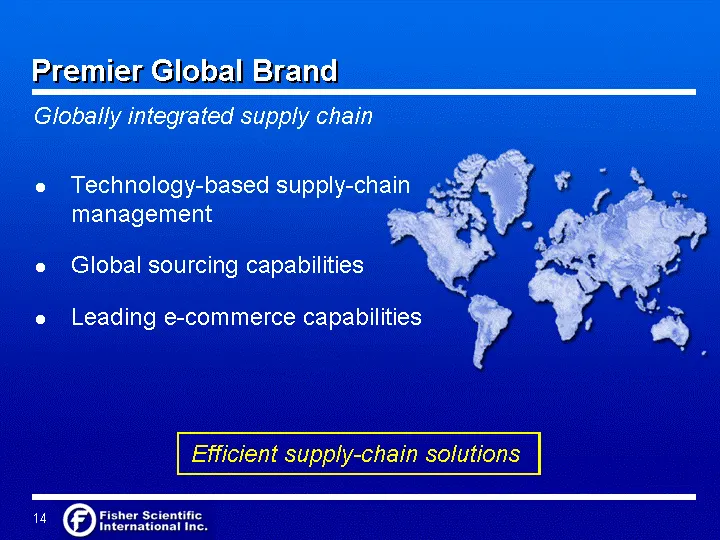
Globally integrated supply chain Efficient supply-chain solutions Premier Global Brand Technology-based supply-chain management Global sourcing capabilities Leading e-commerce capabilities
Slide 14: Powerful Sales and Marketing Network
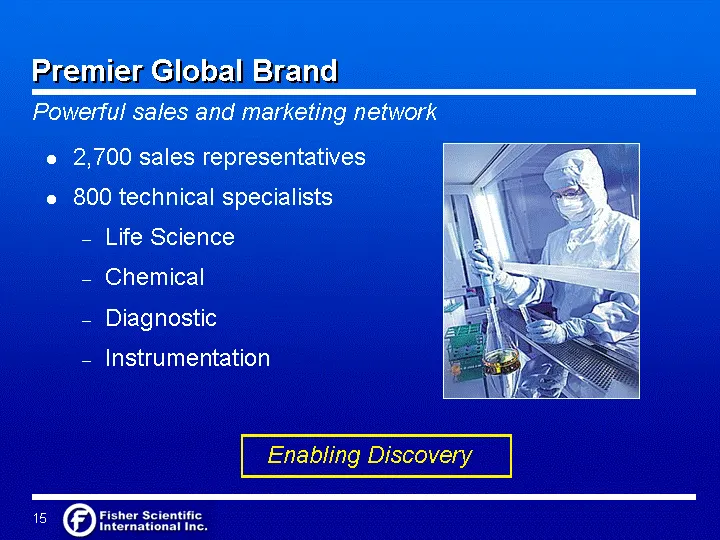
2,700 sales representatives 800 technical specialists Life Science Chemical Diagnostic Instrumentation Powerful sales and marketing network Enabling Discovery Premier Global Brand
Slide 15: Enhanced by Acquisition Strategy
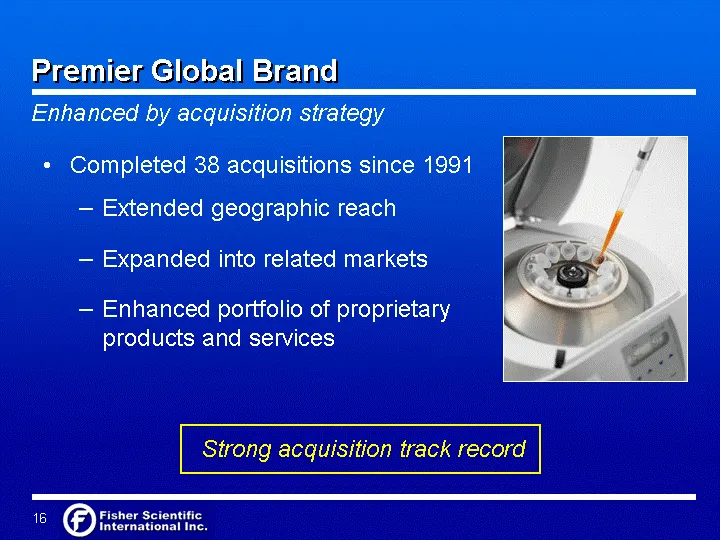
Completed 38 acquisitions since 1991 Extended geographic reach Expanded into related markets Enhanced portfolio of proprietary products and services Enhanced by acquisition strategy Strong acquisition track record Premier Global Brand
Slide 16: Opportunities for Profitable Growth
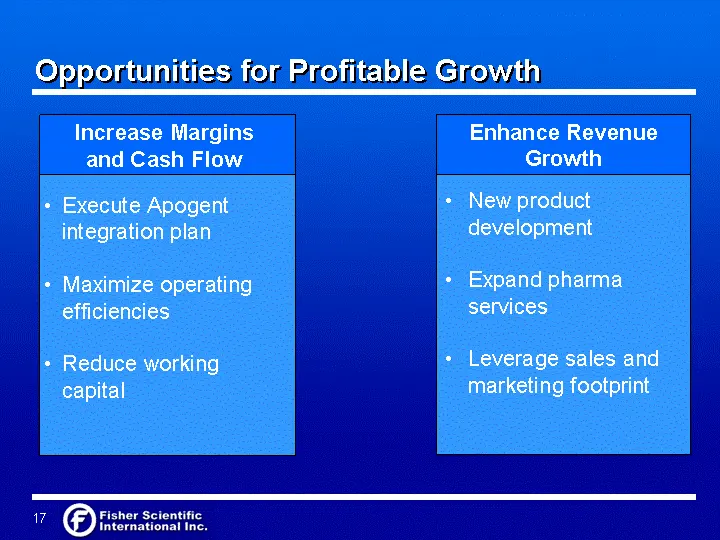
New product development Expand pharma services Leverage sales and marketing footprint Enhance Revenue Growth Execute Apogent integration plan Maximize operating efficiencies Reduce working capital Opportunities for Profitable Growth Increase Margins and Cash Flow
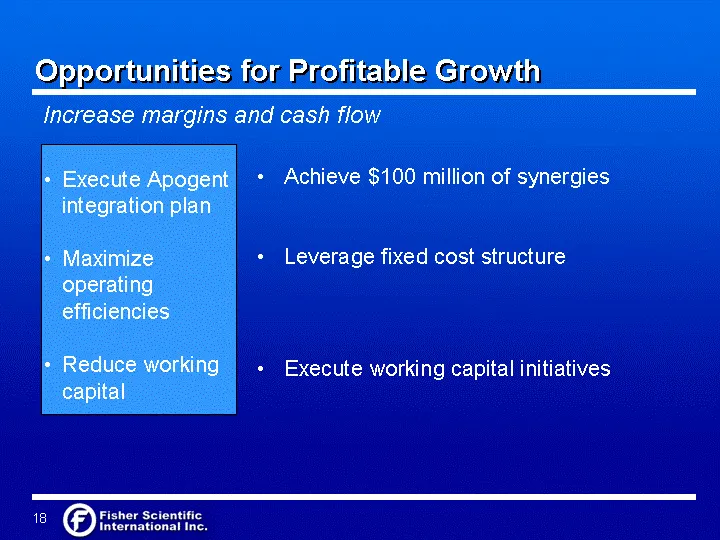
Slide 17: Opportunities for Profitable Growth: Increase Margins and Cash Flow
Execute Apogent integration plan Opportunities for Profitable Growth Increase margins and cash flow Achieve $100 million of synergies Leverage fixed cost structure Execute working capital initiatives Maximize operating efficiencies Reduce working capital
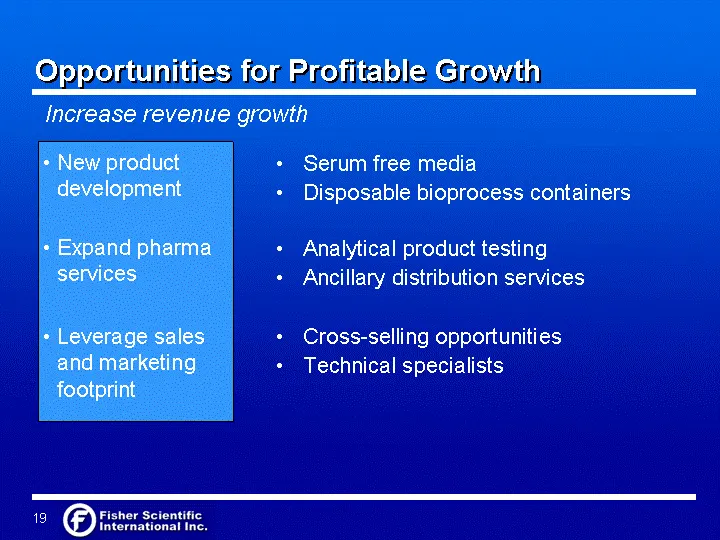
Slide 18: Opportunities for Profitable Growth: Increase Revenue Growth
Opportunities for Profitable Growth Cross-selling opportunities Technical specialists New product development Increase revenue growth Analytical product testing Ancillary distribution services Serum free media Disposable bioprocess containers Expand pharma services Leverage sales and marketing footp
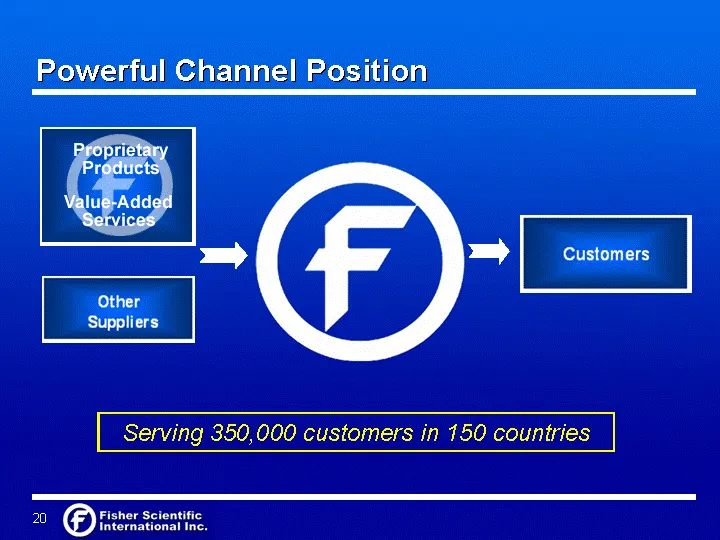
Slide 19: Powerful Channel Position
Powerful Channel Position Serving 350,000 customers in 150 countries
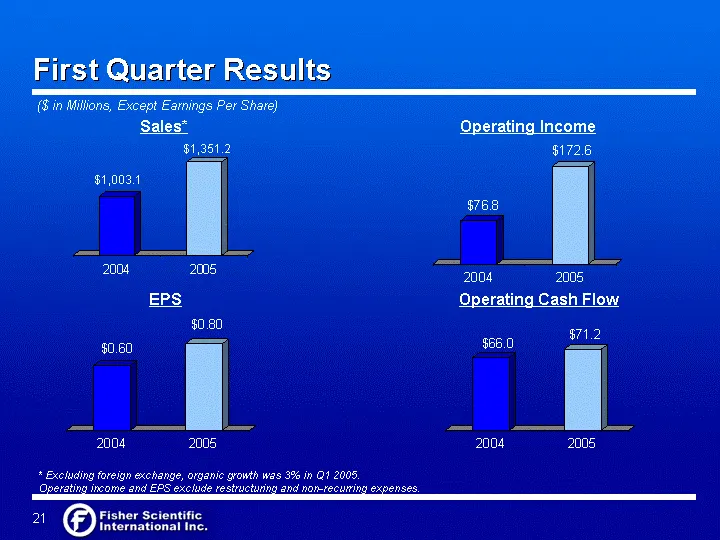
Slide 20: First Quarter Results
* Excluding foreign exchange, organic growth was 3% in Q1 2005. Operating income and EPS exclude restructuring and non-recurring expenses. 2004 2005 East 1003.1 1351.2 ($ in Millions, Except Earnings Per Share) 2004 2005 East 0.6 0.8 2004 2005 East 66 71.2 Sales* EPS Operating Cash Flow Operating In
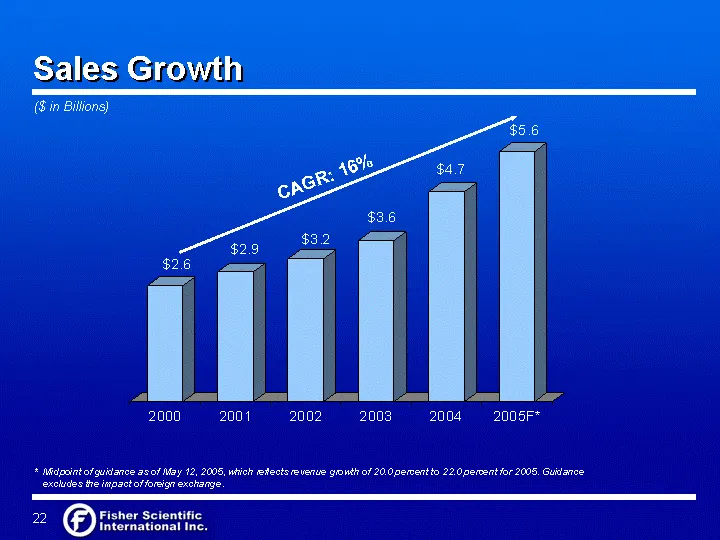
Slide 21: Sales Growth
Sales Growth ($ in Billions) 2000 2001 2002 2003 2004 2005F* * Midpoint of guidance as of May 12, 2005, which reflects revenue growth of 20.0 percent to 22.0 percent for 2005. Guidance excludes the impact of foreign exchange. CAGR: 16%
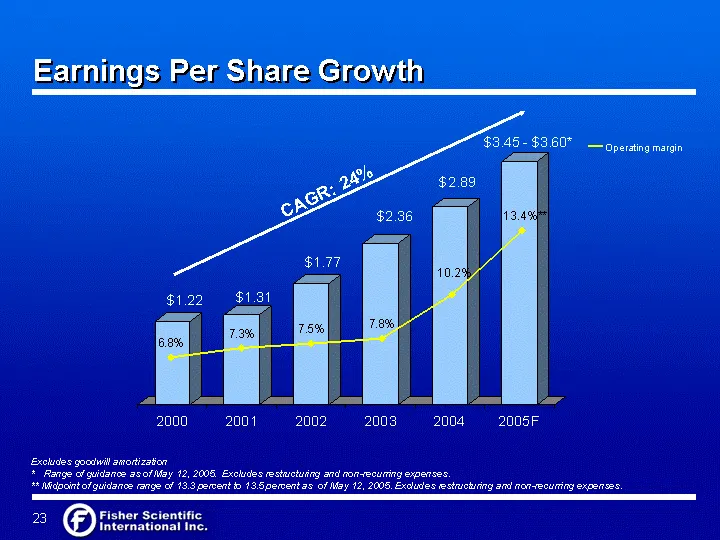
Slide 22: Earnings Per Share Growth
Earnings Per Share Growth Excludes goodwill amortization * Range of guidance as of May 12, 2005. Excludes restructuring and non-recurring expenses. ** Midpoint of guidance range of 13.3 percent to 13.5 percent as of May 12, 2005. Excludes restructuring and non-recurring expenses. 2000 2001 2002 2003
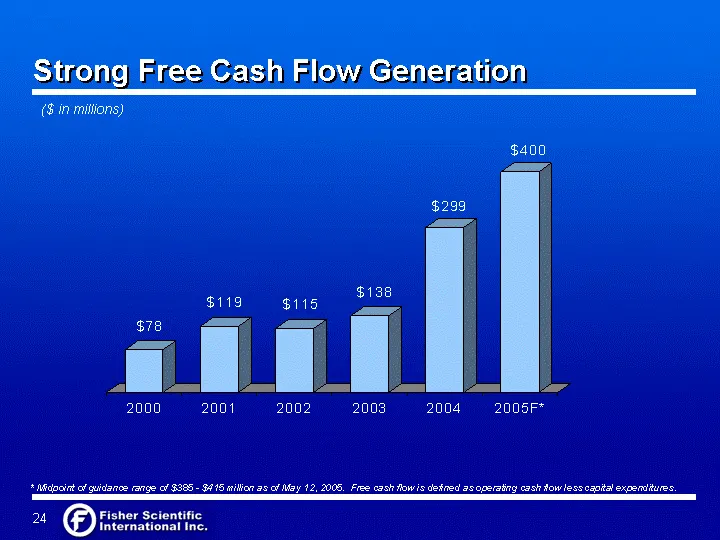
Slide 23: Strong Free Cash Flow Generation
Strong Free Cash Flow Generation 2000 2001 2002 2003 2004 2005F* ($ in millions) * Midpoint of guidance range of $385 - $415 million as of May 12, 2005. Free cash flow is defined as operating cash flow less capital expenditures.
Slide 24: Investment Highlights
Investment Highlights World leader in growing markets Opportunities for profitable growth Premier global brand Proven track record Strong earnings and cash flow growth 25

Slide 25: The World Leader in Serving Science
The World Leader in Serving Science
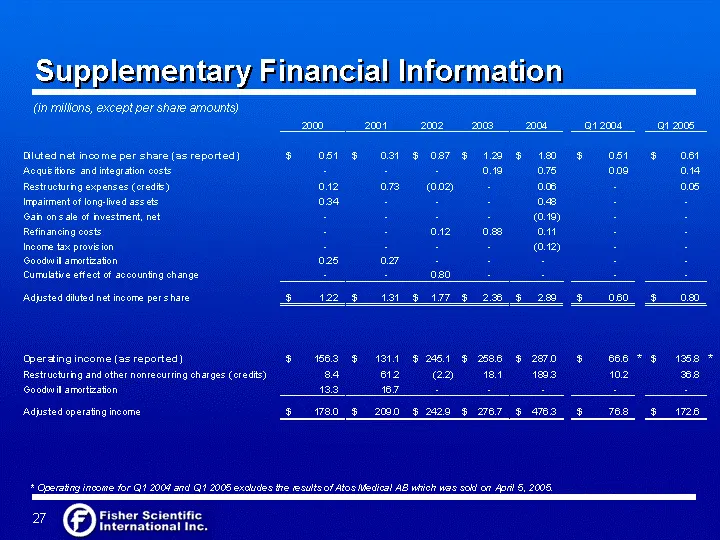
Slide 26: Supplementary Financial Information
(in millions, except per share amounts) Supplementary Financial Information * Operating income for Q1 2004 and Q1 2005 excludes the results of Atos Medical AB which was sold on April 5, 2005.
Source: SEC EDGAR · 8-K filed May 12, 2005
More decks from Fisher Scientific International Inc
 Merger or Acquisition (May 2006)23 slides · May 8, 2006
 Lehman Brothers Ninth Annual Global Healthcare Conference 200619 slides · Mar 8, 2006
 Merrill Lynch Global Pharmaceutical, Biotechnology & Medical Device Conference 200612 slides · Feb 9, 2006
 Goldman Sachs Twenty Sixth Annual Global Healthcare Conference 200511 slides · Jun 15, 2005
 Banc of America Securities Health Care Conference 200511 slides · May 17, 2005
 Investor Presentation (February 2005)27 slides · Feb 10, 2005