Boston Private Financial Holdings Inc
Boston Private Financial — Investor Presentation (March 2006)
33 slides from Boston Private Financial's investor presentation, Mar 28, 2006
Slide 1: Establishing the Sustainable Growth Metrics of Boston Private
EXHIBIT 99.1 Sustainable And Establishing of Boston Sustainable Related Private Growth the Metrics Growth –Confidential “BRIGHT LINE”/ Copyright 2006
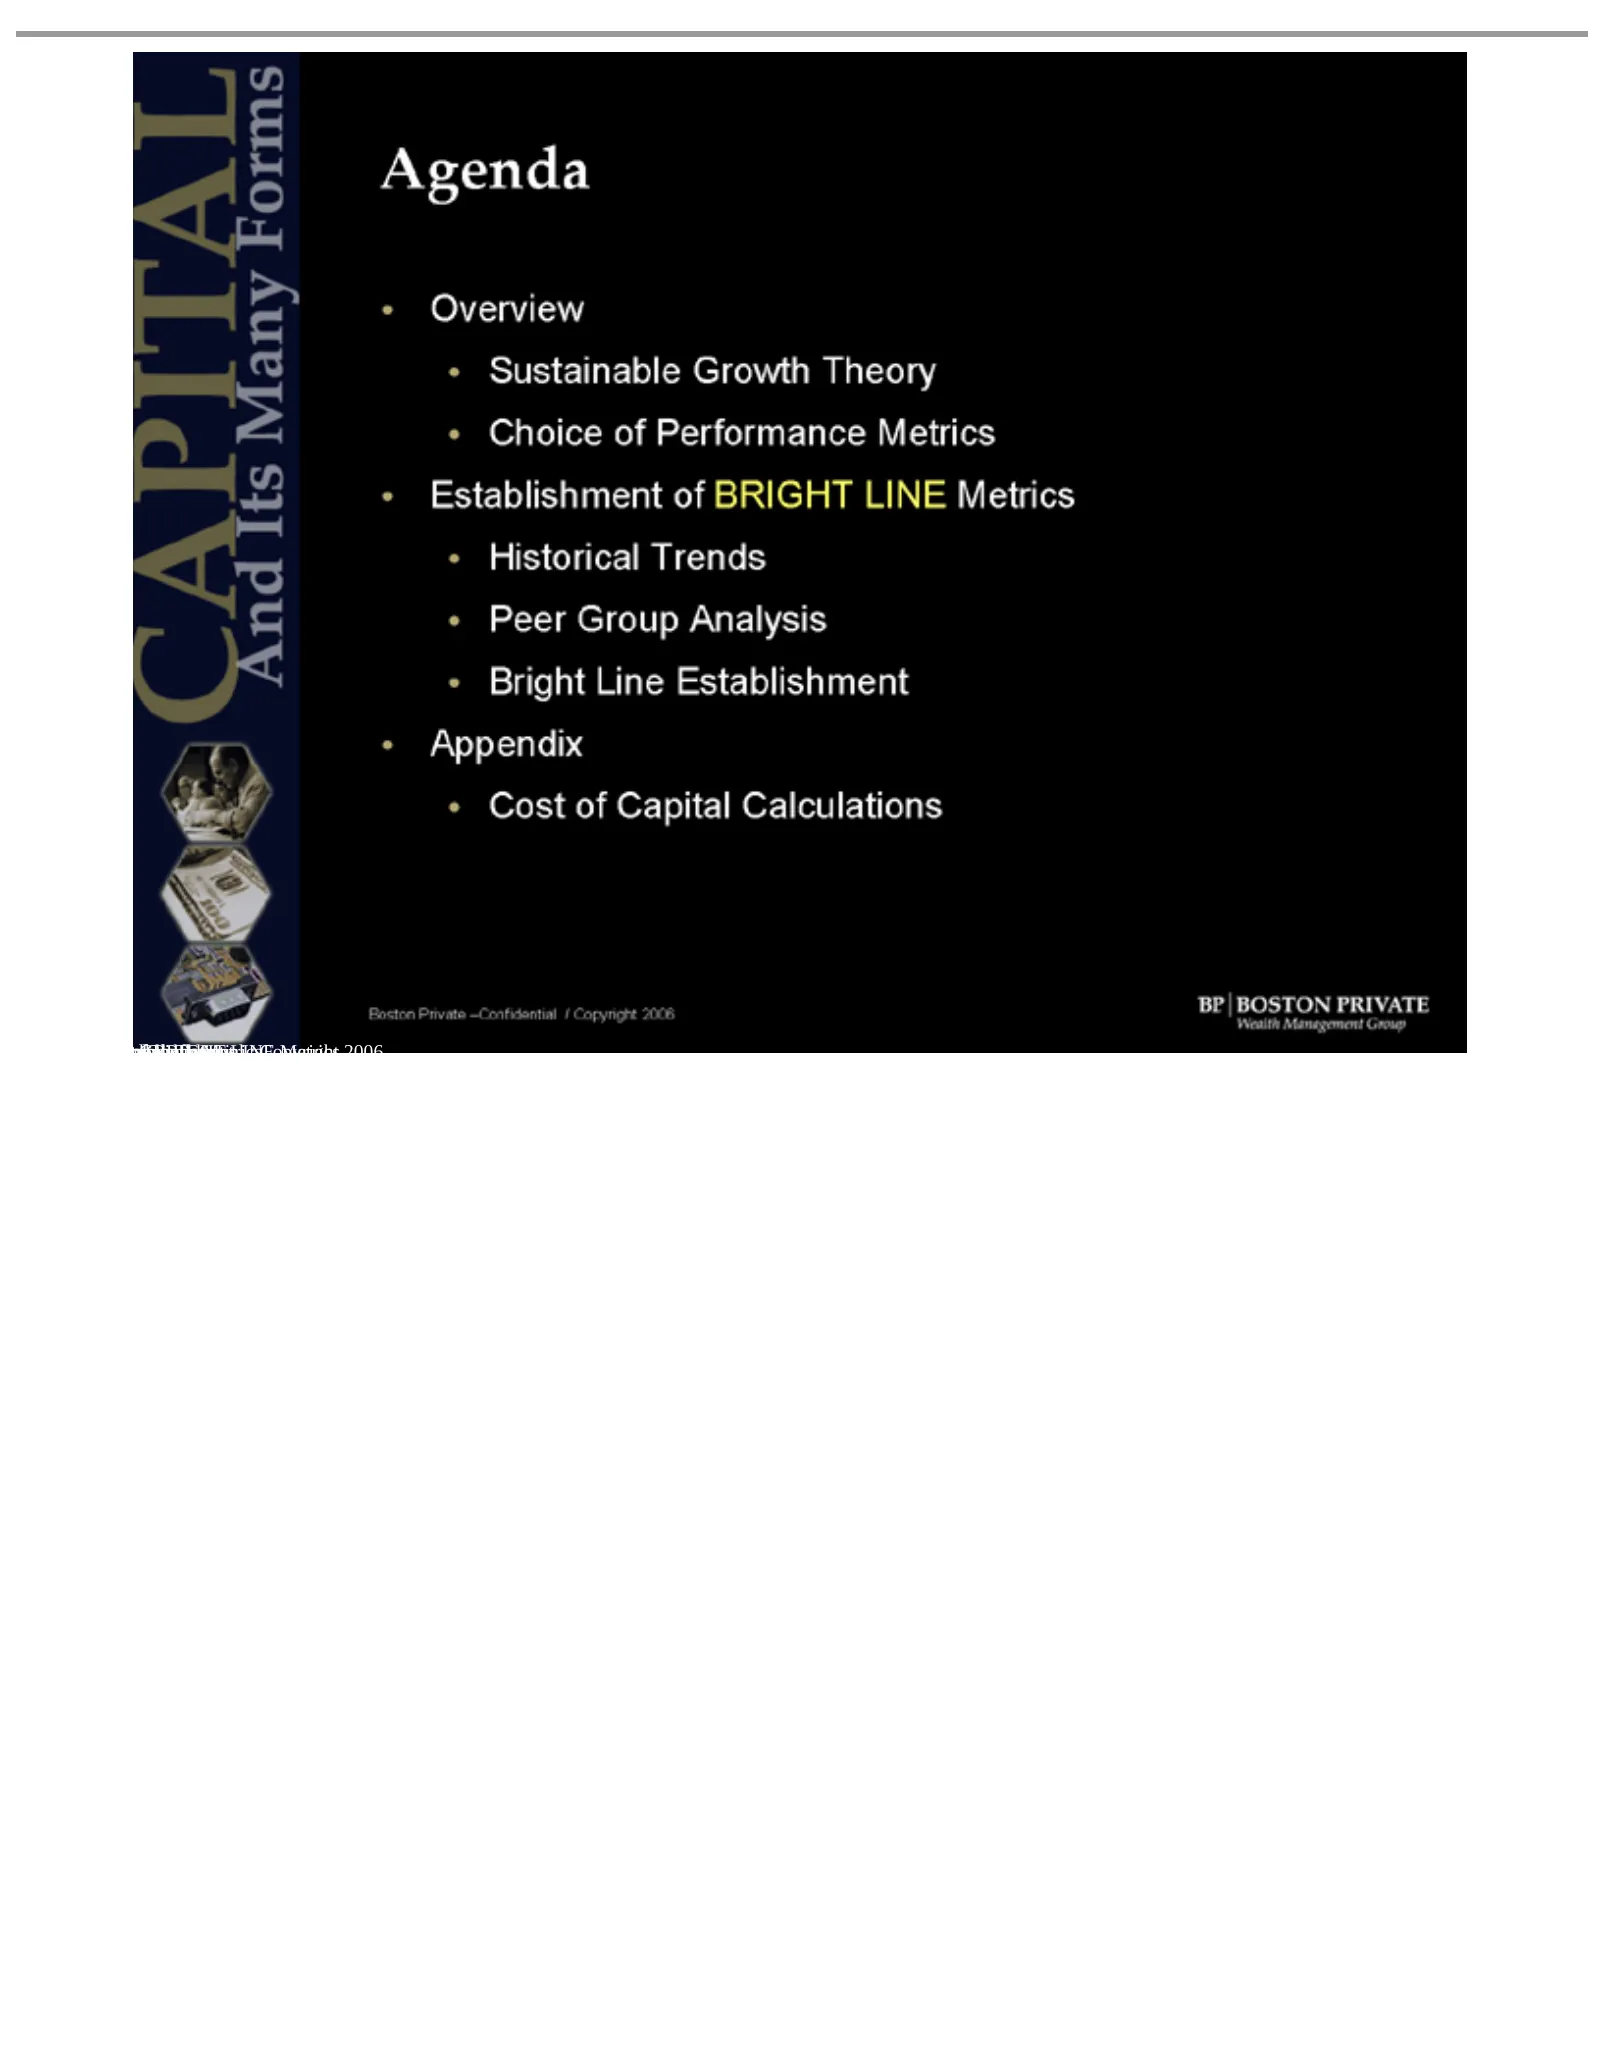
Slide 2: Agenda
Sustainable Overview Agenda Choice Establishment Historical Peer Bright Cost Appendix Boston Group ofLine of Private Capital Performance Trends Analysis Growth Establishment of –Confidential Calculations BRIGHT Theory Metrics LINE / Copyright Metrics 2006
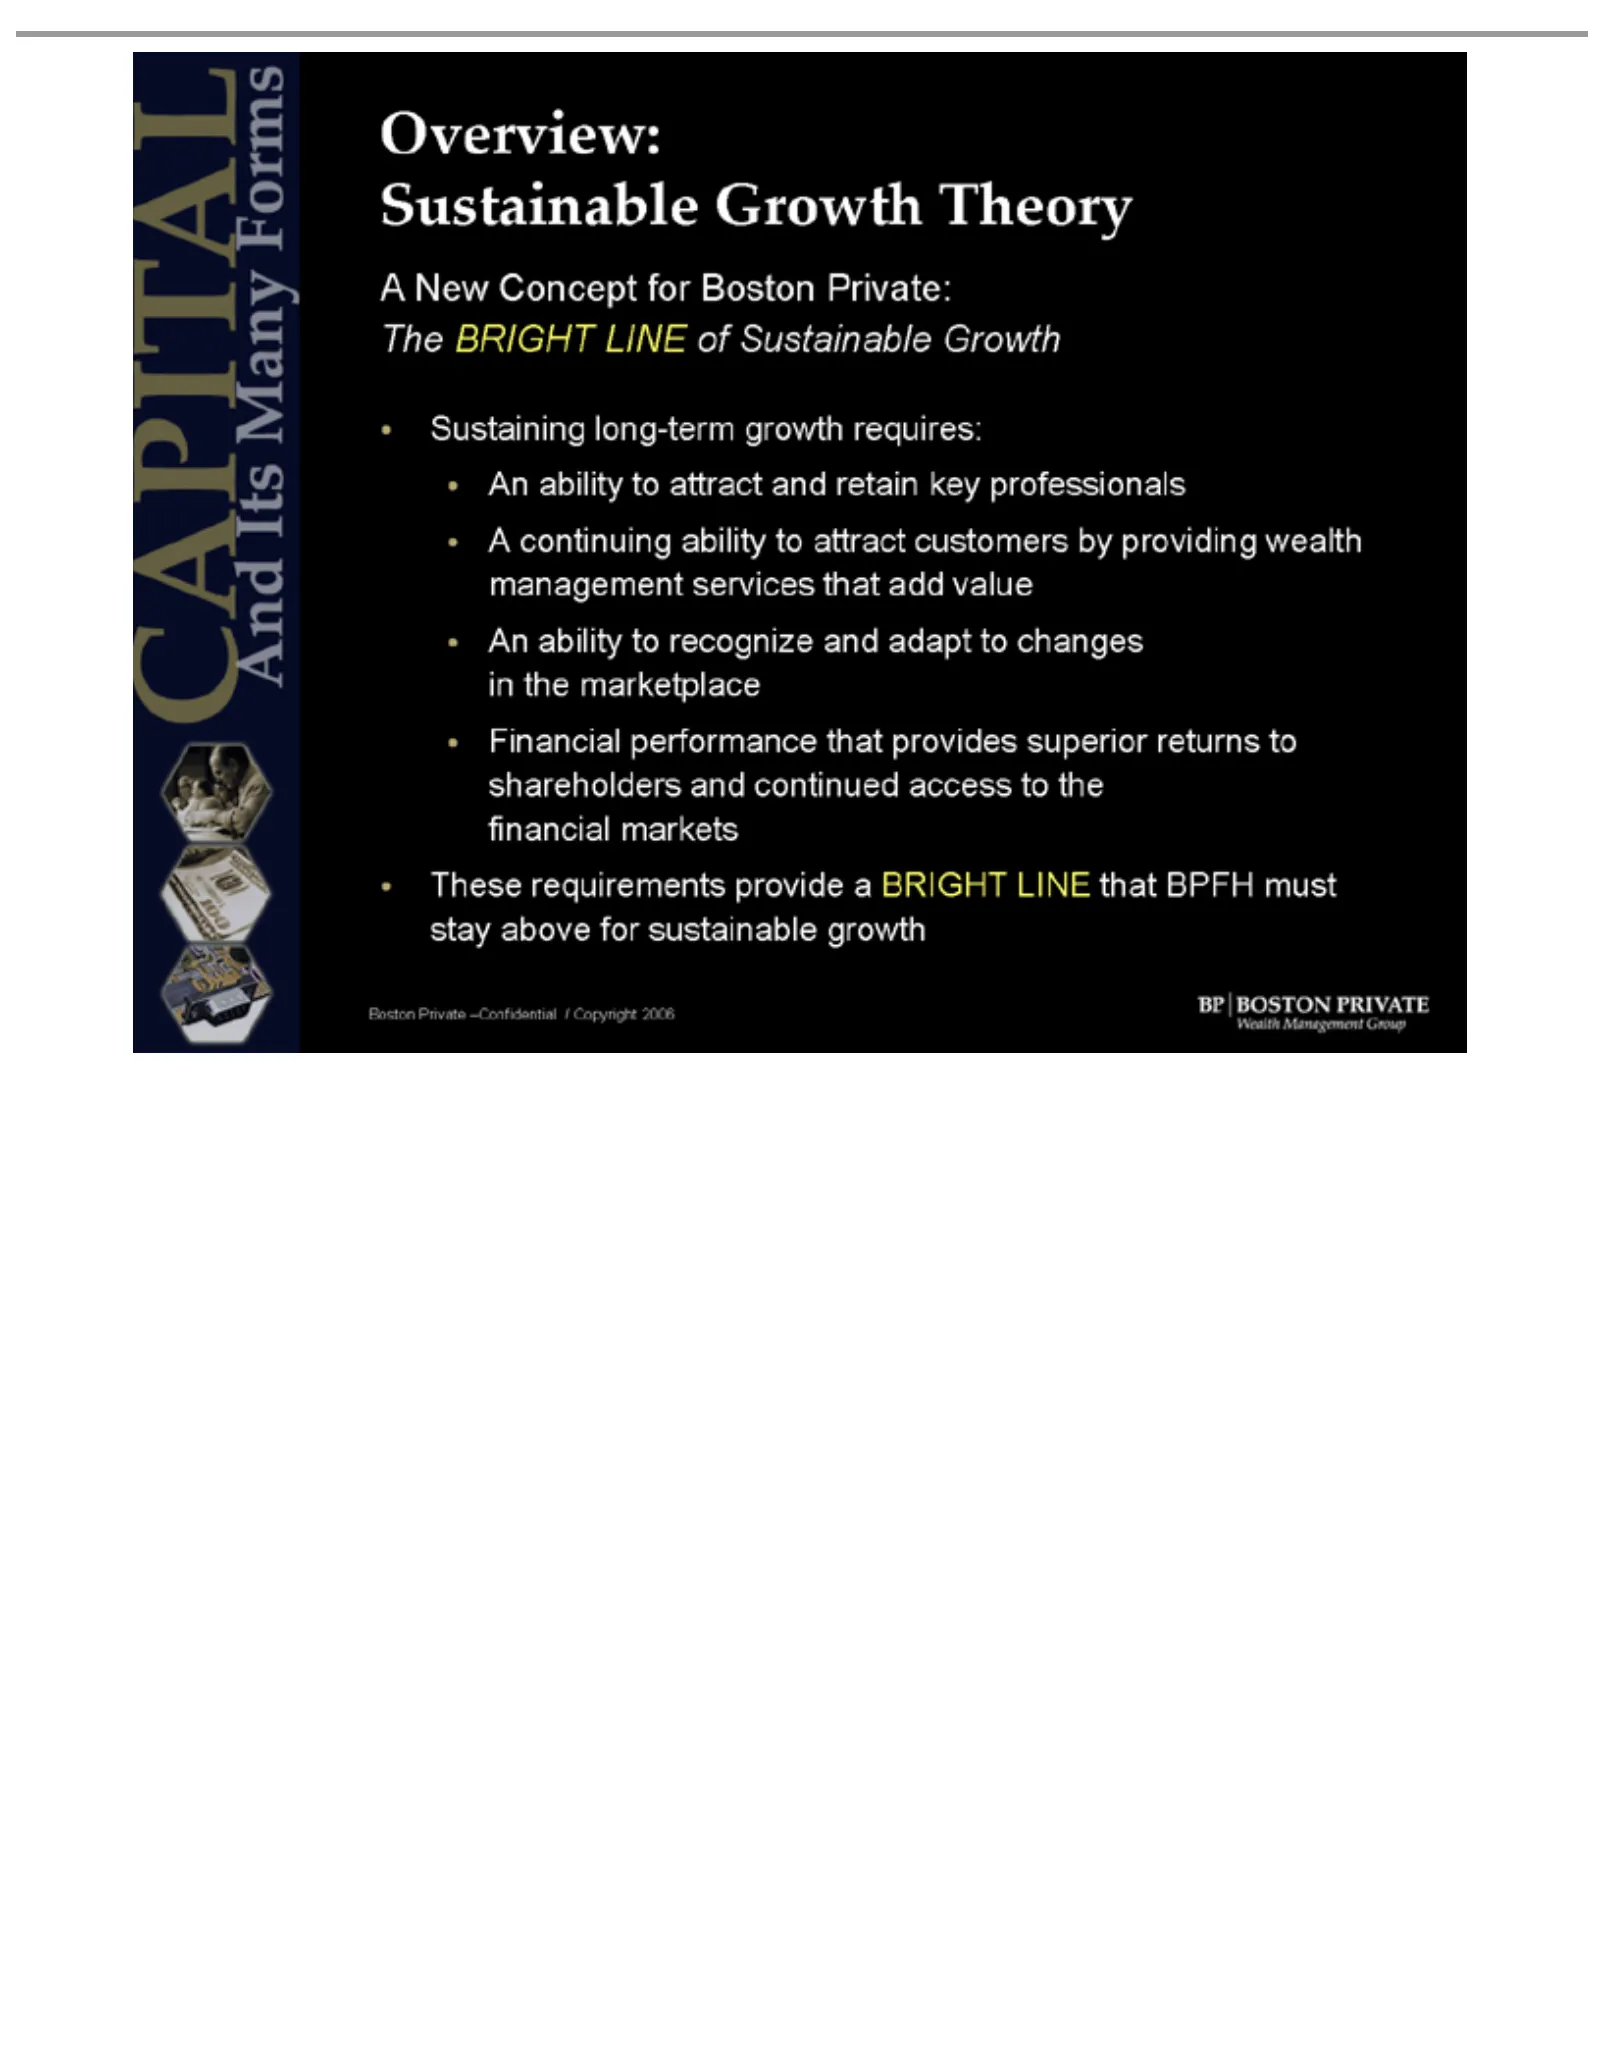
Slide 3: Sustainable Growth Overview: The Concept
Sustainable Overview: The Sustaining A management An in Financial shareholders financial These stay Boston New continuing the ability BRIGHT above marketplace requirements Concept Private markets performance to long-term for Growth and attract recognize services ability LINE sustainable –Confidentia
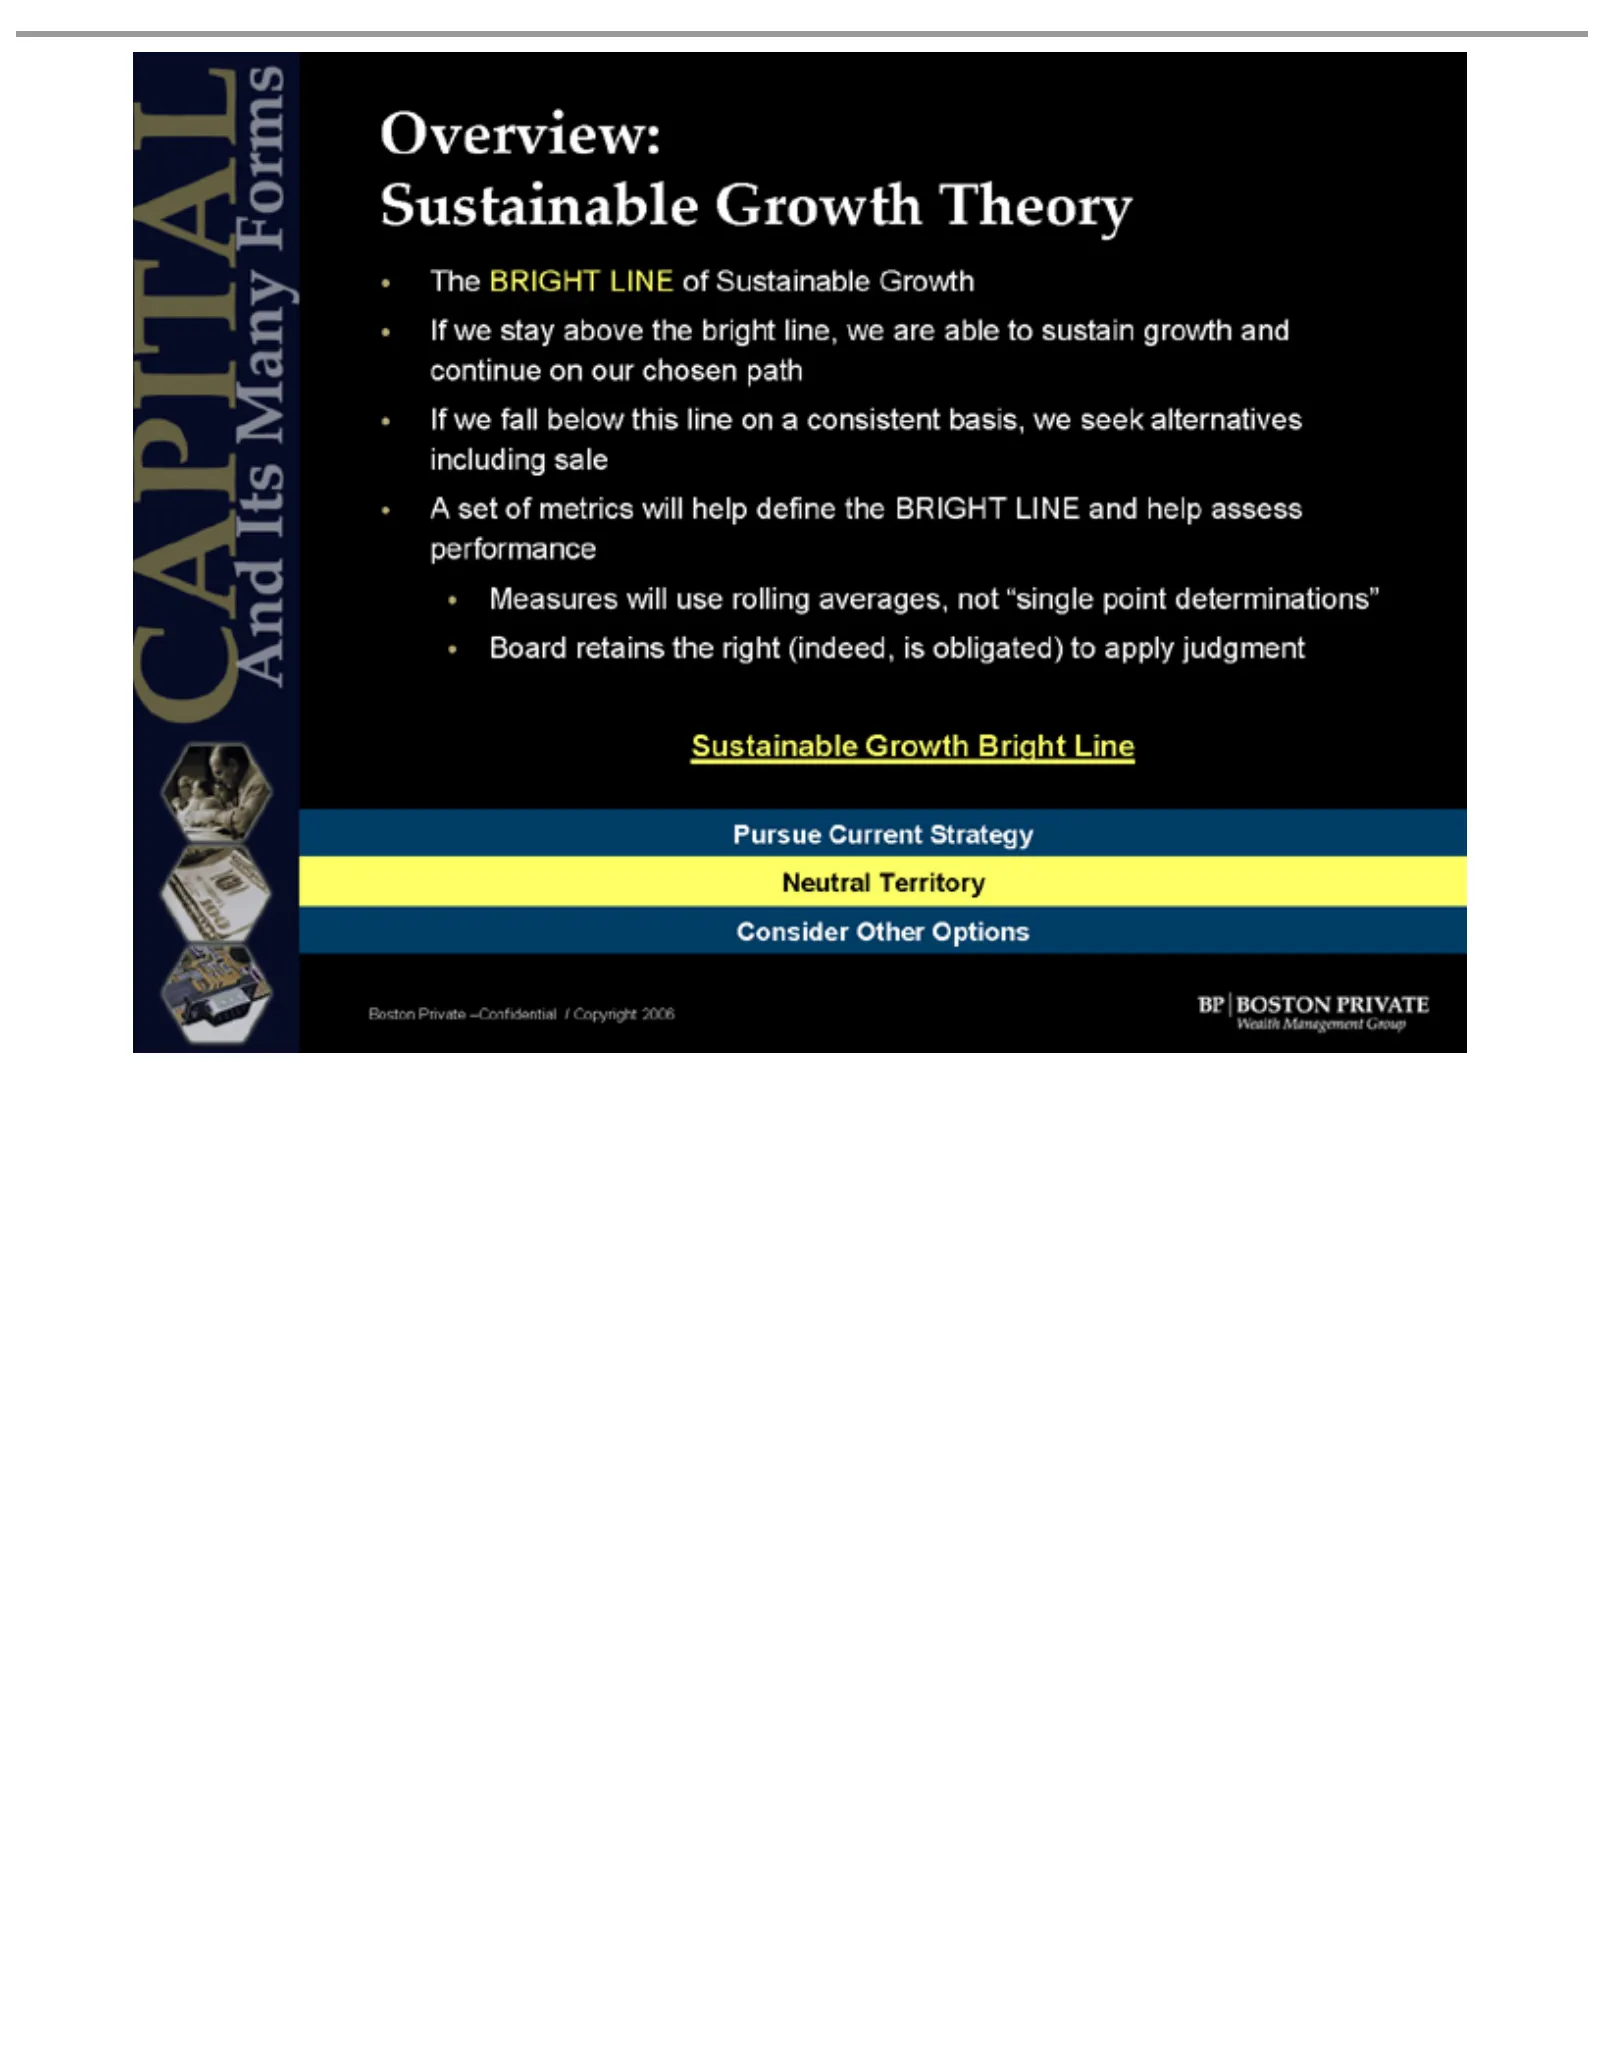
Slide 4: Sustainable Growth Overview: The Bright Line Theory
Overview: The If including A Measures performance Board Sustainable Pursue Neutral Consider Boston we setBRIGHT of stay fall retains Current Private Territory metrics Other below sale will above Growth the LINE use –Confidential Strategy Options will this the right rolling Theory Bright of bright li
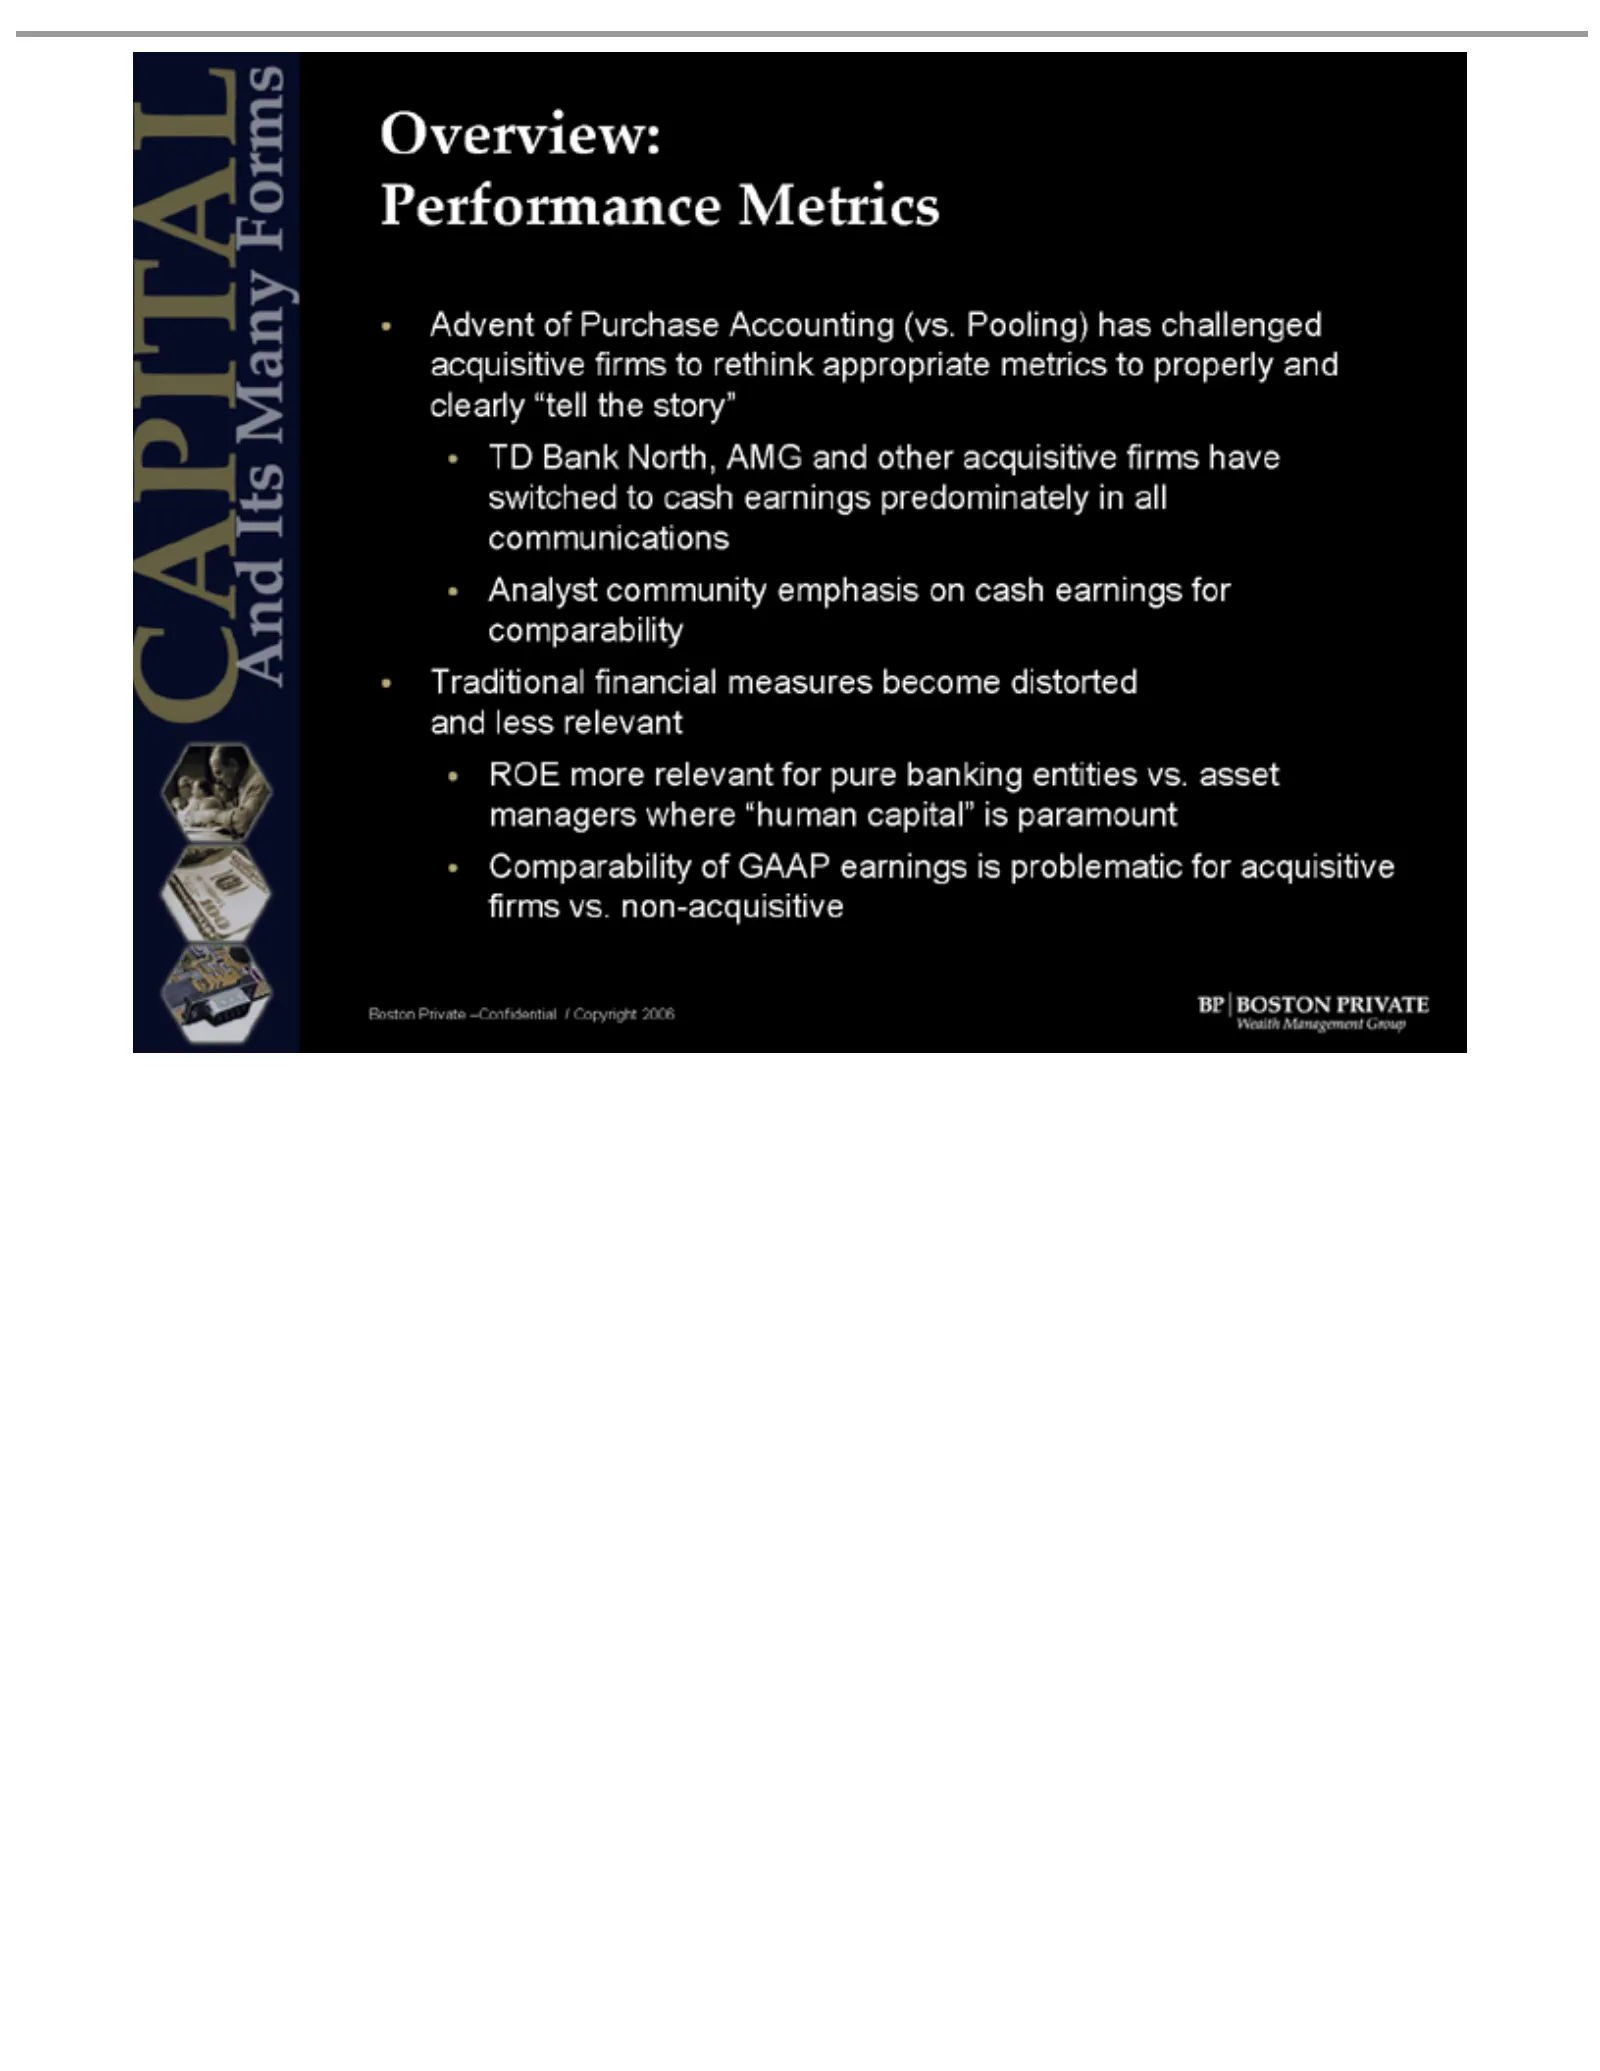
Slide 5: Performance Overview: Advent of Cash Earnings
Performance Overview: Advent acquisitive clearly TD switched Analyst communications Traditional comparability and ROE managers Comparability firms Boston Bank less more vs. “tell Private of community relevant non-acquisitive to North, where Purchase relevant firms financial cash the Metrics of –Conf
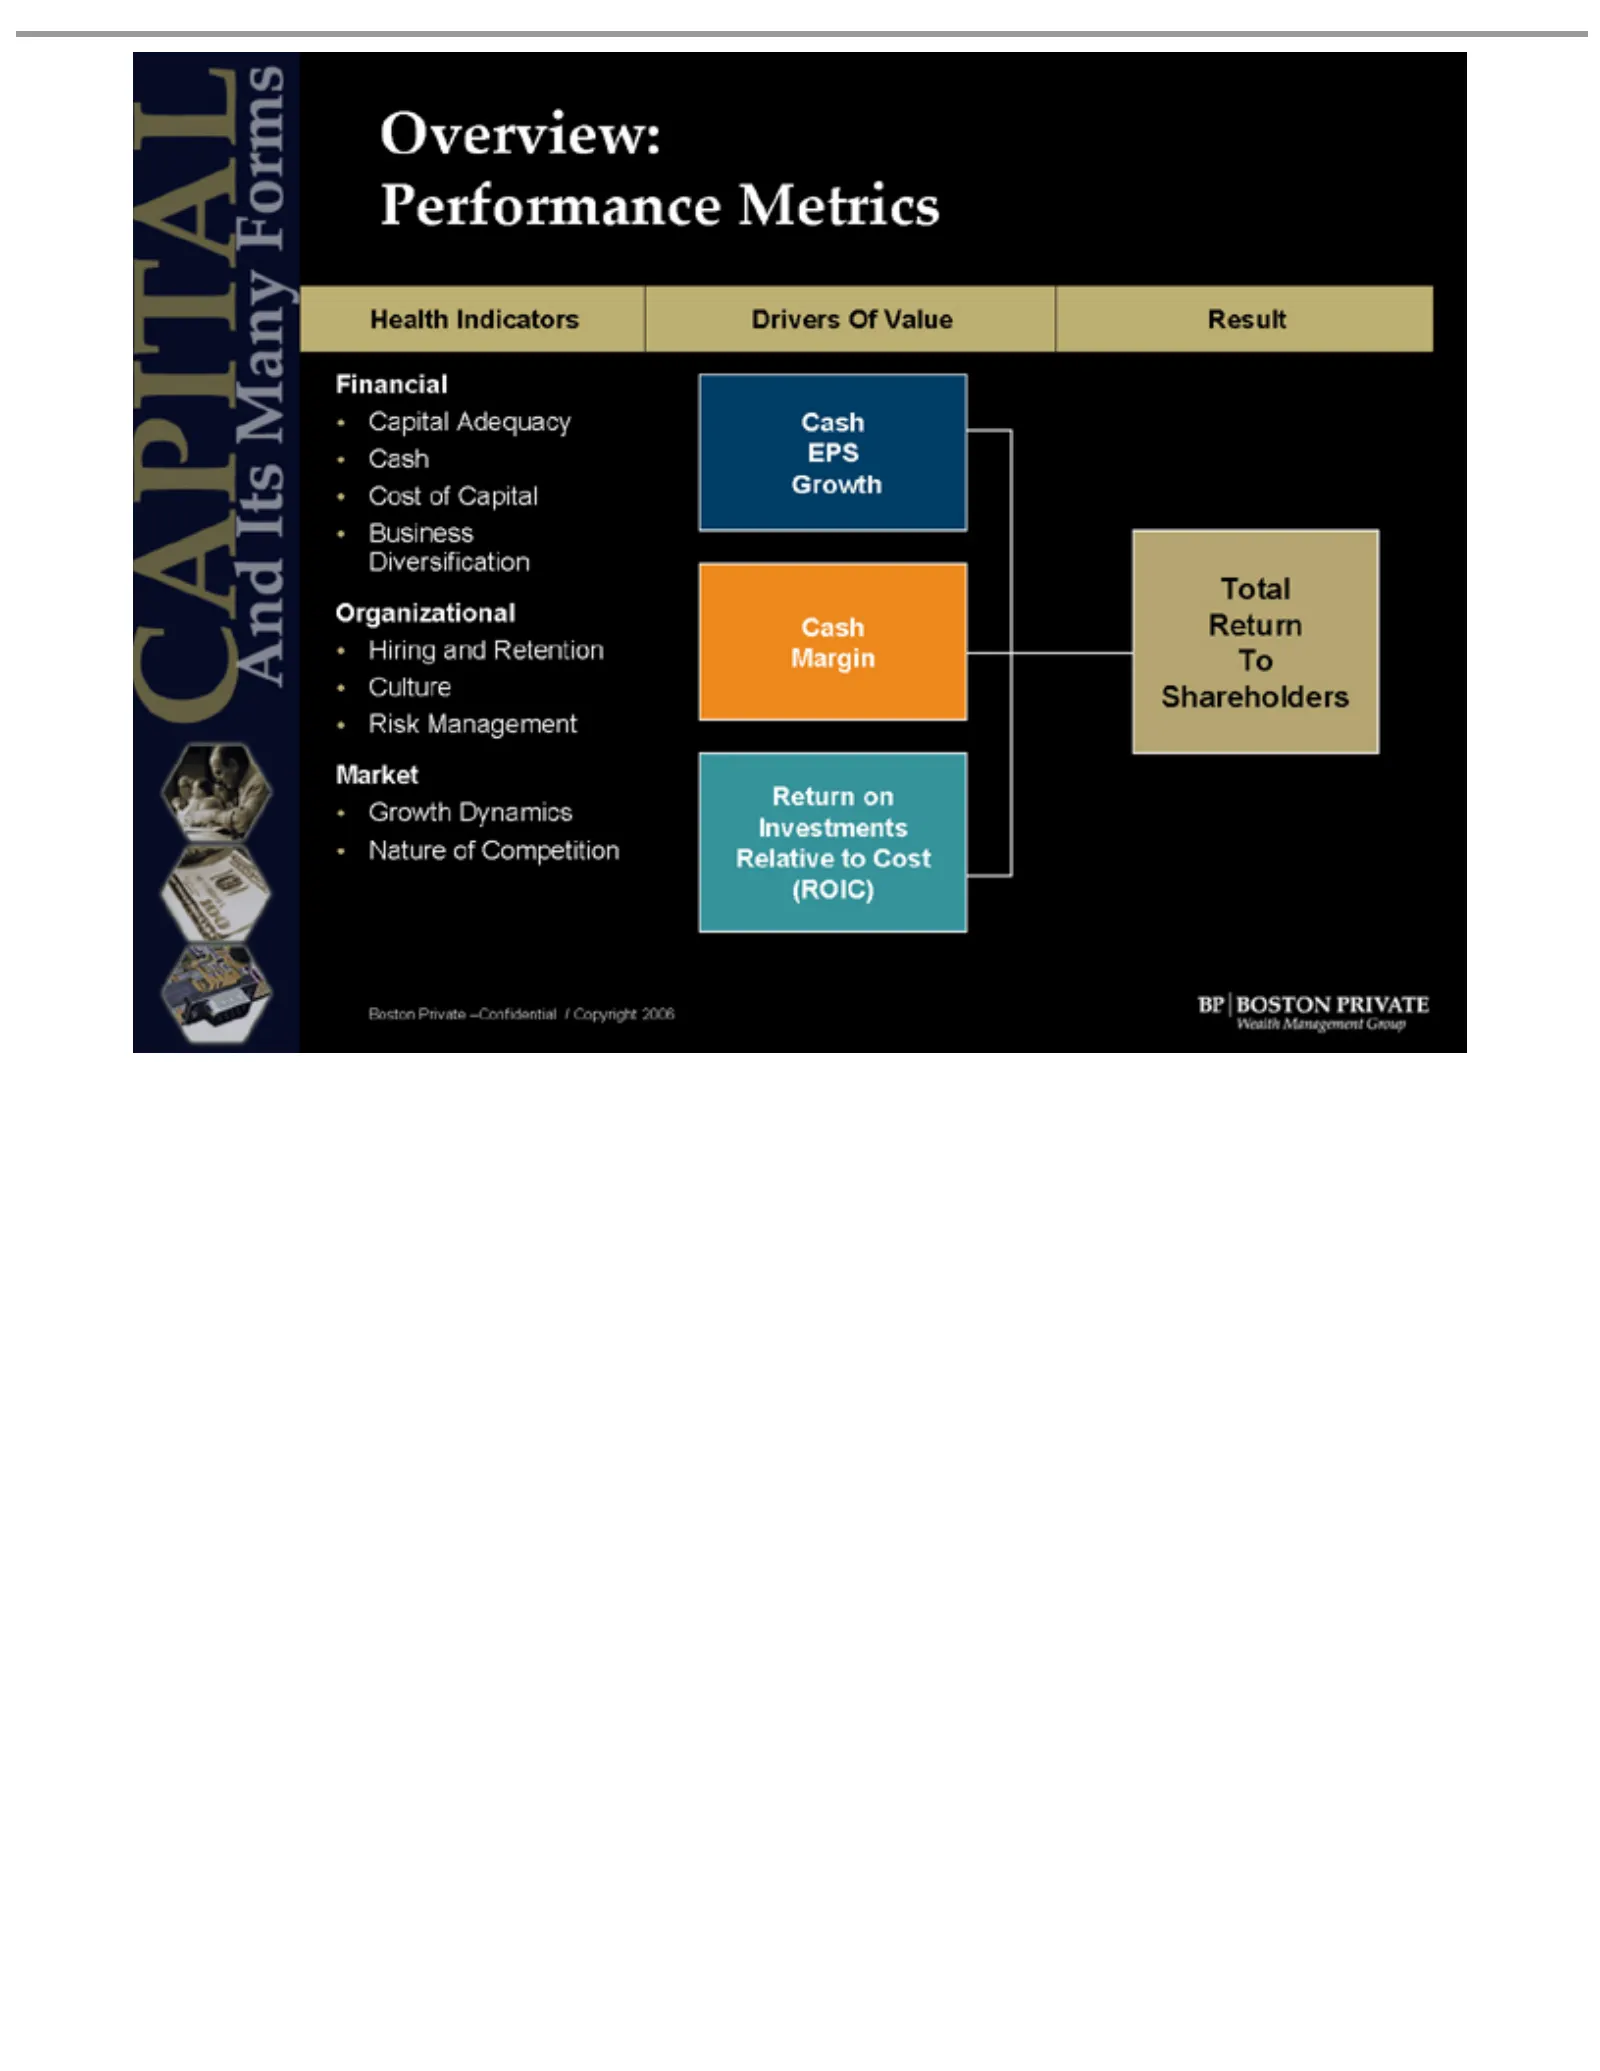
Slide 6: Financial Performance and Health Drivers
Financial Performance Health Drivers Capital Result Cost Hiring Organizational Diversification Business Risk Culture Market Nature Margin Growth EPS Cash Relative Investments Boston Shareholders To Return Total (ROIC)ofand Management Indicators of on Adequacy Private Capital Of Dynamics toOverview:
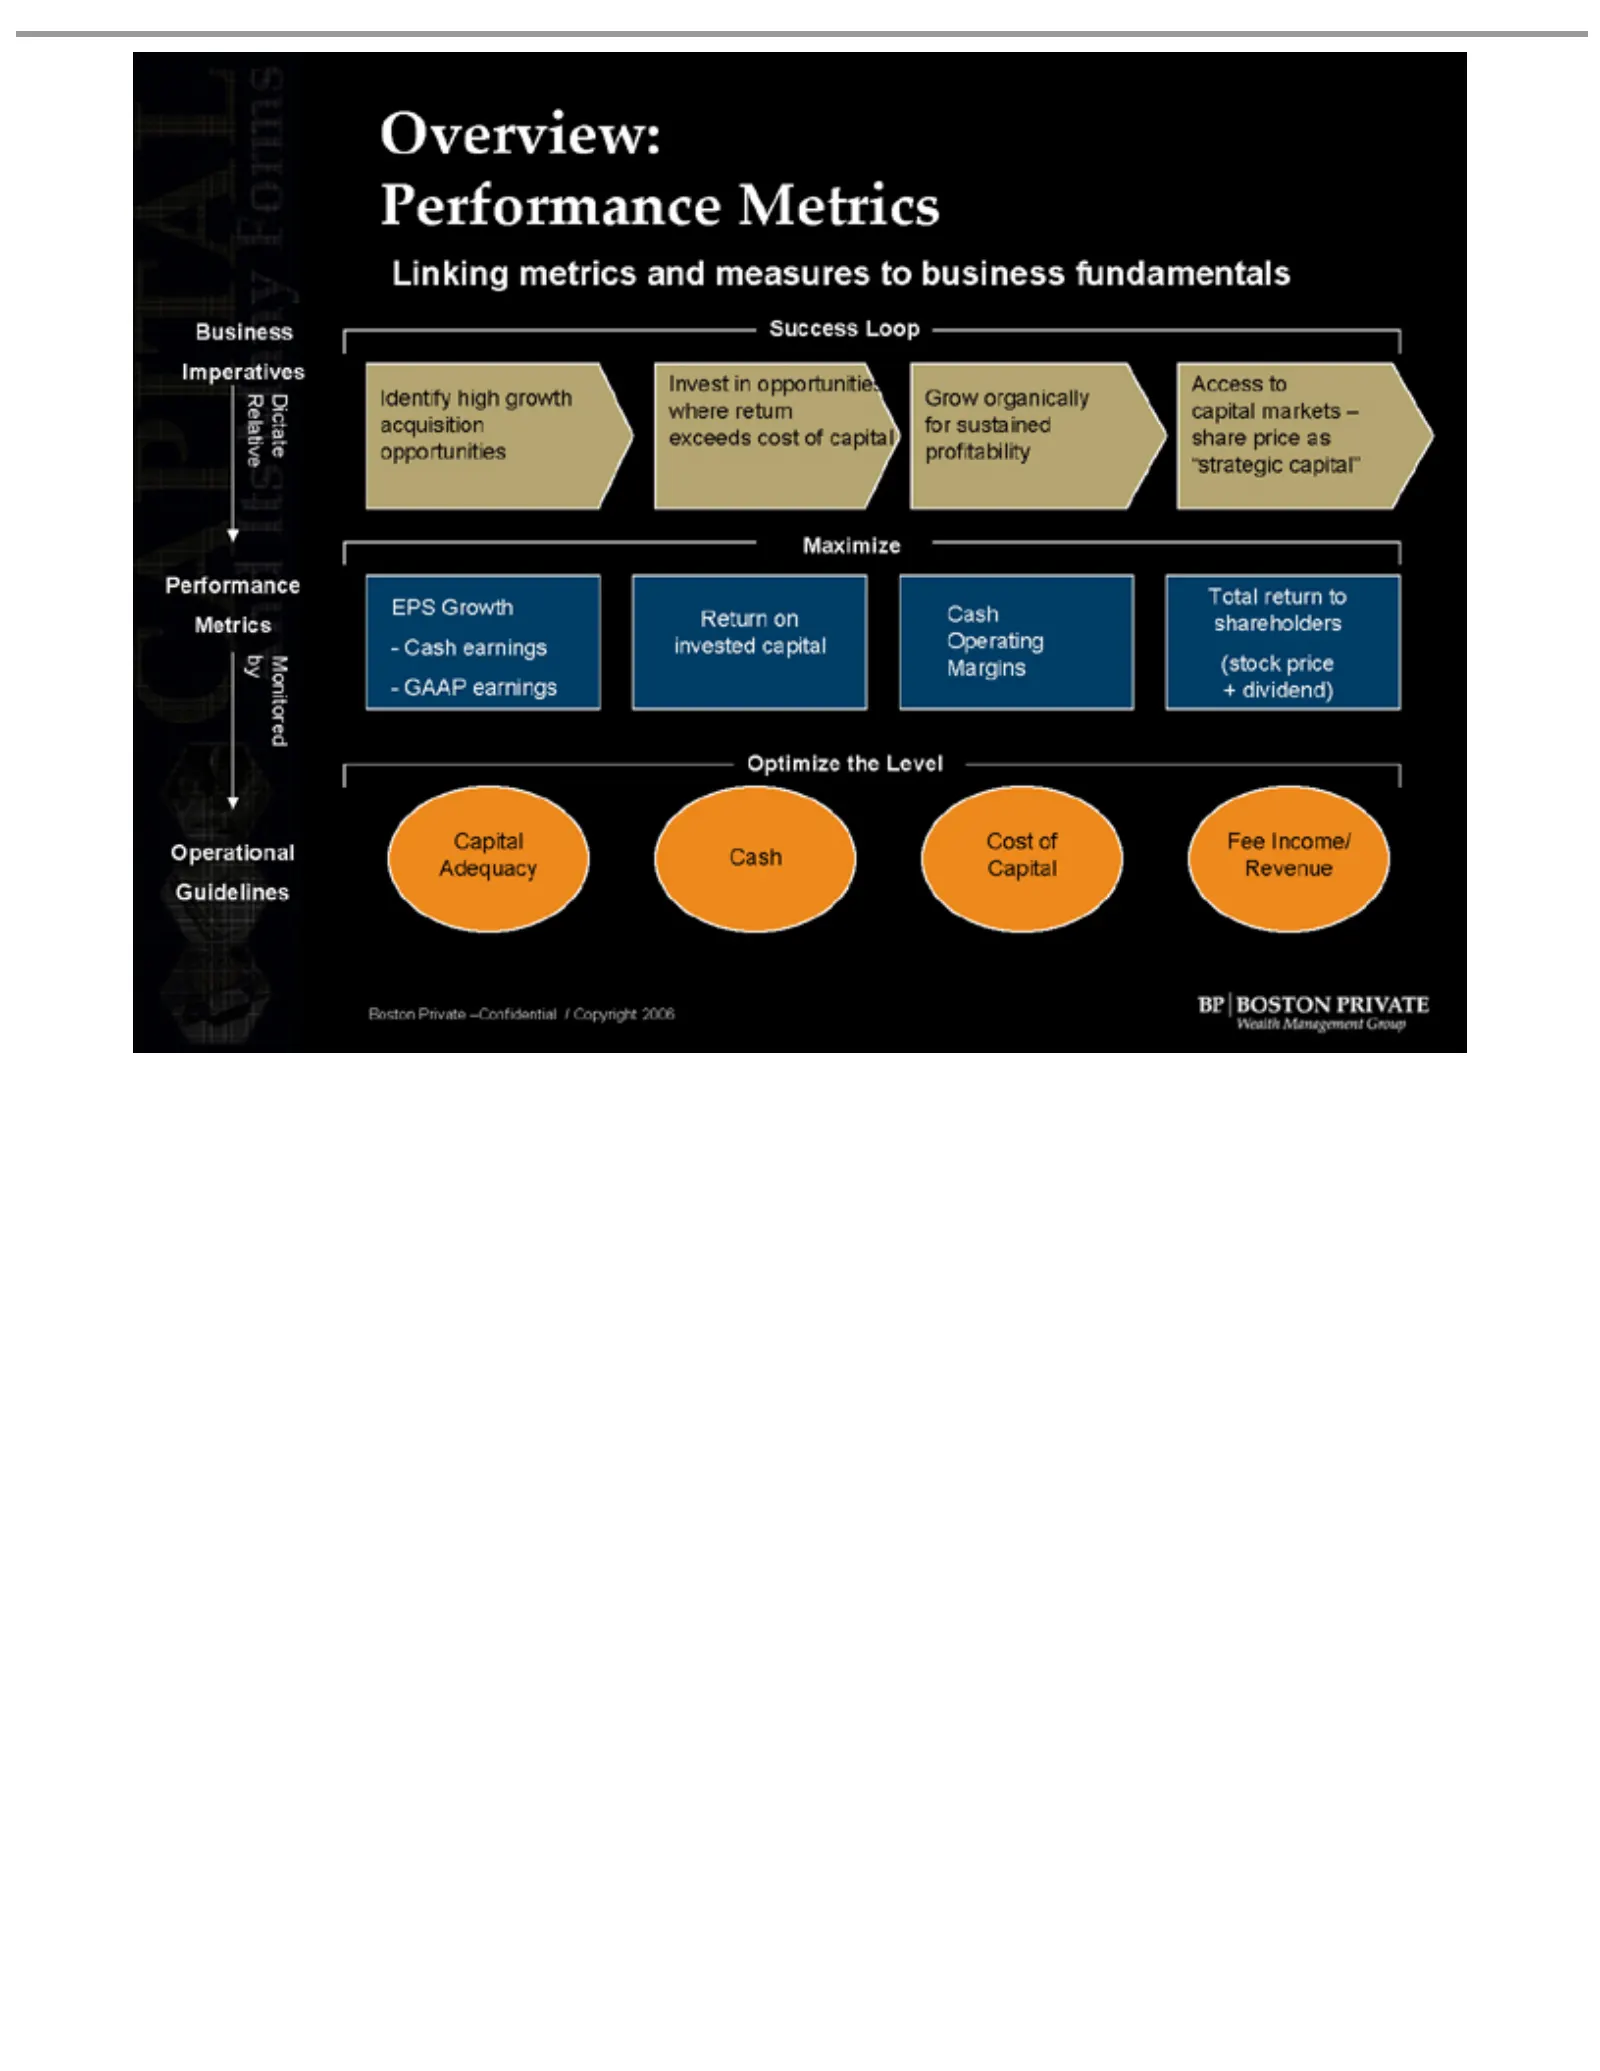
Slide 7: Overview: Linking Success Metrics to Business Imperatives
Overview: Linking Success Guidelines Operational by Monitored Metrics Performance Relative Dictate Imperatives Business Identify Invest opportunities acquisition where exceeds Grow for Access profitability capital share “strategic EPS -Maximize Return invested Total Margins Operating (stock sharehol
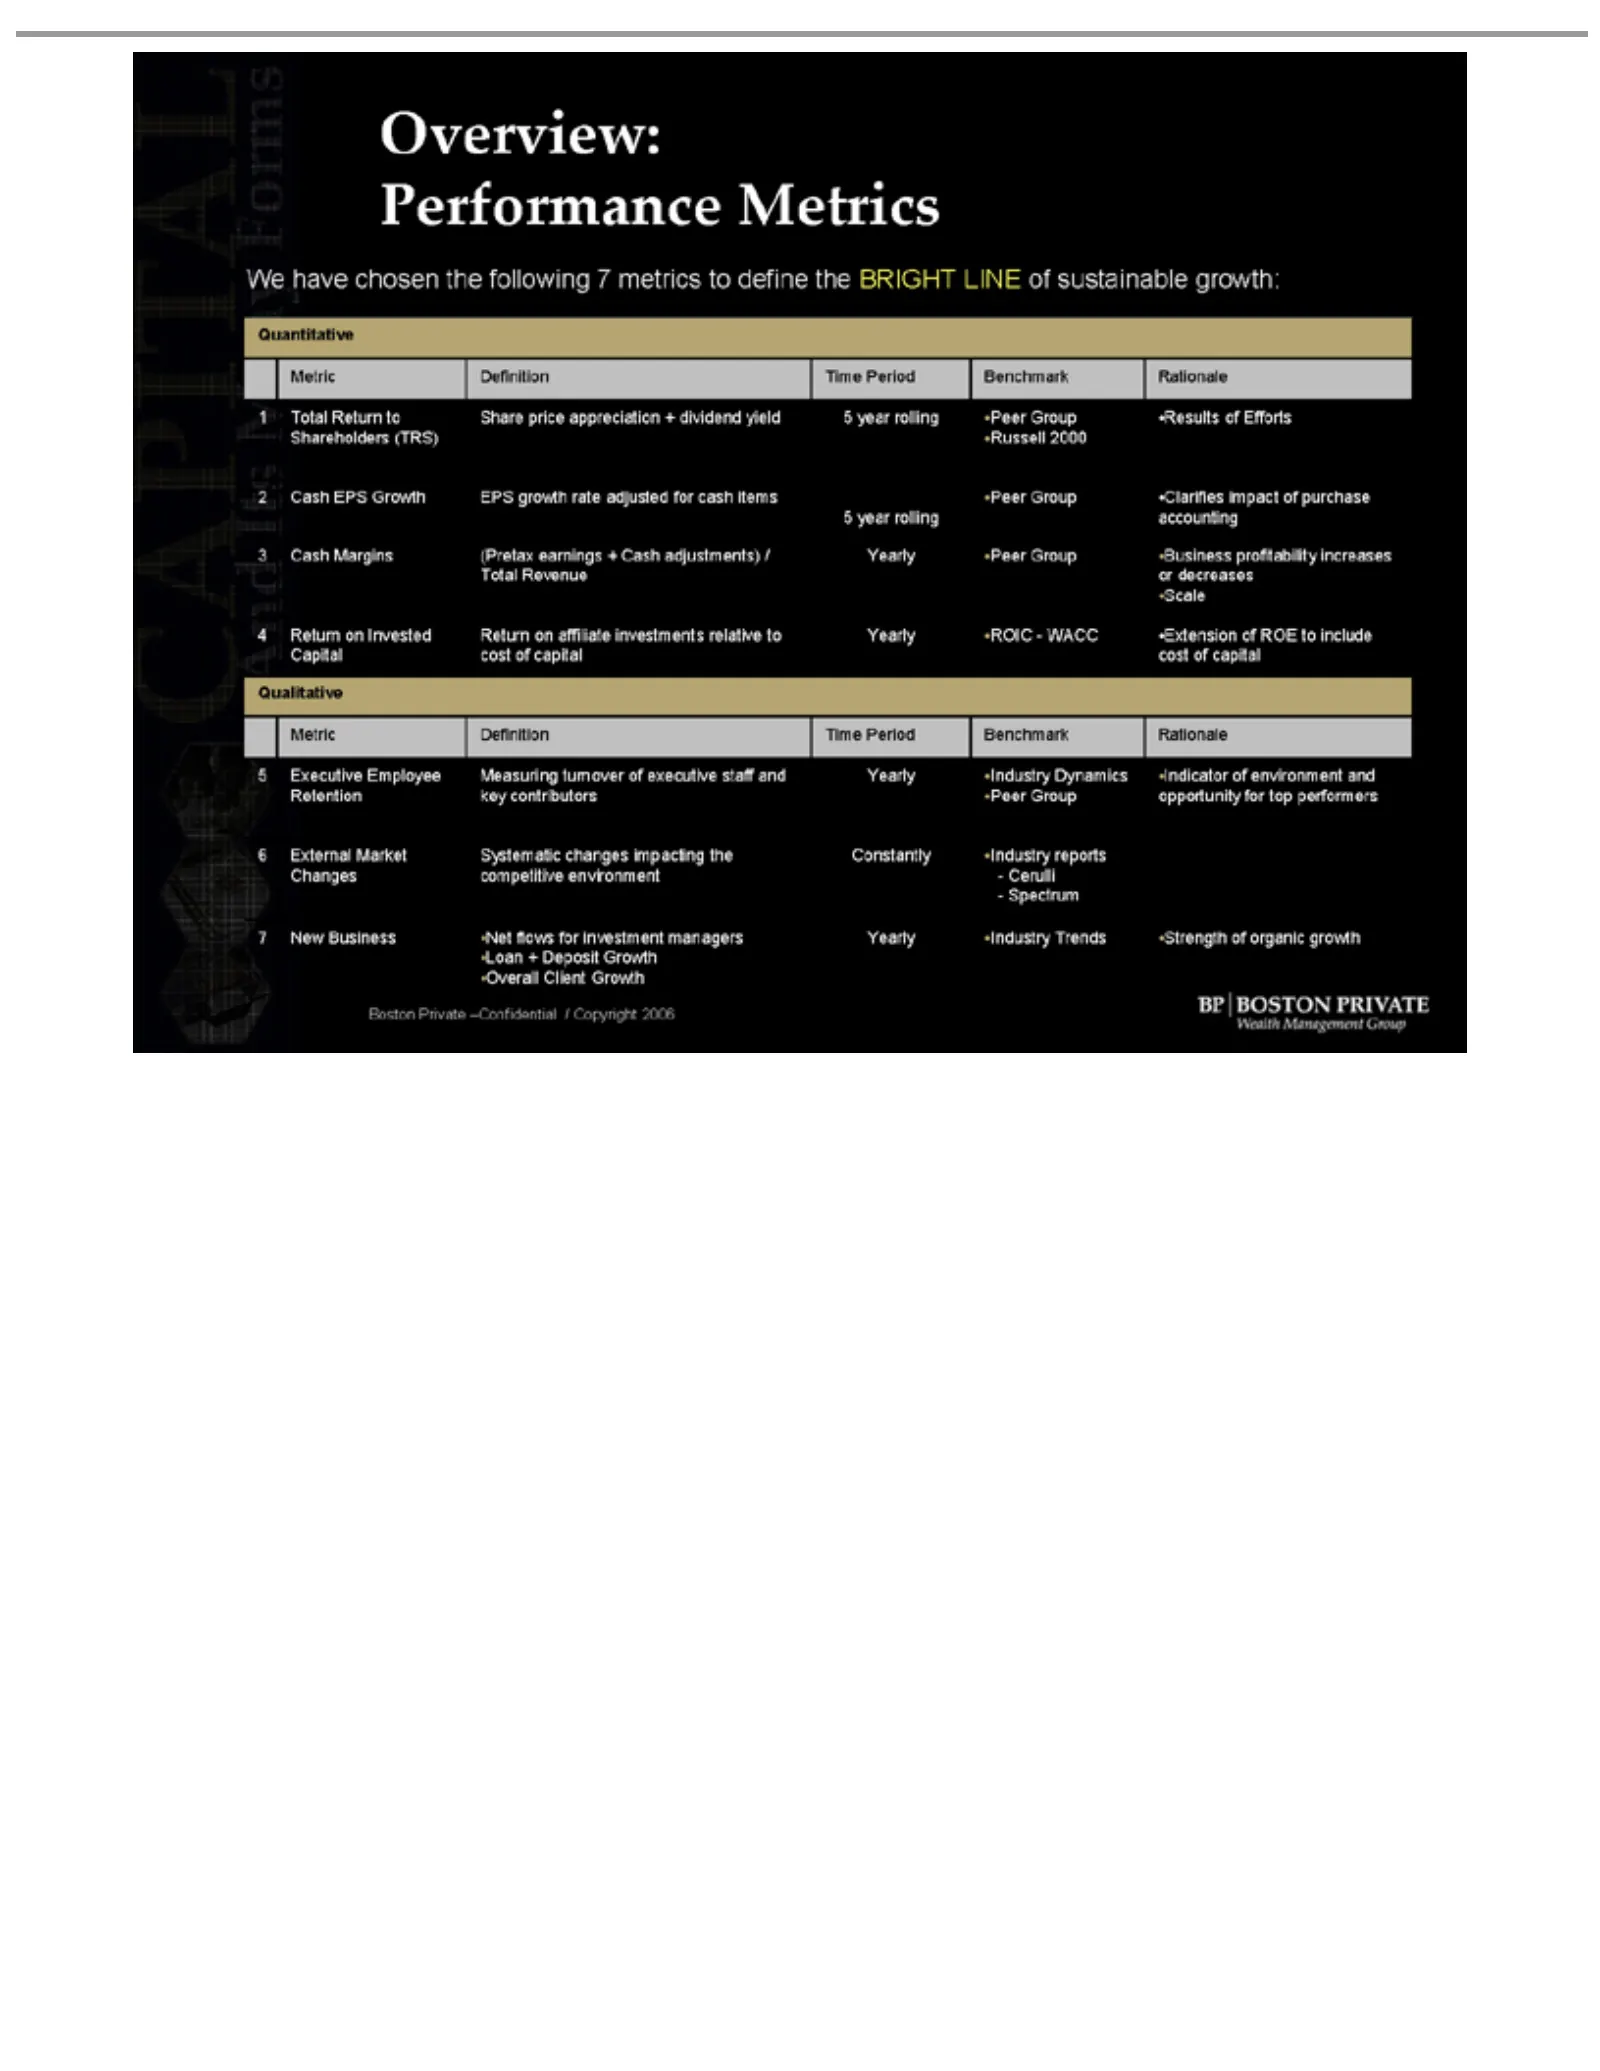
Slide 8: Performance Overview: Metrics Chosen to Define the Bright Line
Performance Overview: We Quantitative 2 haveTotal Metric 1 chosen Shareholders Metrics the Definition Return (TRS) EPS following Time Period toRussell Growth Share EPS 7growth metrics price 2000 to define Benchmark appreciation rate + the Rationale adjusted BRIGHT dividend for cashyield LINE 5 Peero
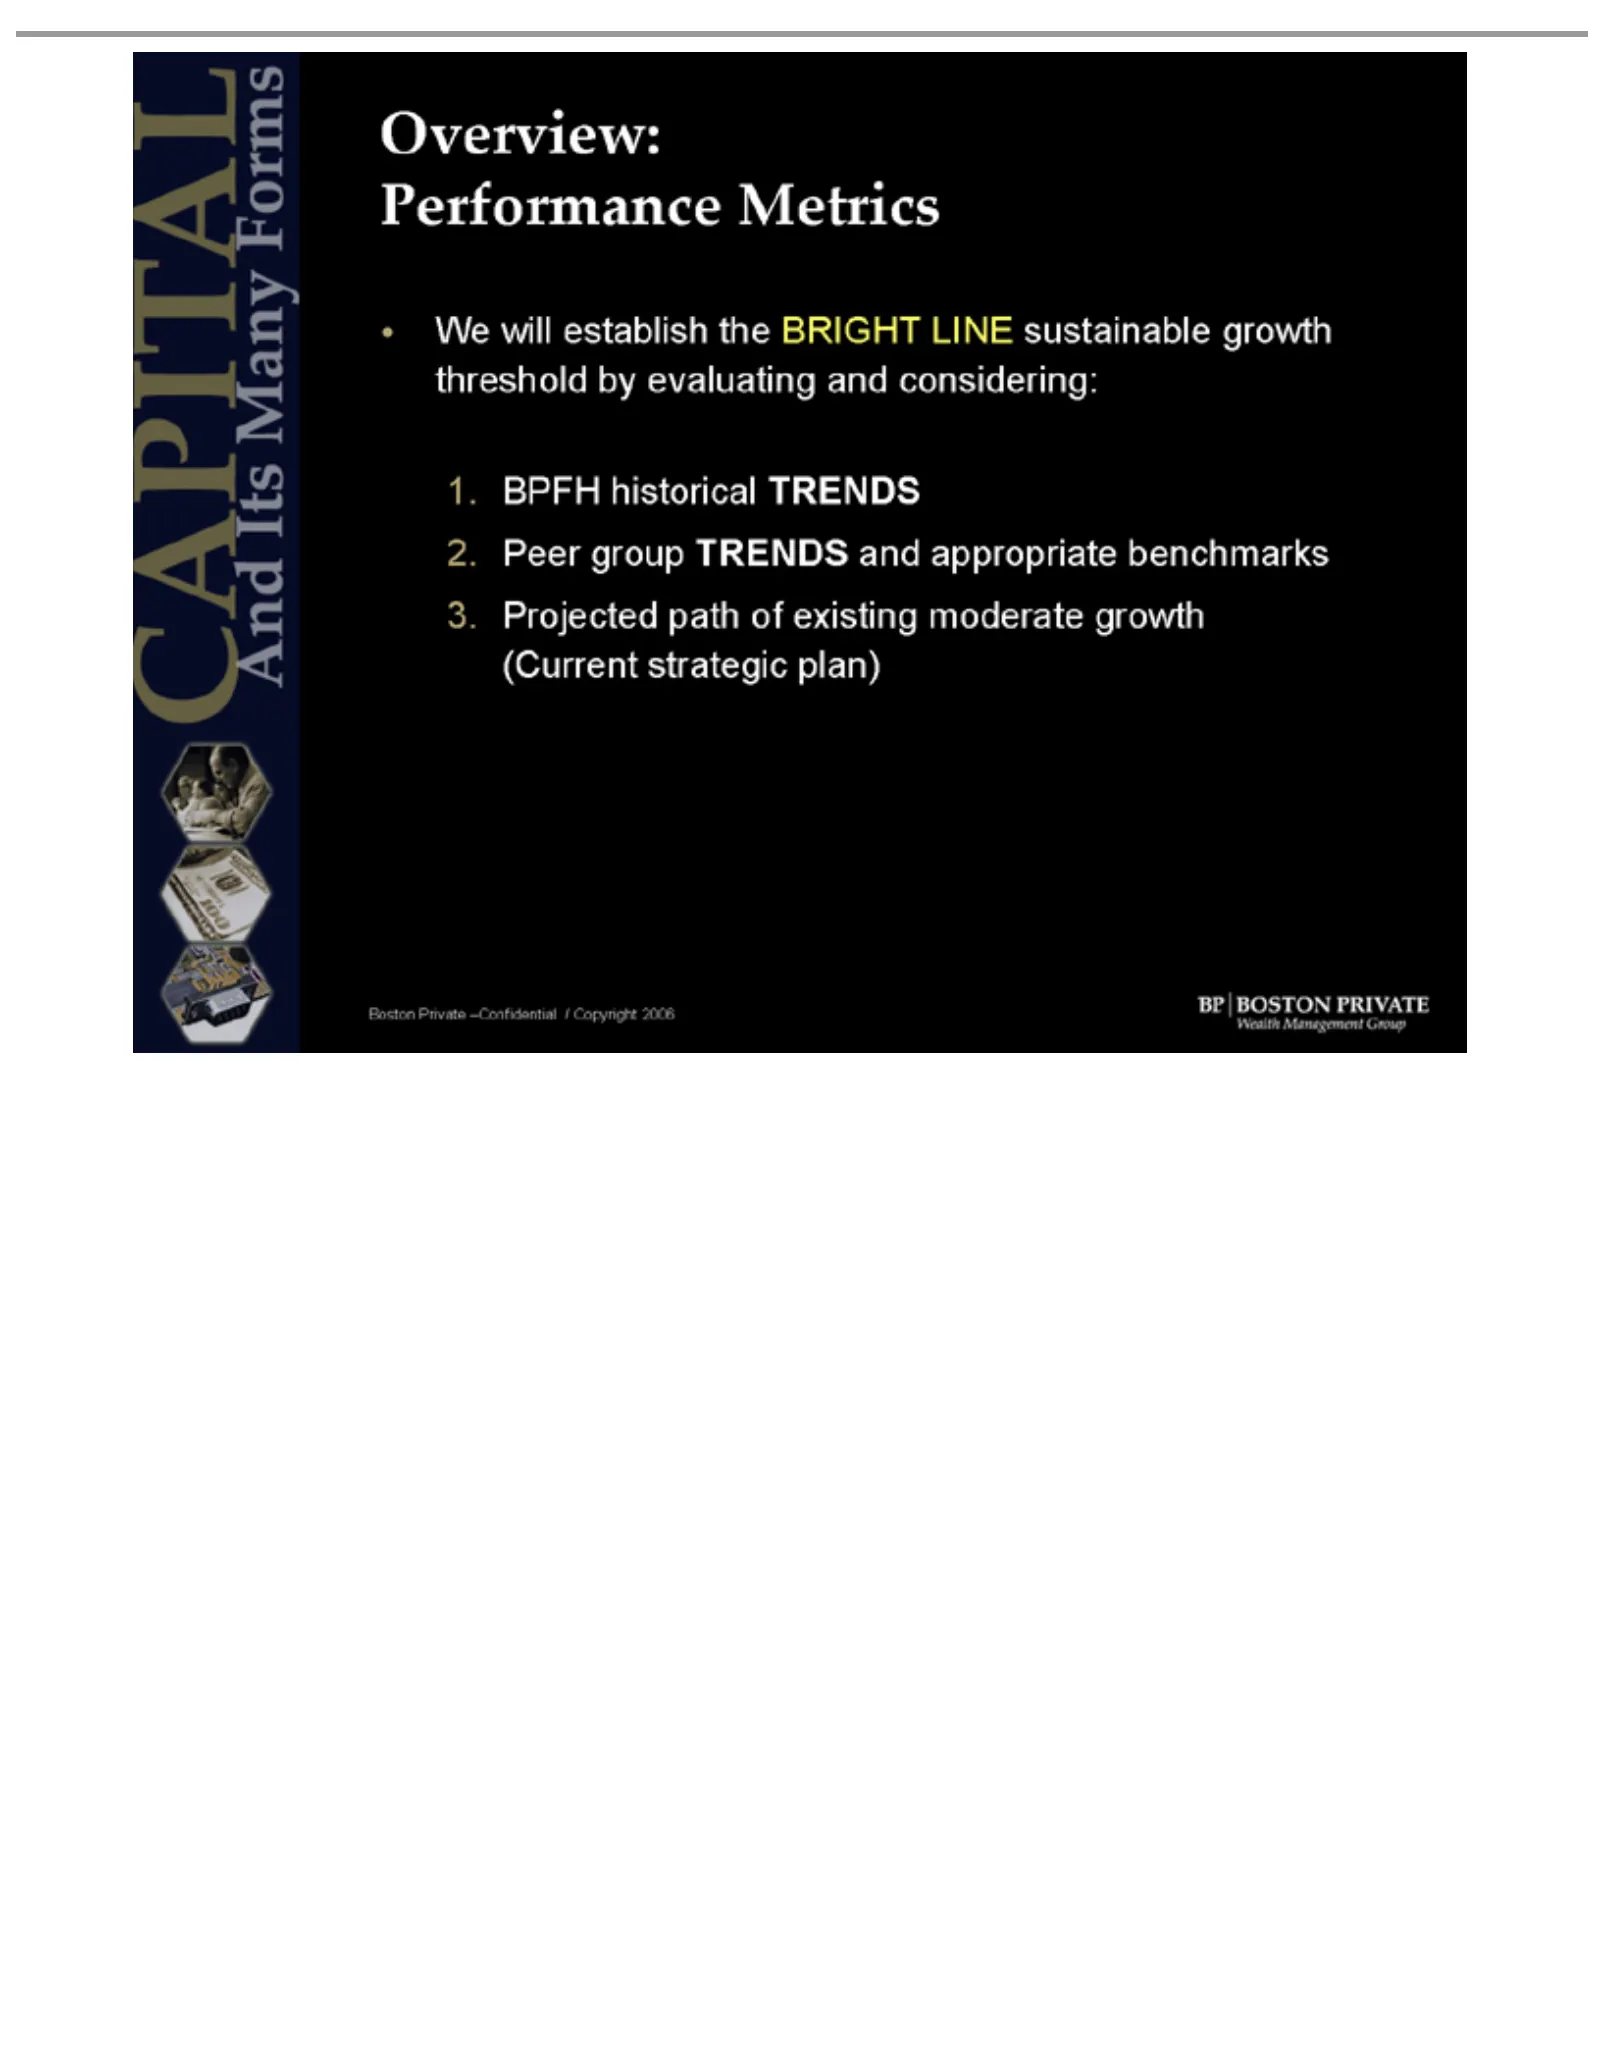
Slide 9: Performance Overview: Establishing Thresholds
Performance Overview: We threshold 1. 2. 3. (Current Boston BPFH Peer Projected willgroup Private establish strategic historical by path evaluating Metrics TRENDS –Confidential of the plan) TRENDS existing BRIGHT and considering: appropriate moderate / Copyright LINE sustainable growth benchmarks 20
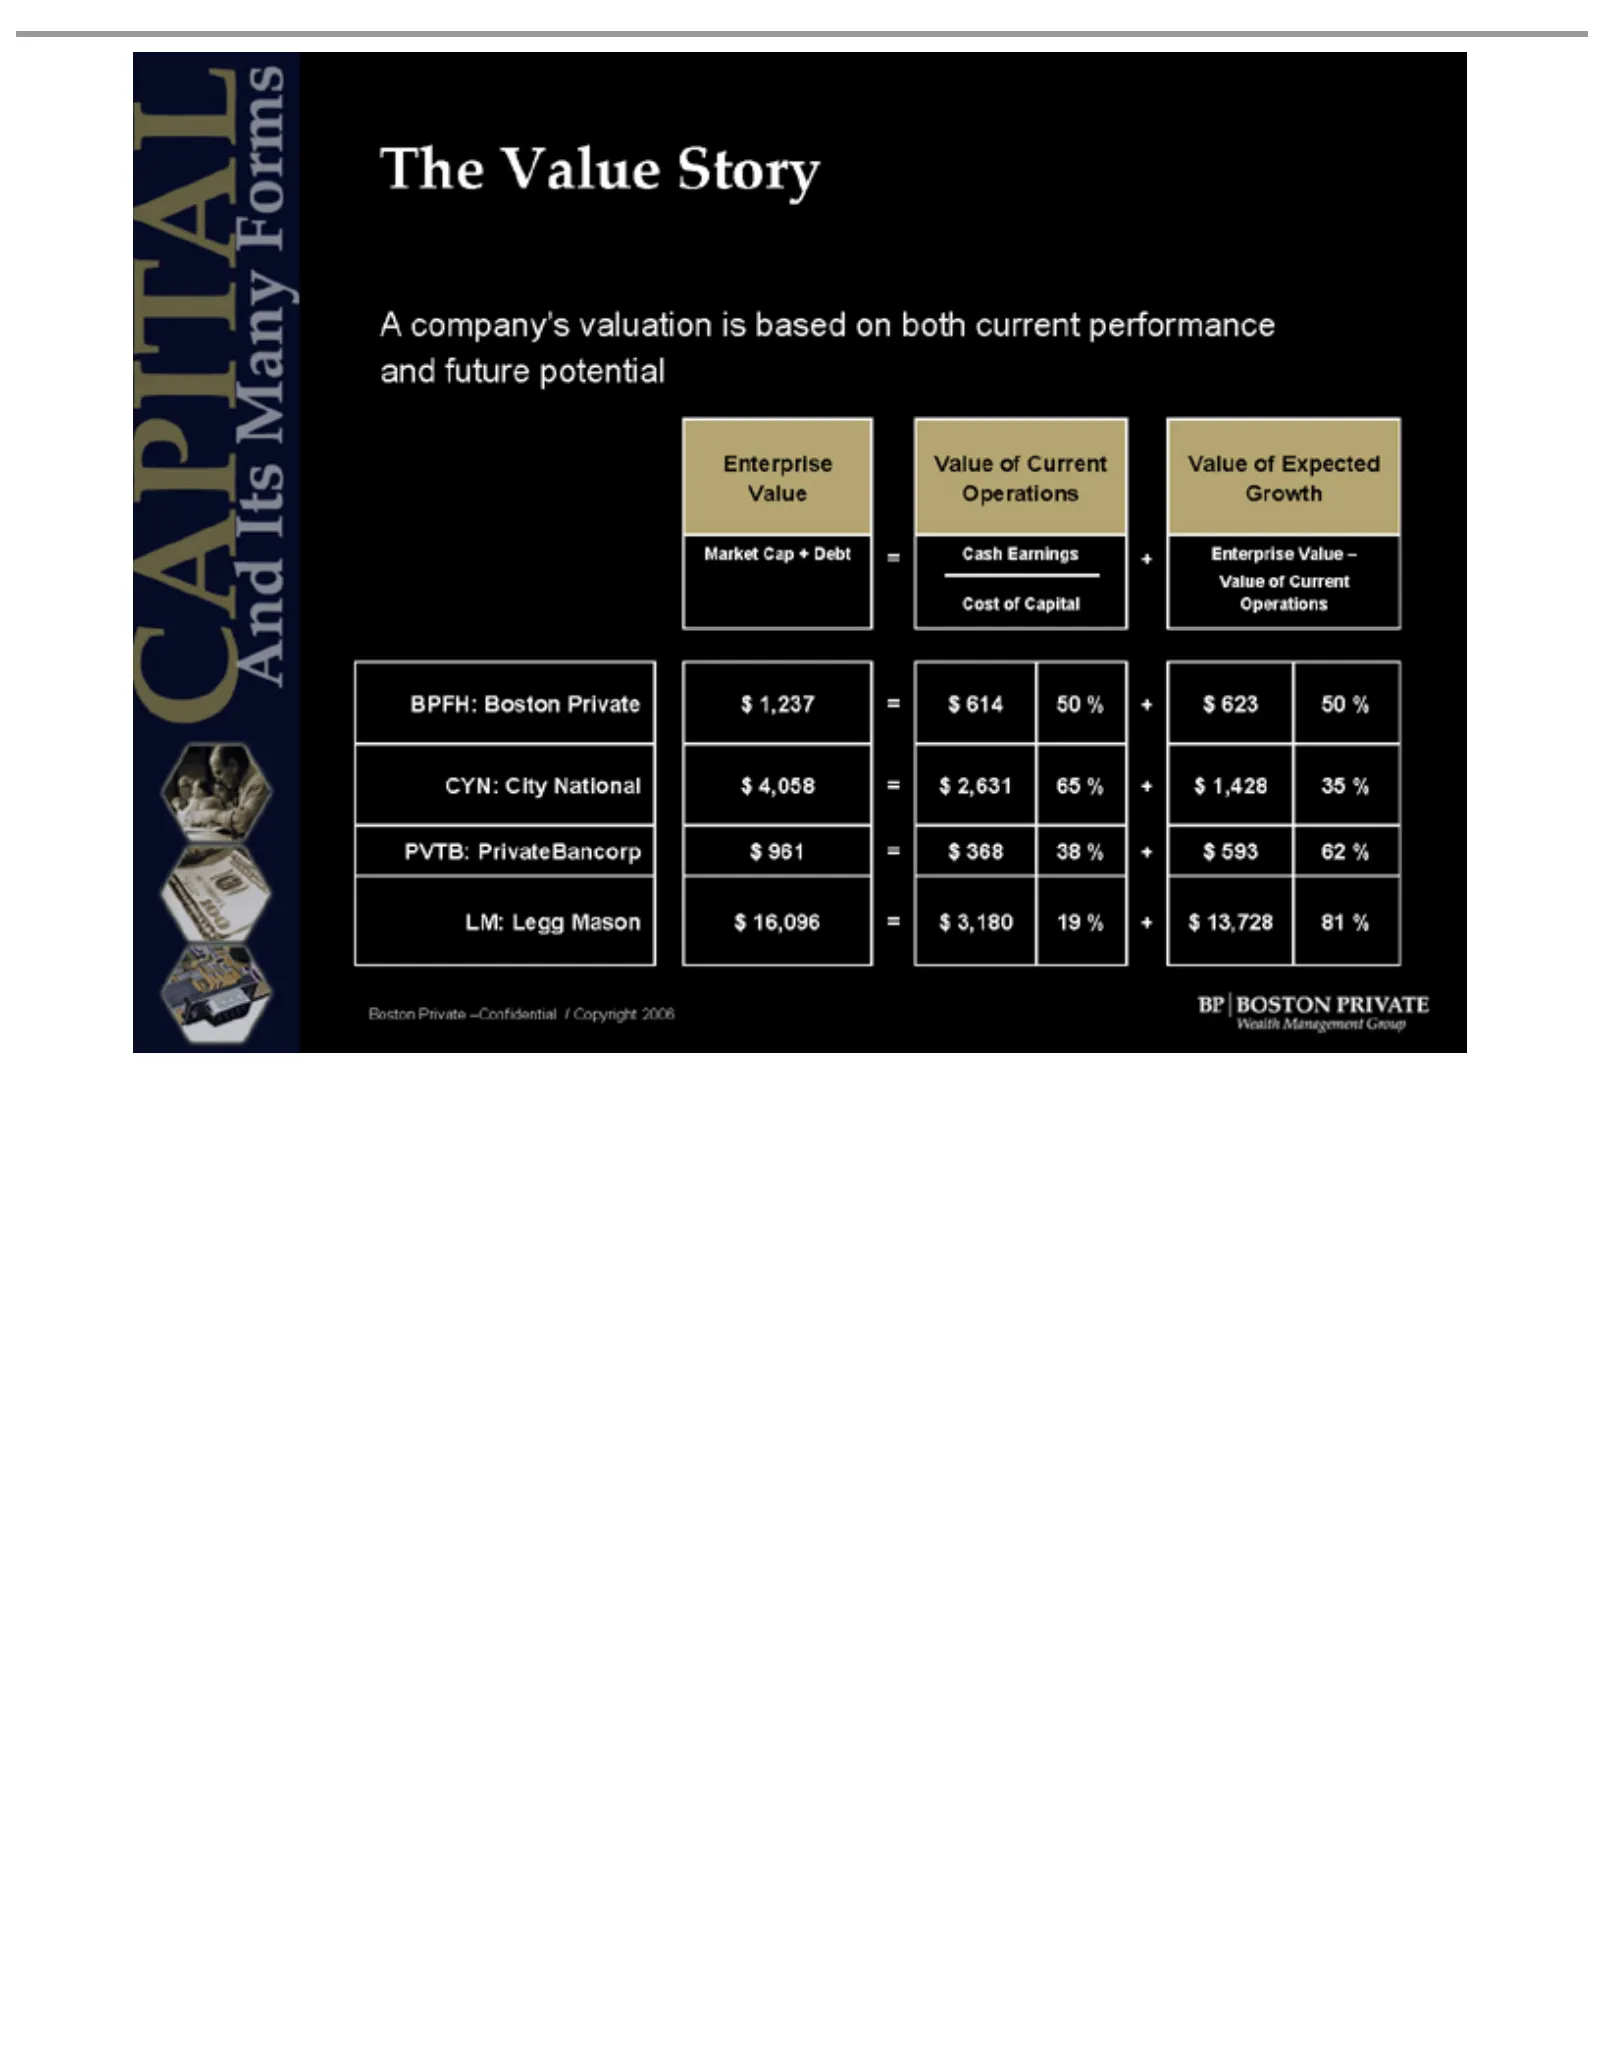
Slide 10: The Value of Boston Private: Current and Future Operations
The A and Enterprise company’s future Value Value Market Cost Value BPFH: Story potential Value valuation Operations Cap ofGrowth + Debt ofPrivate of Current Capital Boston Current is $$based = Cash Operations Private Valueon2,631 Earnings 1,237 $both of Expected current +38 +$performance Enterprise
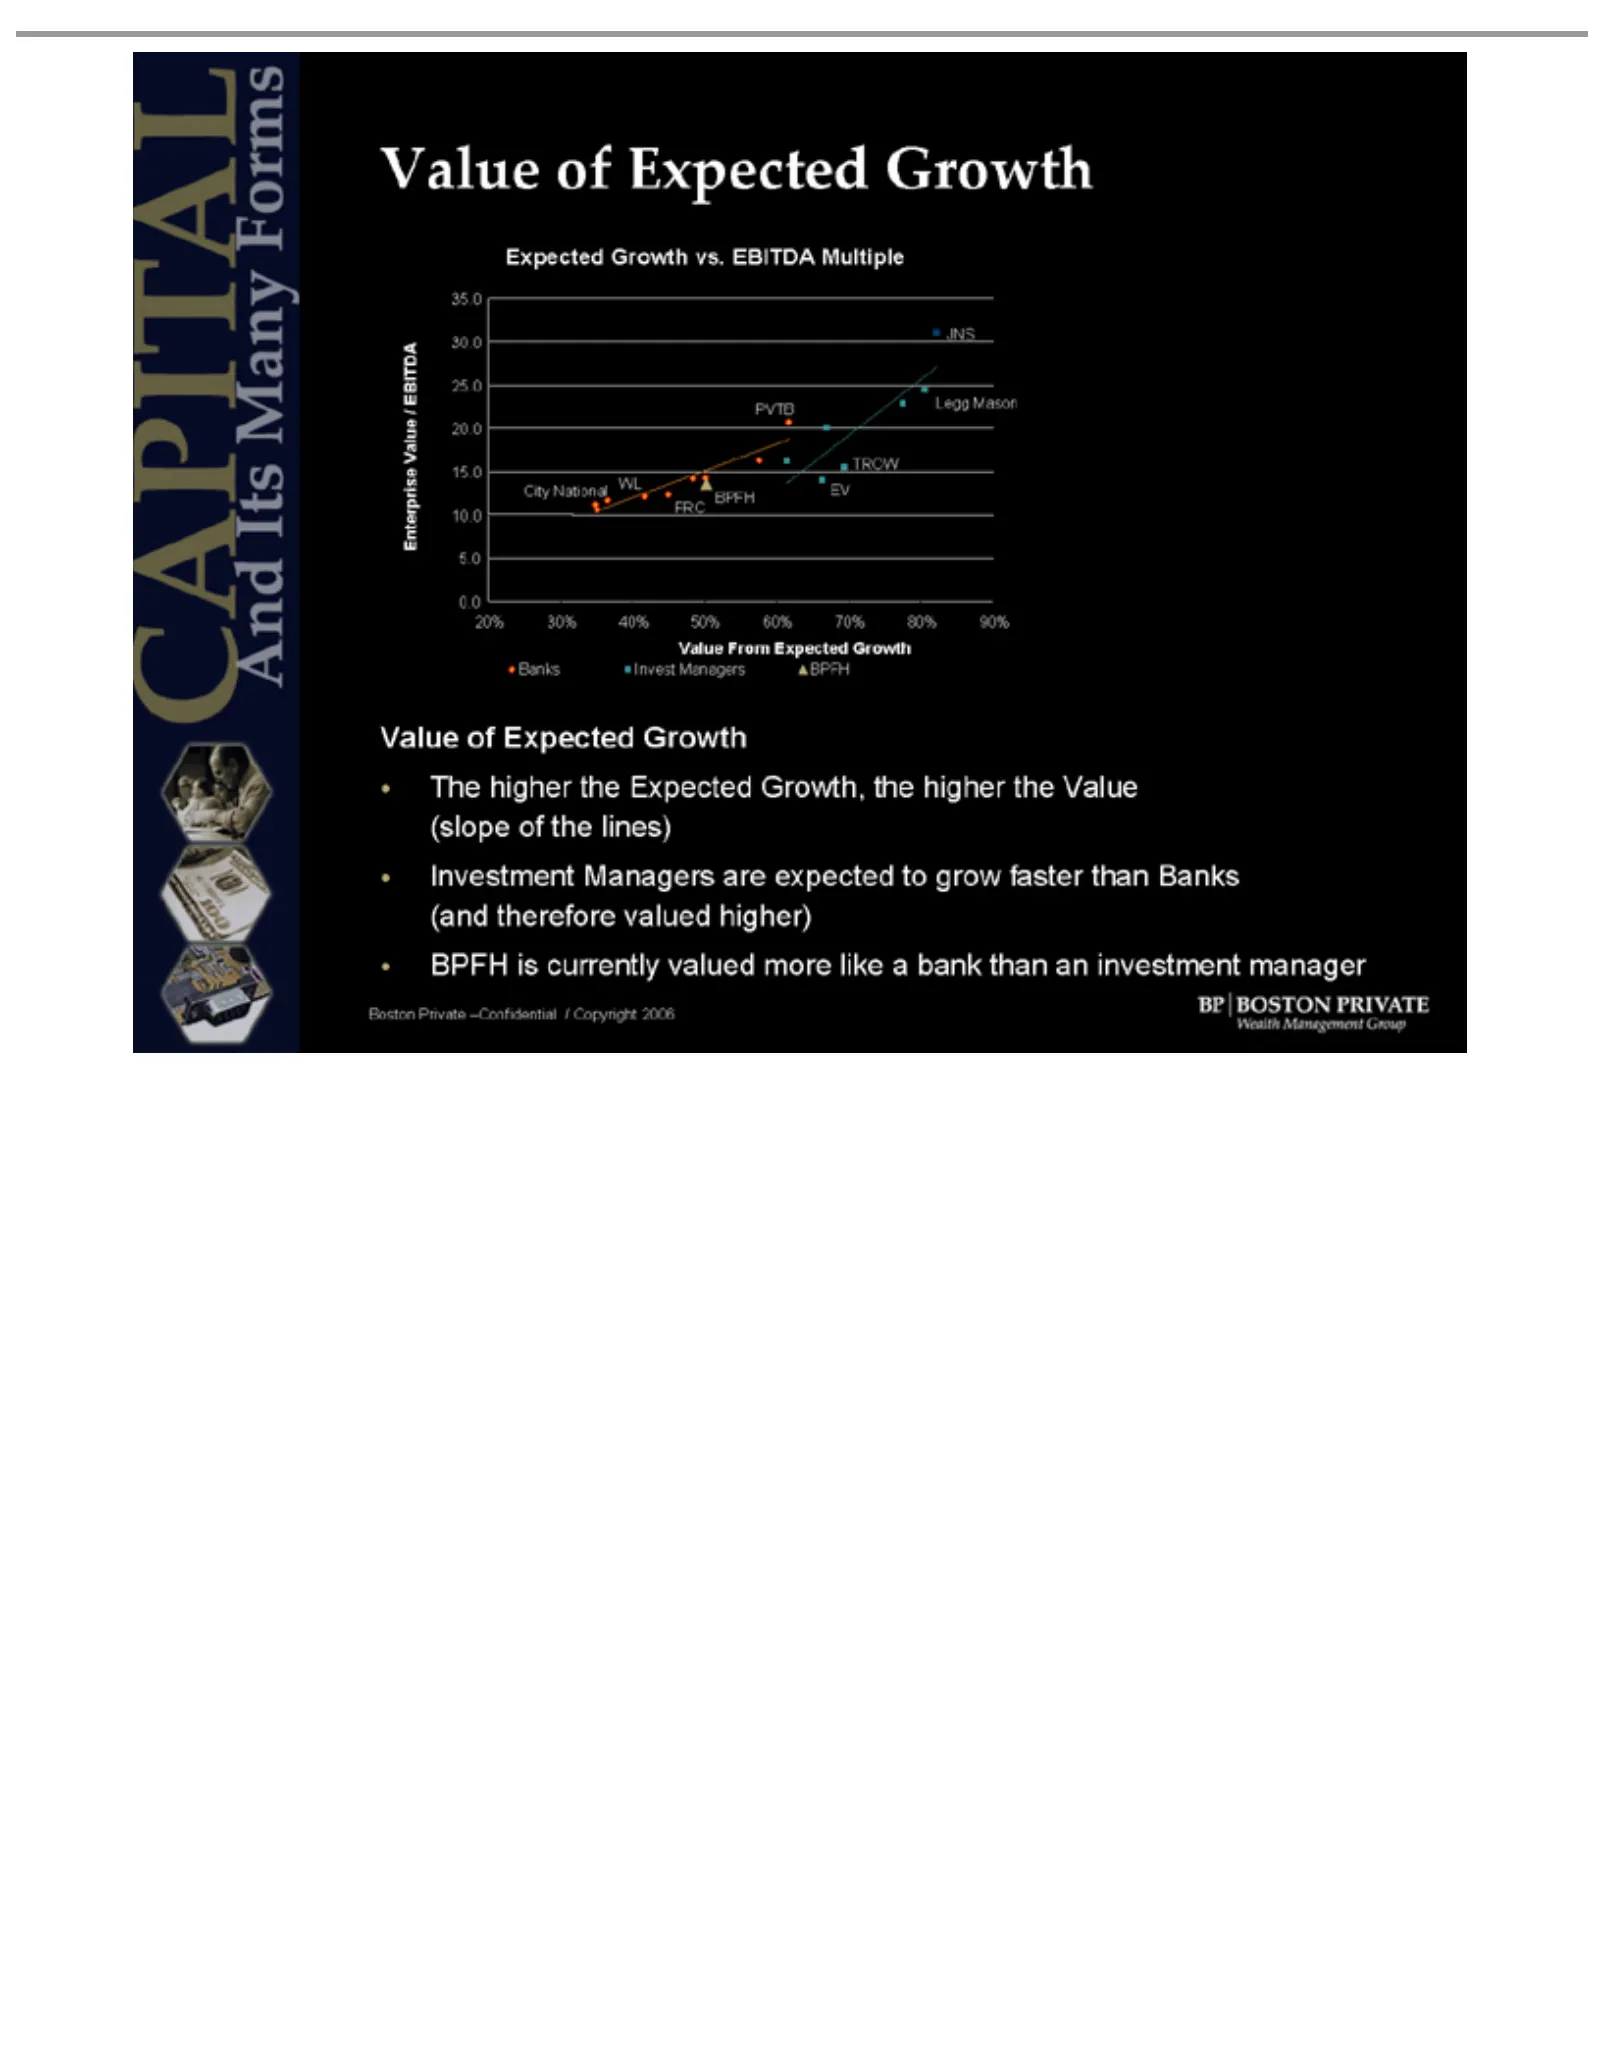
Slide 11: Expected Enterprise Value Growth vs. EV/EBITDA
Expected Enterprise 20% 0.0 5.0 10.0 15.0 20.0 25.0 30.0 35.0 City WL Legg JNS FRC PVTB EV TROW Banks Value The (slope Investment (and BPFH Boston higher National therefore 30% Mason From of of Invest isPrivate Expected currently the Growth 40% Value the Managers Expected lines) Managers valued Expe
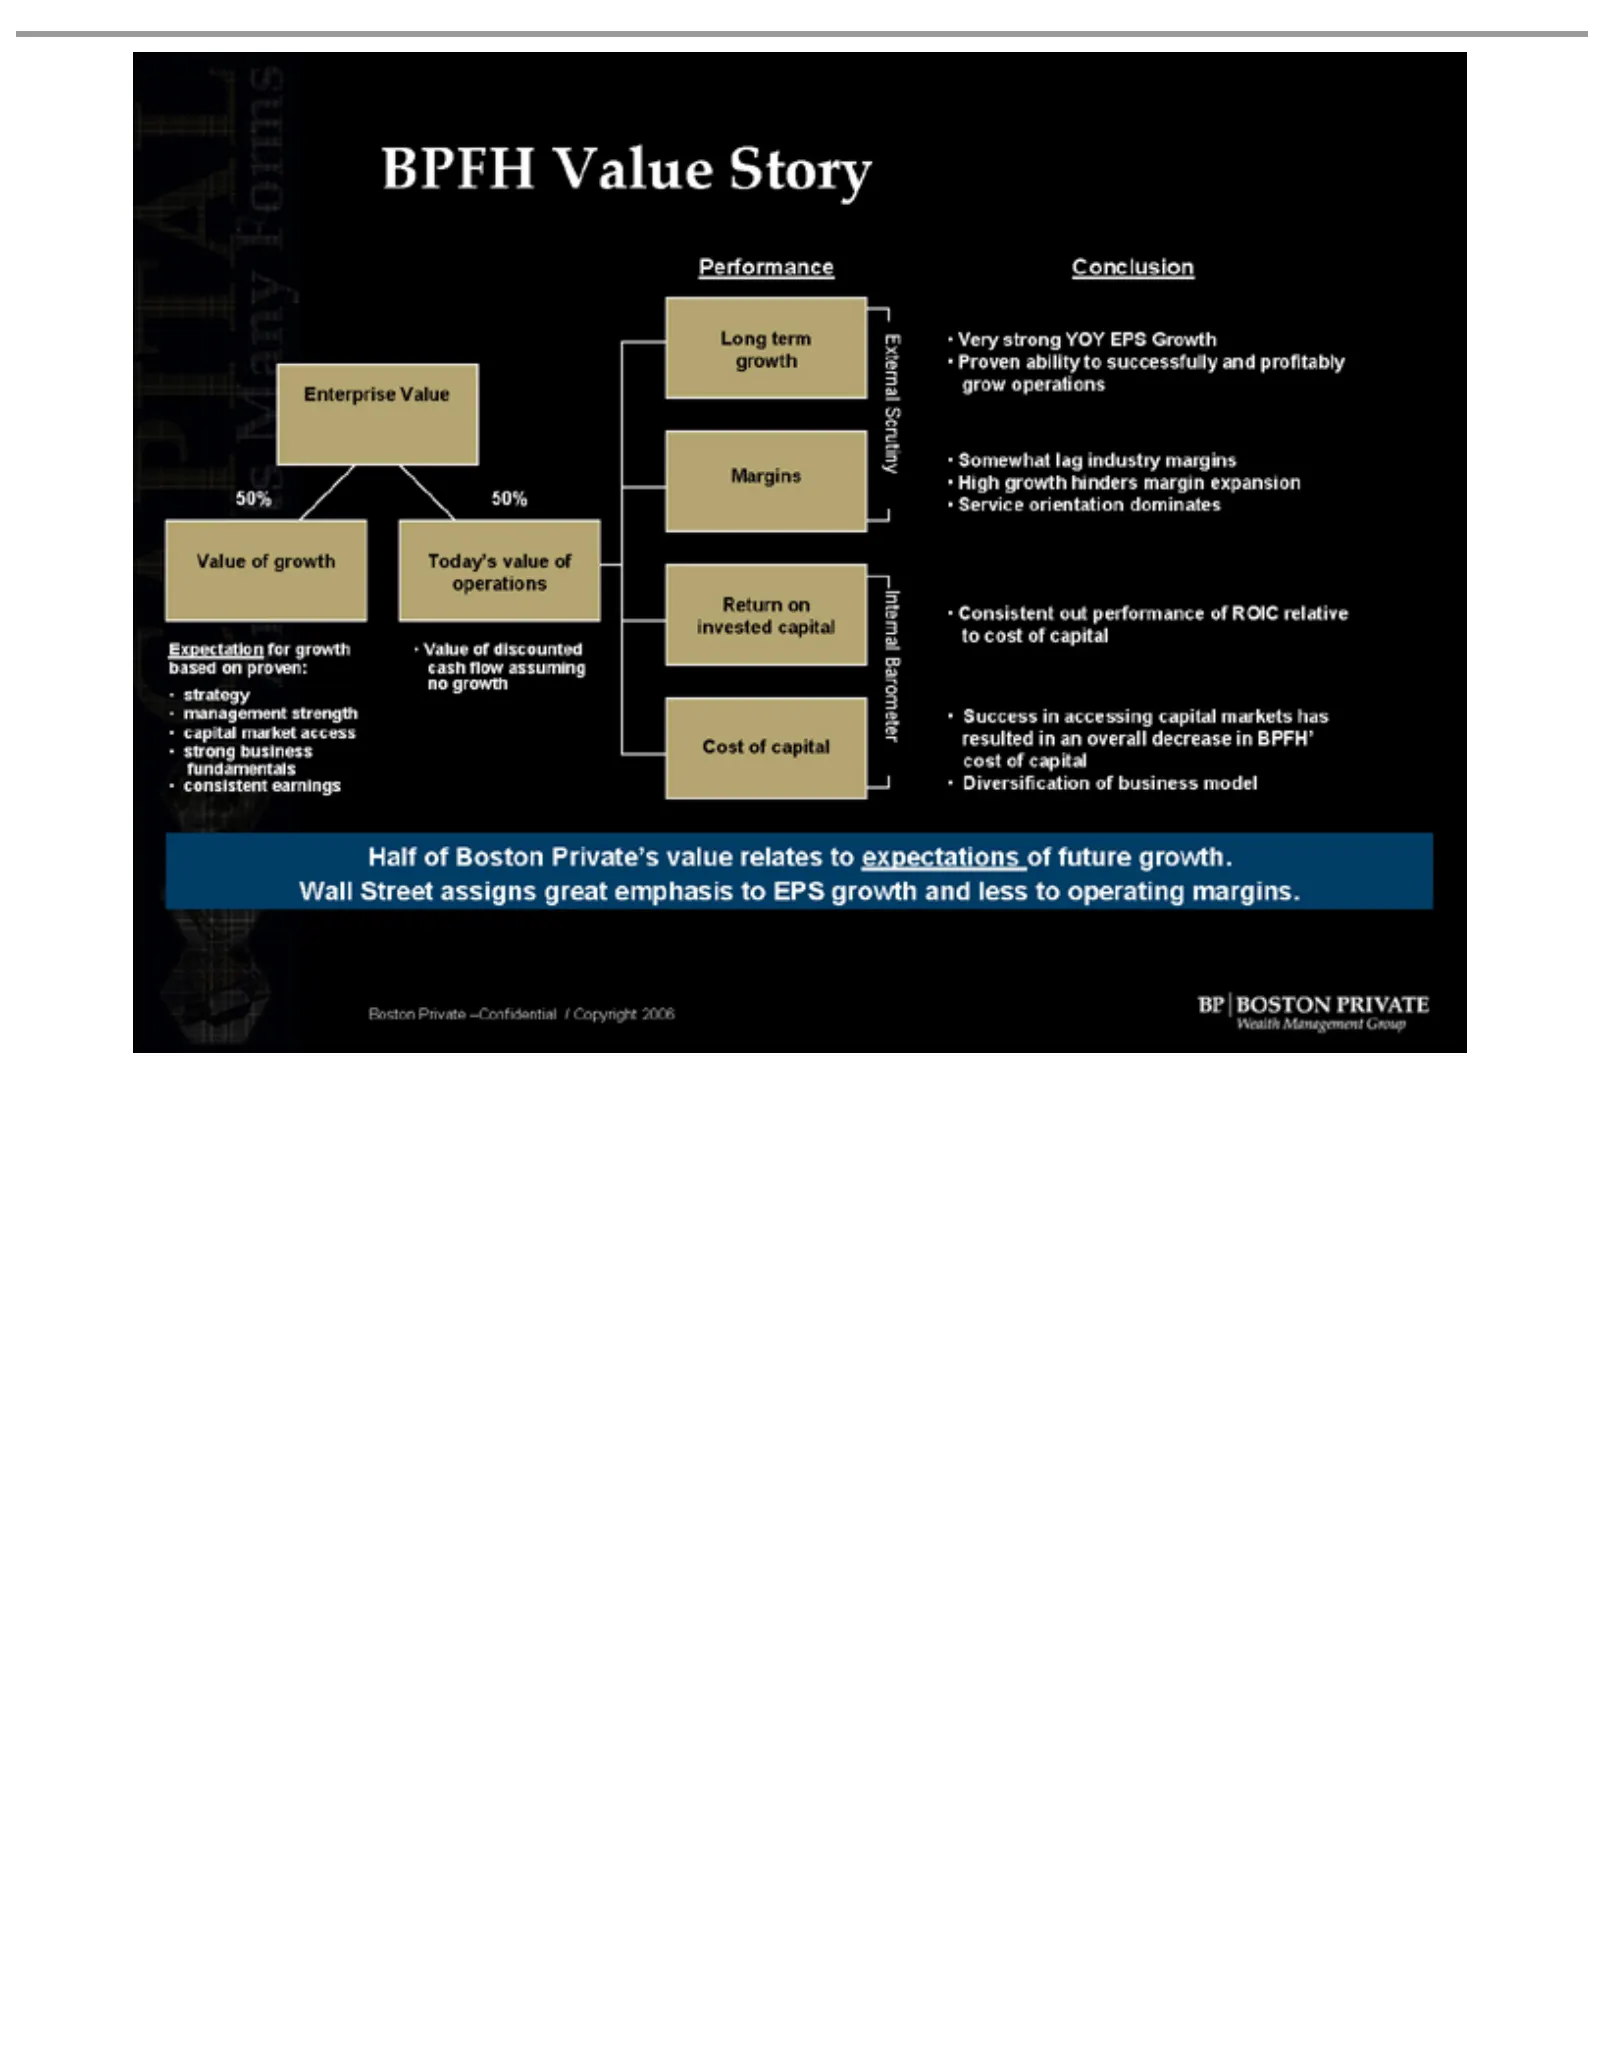
Slide 12: BPFH Enterprise Value Expectation
BPFH Enterprise 50% Expectation based management strategy capital strong consistent fundamentals Today’s Value operations cash no Long Performance Return Margins growth invested Cost External Internal Very Conclusion Proven grow Somewhat High Service Consistent to Success resulted cost Diversificati
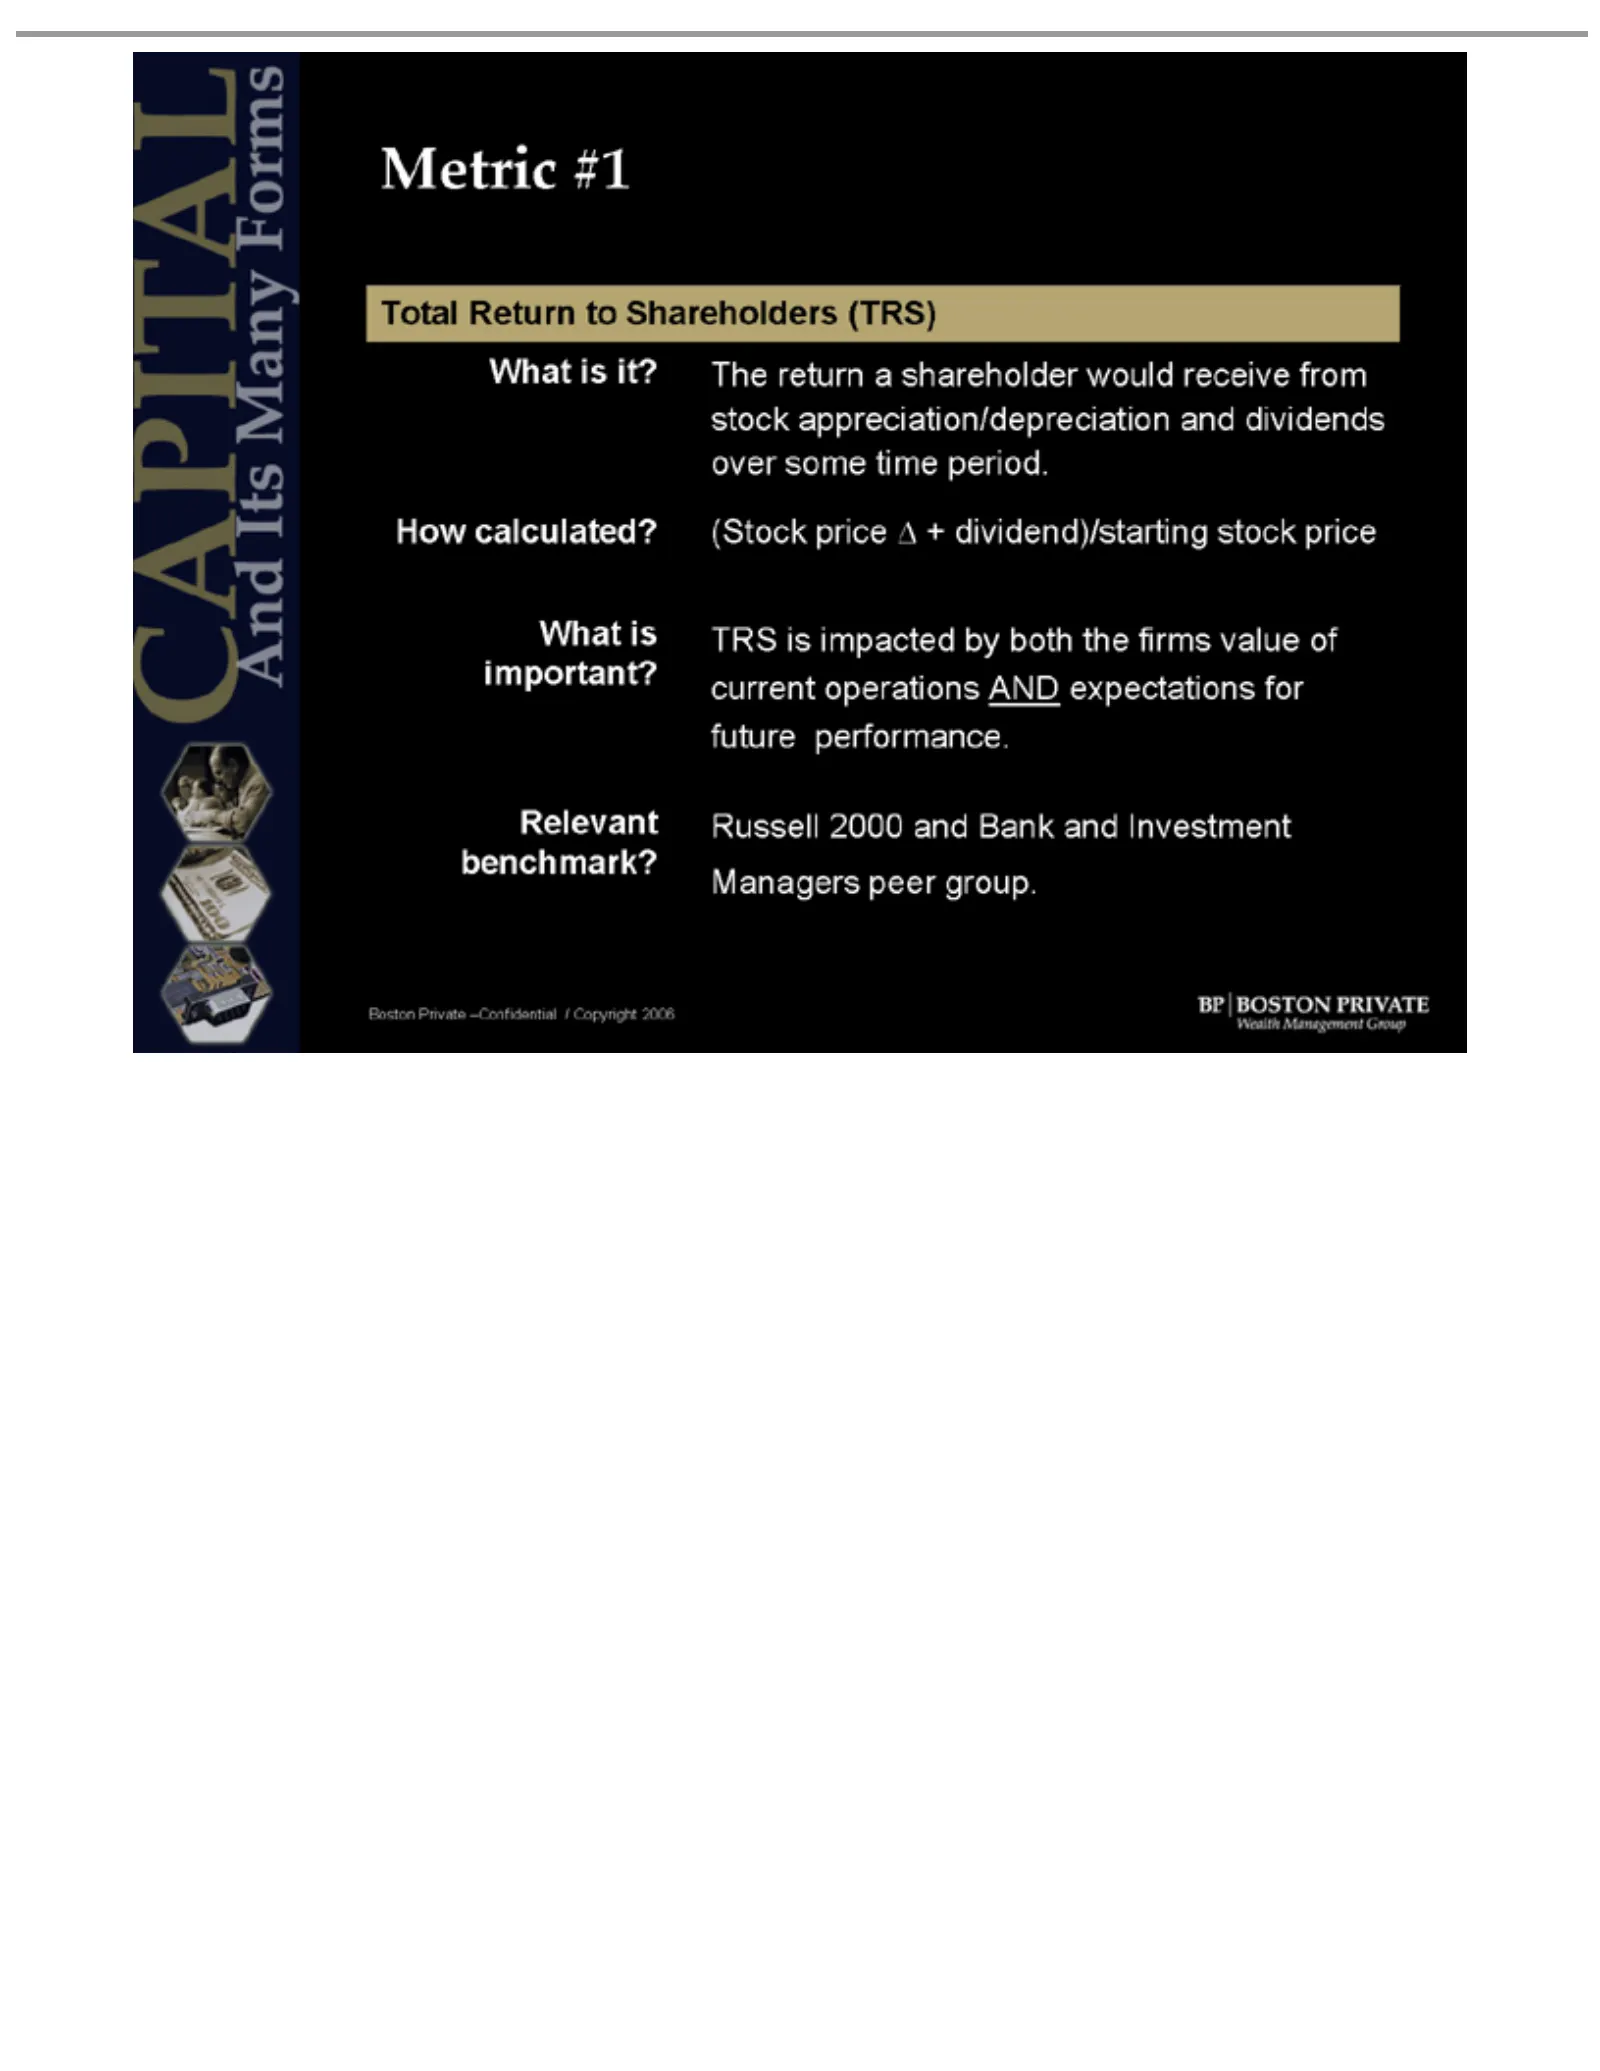
Slide 13: Metric #1: Total Shareholder Return
Metric Total stock over How Return #1 futuresome What it? to TheShareholders return aand appreciation/depreciation calculated? is time TRS period. is (Stock impacted shareholder (TRS) price by and + and would receive dividend)/starting dividends from price ofstock important? Relevant benchmark? Mana
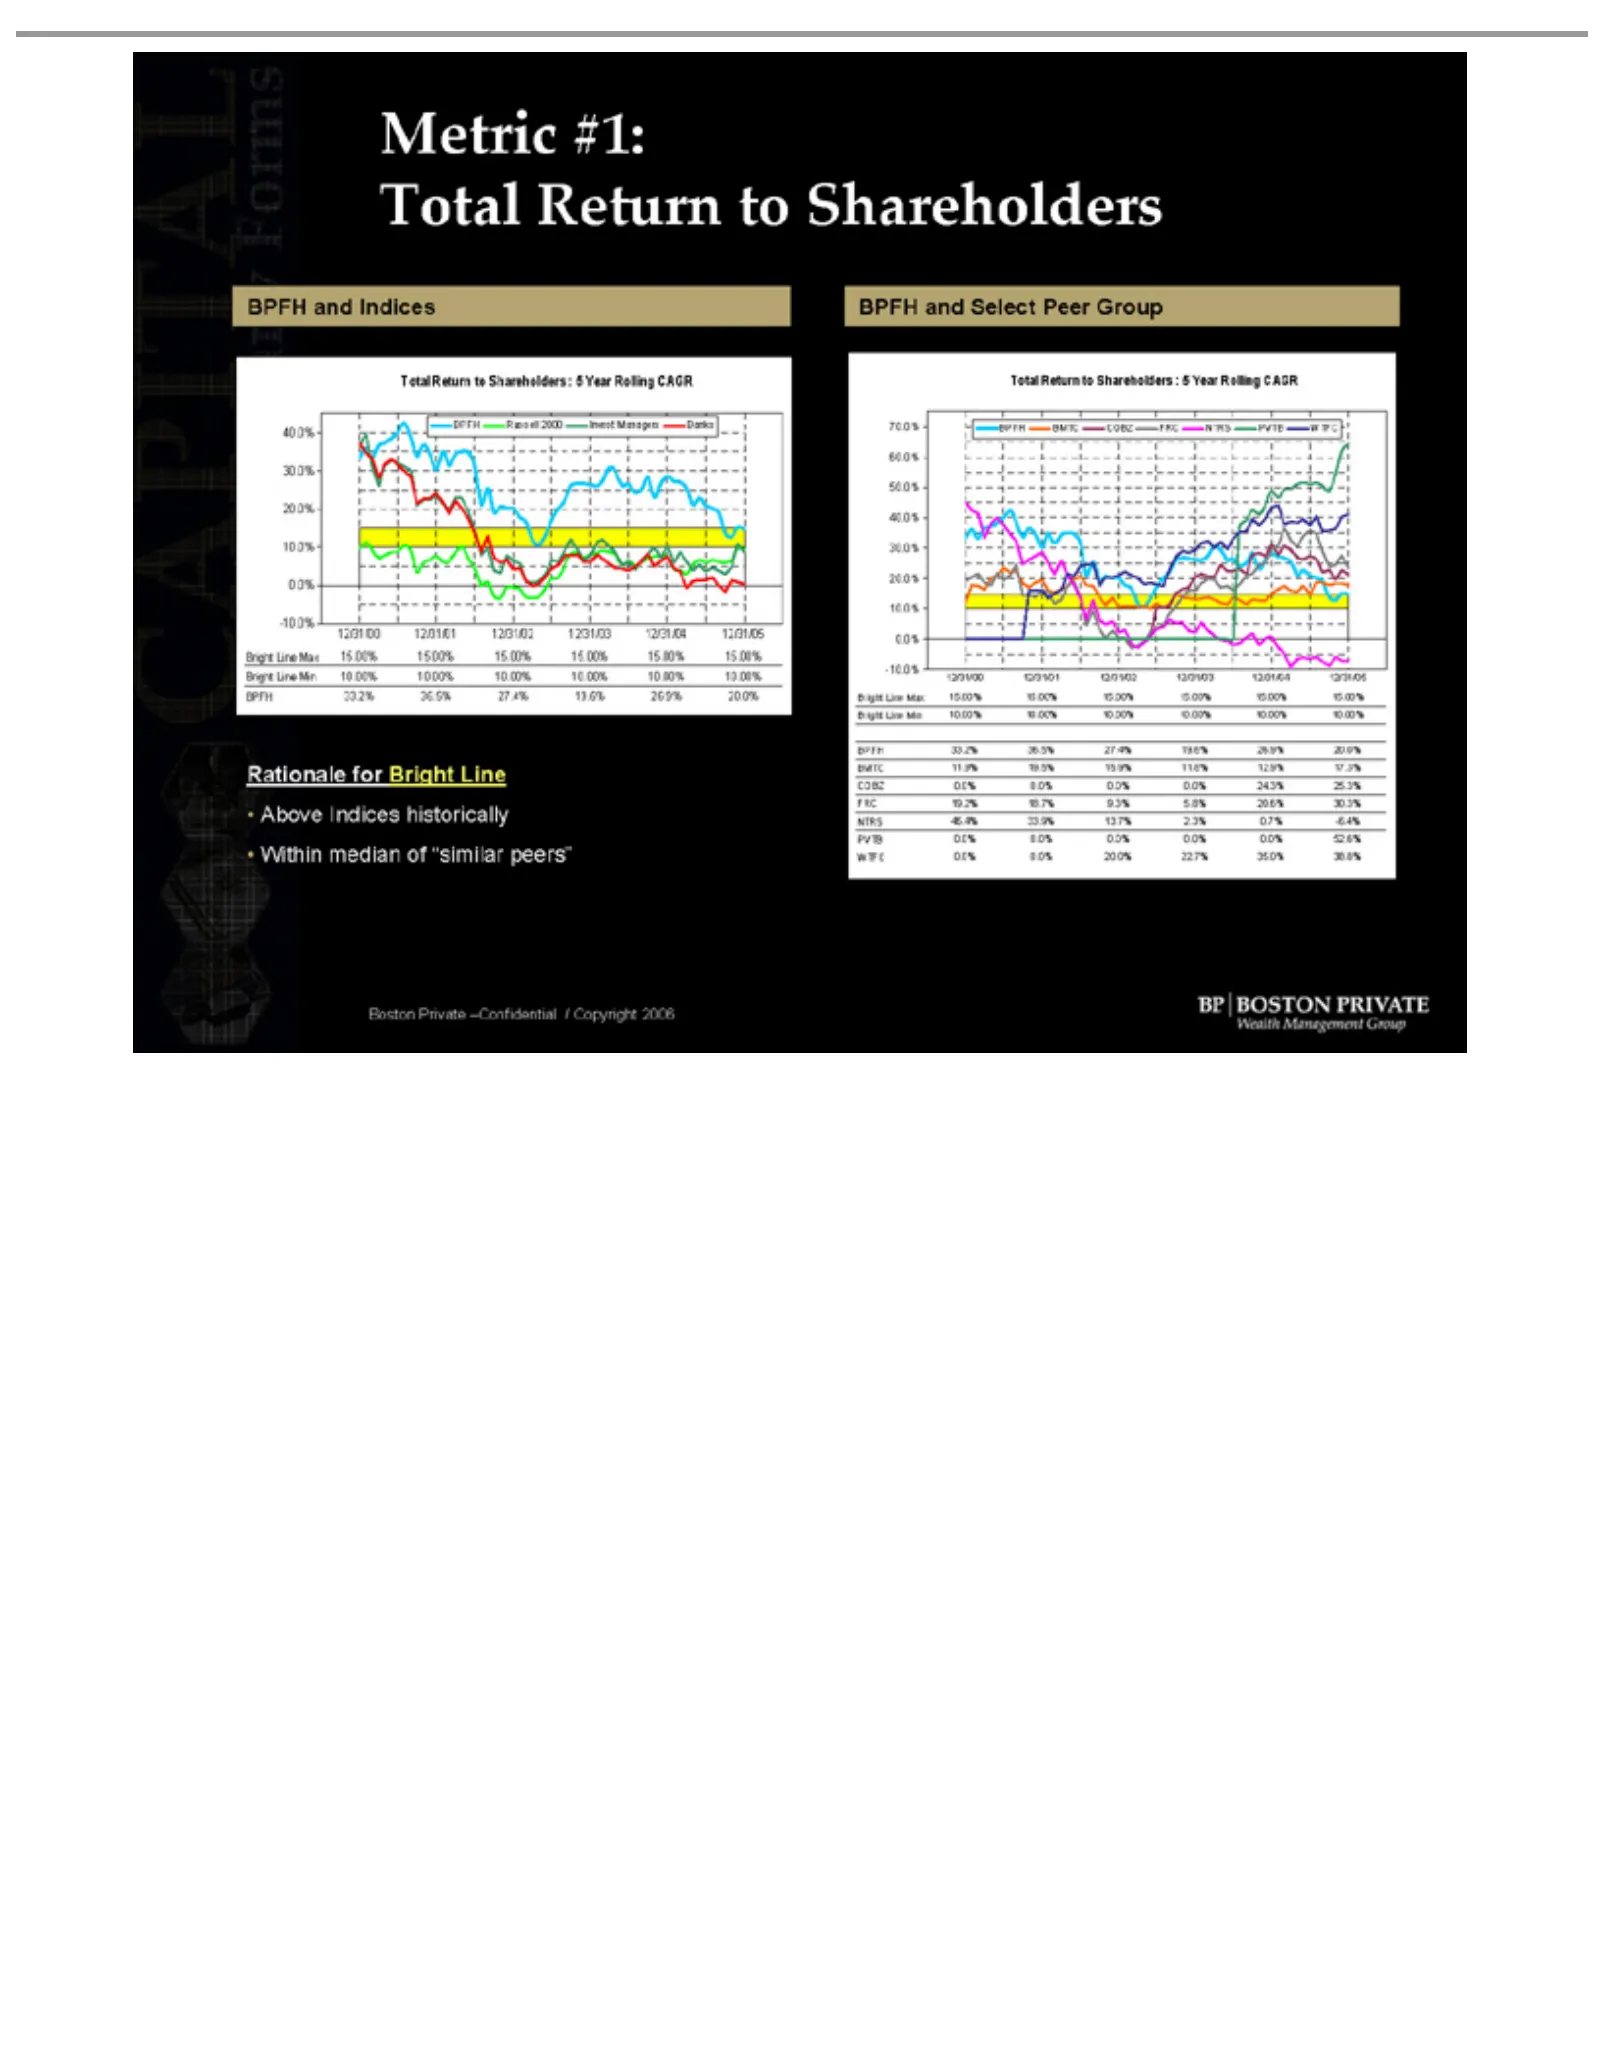
Slide 14: Metric #1: BPFH Total Return and Bright Line
Metric BPFH Total 12/31/00 -10.0% 0.0% 10.0% 20.0% 30.0% 40.0% Bright Bright Return and #1: 12/31/00 -10.0% 0.0% 10.0% 20.0% 30.0% 40.0% 50.0% 60.0% 70.0% Above Within Line 12/31/01 Return and LineIndices 33.2% •Rationale BPFH Total to Indices median Max 12/31/01 for Select to Shareholders Min Max B
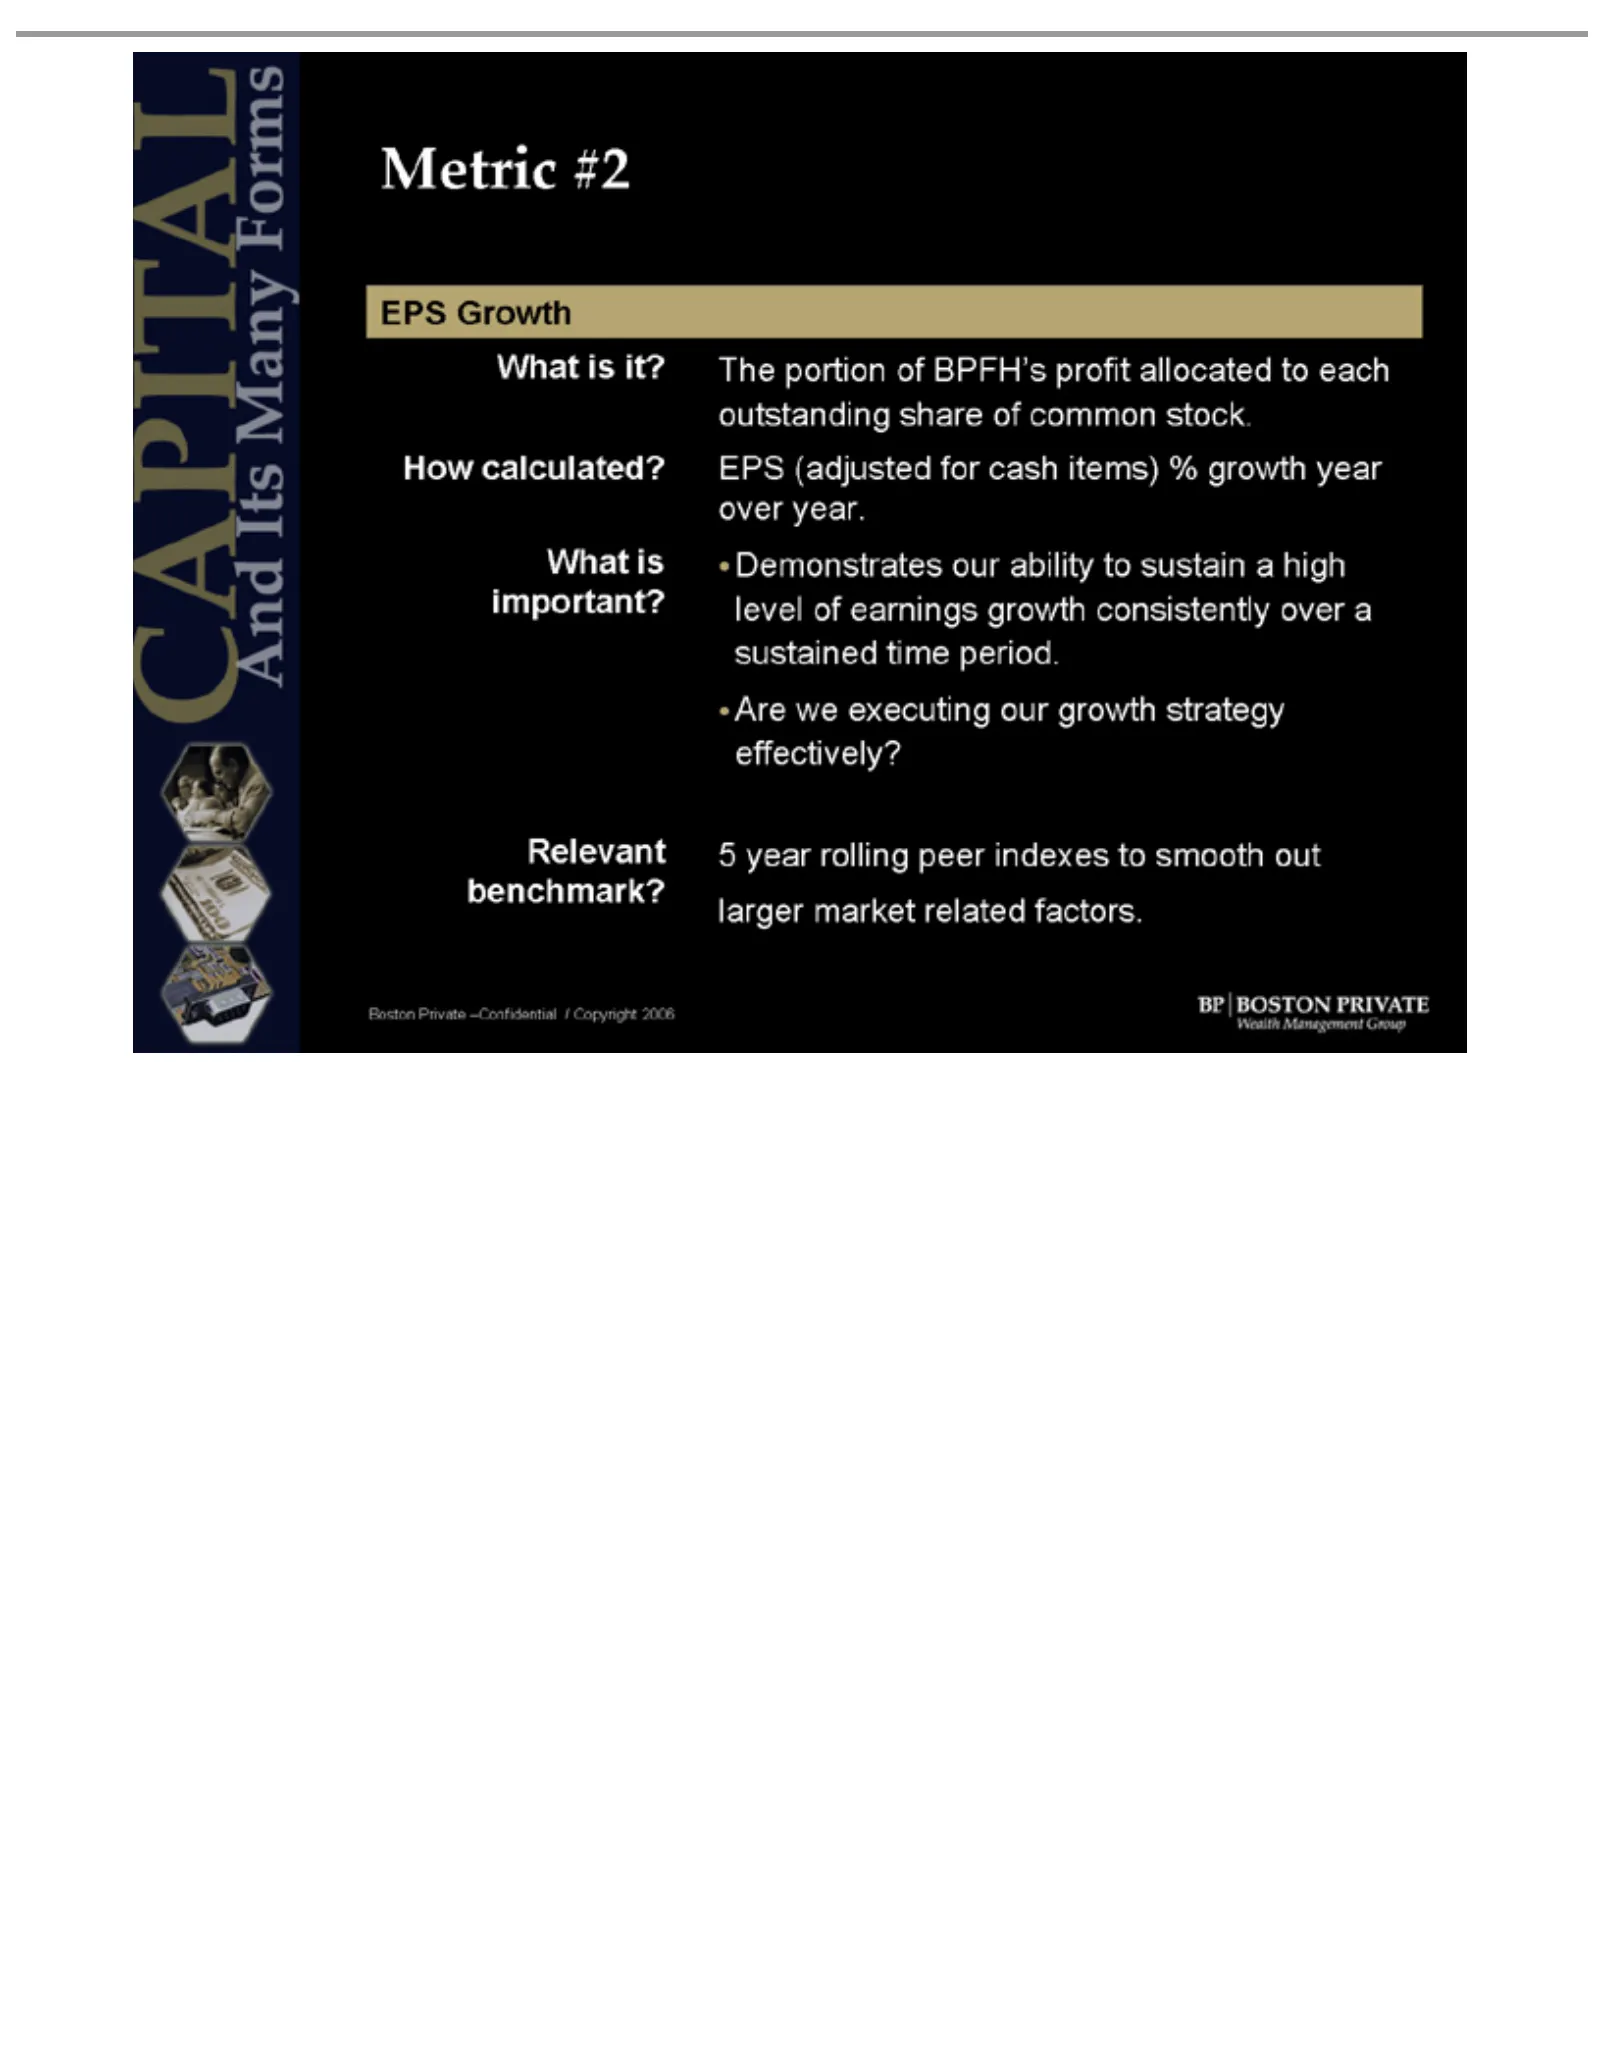
Slide 15: Metric #2: EPS Growth
Metric EPS Relevant #2 outstanding HowAreyear. we is benchmark? larger Boston Growth is it? The calculated? effectively? over •What 5 share important? executing market year Private portion ofour •EPS rolling related of BPFH’s common (adjusted stock. Demonstrates growth peer –Confidential factors. /i
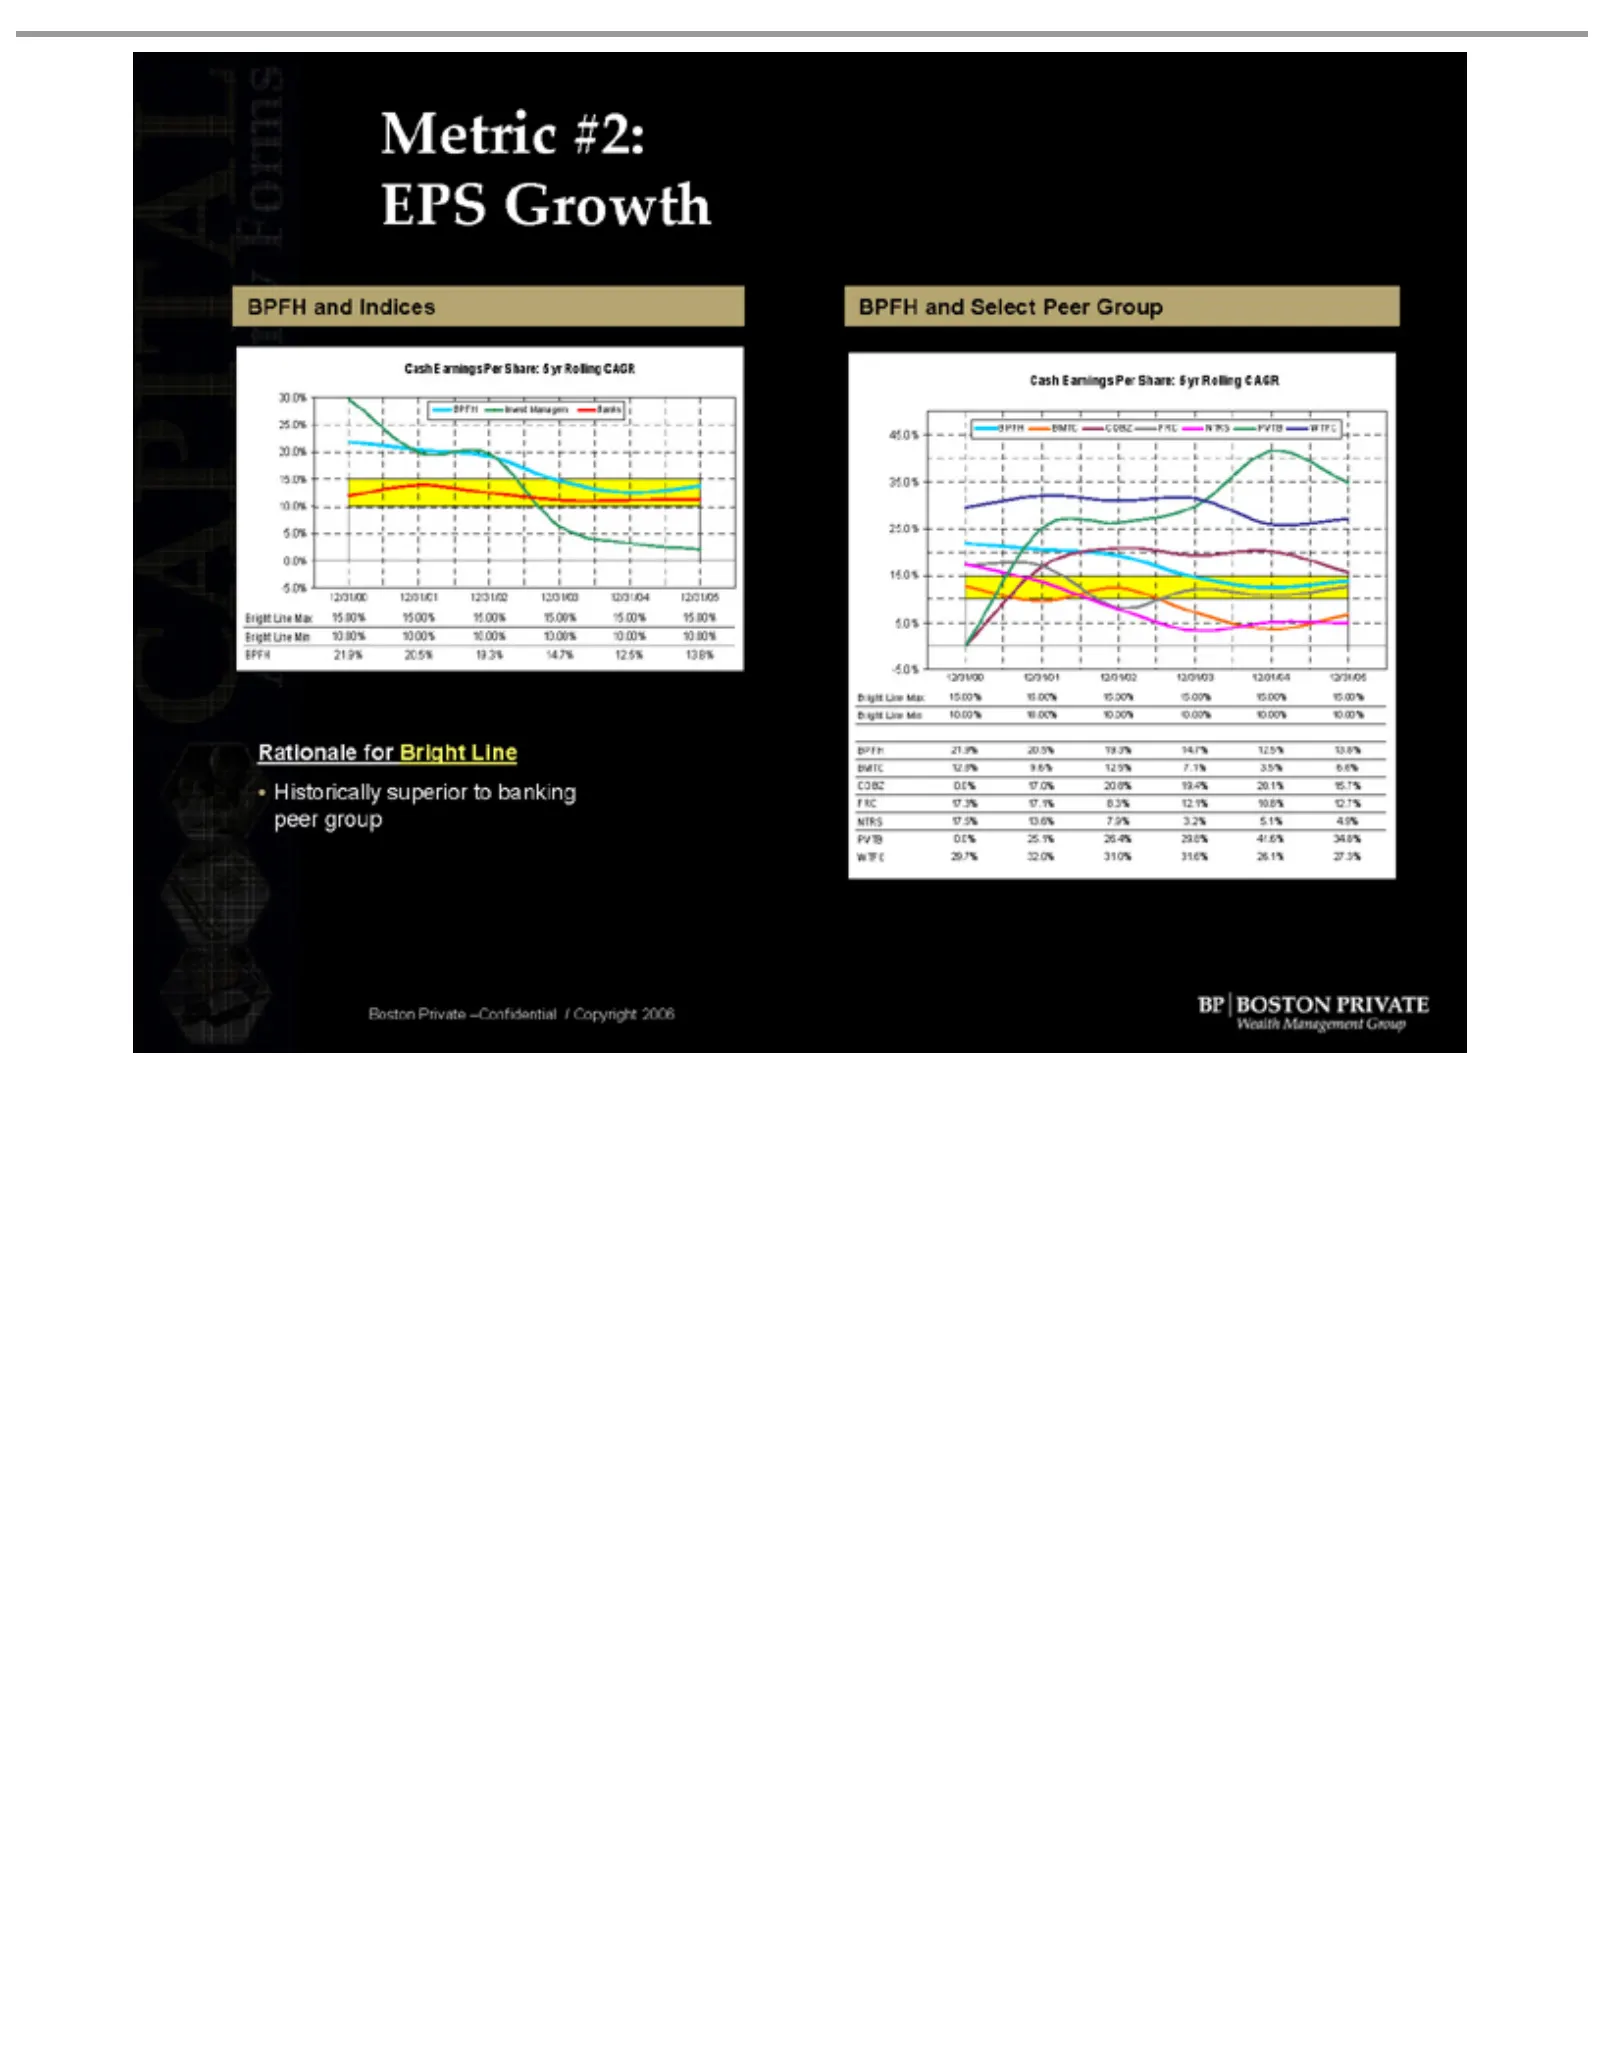
Slide 16: Metric #2: BPFH Cash EPS and Bright Line
Metric EPS BPFH Cash 12/31/00 -5.0% 0.0% 5.0% 10.0% 15.0% 20.0% 25.0% 30.0% Bright BrightGrowth Earnings and #2: •Rationale peer BPFH Cash 12/31/00 -5.0% 5.0% 15.0% 25.0% 35.0% 45.0% Line 12/31/01 Indices 21.9% Historically group Earnings and Line Max Per Min 12/31/01 for Select Max Bright15.00% 12/

Slide 17: Metric #3: Cash Margins
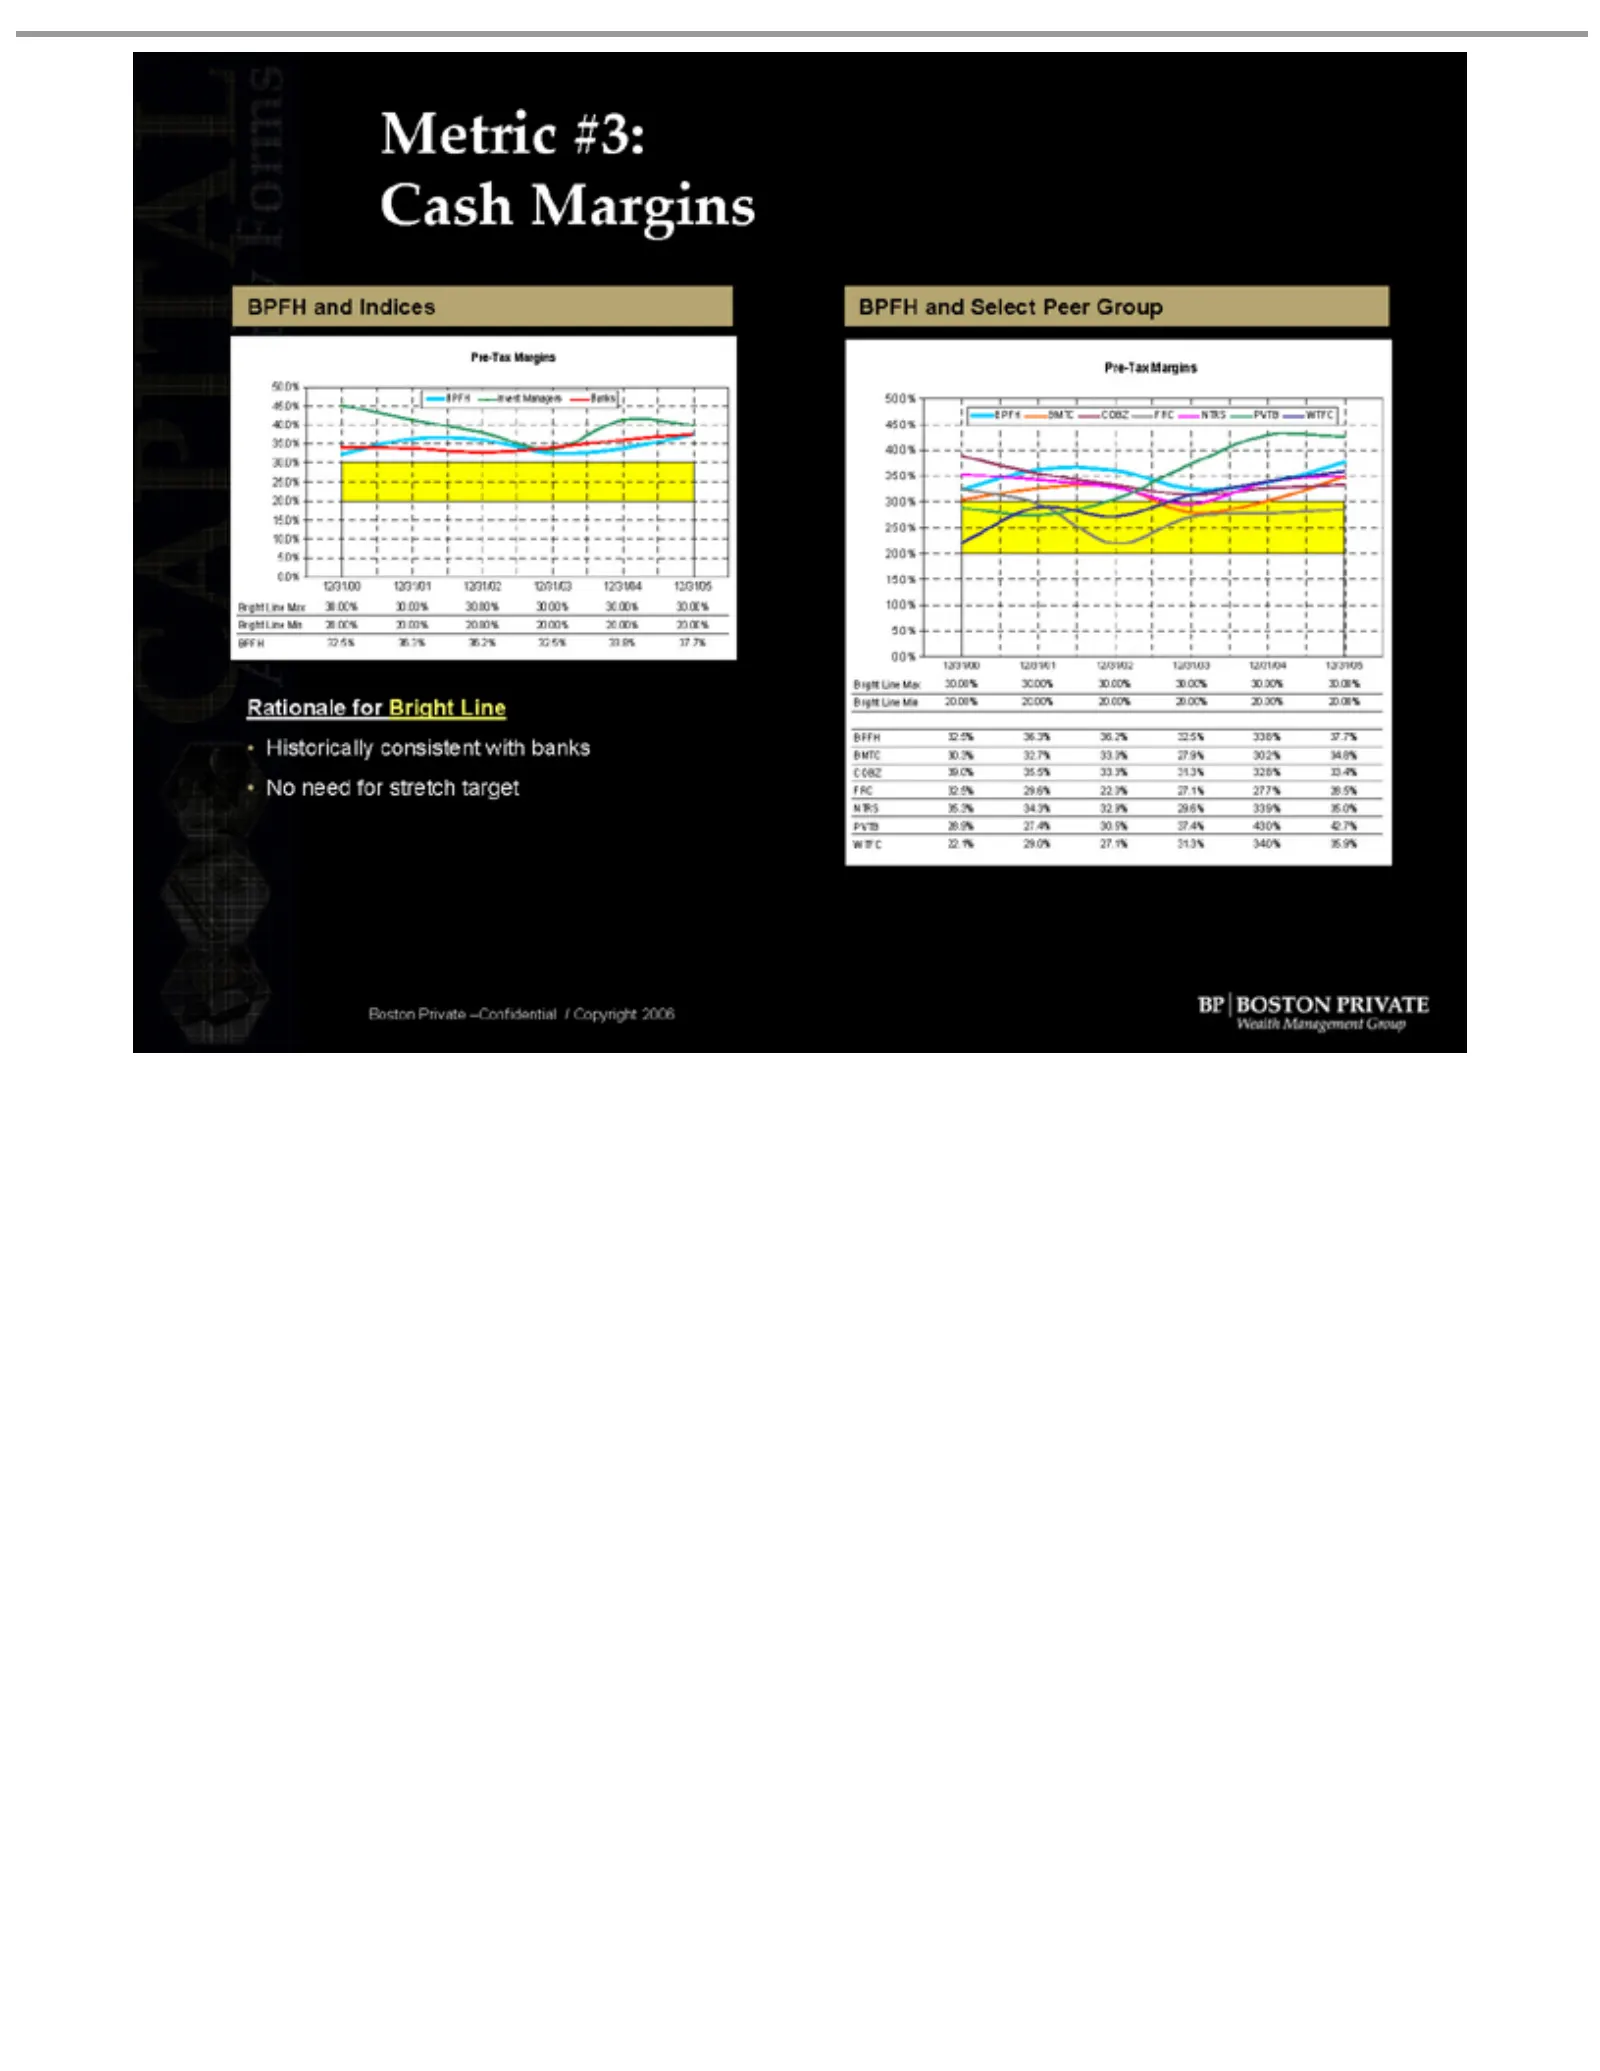
Metric Cash What #3 Margins is •it? Measure of how efficiently (profitably) run How What Totalour business. calculated? Revenues is important? •enhancements “growth Relevant Margin Margins scale, oriented” benchmark? Boston performance Bank Private and and (Pretax firms. earnings improving technolog
Slide 18: Metric #3: BPFH Cash Pre-Tax Margins and Bright Line
Metric Cash BPFH Pre-Tax 12/31/00 0.0% 5.0% 10.0% 15.0% 20.0% 25.0% 30.0% 35.0% 40.0% 45.0% 50.0% Bright BrightMargins and Pre-Tax#3: 12/31/00 0.0% 5.0% 10.0% 15.0% 20.0% 25.0% 30.0% 35.0% 40.0% 45.0% 50.0% Line Margins 12/31/01 Indices 32.5% •Rationale BPFH Historically No need and Line MarginsMax
Slide 19: Metric #4: Return on Invested Capital
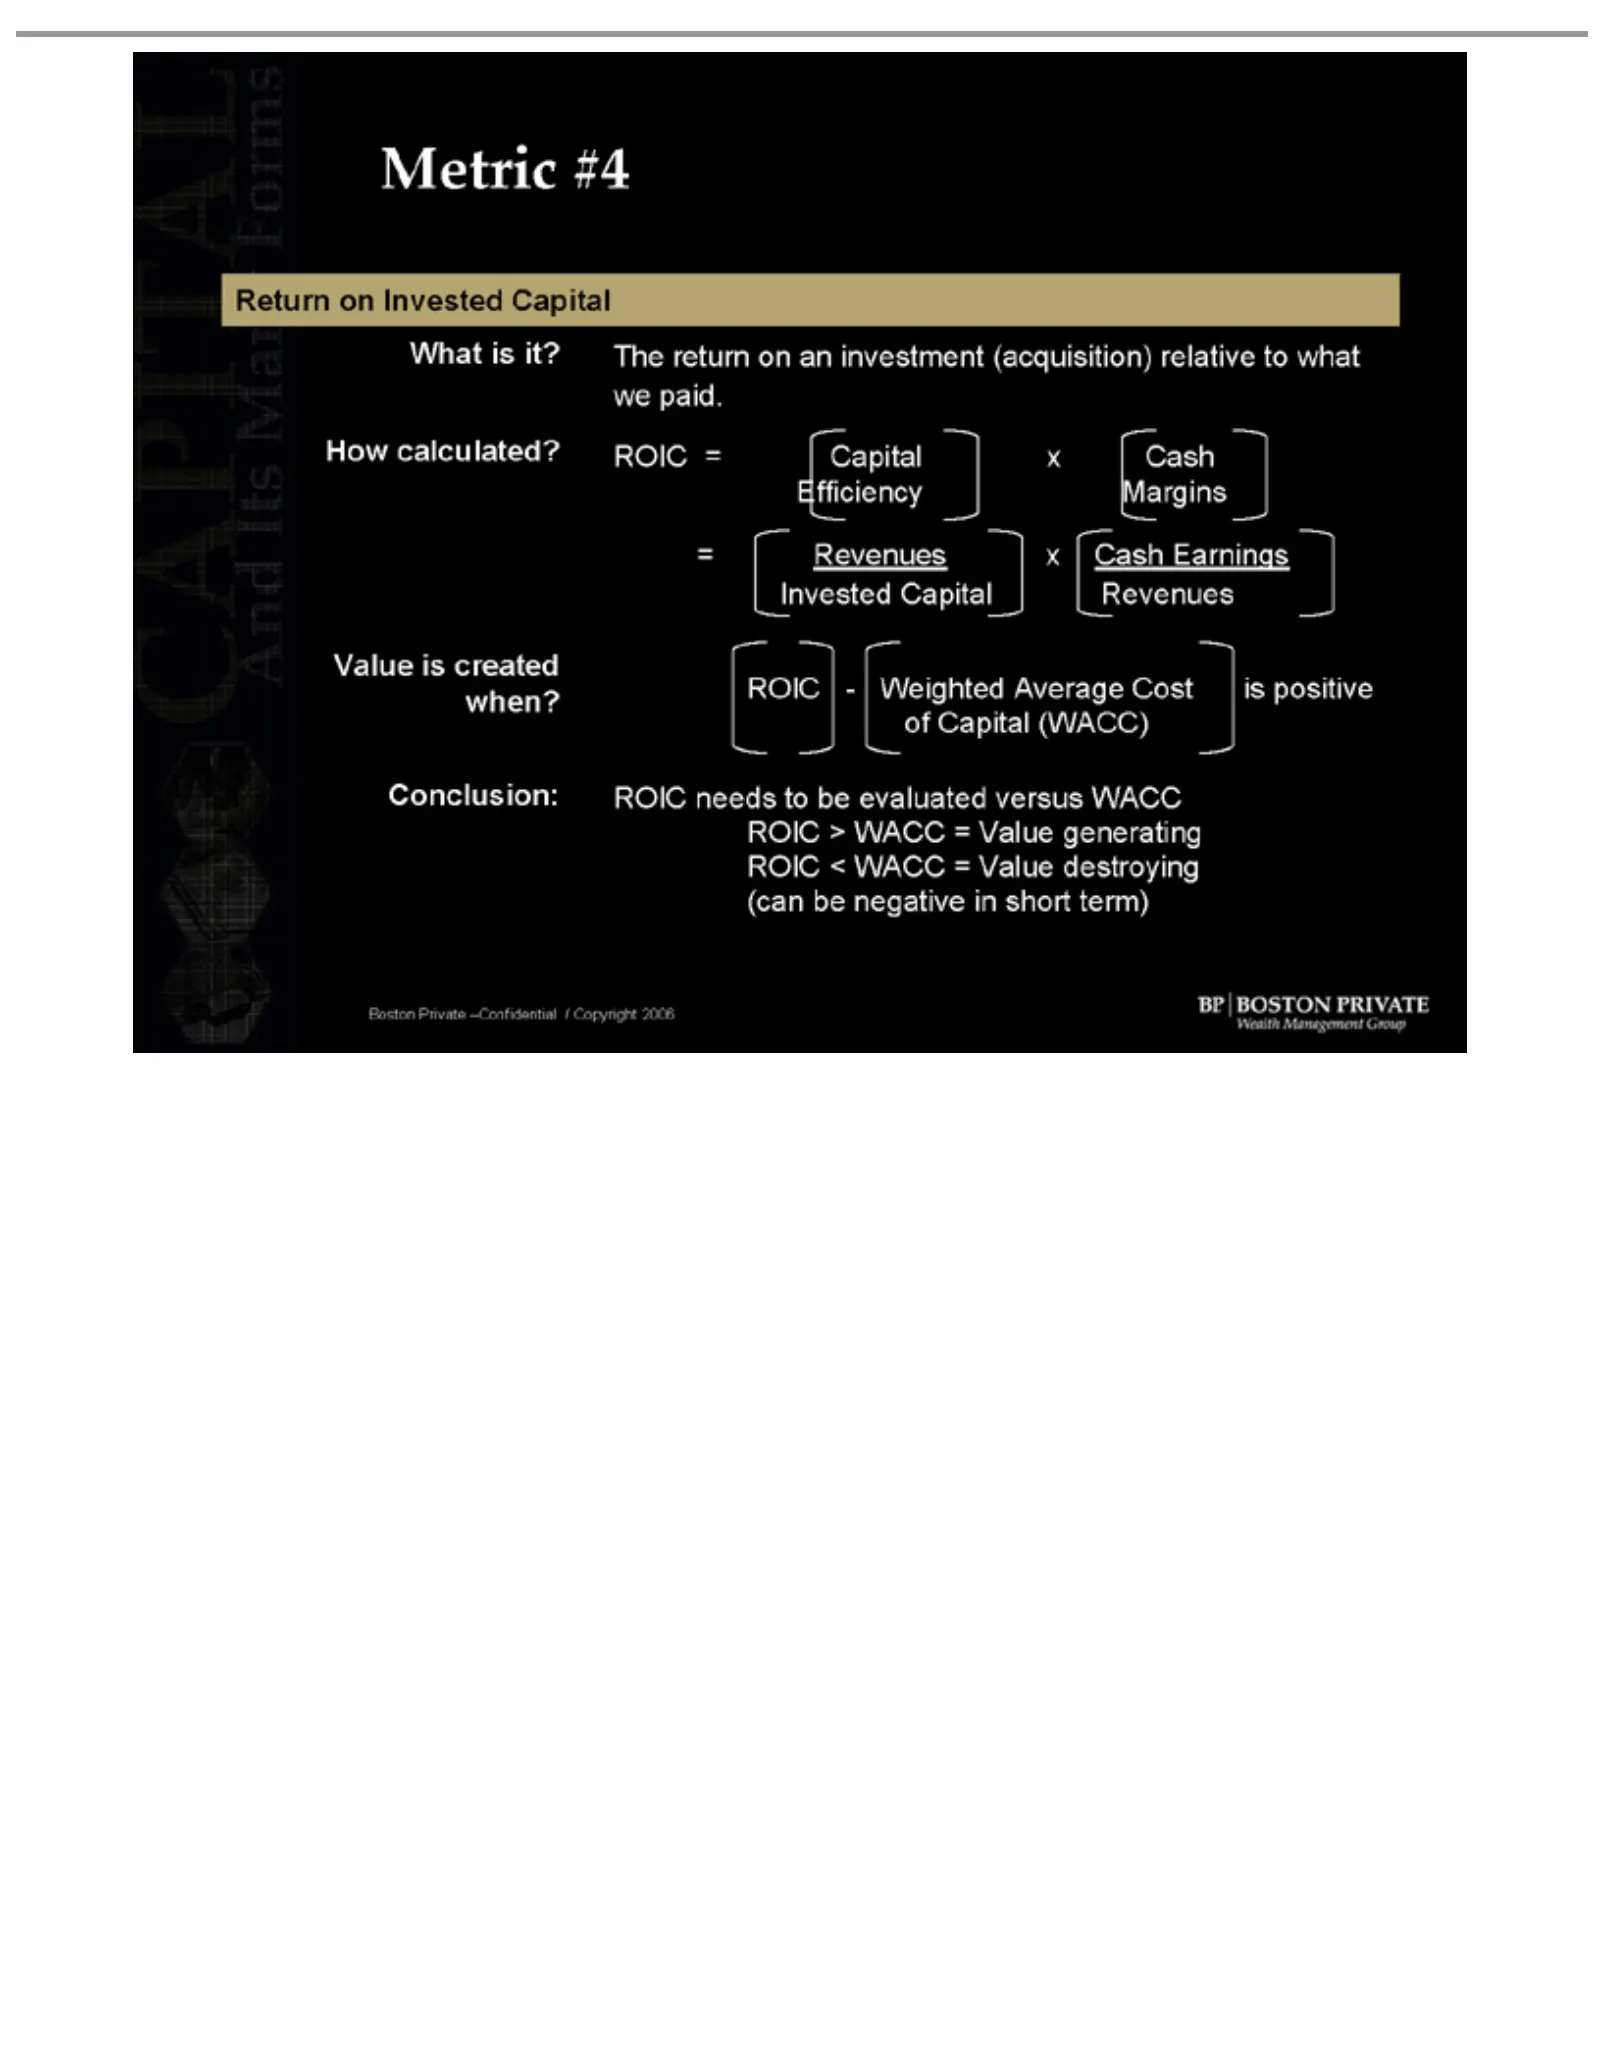
Metric Return What we How #4 on is it? Invested paid. The return calculated? Efficiency = Invested xCapital Margins Revenues Capital CashonEarnings ROIC Revenues=an investment Capital x Cash(acquisition) relative to what Value when? of is created >ROIC—Weighted Capital Conclusion: (WACC) ROIC needs
Slide 20: Metric #4: ROIC and Cost of Capital Bright Line
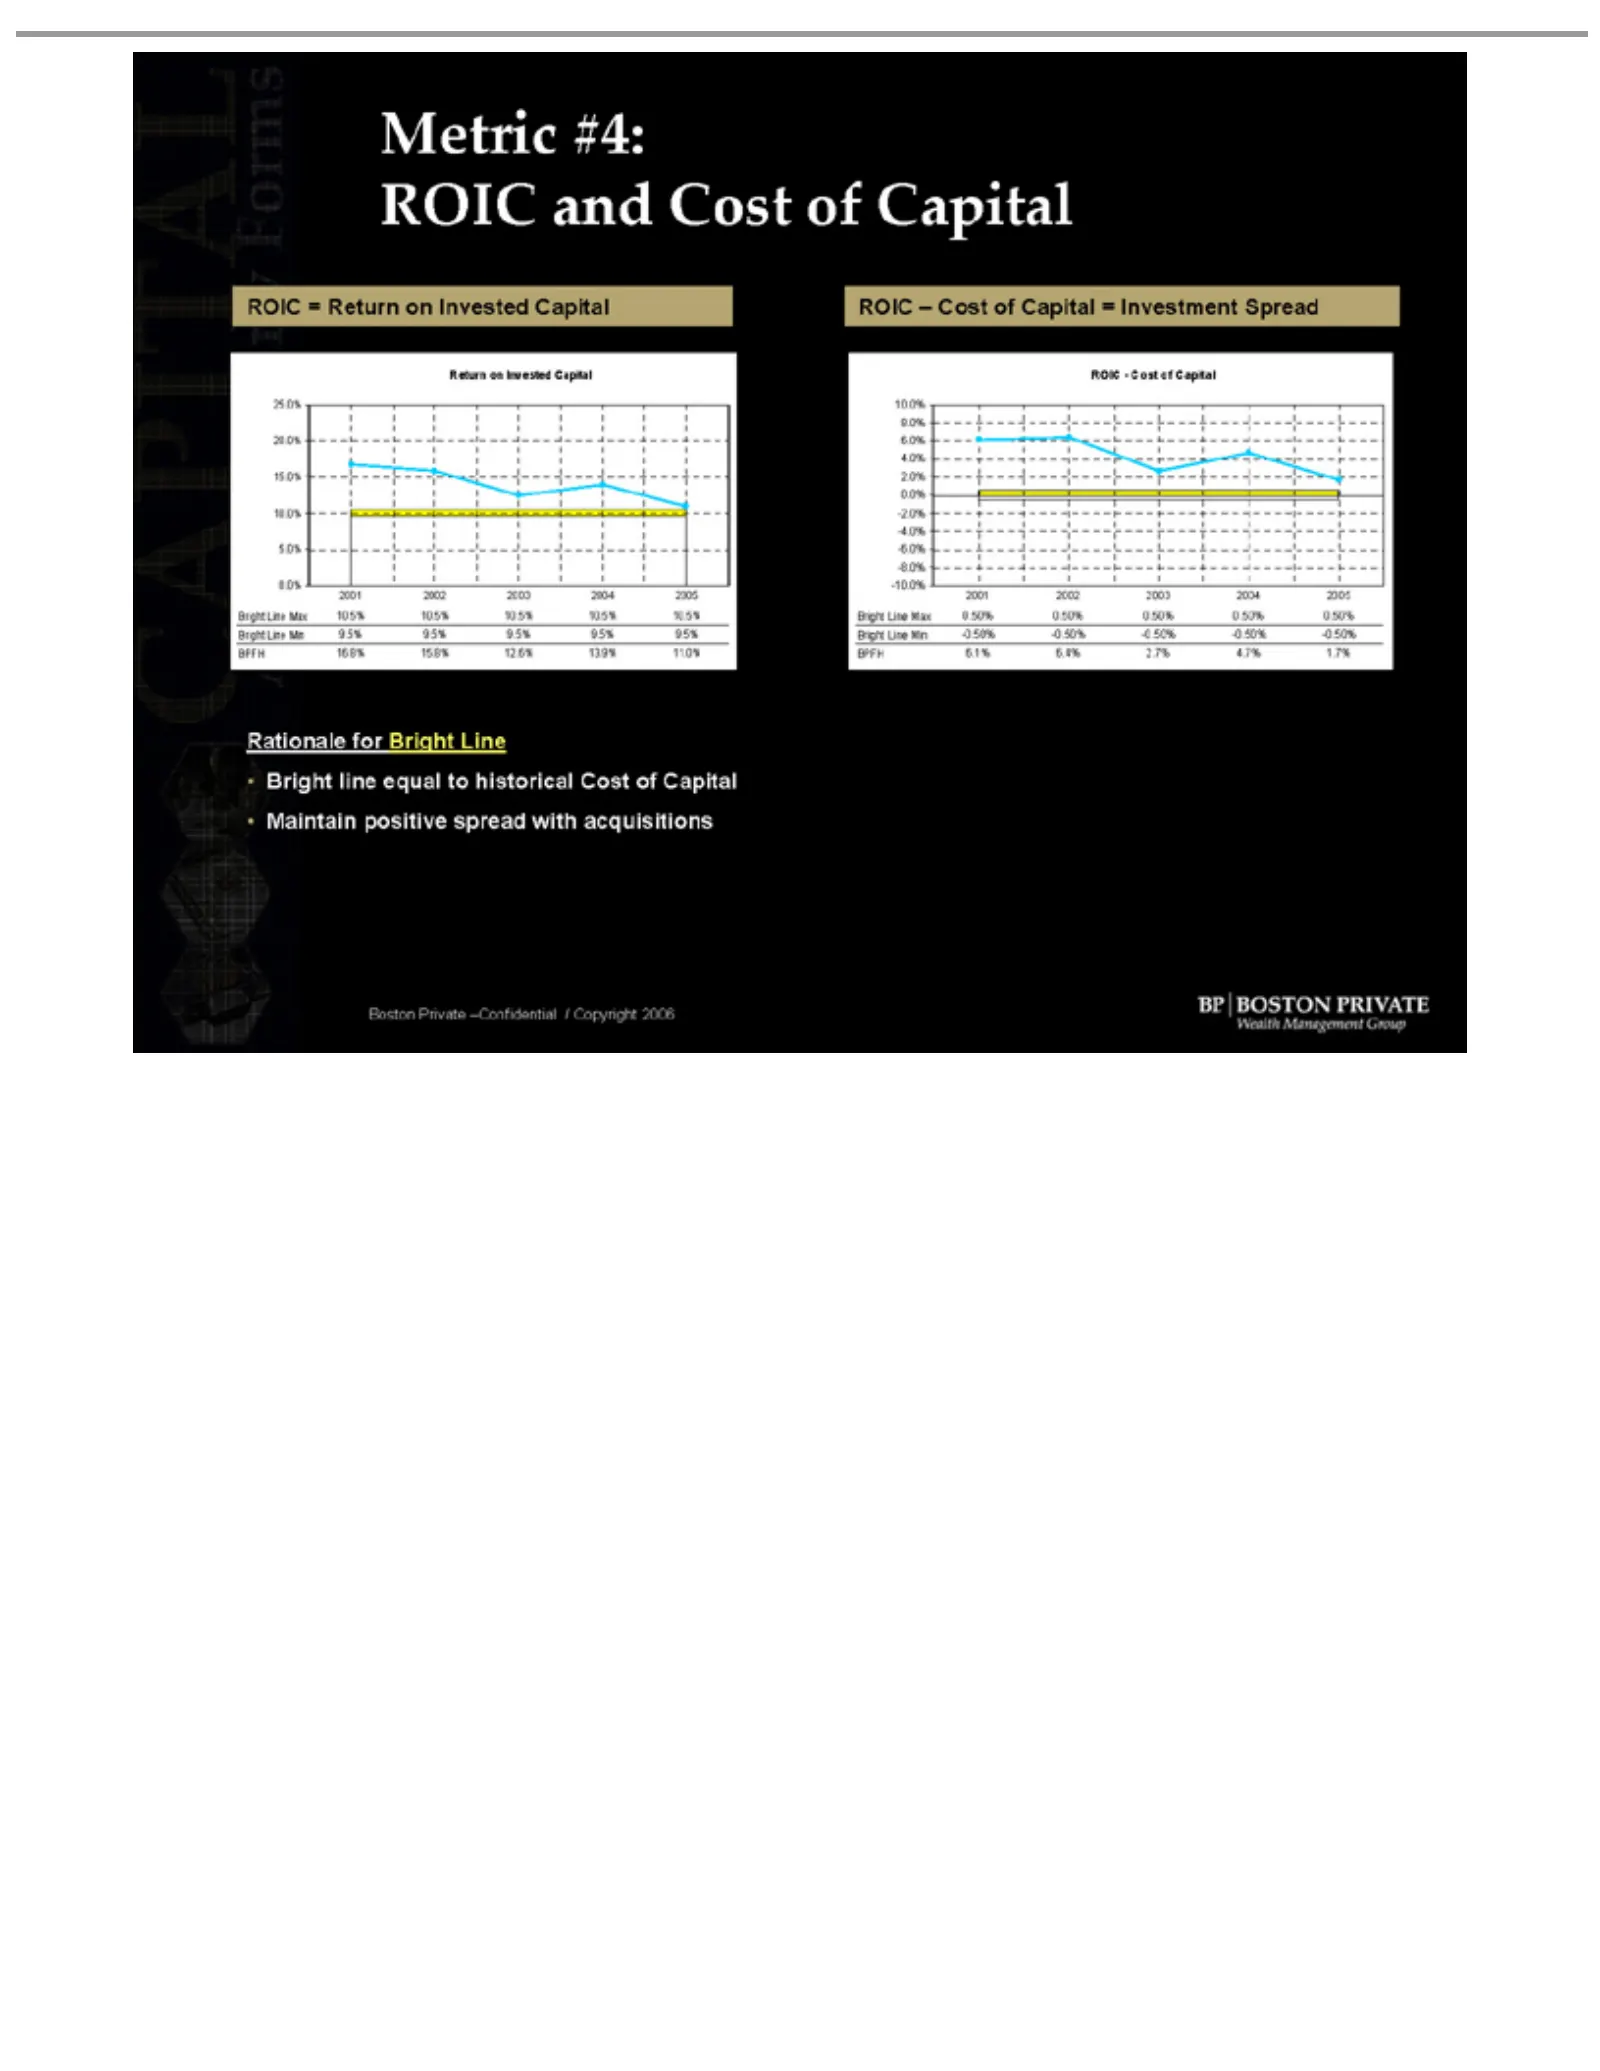
Metric2002 ROIC Return 2001 0.0% 5.0% 10.0% 15.0% 20.0% 25.0% Bright BPFH Bright ROIC 2002 and –= #4: ROIC—Cost 2001 -10.0% -8.0% -6.0% -4.0% -2.0% 0.0% 2.0% 4.0% 6.0% 8.0% 10.0% on Line Return Invested Cost 2003 16.8% Line Cost Max Min 2003 of on 2004 Capital 10.5% 15.8% Max of Invested Capital 9.5

Slide 21: Metric #5: Executive Retention
Metric Executive What #5 is separations management How calculated? What voluntary is important? it? Employee Yearly Our A measure entity Retention personnel. of of calculation beginning ability to how (excludes attract the #ofand of enterprise senior year retains managers minus retirement). retain t
Slide 22: Metric #5: Historical Enterprise-wide Retention
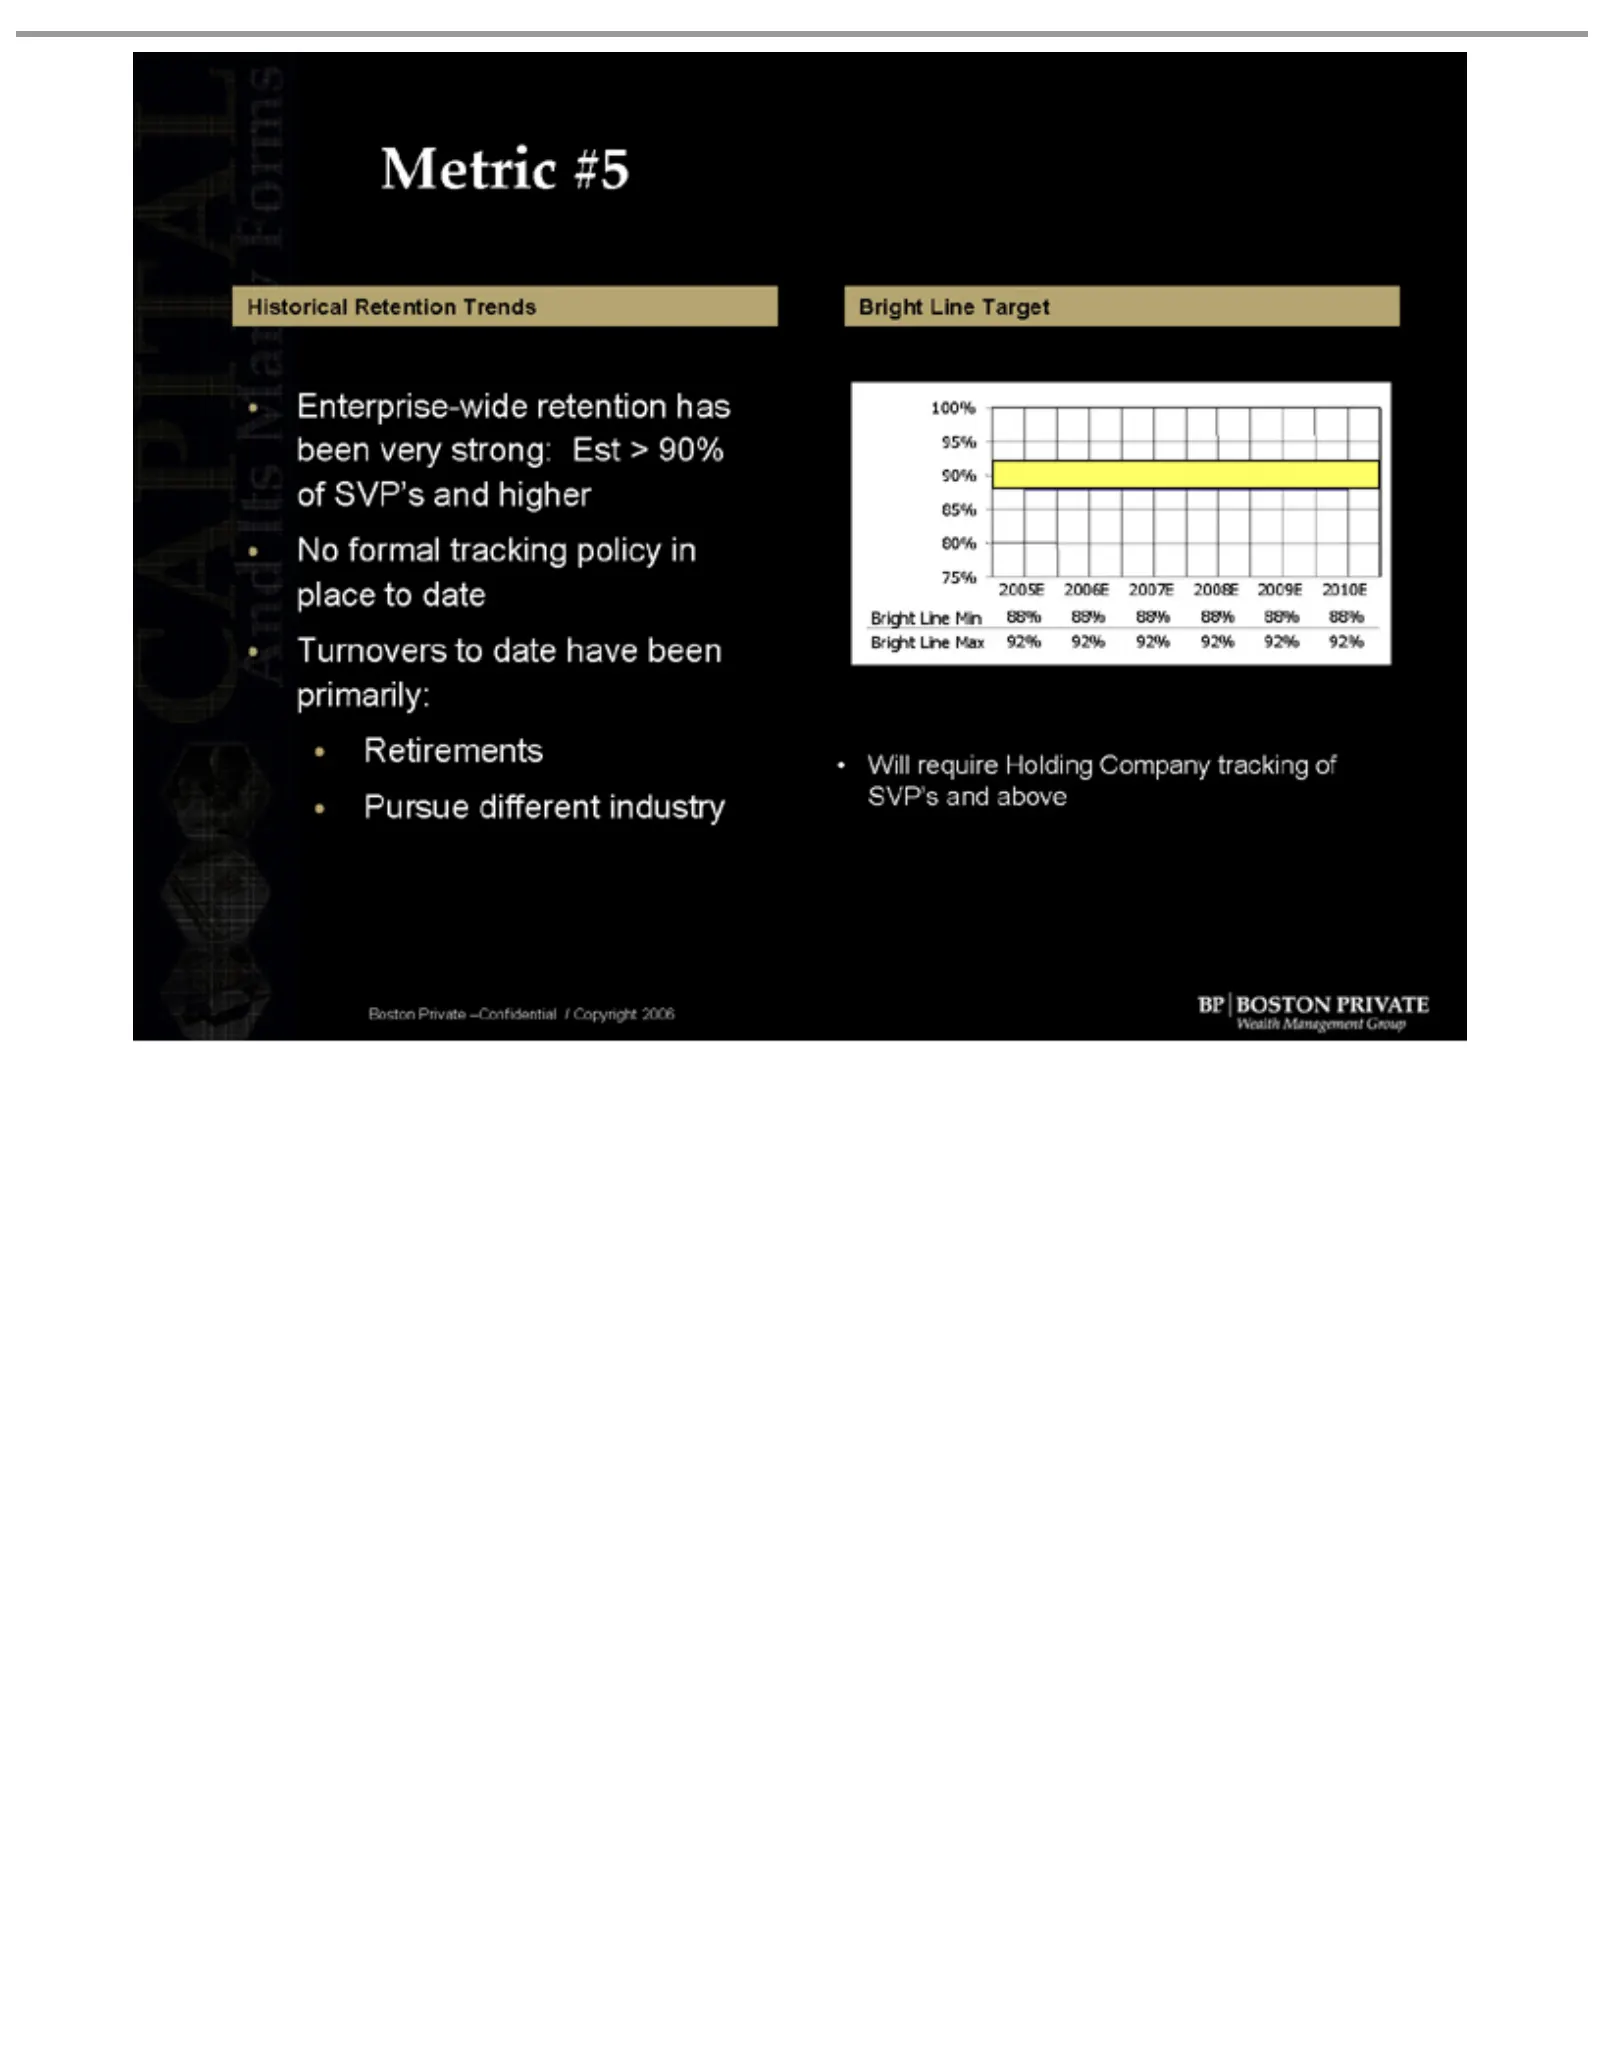
Metric Historical Enterprise-wide been of No place Turnovers primarily: 2005E 75% 80% 85% 90% 95% 100% • SVP’s Retirements Pursue formal Bright •Boston SVP’s Will very toLine 2006E #5date and strong: different Retention to Linetracking require and Target Privatedate Min higher 2007E Max above retent
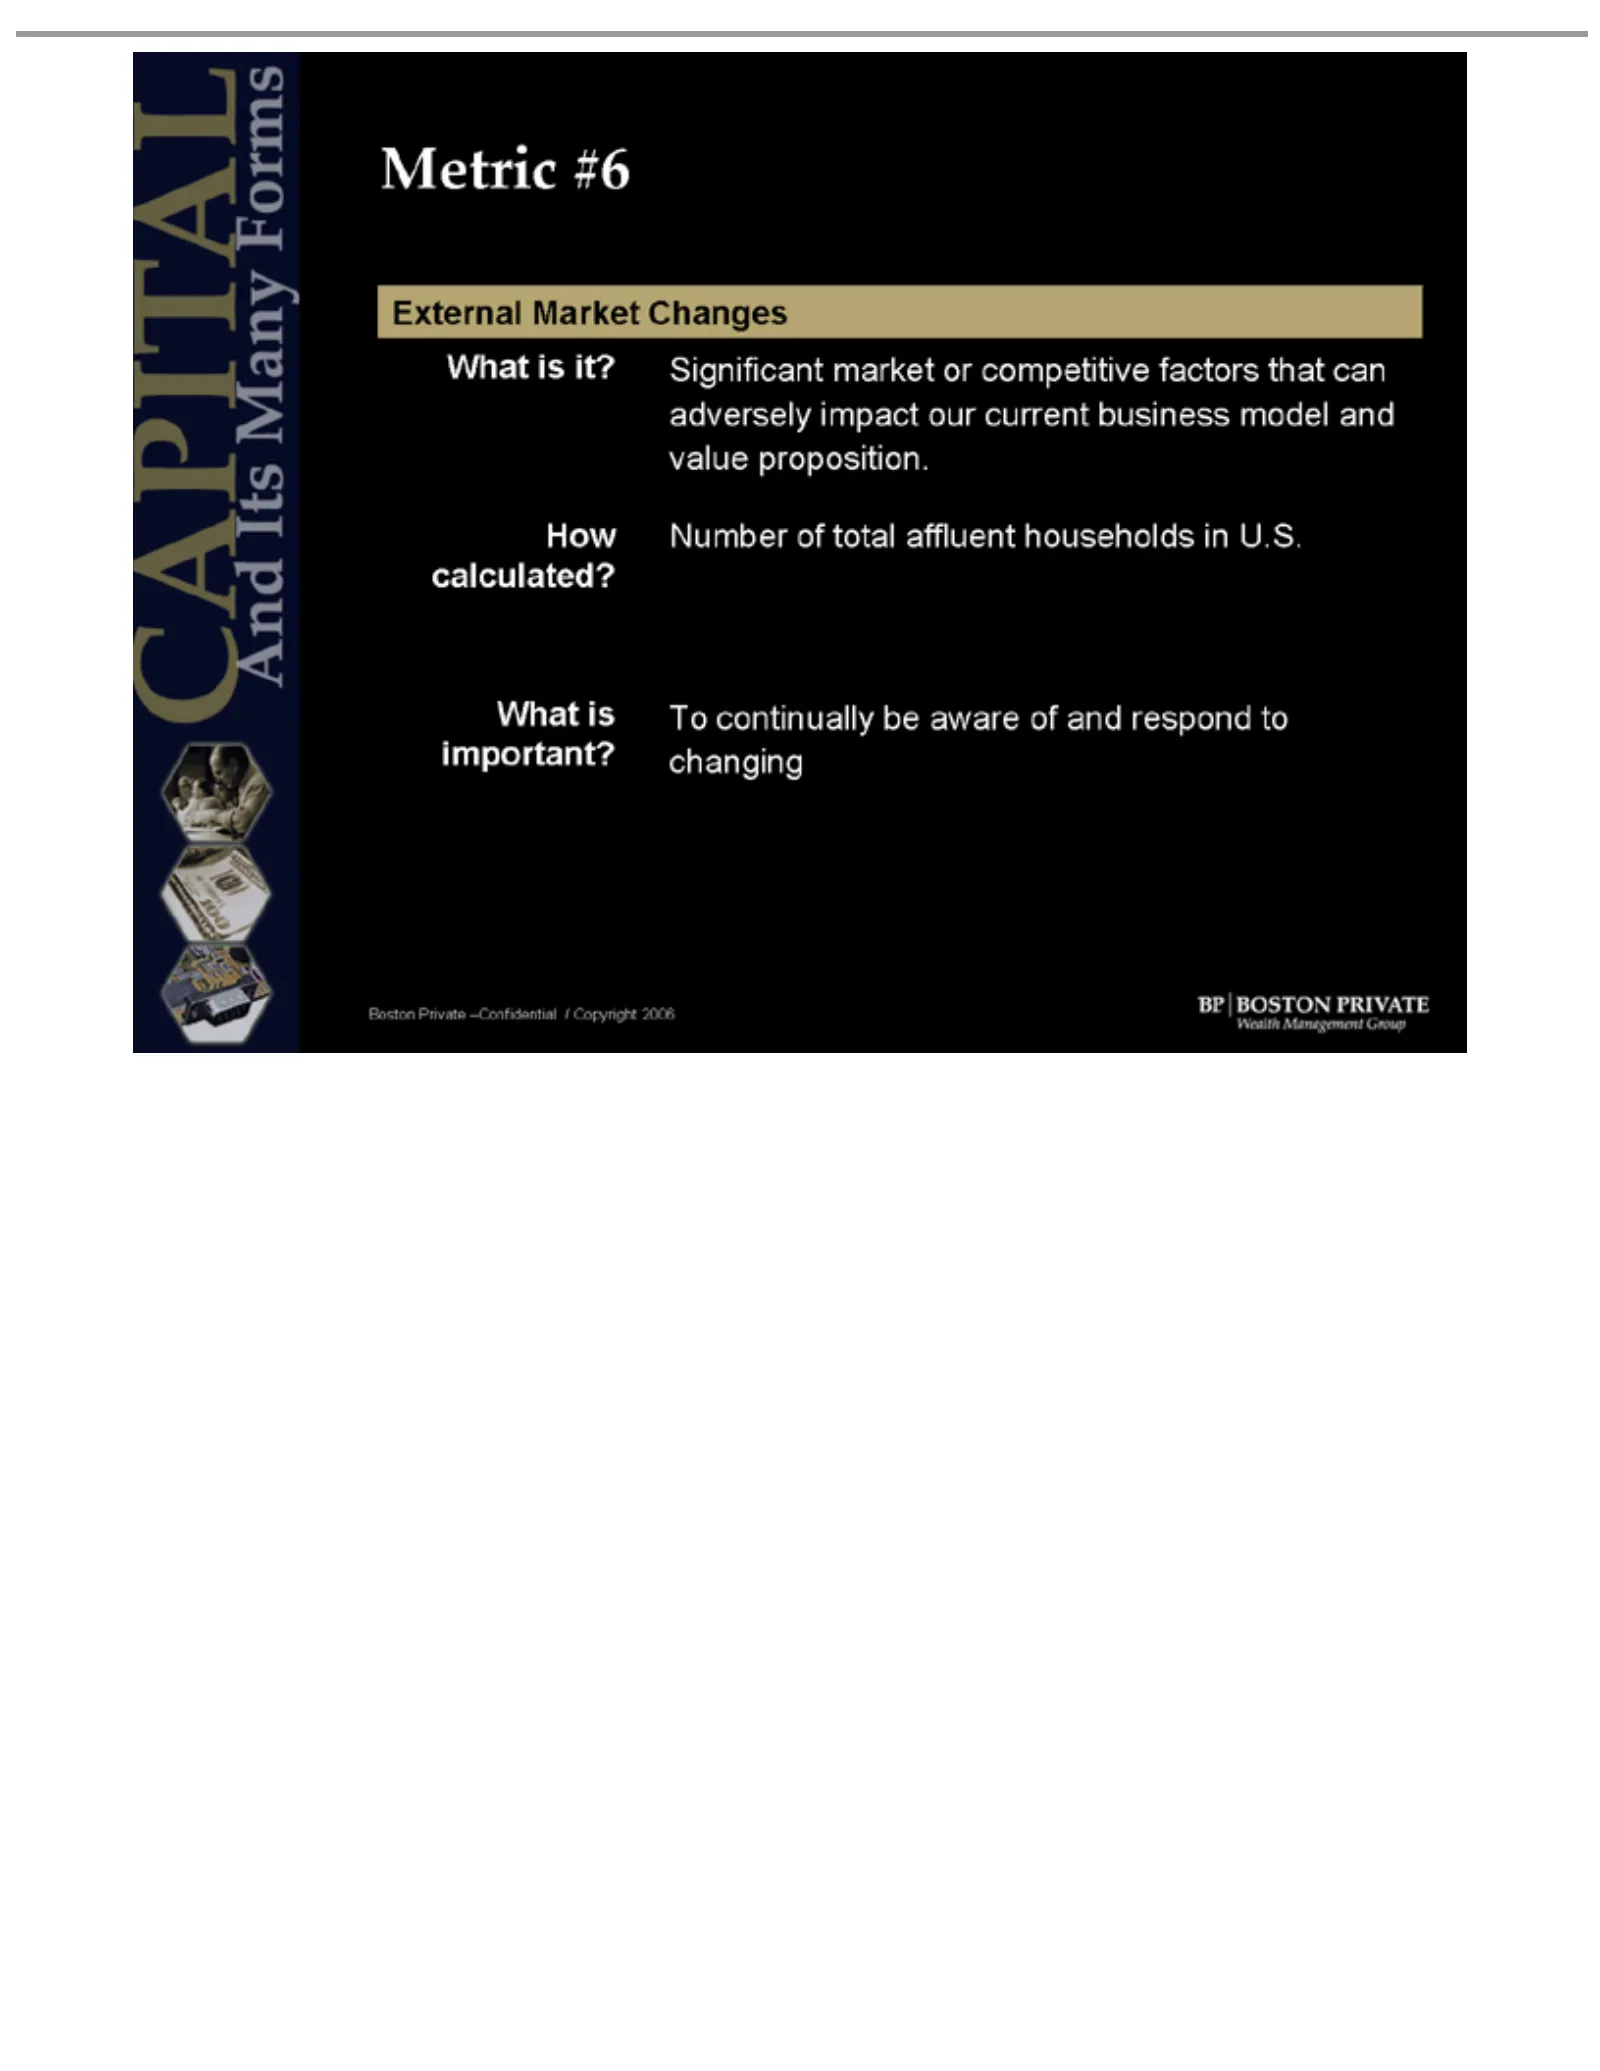
Slide 23: Metric #6: External Market Factors
Metric External What #6 isMarket adversely value How calculated? What is important? Boston it?changing To PrivateSignificant proposition. Number impact Changes of our total market current continually affluent or competitive business be aware –Confidential households of model and / Copyright in facto
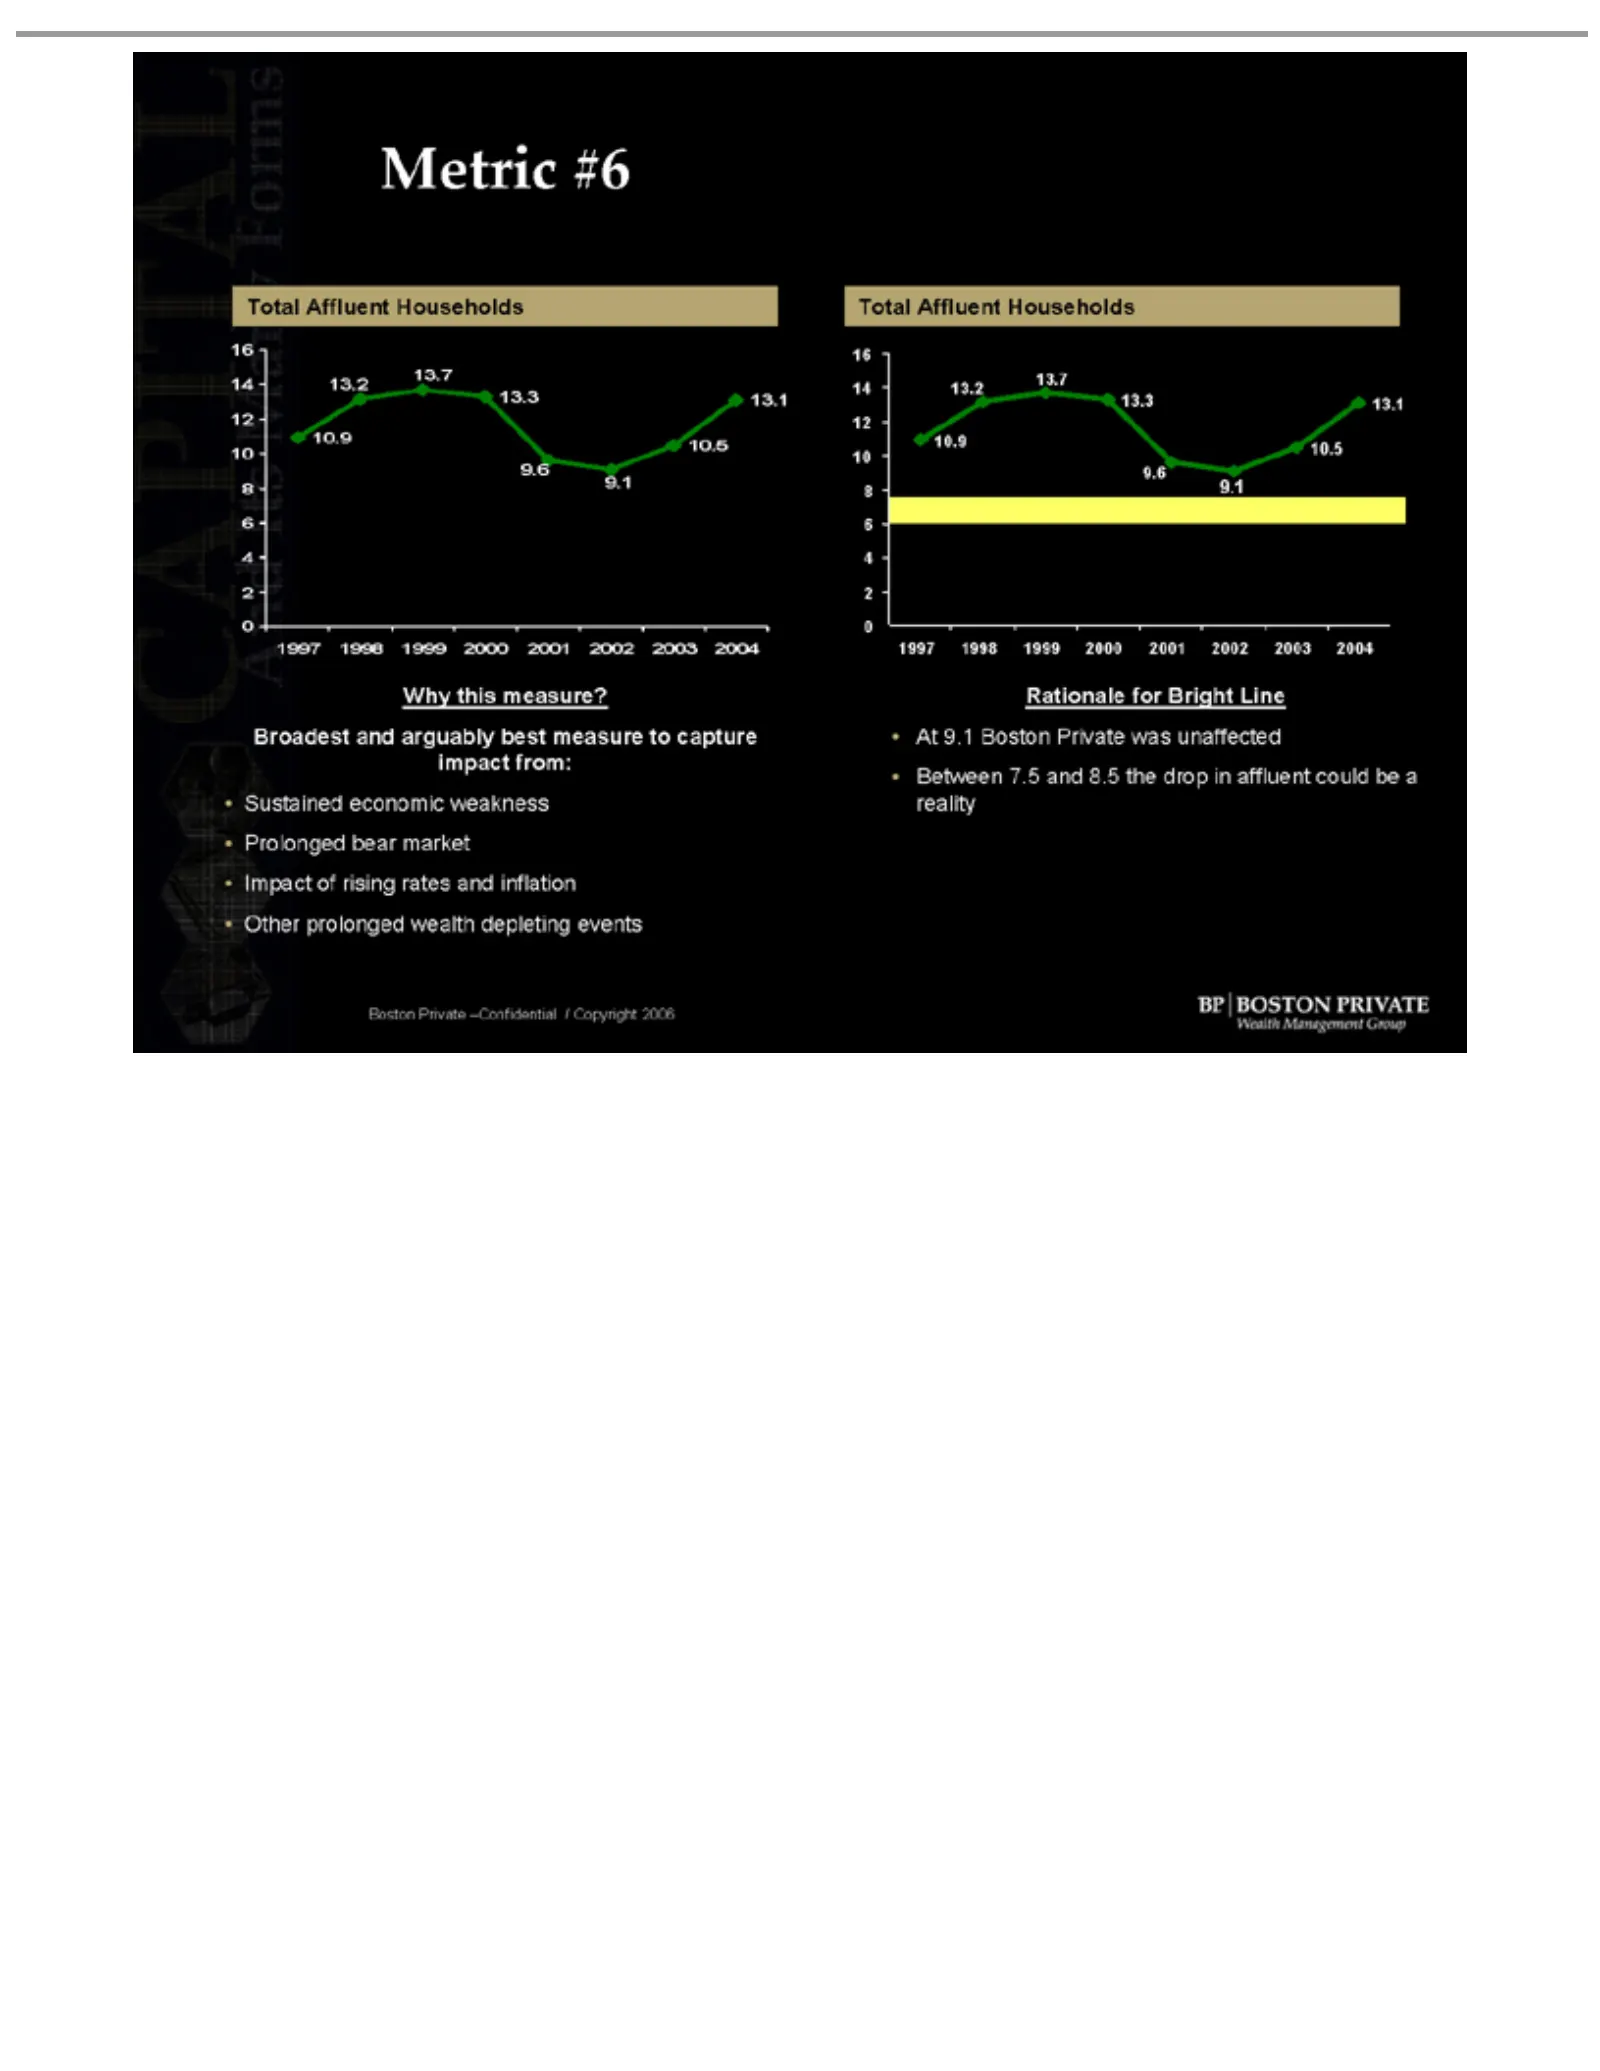
Slide 24: Metric #6: Total Affluent Households
16 Metric Total 8 10 12 14 6 4 2 13.7 0 13.3 13.2 1997 9.1 9.6 10.5 10.9 Why Broadest impact Boston Total 8 10 12 14 16 Affluent Sustained Prolonged Impact Other #6 3.79.113.1 13.1 this Affluent 1998 prolonged from: of Private and Households measure? rising economic bear 1999arguably Households –Con

Slide 25: Metric #7: External Market Factors
Metric External What over versus #7 MeasuringisMarket Management, Banking How year lost calculated? What is important? of Boston time. it? Private Rate Quarterly Changes affiliates. business the Wealth “net trends. Sustained AUM of deposit review flows” from loan flows our and Advisory of orgrowth a
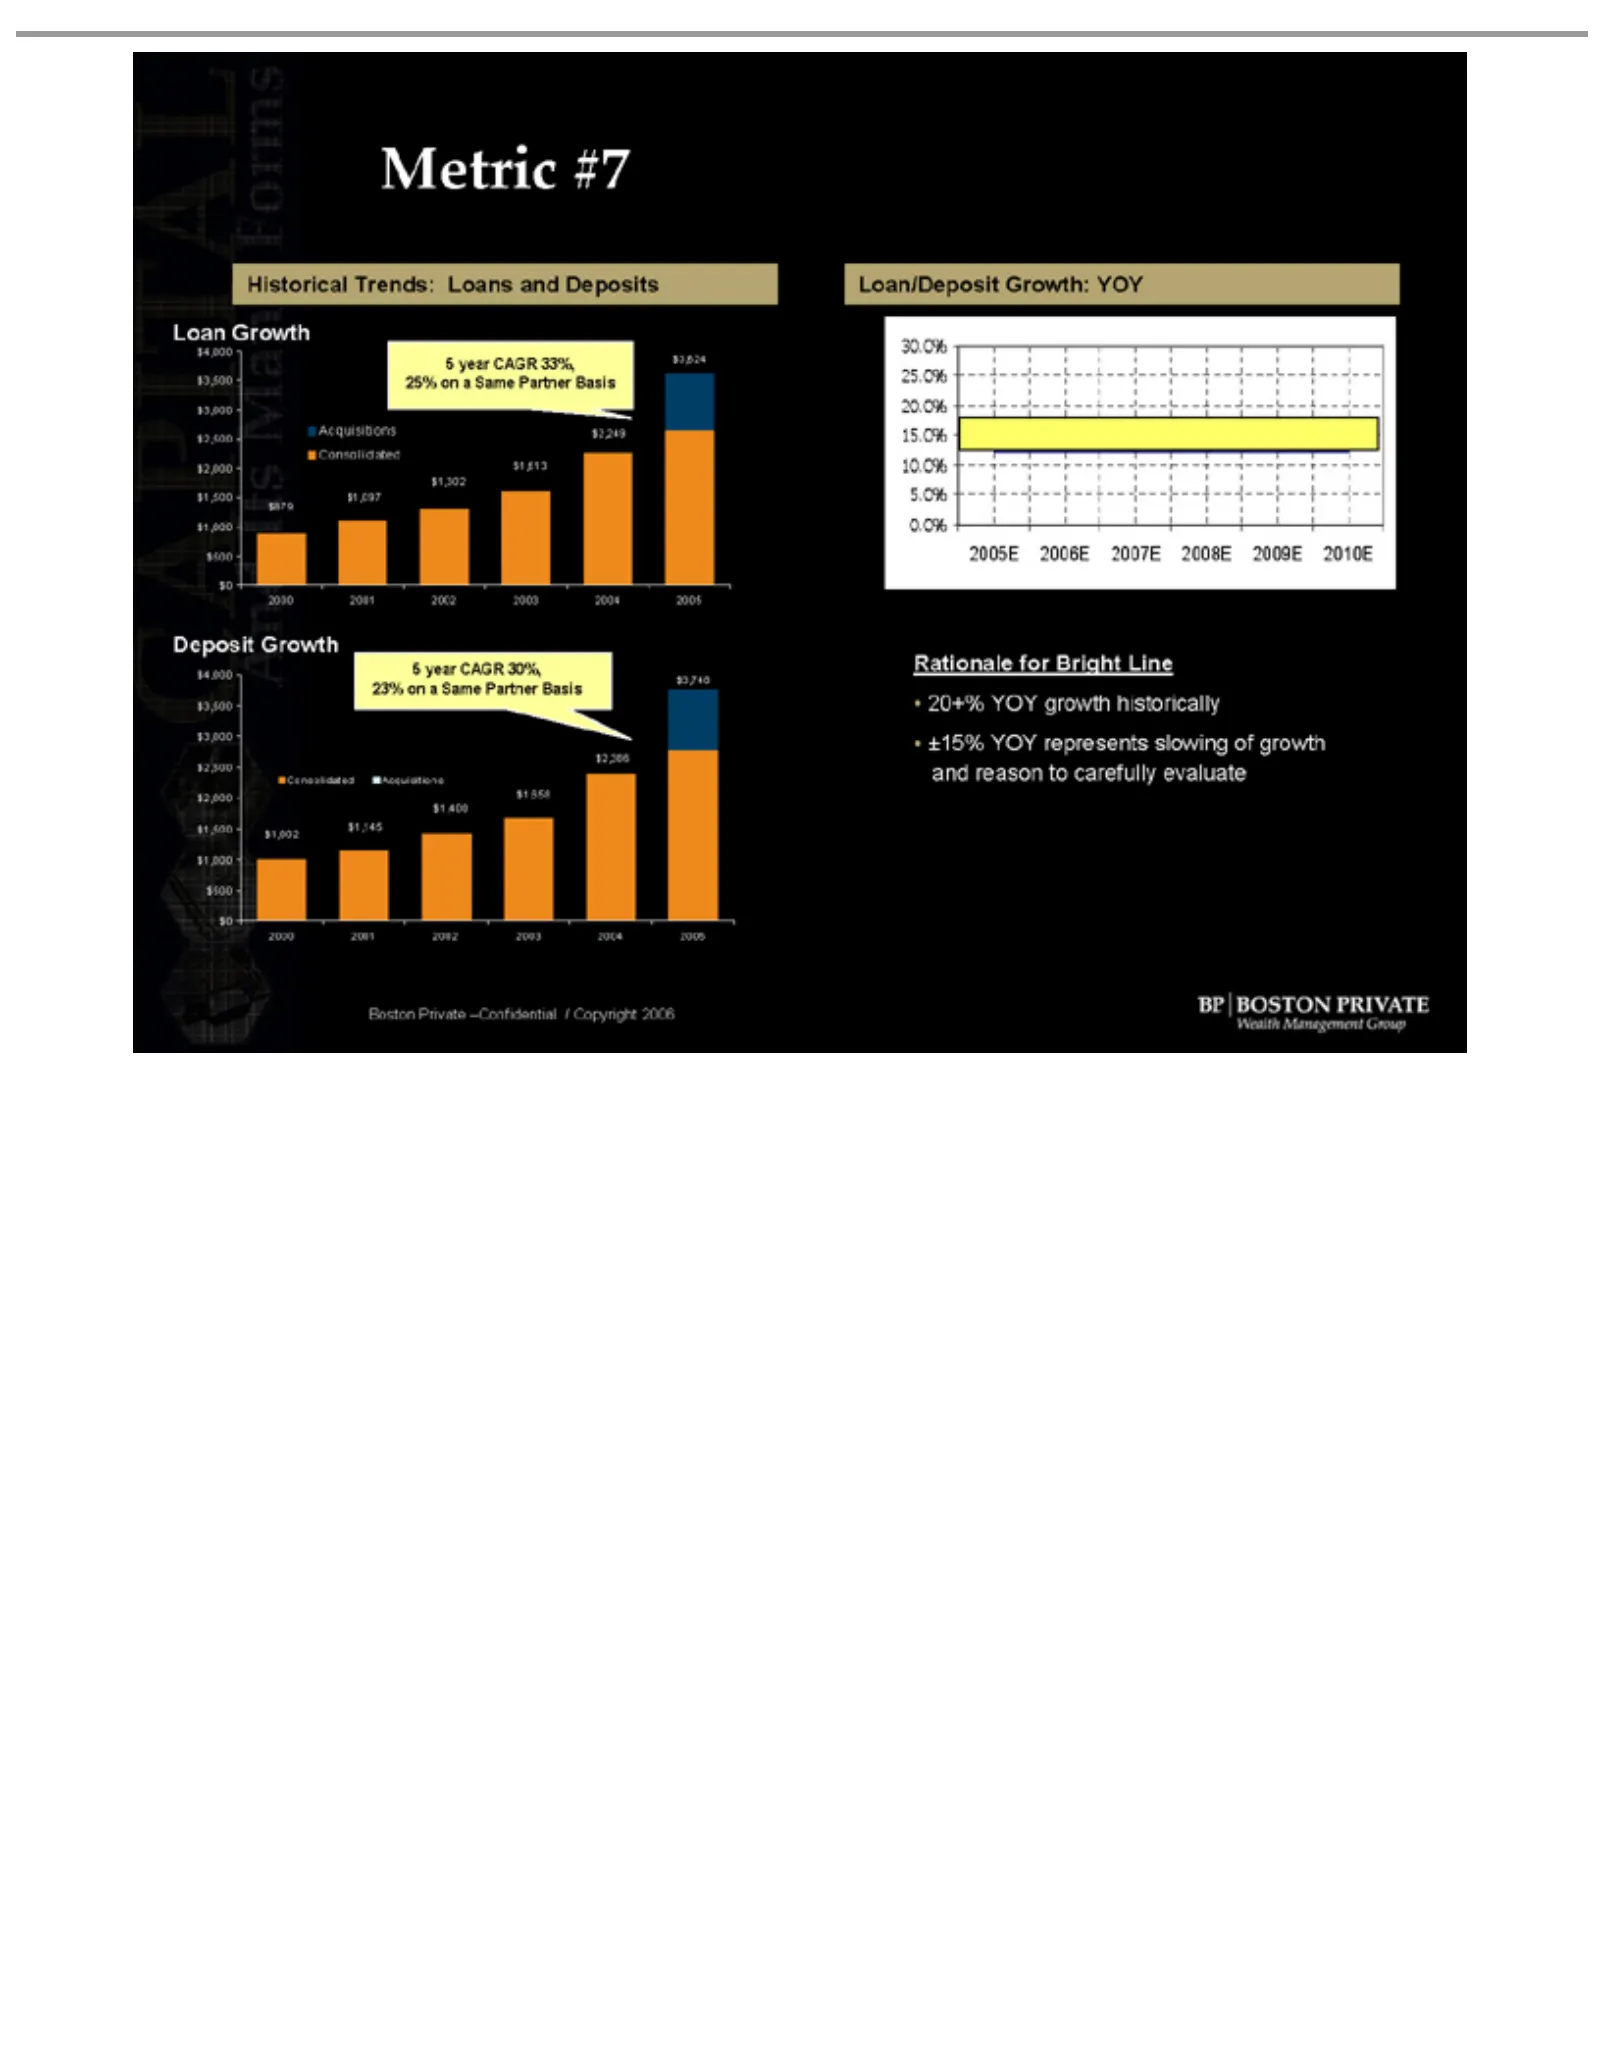
Slide 26: Metric #7: Historical Loan and Deposit Growth
Metric Historical Loan 25% Deposit $3,624 $2,249 $1,613 $1,302 $1,097 $879 and 23% $ 2002 2001 2000 $3,748 $2,386 $1,658 $1,400 $1,145 $1,002 0.0% 5.0% 10.0% 15.0% 20.0% 25.0% 30.0% Growth #7 Acquisitions 5 •Rationale 20+% ±15% 4,000 3,500 3,000 2,500 2,000 1,500 1,000 0500 reason on Trends: year aG
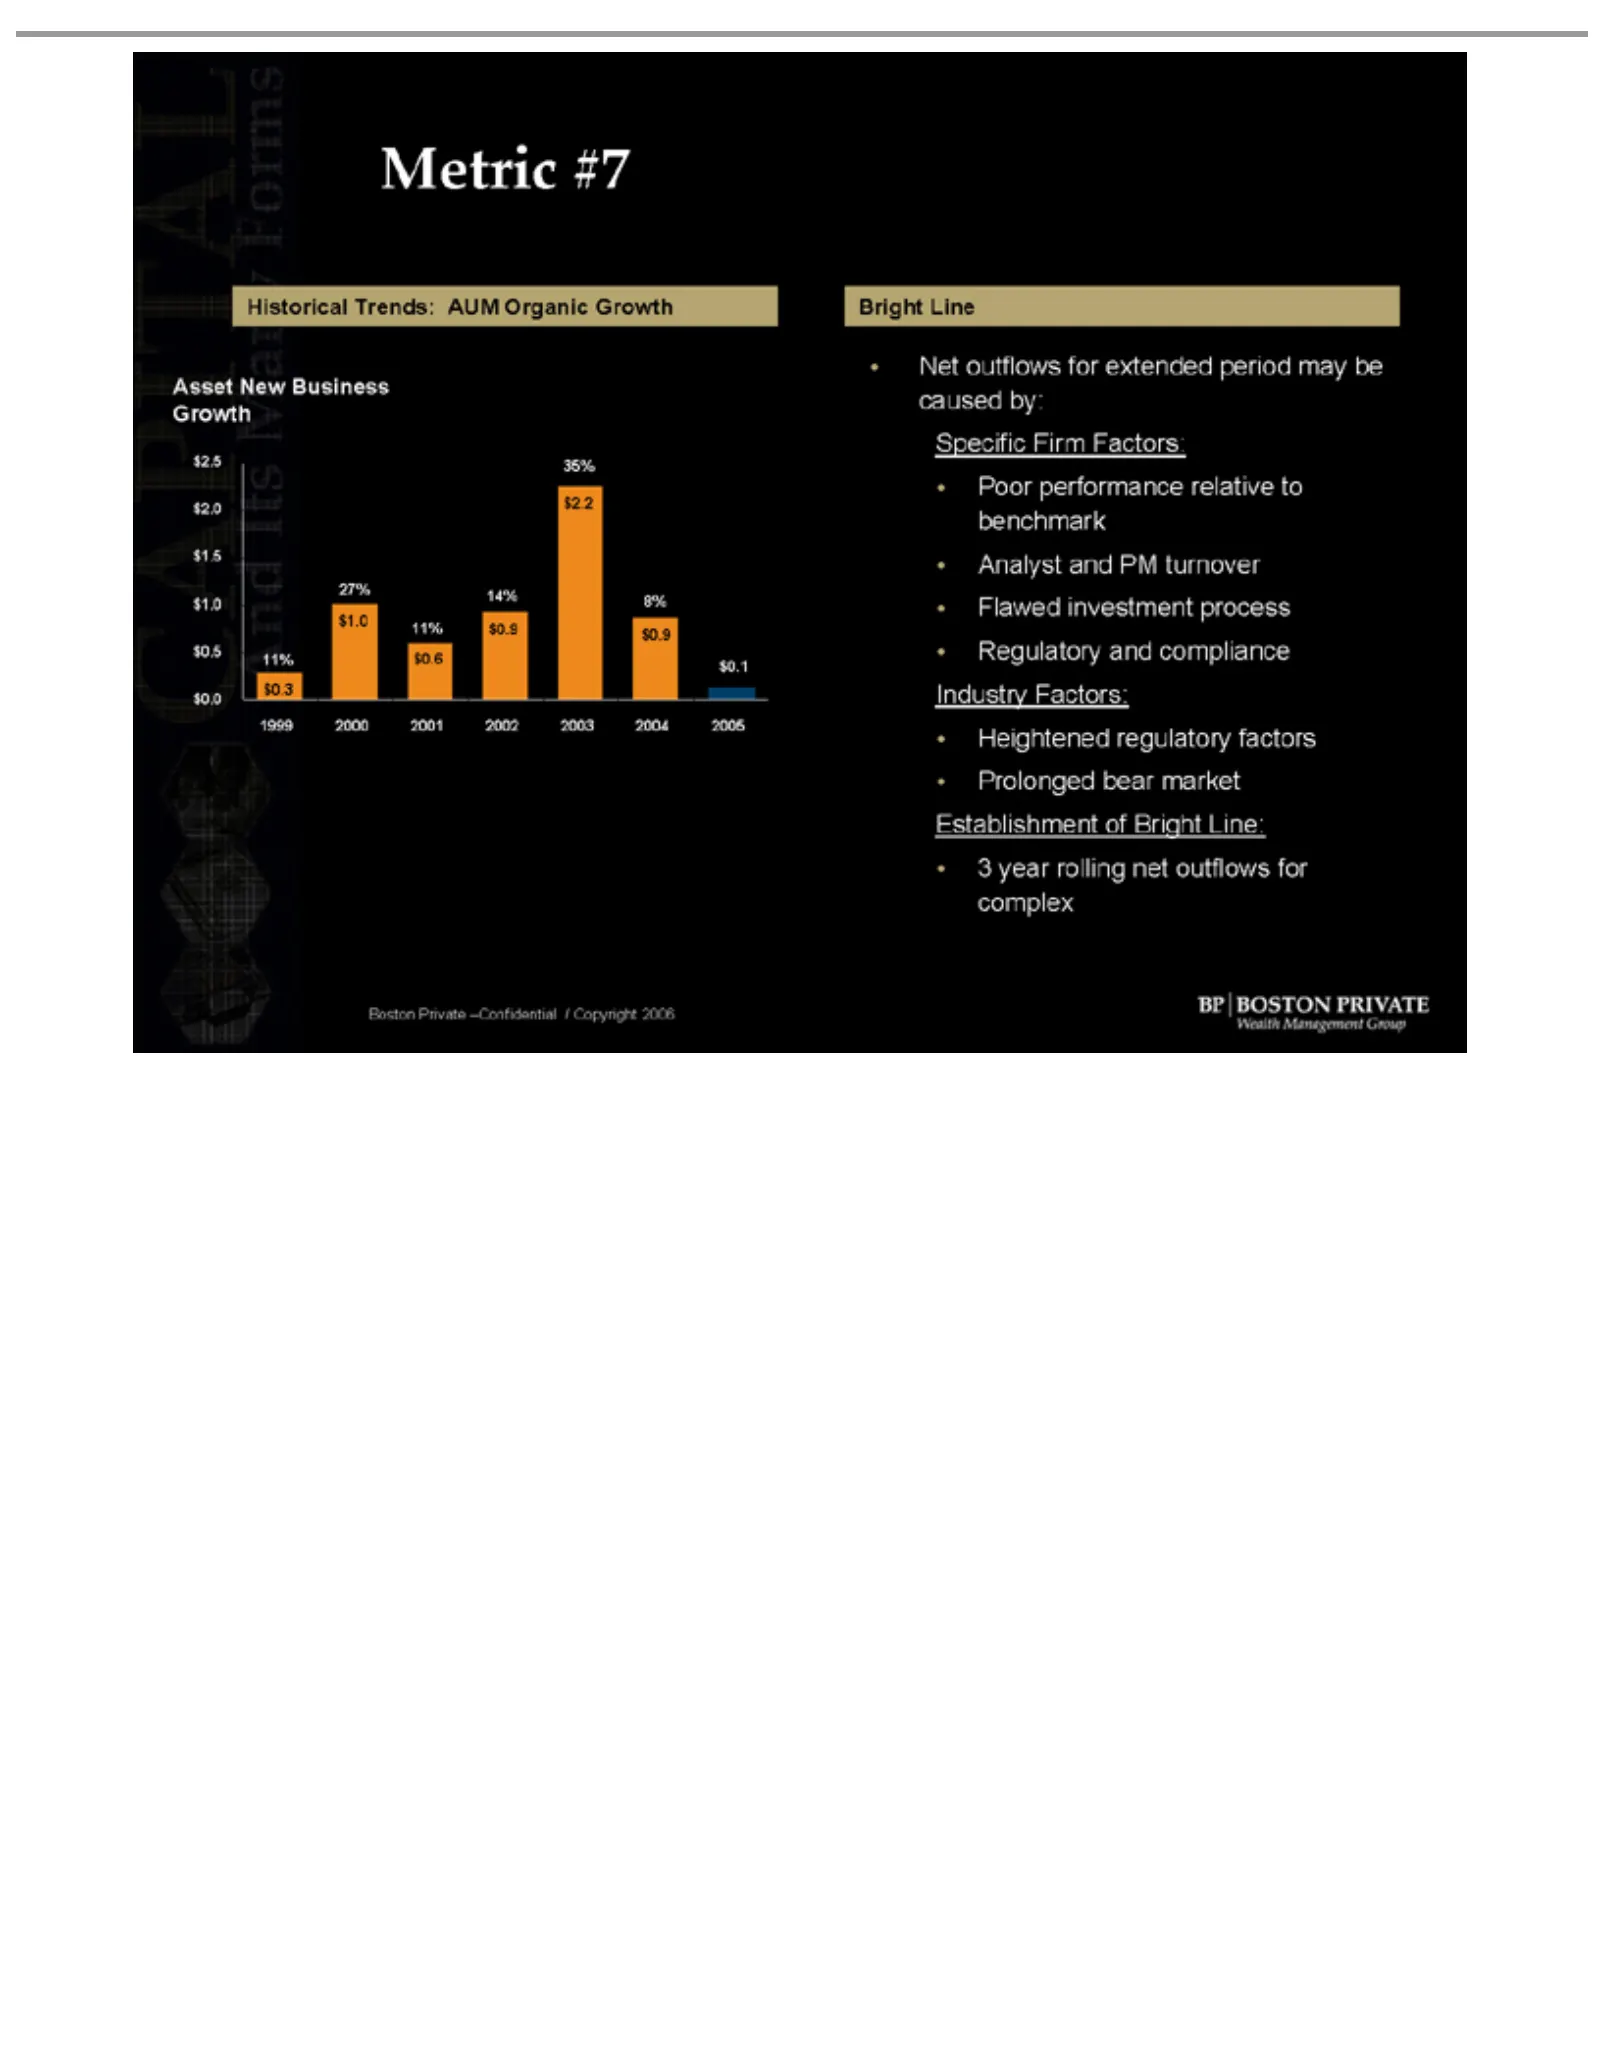
Slide 27: Metric #7: Historical Asset Growth
Metric Historical Asset Growth 27% $0.3 11% 14% $ 35% 1999 $0.1 $0.9 8% Bright Net caused Specific Poor Analyst benchmark Flawed Regulatory Industry Heightened Prolonged Establishment 3 2.5outflows 2.0 1.5 0.5 0.0 1.0 0.6 0.9 2.2 performance 2000 complex Boston New Line #7 by: investment year and Fi
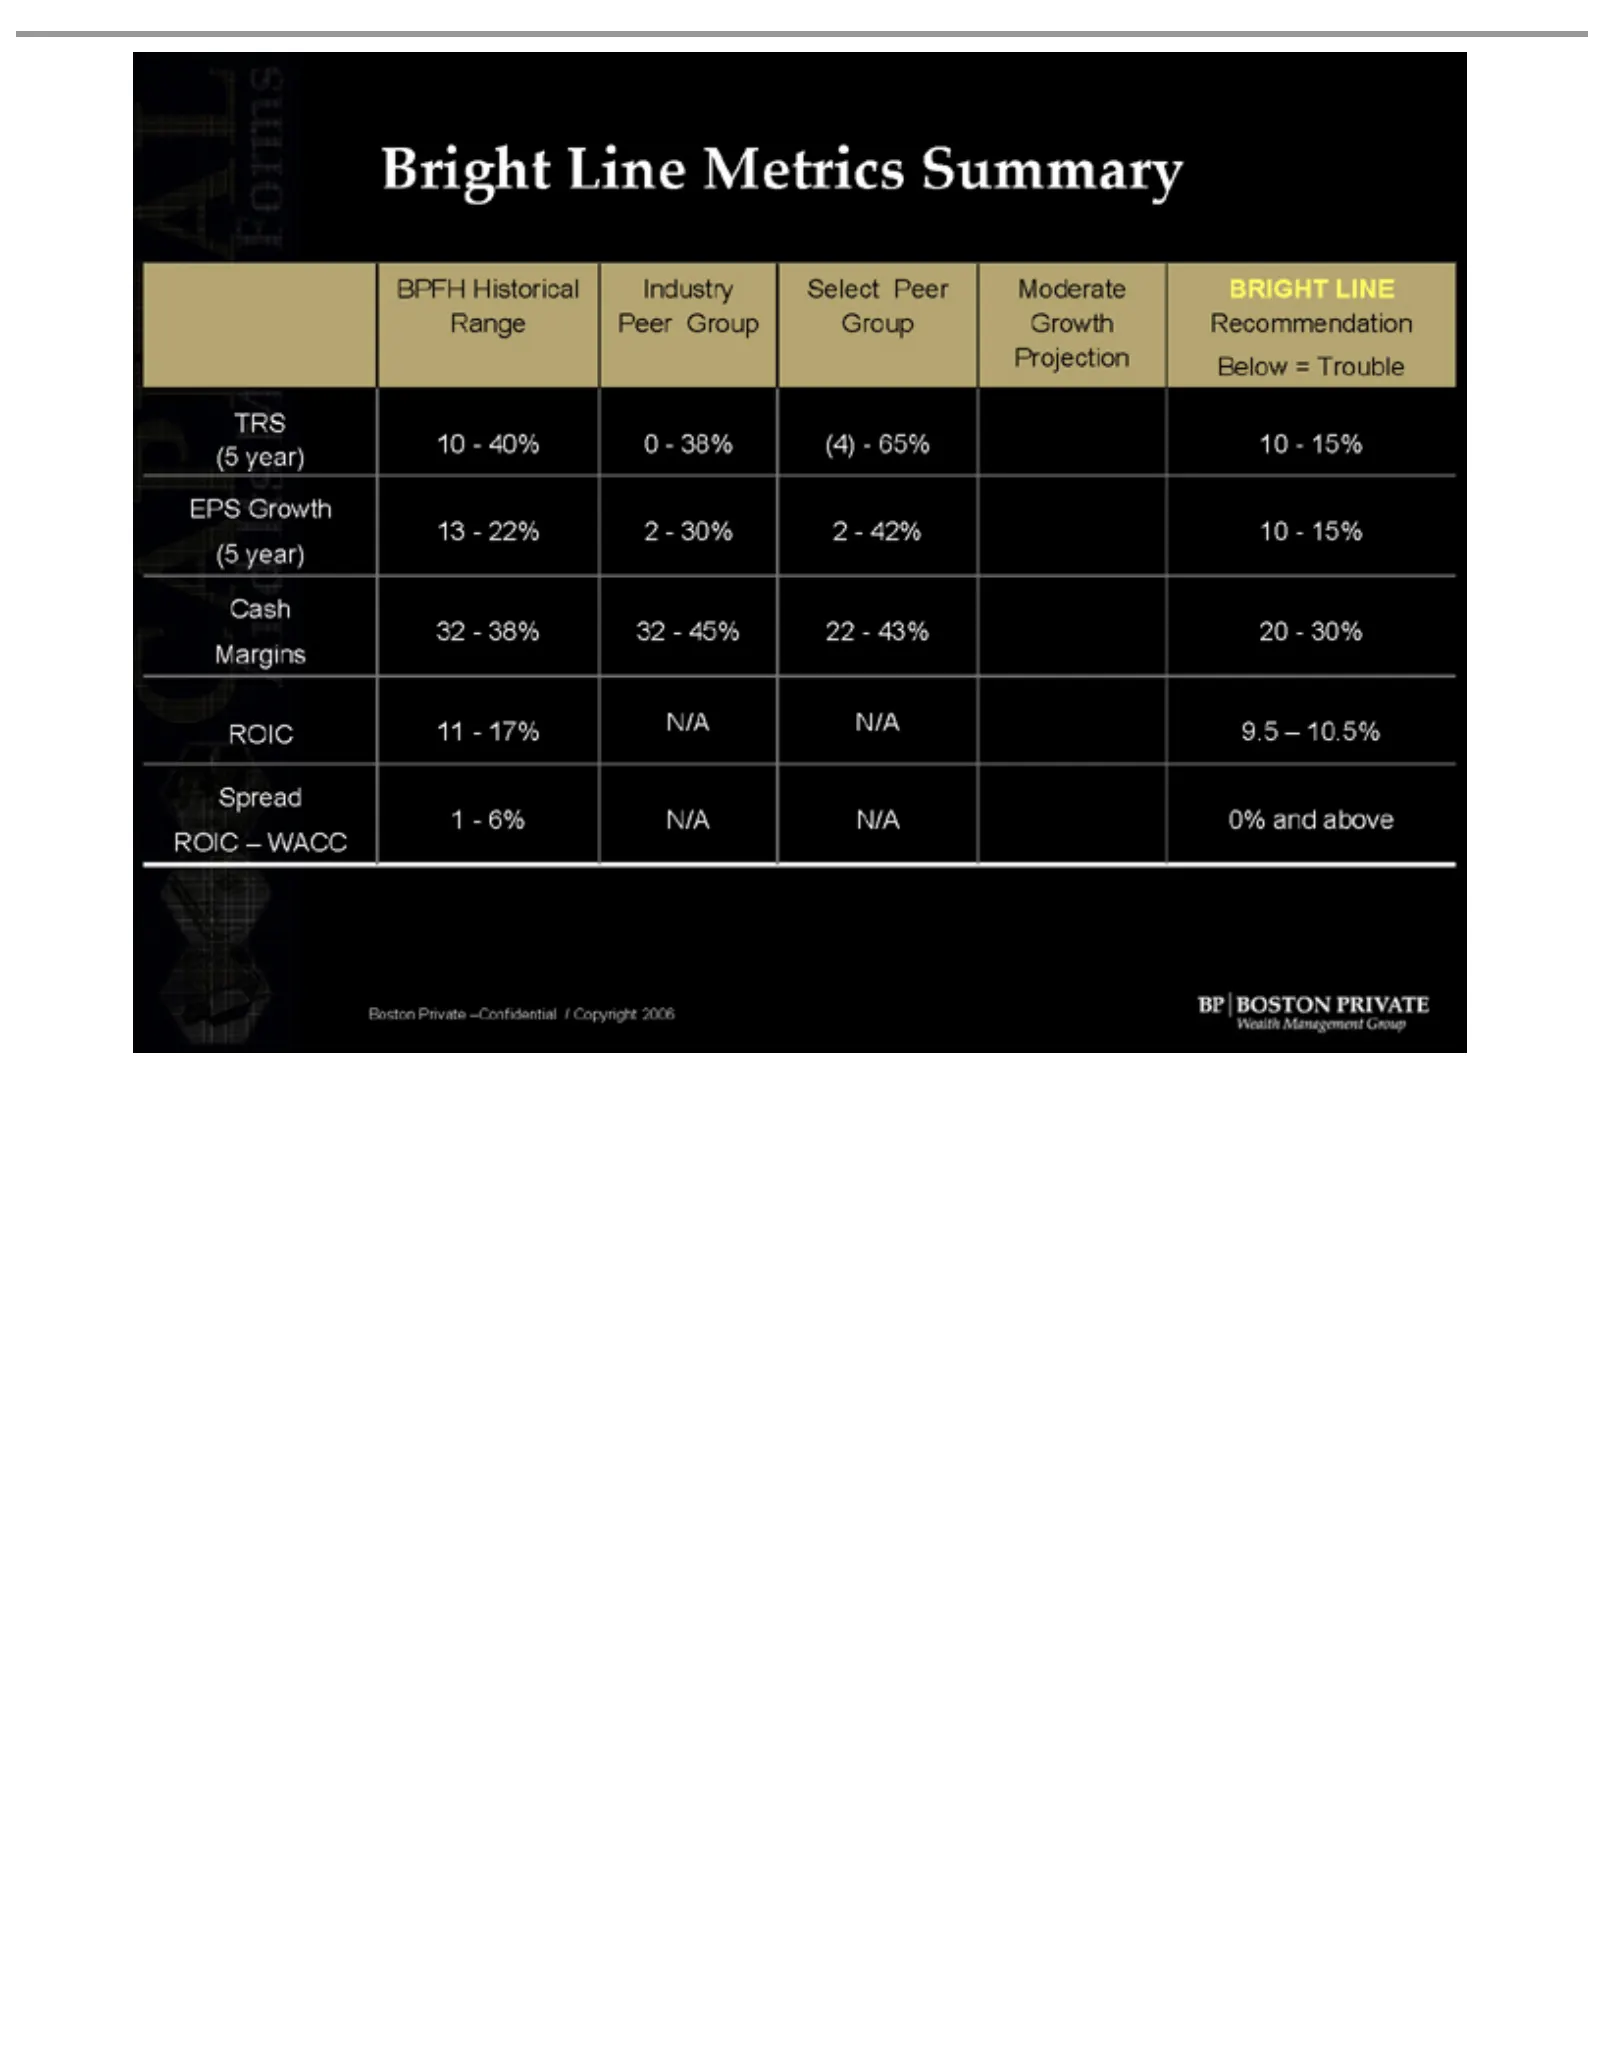
Slide 28: BPFH Bright Line Summary
Bright BPFH Range Line Historical PeerMetrics Group Industry Summary =Group Select -Growth Peer Moderate BRIGHT LINE Projection TRS 10 (5 EPS 13 (5 Cash 32 -year) year) Below 40% --Growth 22% 0 2 -- 38% -30% Trouble (4) 29.5 65%1010 - 42% -Recommendation - 15% 15% Margins 11 ROIC Spread 1 -– 38% ROI

Slide 29: Appendix: Cost of Private Capital Calculations
Cost of Private Appendix Boston Capital –Confidential Calculations / Copyright 2006
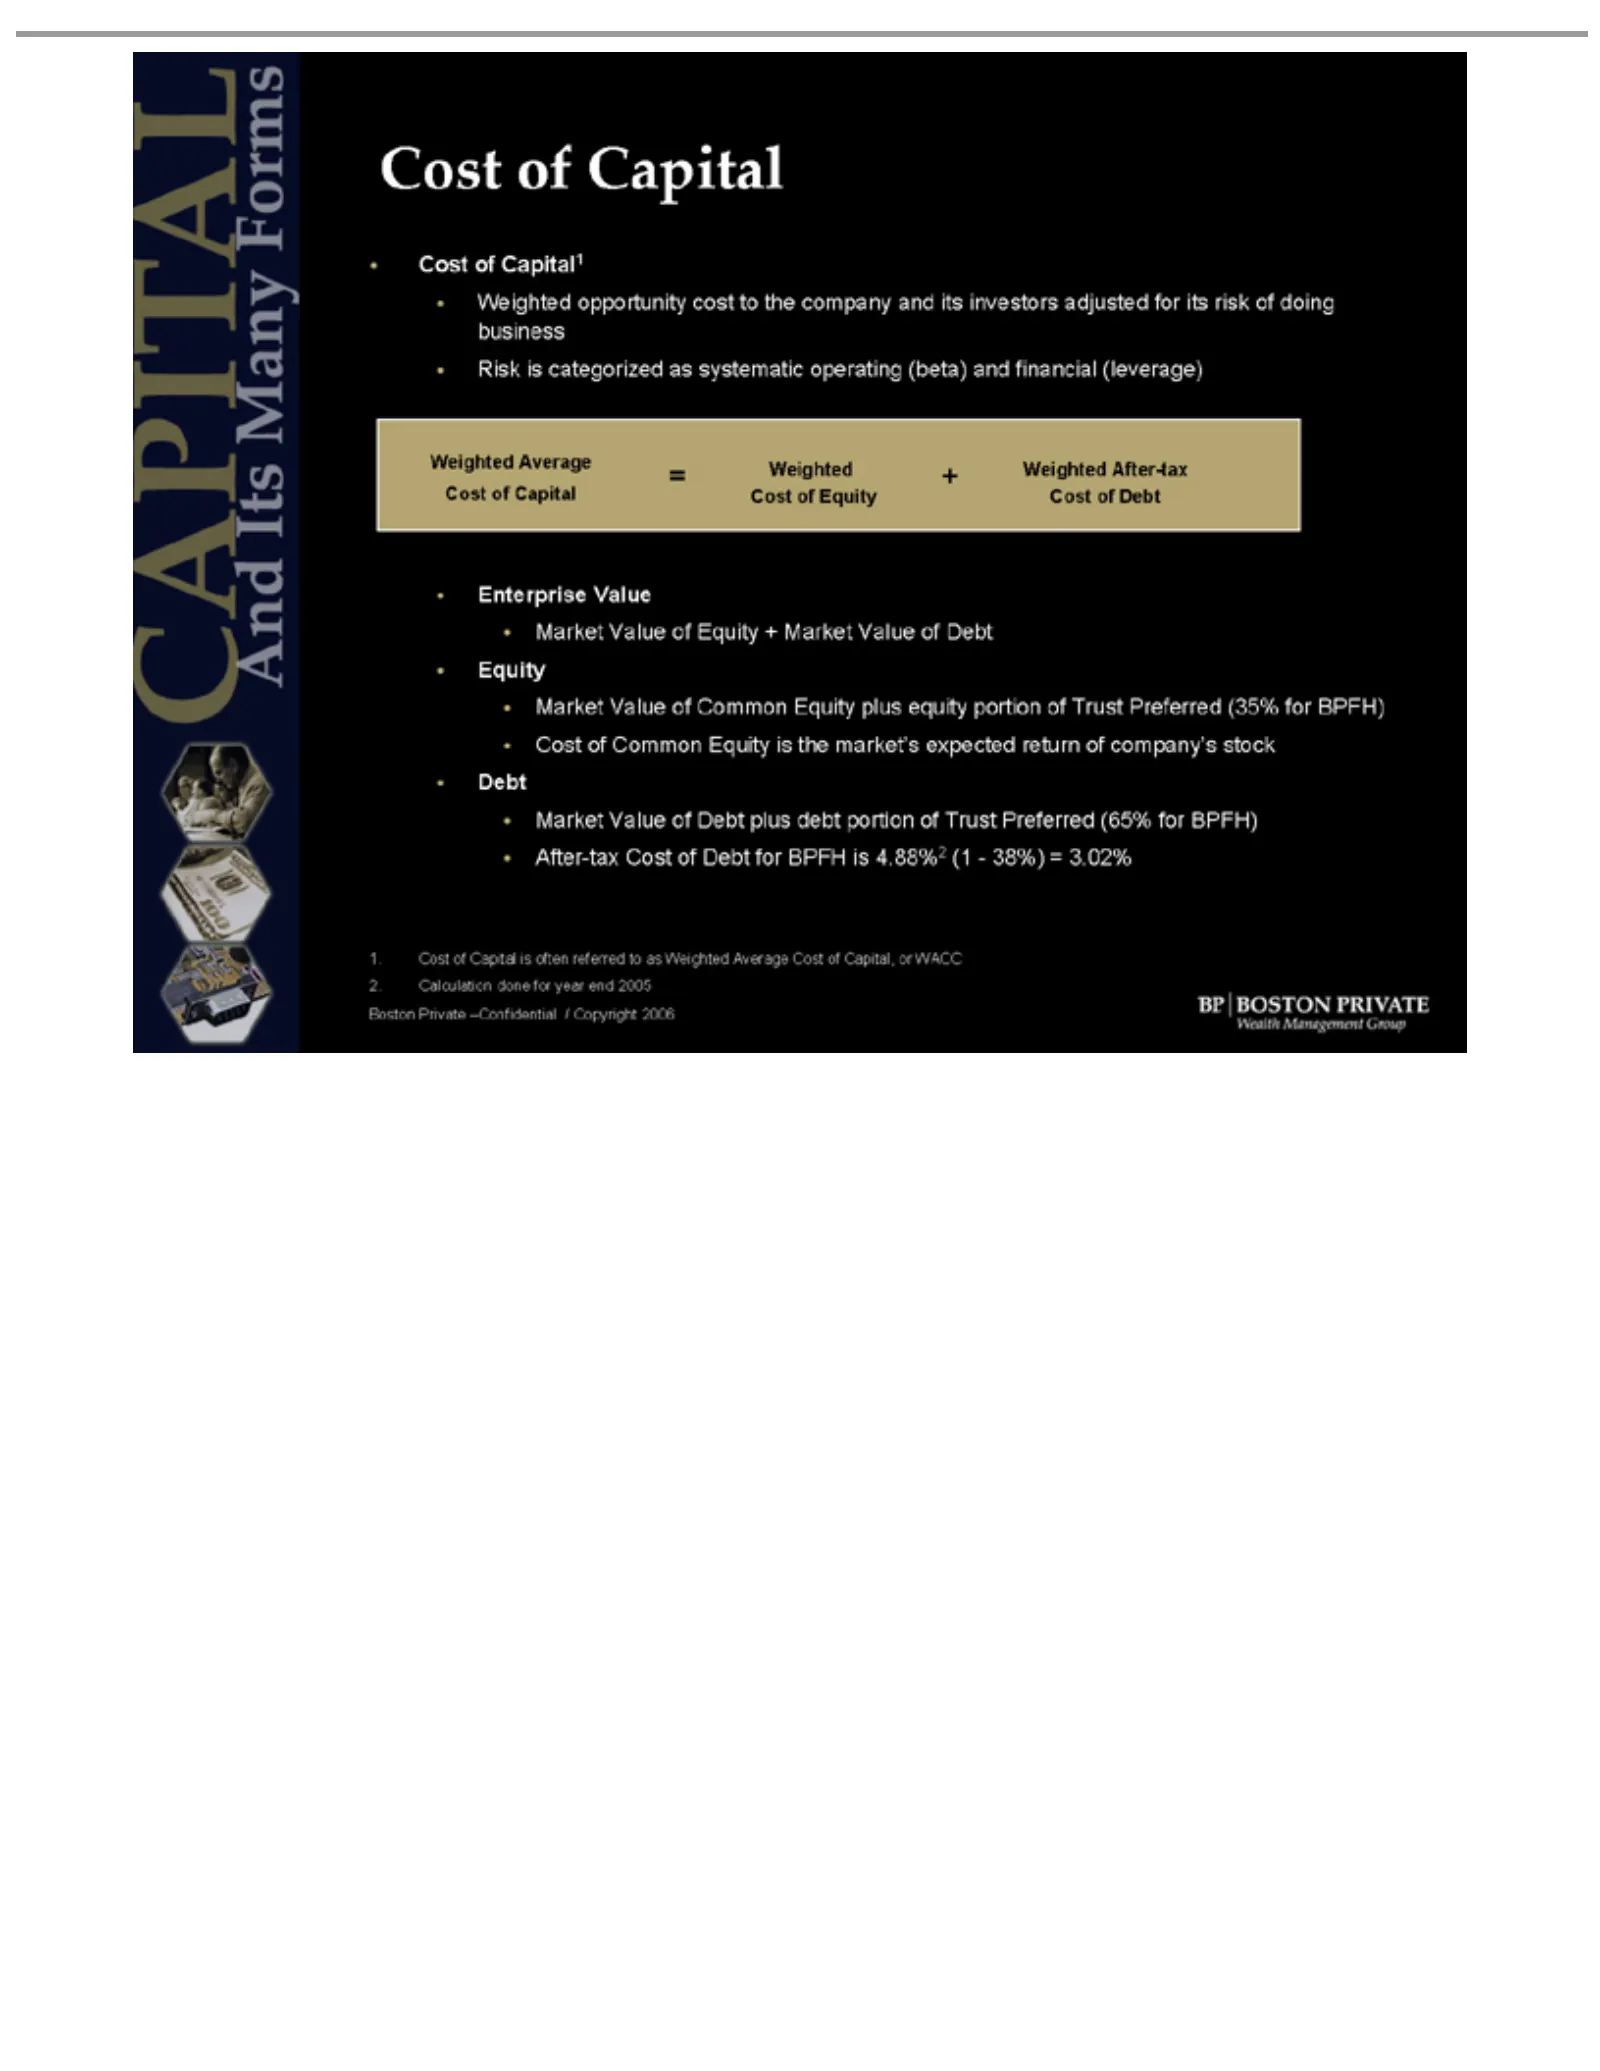
Slide 30: Weighted Average Cost of Capital Calculation
Risk business Weighted is categorized Boston Market Debt Capital opportunity Average ofCost Enterprise Equity Cost After-tax 1. 2. Cost 11 Capital Calculation of of Private Value Common Capital Value of done of as = Cost systematic Weighted cost of –Confidential Equity Common Debt Debt Equity is for
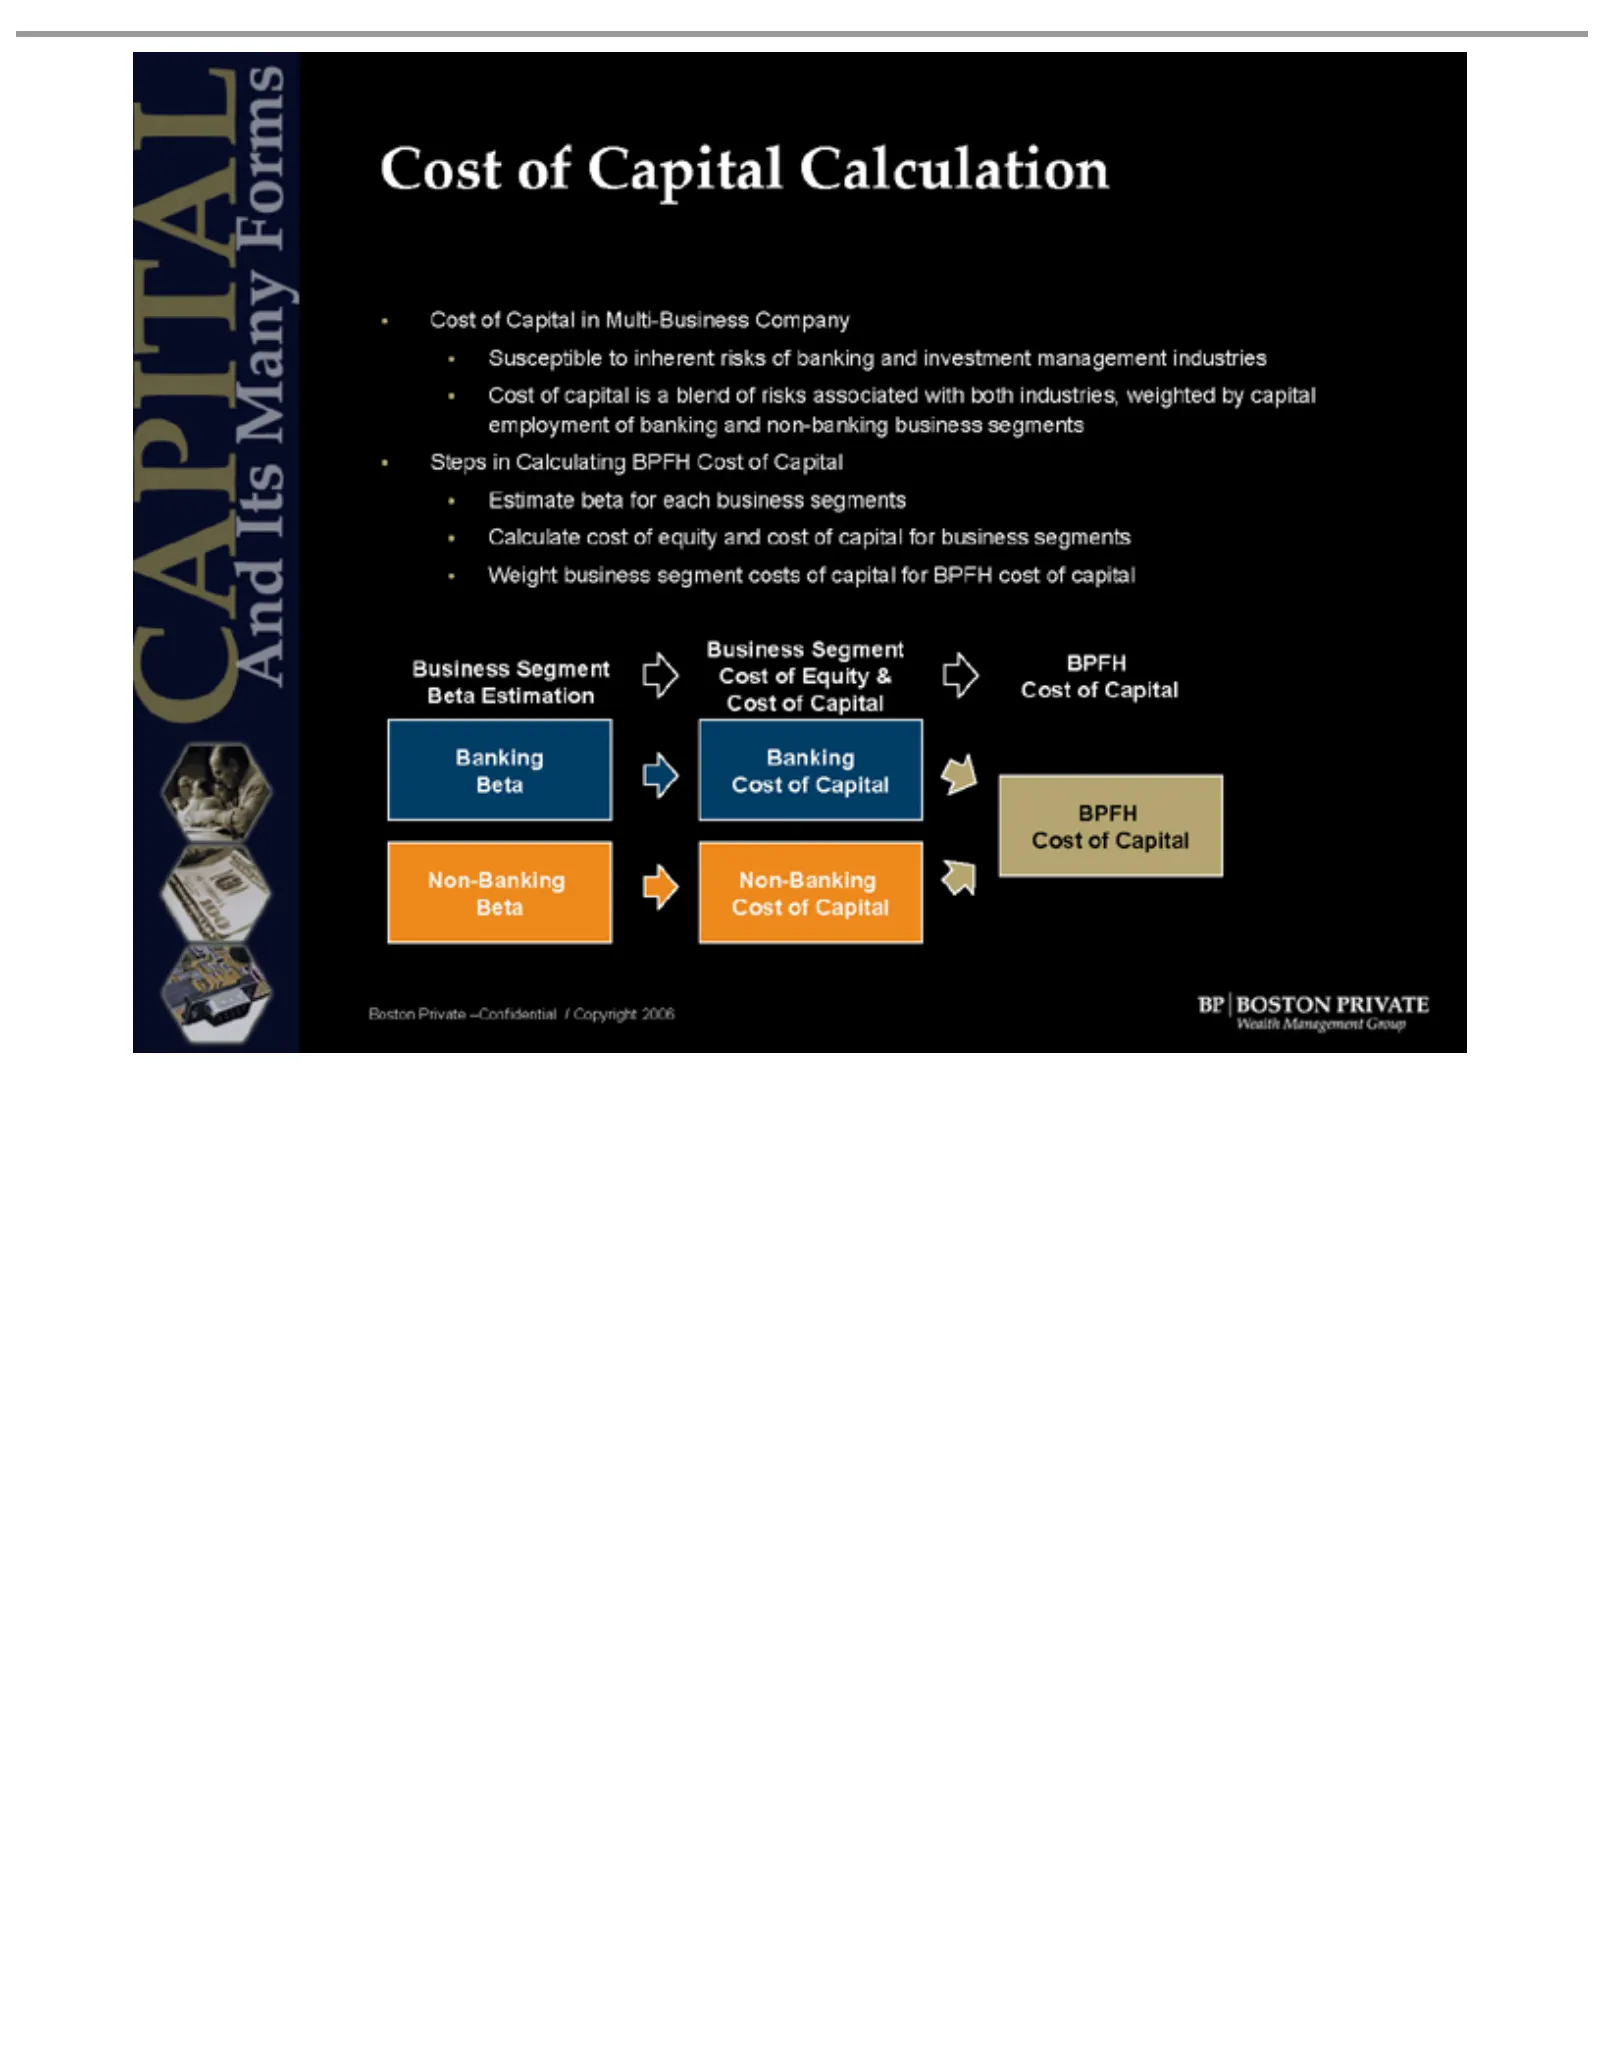
Slide 31: Calculating Cost of Capital for a Multi-Business Company
Susceptible employment Steps Estimate Calculate Weight Business Beta Banking Non-Banking Cost BPFH Boston Estimation ofinPrivate business capital Equity Capital Calculating beta Segment cost tooffor of inherent is & –Confidential Calculation in banking segment equity aeach Multi-Business blend BPFH
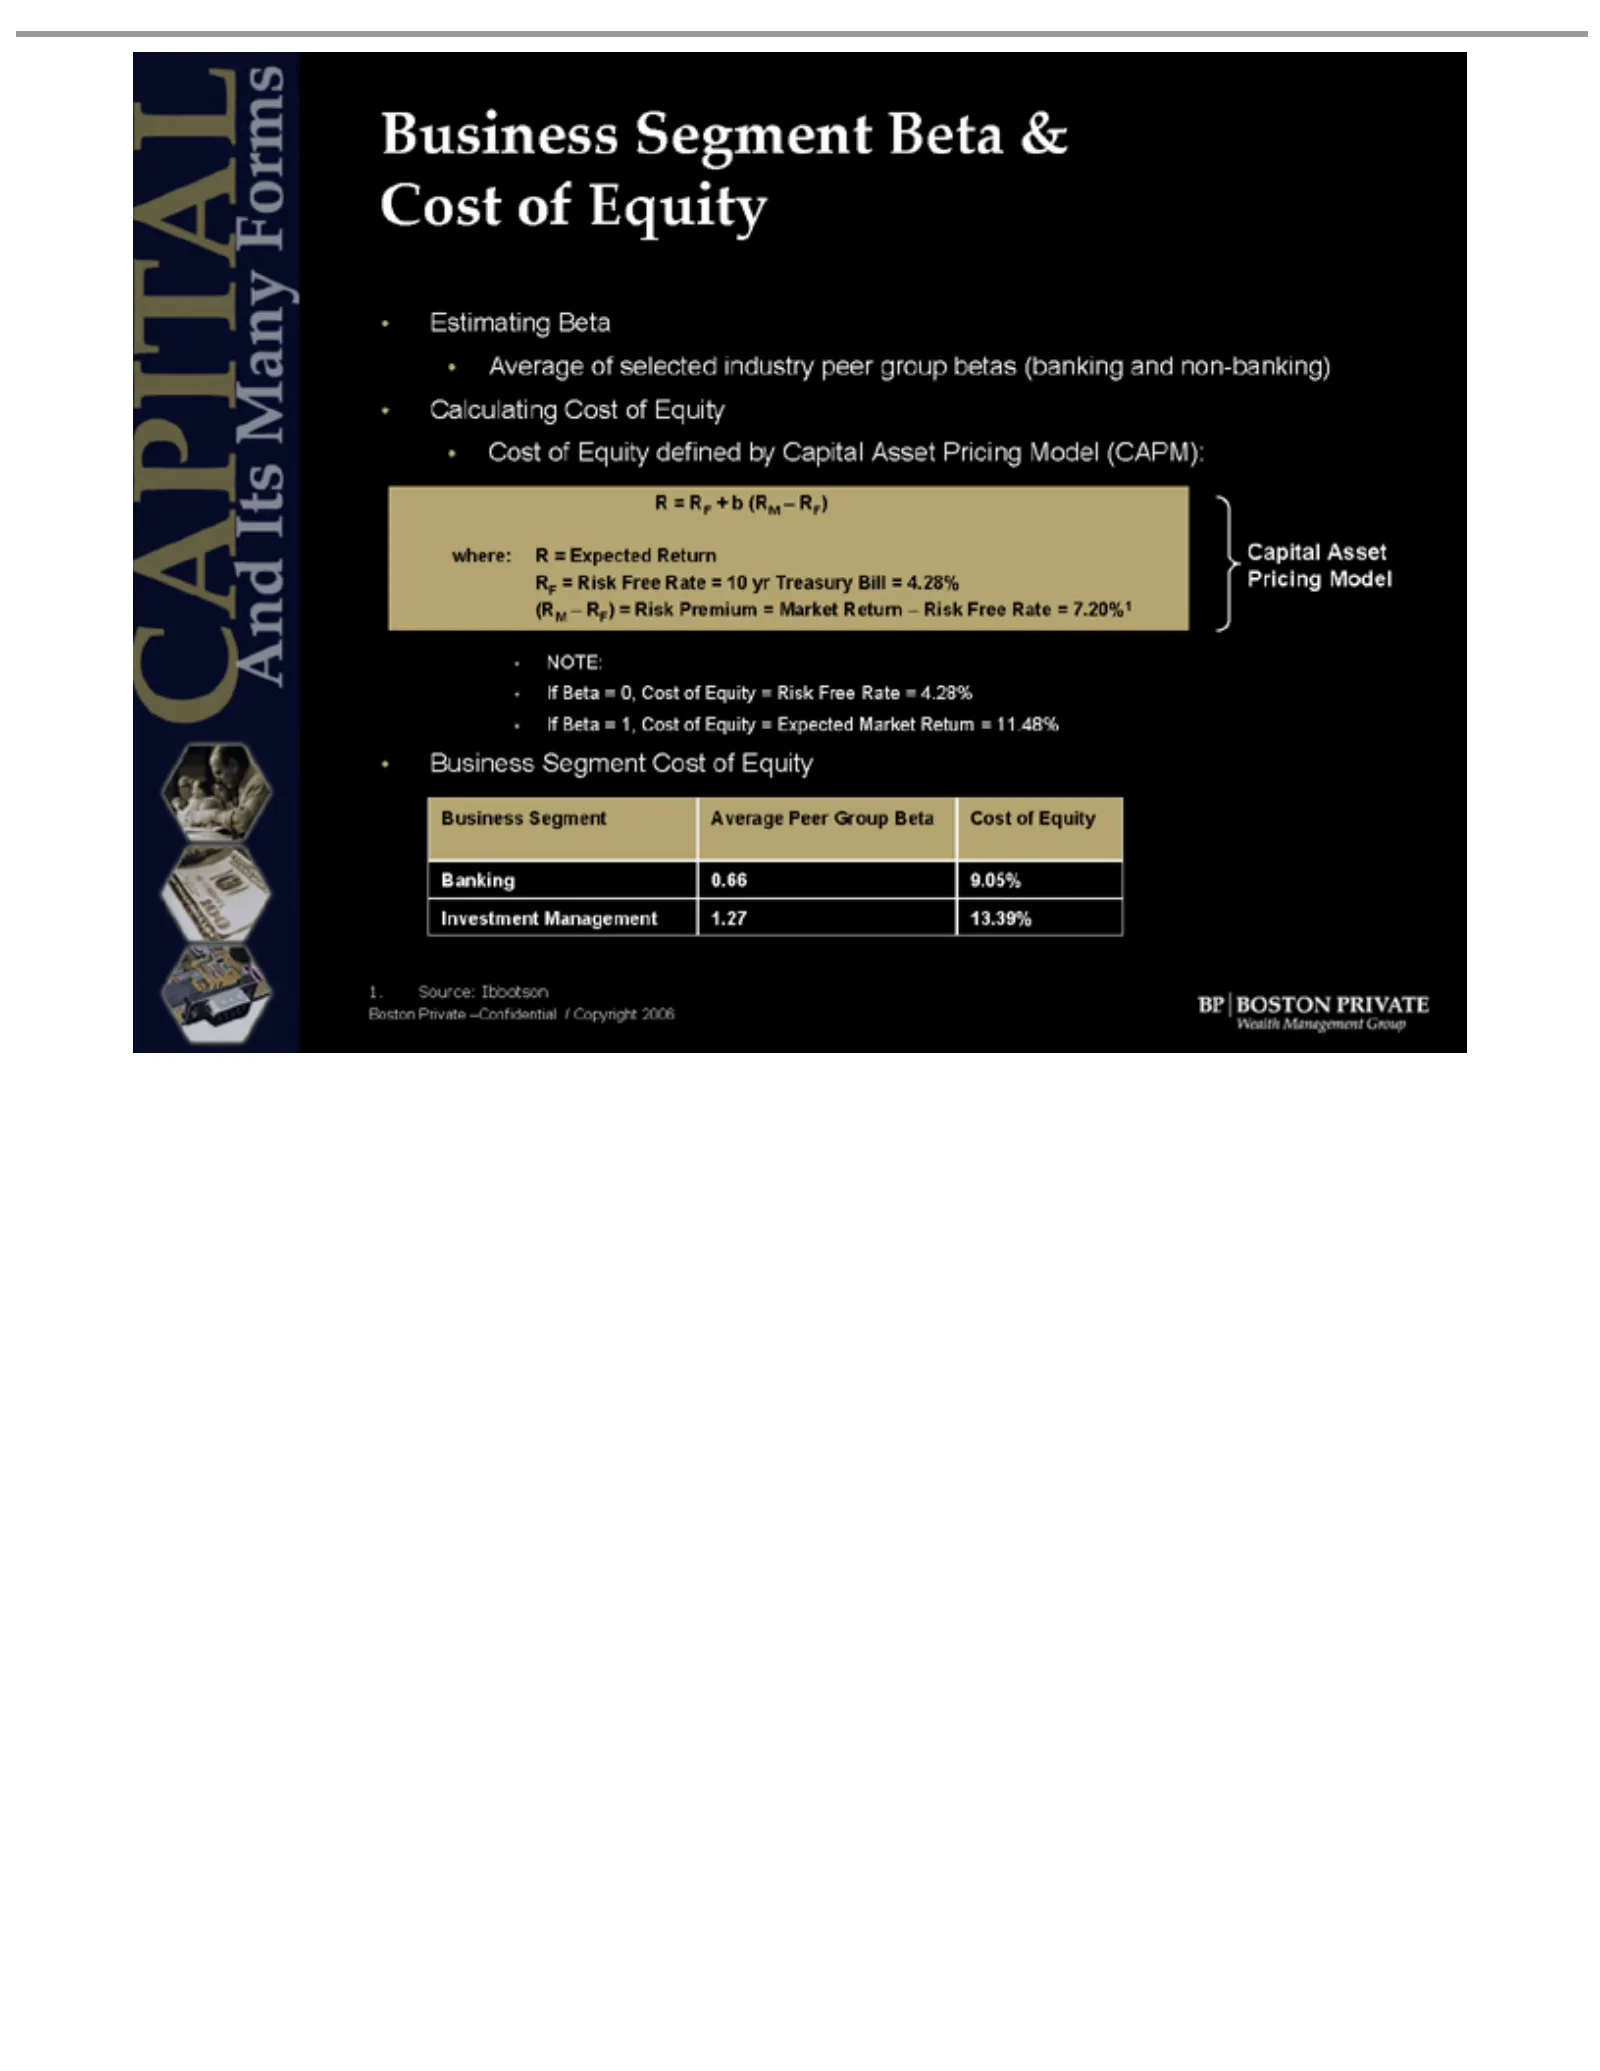
Slide 32: Estimating Cost of Equity: Capital Asset Pricing Model
Estimating Average Calculating Cost R where: RF (RM Capital Pricing NOTE: If Business Beta =Source: =RF Bankingof –Risk RF) Investment Boston 1. R =Asset Model Equity +of Segment 0, 1, =b0.66 Segment Free Beta selected = Expected (RM Cost PrivateRisk defined Rate of – Cost Beta Premium RF) 9.05%Equi
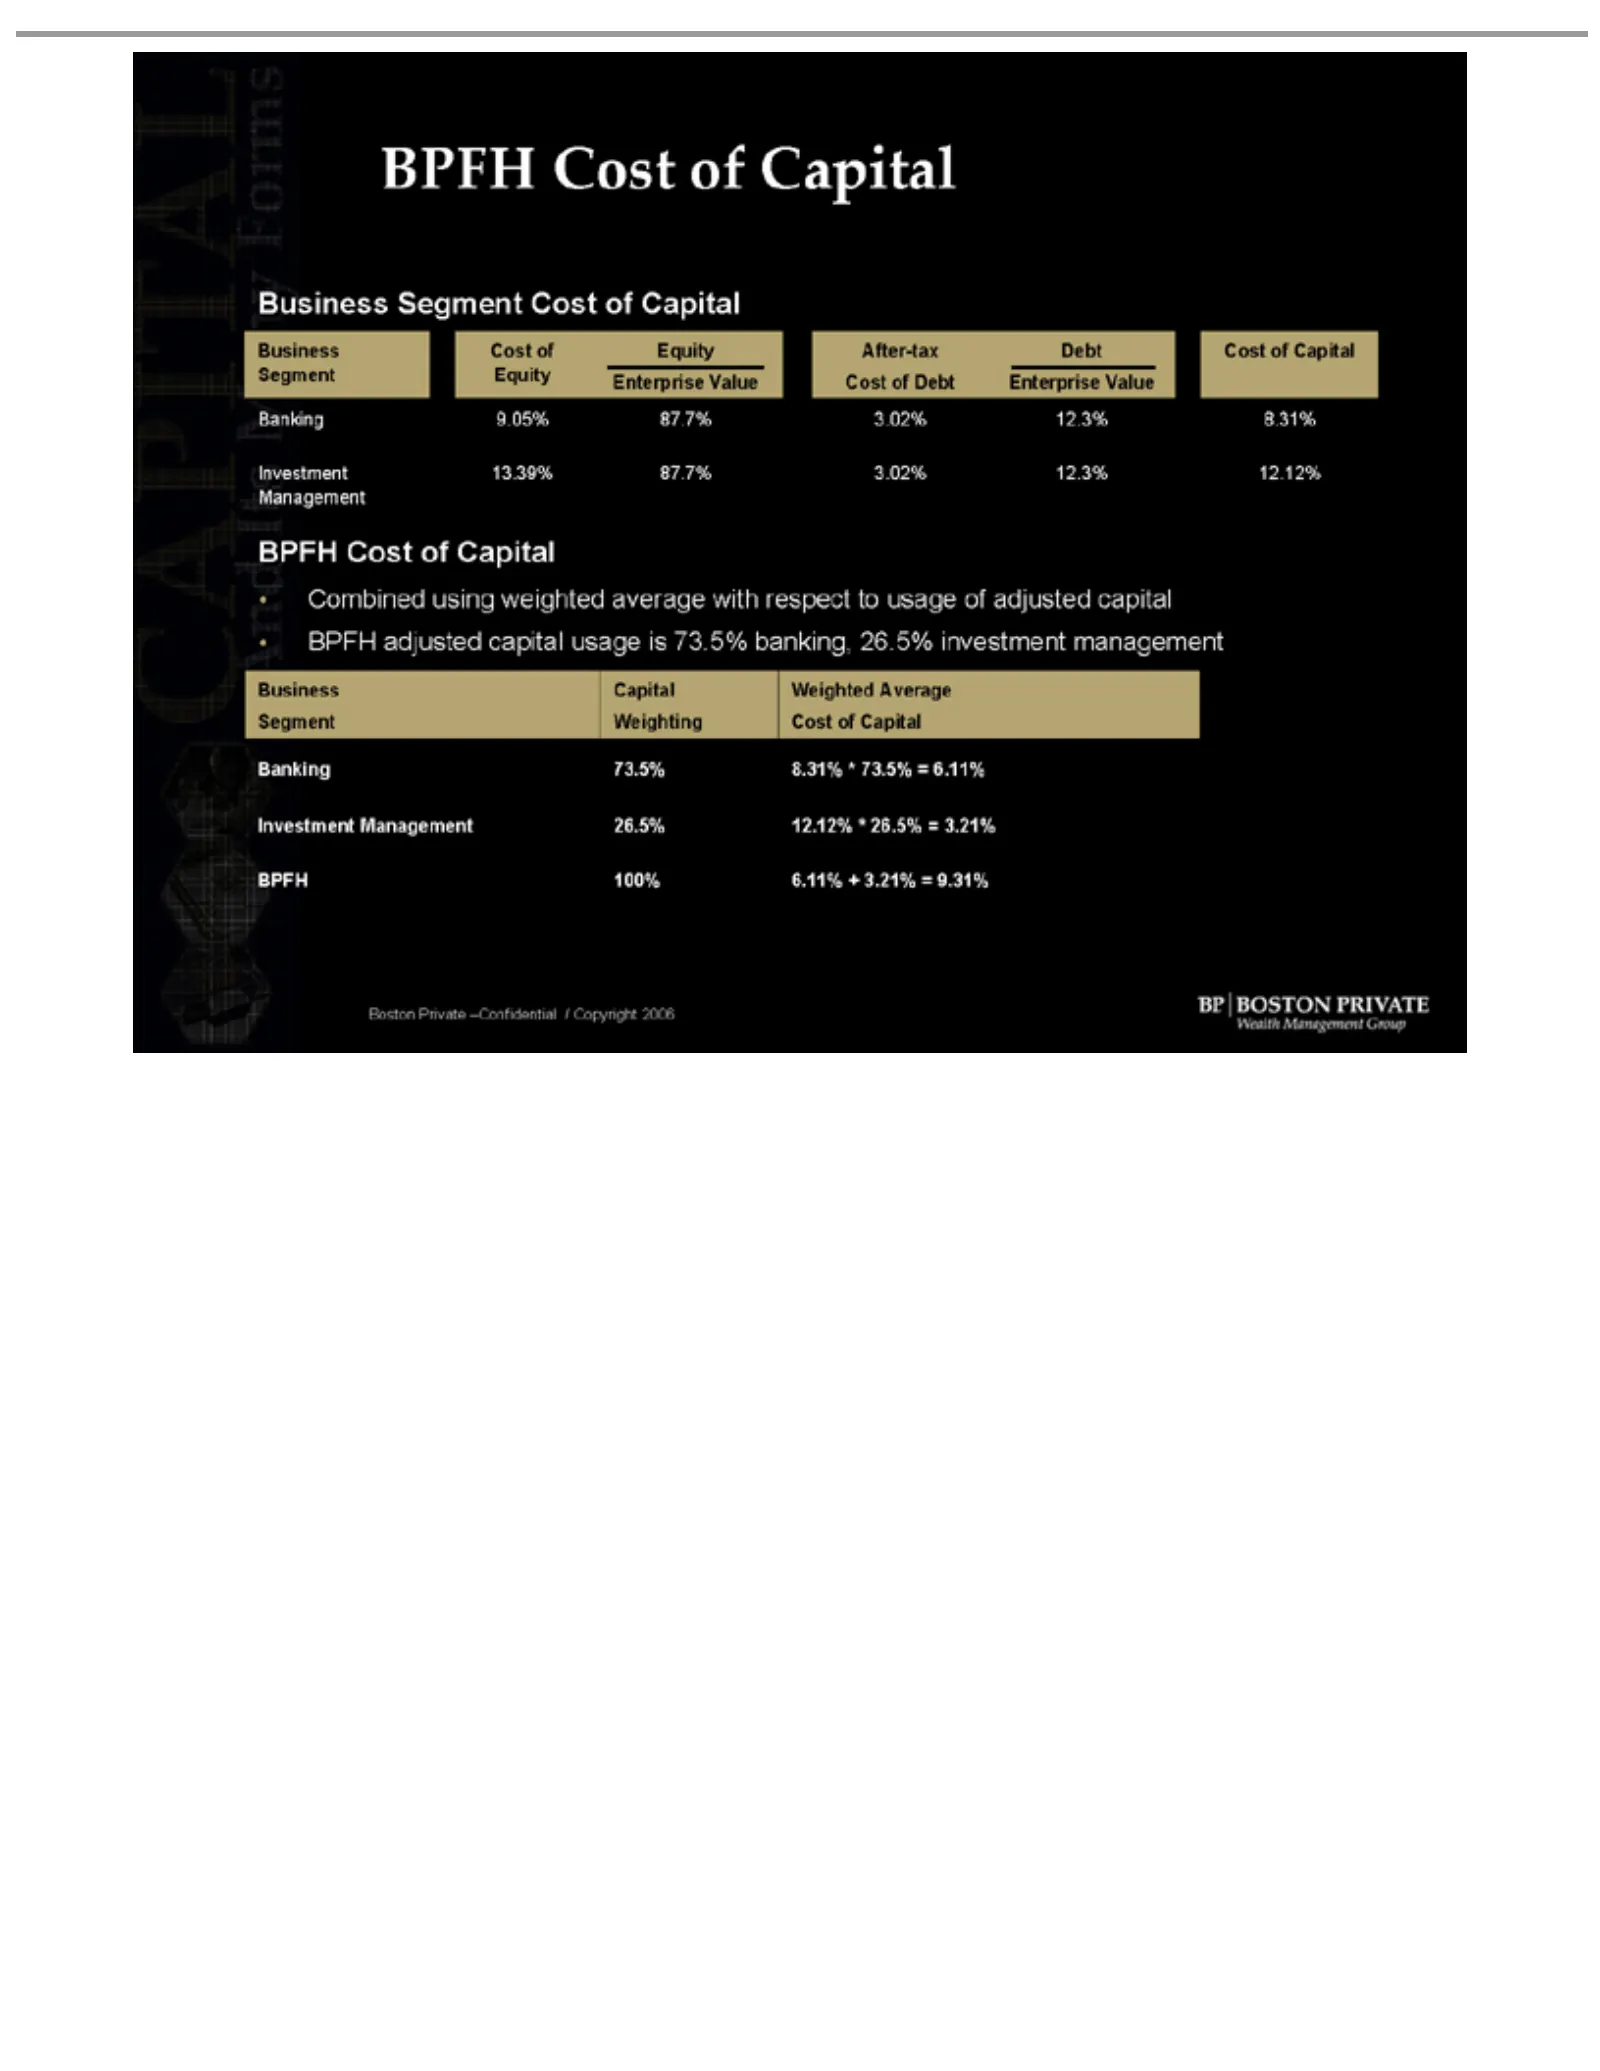
Slide 33: BPFH Business Segment Cost of Capital
BPFH Business Cost Segment Banking Segment InvestmentCost of Capital Equity 9.05% ofweighted Equity Cost ofAfter-tax Capital Enterprise 87.7% of13.39% Value 3.02% 87.7% Debt Cost 12.3% Cost of 8.31% ofto Debt Capital Enterprise of Value Management Combined BPFH Business Cost adjusted Segment Banking
Source: SEC EDGAR · 8-K filed Mar 28, 2006
More decks from Boston Private Financial Holdings Inc
 Proxy Contest (April 2021)28 slides · Apr 9, 2021
 Merger or Acquisition (April 2021)24 slides · Apr 7, 2021
 Proxy Contest (March 2021)50 slides · Mar 30, 2021
 Proxy Contest (February 2021)67 slides · Feb 2, 2021
 Merger or Acquisition (January 2021)15 slides · Jan 4, 2021
 Investor Day (May 2019)52 slides · May 6, 2019