Fenix Parts — Investor Presentation (April 2016)
26 slides from Fenix Parts's investor presentation, Apr 14, 2016
Slide 1: Investor Presentation April 2016
Investor Presentation April 2016
Slide 2: Safe Harbor Statement
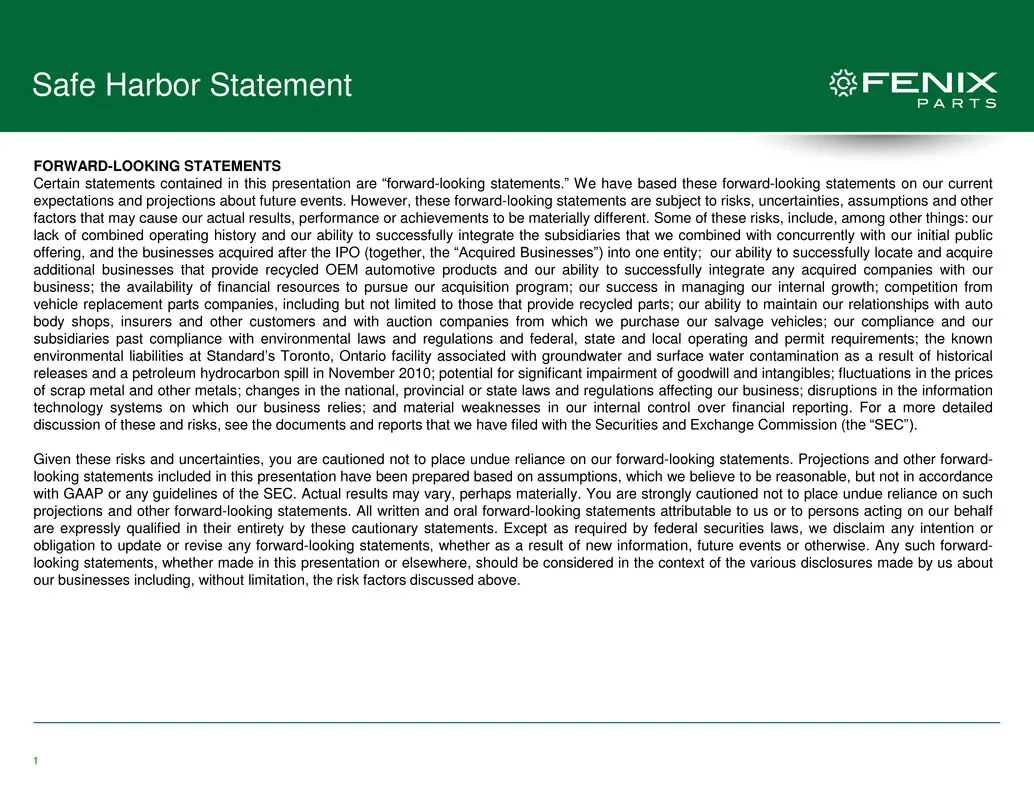
1 Safe Harbor Statement FORWARD-LOOKING STATEMENTS Certain statements contained in this presentation are “forward-looking statements.” We have based these forward-looking statements on our current expectations and projections about future events. However, these forward-looking statements are subject
Slide 3: A Look Into Fenix Parts
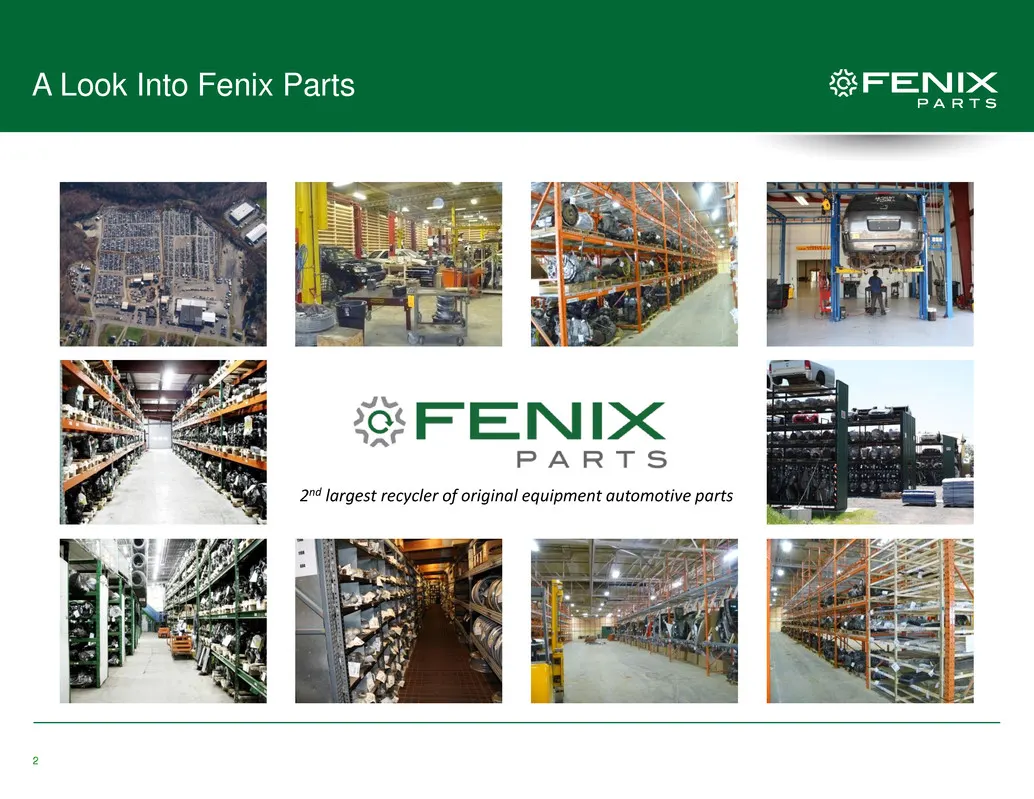
2 A Look Into Fenix Parts 2nd largest recycler of original equipment automotive parts
Slide 4: Presenters
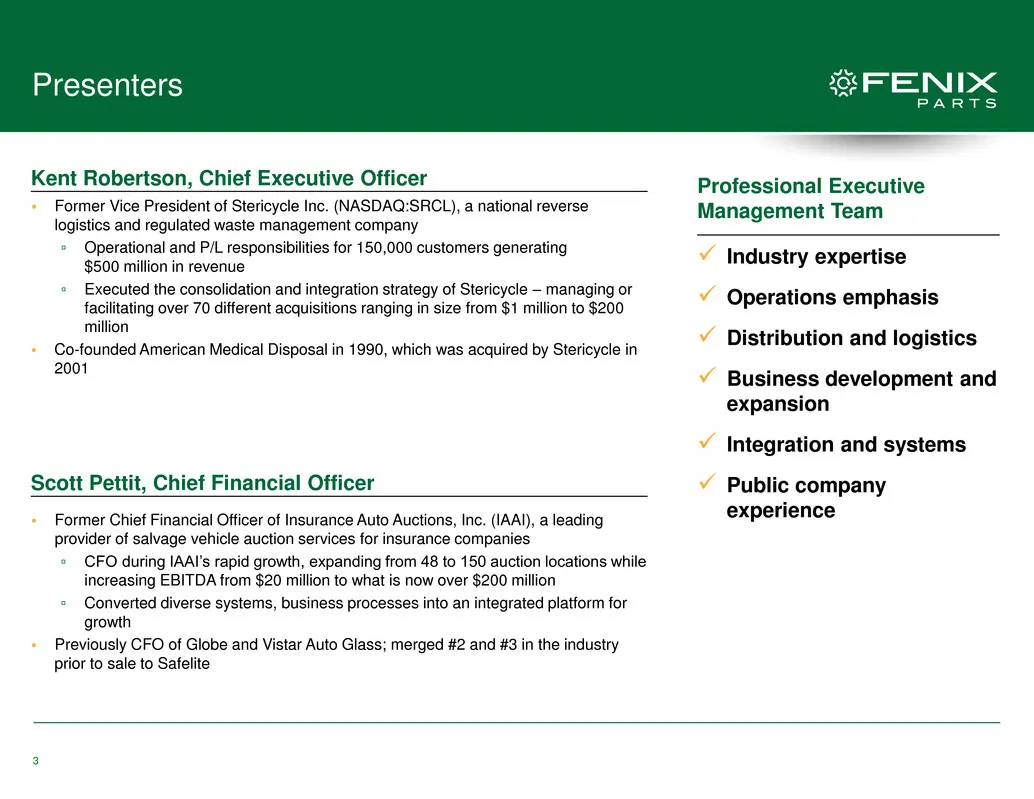
3 Presenters • Former Vice President of Stericycle Inc. (NASDAQ:SRCL), a national reverse logistics and regulated waste management company ▫ Operational and P/L responsibilities for 150,000 customers generating $500 million in revenue ▫ Executed the consolidation and integration strategy of Stericyc
Slide 5: Why Invest in Fenix Parts?
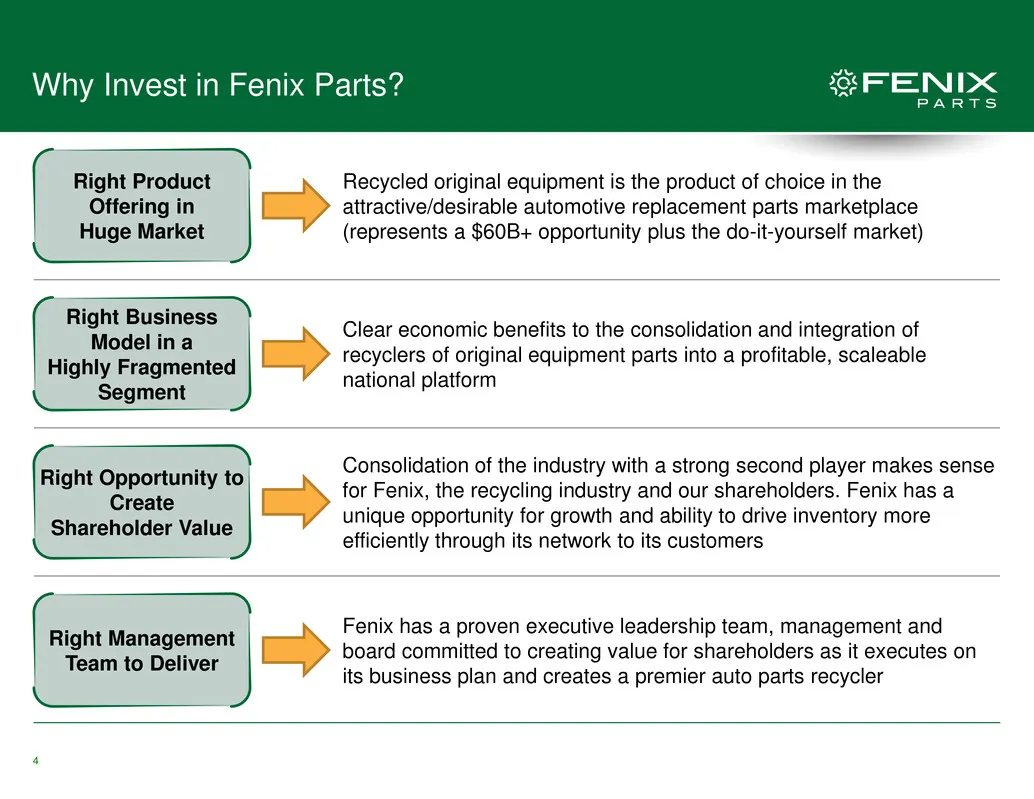
4 Why Invest in Fenix Parts? Recycled original equipment is the product of choice in the attractive/desirable automotive replacement parts marketplace (represents a $60B+ opportunity plus the do-it-yourself market) Right Product Offering in Huge Market Clear economic benefits to the consolidation an
Slide 6: Our $61 Billion Marketplace
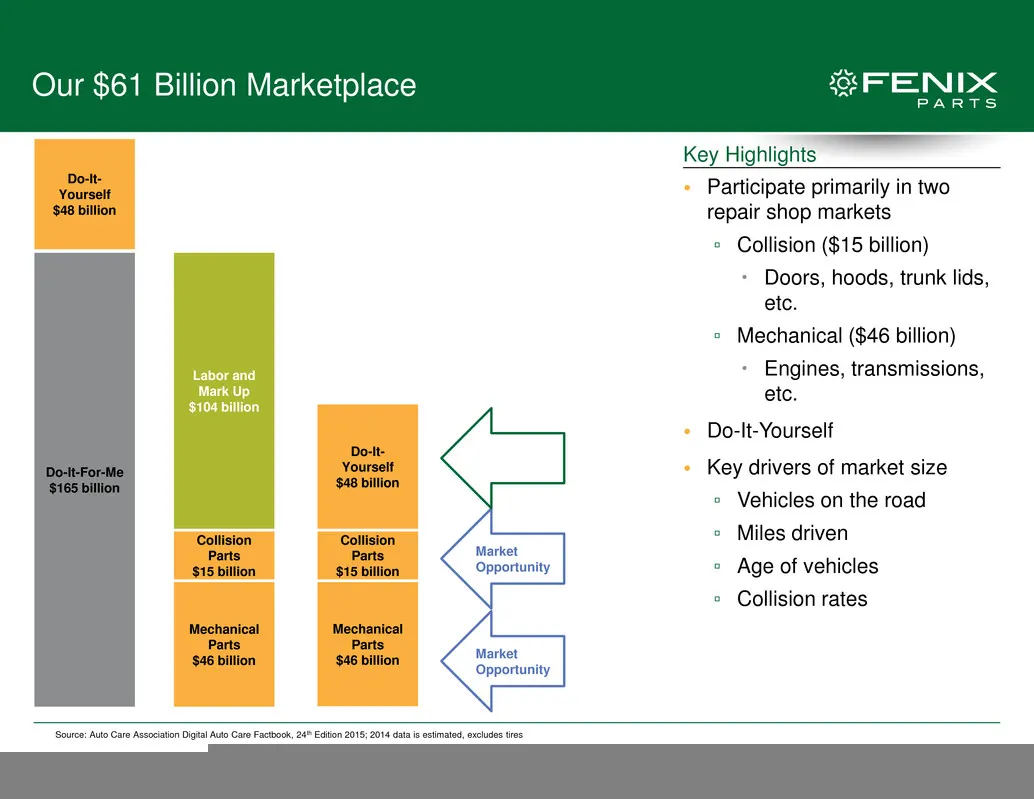
5 Our $61 Billion Marketplace Key Highlights Do-It-For-Me $165 billion Do-It- Yourself $48 billion Source: Auto Care Association Digital Auto Care Factbook, 24th Edition 2015; 2014 data is estimated, excludes tires • Participate primarily in two repair shop markets ▫ Collision ($15 billion) Doors,
Slide 7: Large and Stable Market
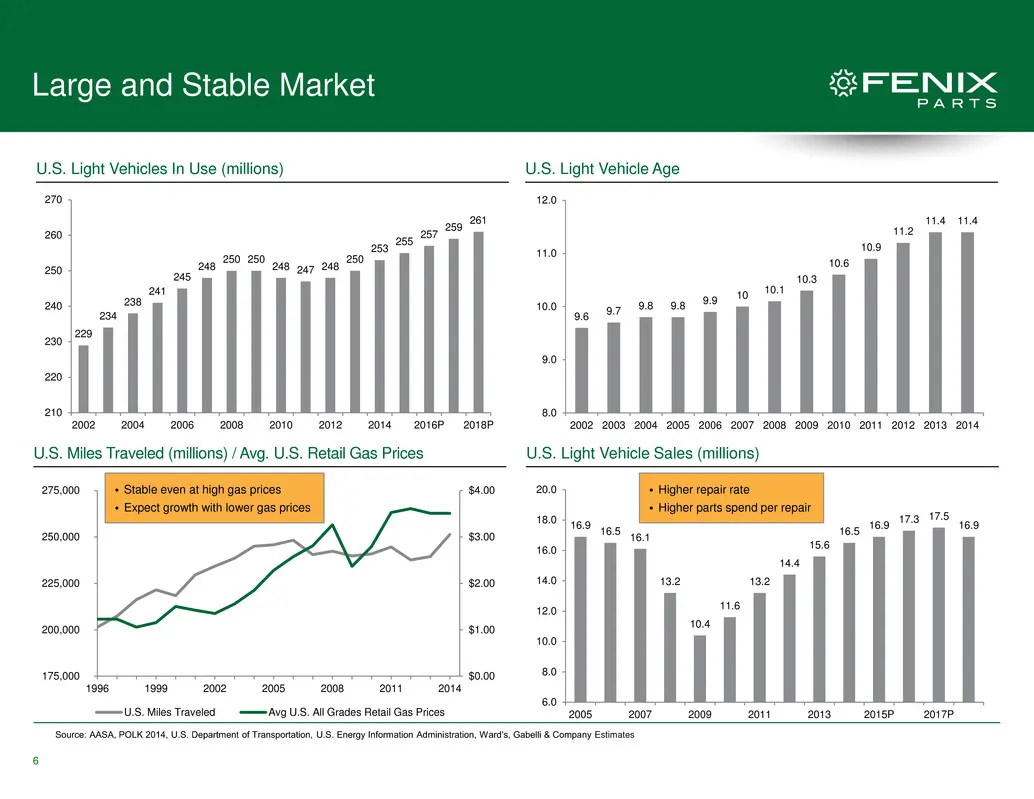
6 229 234 238 241 245 248 250 250 248 247 248 250 253 255 257 259 261 210 220 230 240 250 260 270 2002 2004 2006 2008 2010 2012 2014 2016P 2018P 9.6 9.7 9.8 9.8 9.9 10 10.1 10.3 10.6 10.9 11.2 11.4 11.4 8.0 9.0 10.0 11.0 12.0 2 02 2003 2004 2005 2006 007 08 2009 2010 2011 2012 2013 2014 U.S. Miles T
Slide 8: Critical Link In The Supply Chain
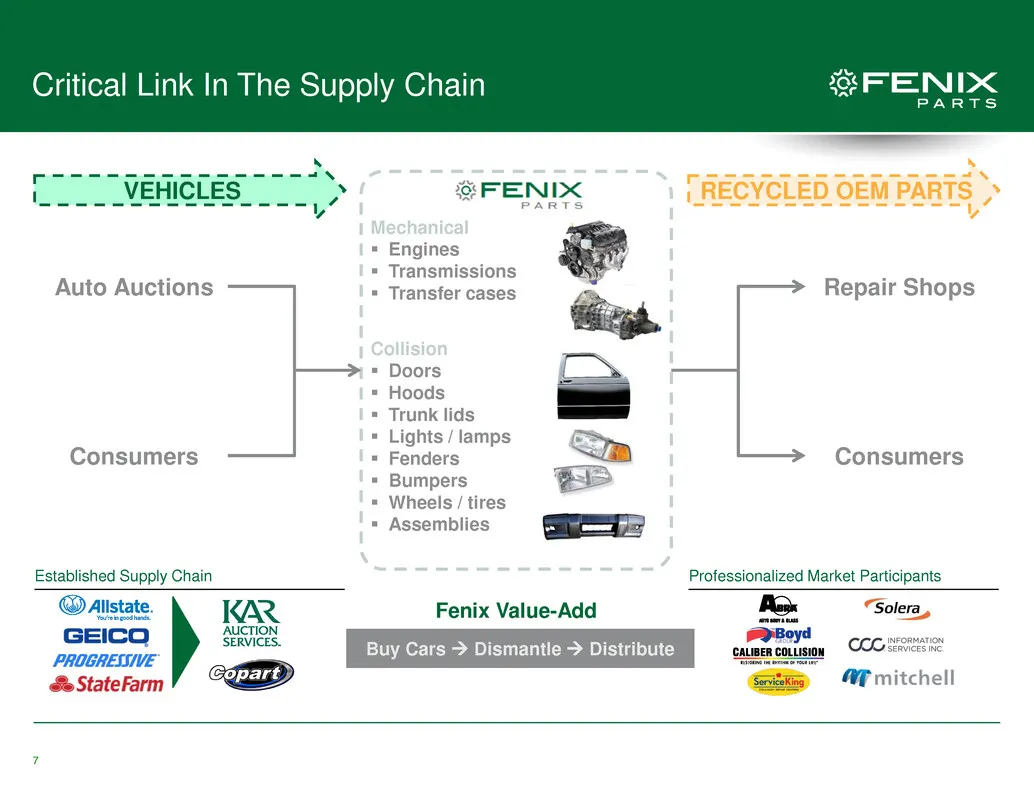
7 Critical Link In The Supply Chain RECYCLED OEM PARTS VEHICLES Mechanical Engines Transmissions Transfer cases Collision Doors Hoods Trunk lids Lights / lamps Fenders Bumpers Wheels / tires Assemblies Auto Auctions Consumers Repair Shops Consumers Buy Cars Dismantle Distri
Slide 9: Recycled OE Parts Are The Parts of Choice
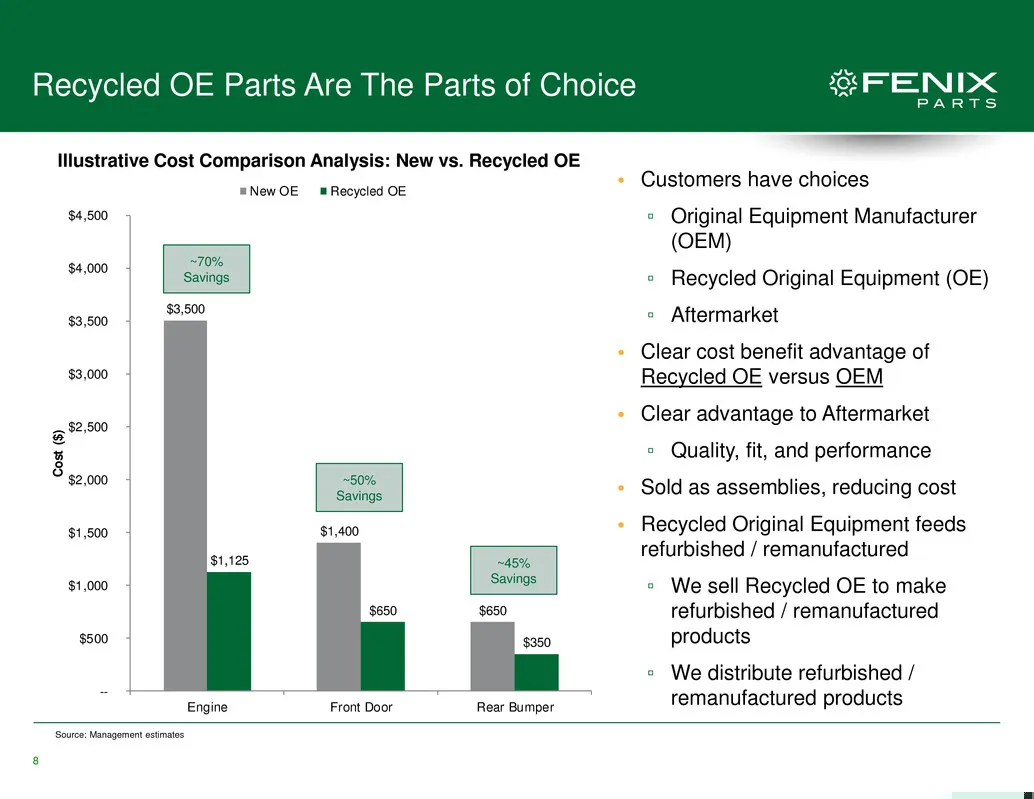
8 $3,500 $1,400 $650 $1,125 $650 $350 -- $500 $1,000 $1,500 $2,000 $2,500 $3,000 $3,500 $4,000 $4,500 Engine Front Door Rear Bumper C o st ( $ ) New OE Recycled OE Recycled OE Parts Are The Parts of Choice ~70% Savings ~50% Savings ~45% Savings • Customers have choices ▫ Original Equipment Manufactu
Slide 10: Building On a Strong Foundation
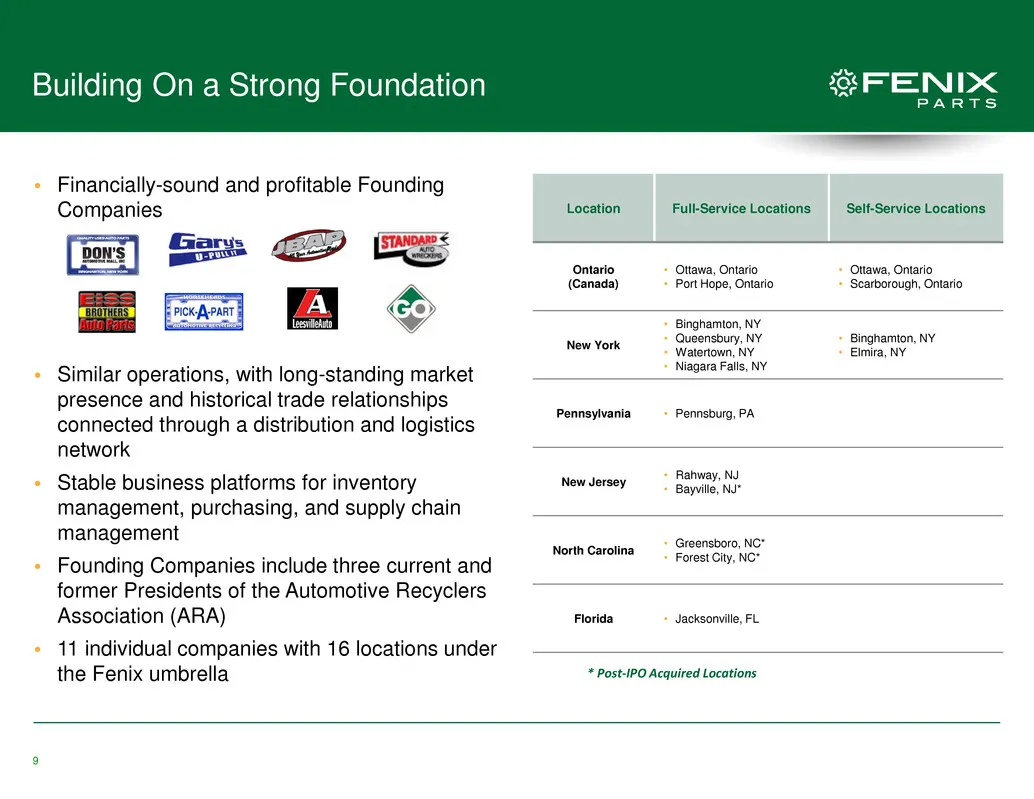
9 Building On a Strong Foundation • Financially-sound and profitable Founding Companies • Similar operations, with long-standing market presence and historical trade relationships connected through a distribution and logistics network • Stable business platforms for inventory management, purchasing,
Slide 11: Our Market Advantage
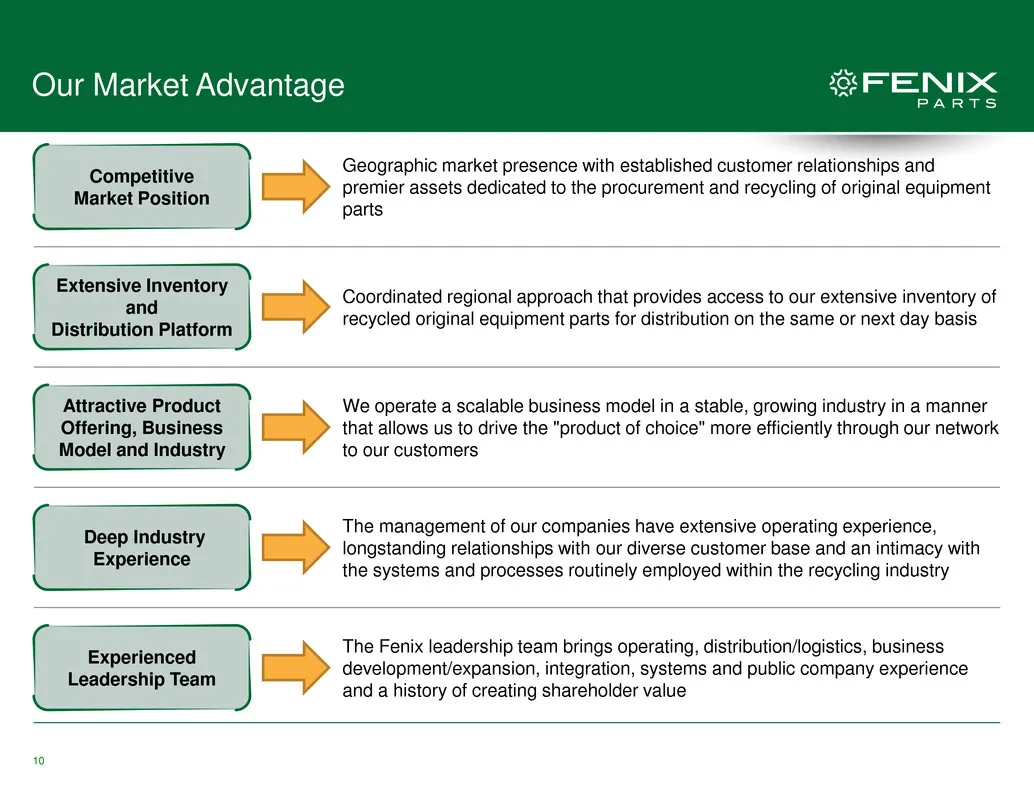
10 Our Market Advantage Geographic market presence with established customer relationships and premier assets dedicated to the procurement and recycling of original equipment parts Competitive Market Position Coordinated regional approach that provides access to our extensive inventory of recycled o
Slide 12: Experienced Leadership Team
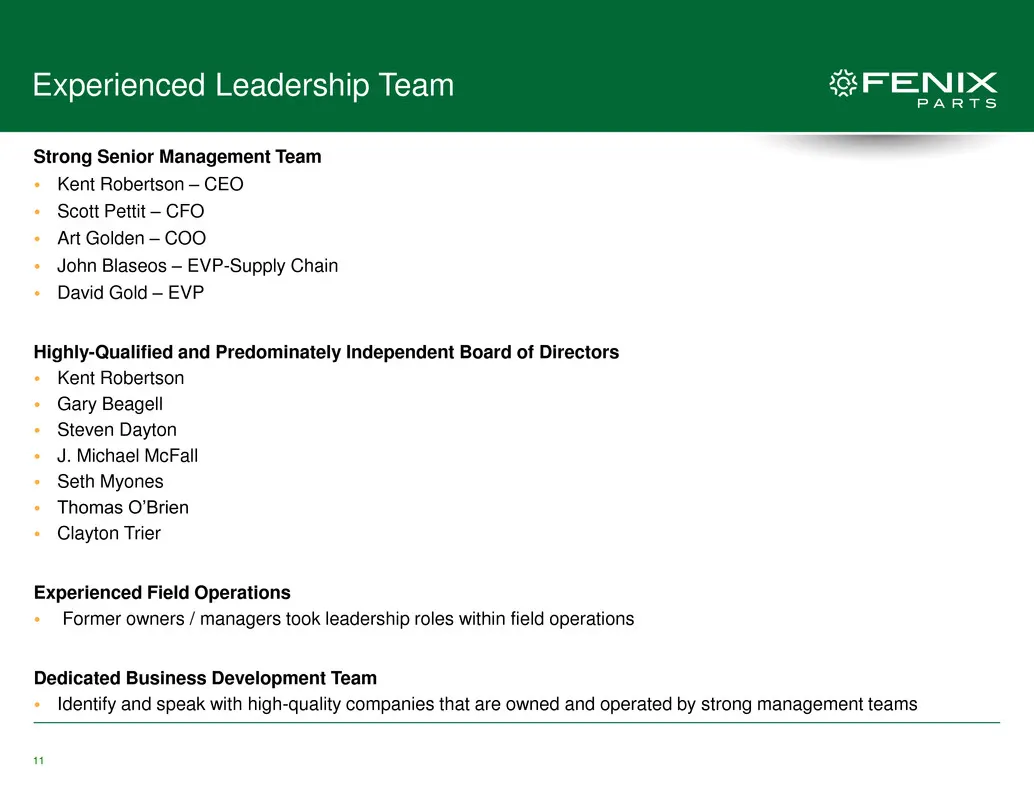
11 Experienced Leadership Team Strong Senior Management Team • Kent Robertson – CEO • Scott Pettit – CFO • Art Golden – COO • John Blaseos – EVP-Supply Chain • David Gold – EVP Highly-Qualified and Predominately Independent Board of Directors • Kent Robertson • Gary Beagell • Steven Dayton • J. Mich
Slide 13: Regional Focus – Building a National Presence
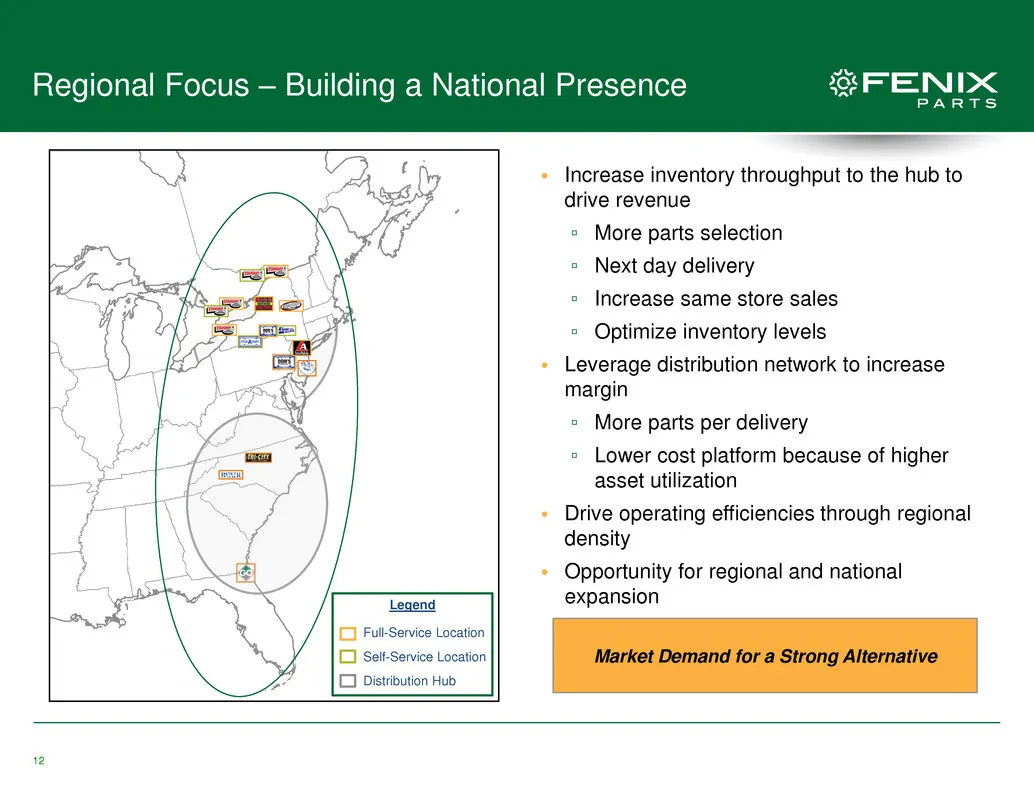
12 Regional Focus – Building a National Presence • Increase inventory throughput to the hub to drive revenue ▫ More parts selection ▫ Next day delivery ▫ Increase same store sales ▫ Optimize inventory levels • Leverage distribution network to increase margin ▫ More parts per delivery ▫ Lower cost pl
Slide 14: Pure-Play North American Recycled OE
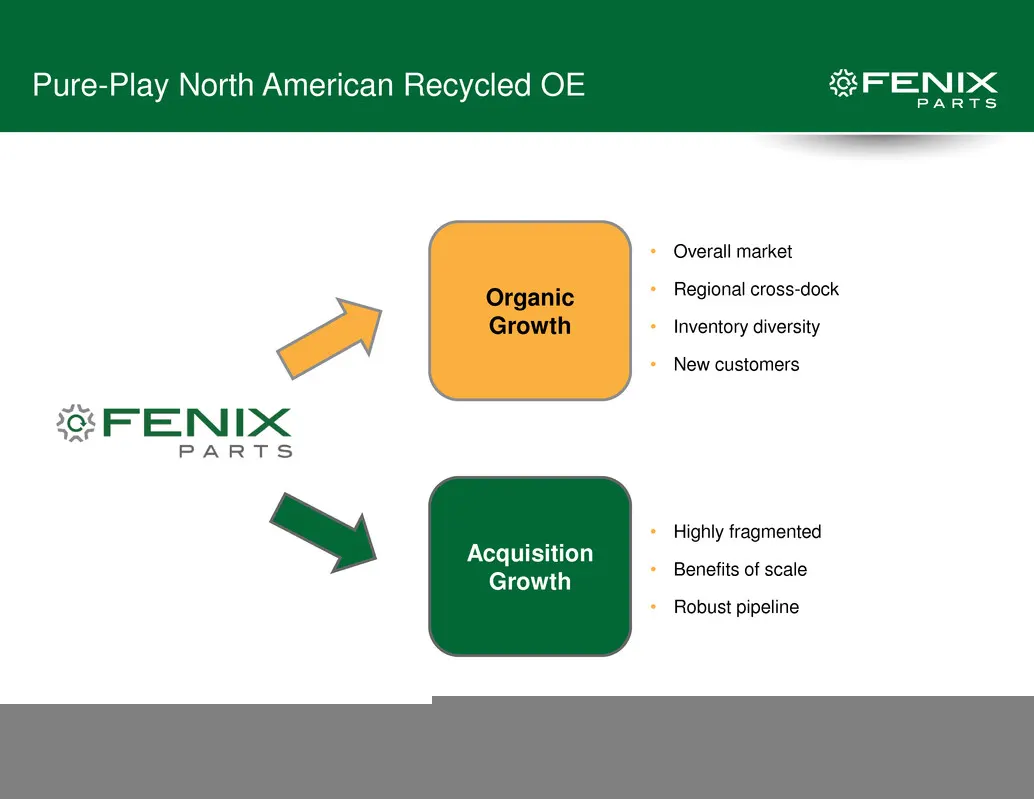
13 Pure-Play North American Recycled OE Organic Growth Acquisition Growth • Overall market • Regional cross-dock • Inventory diversity • New customers • Highly fragmented • Benefits of scale • Robust pipeline
Slide 15: Recycled OE Parts Growth Drivers
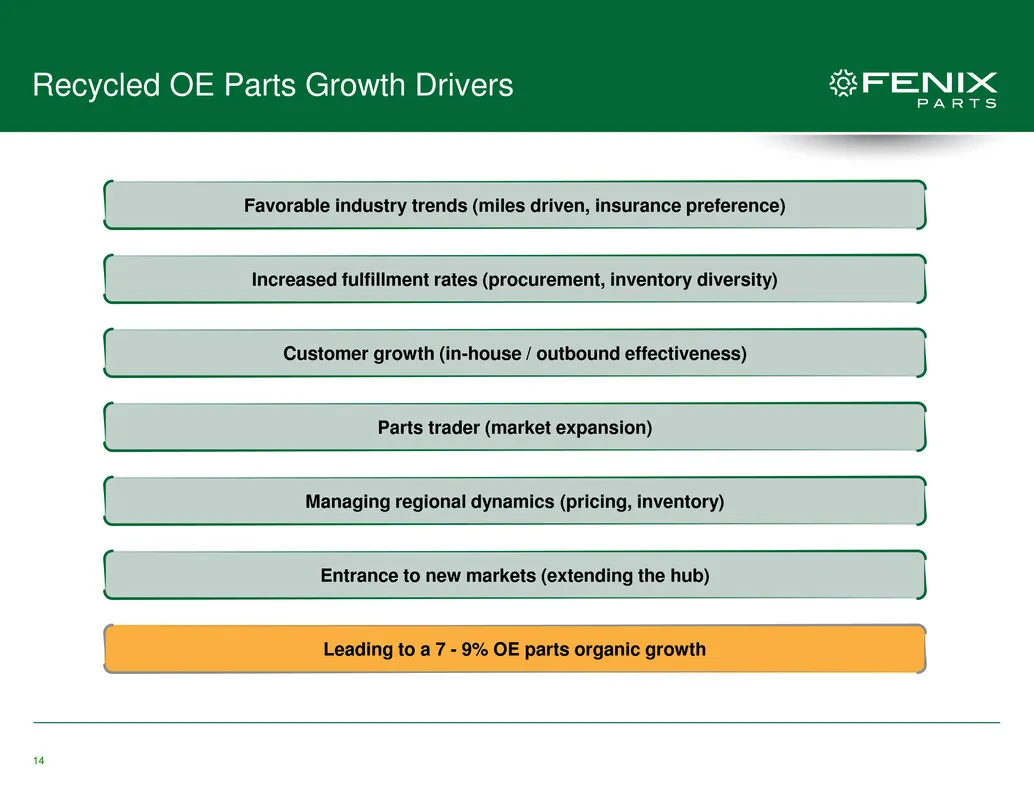
14 Recycled OE Parts Growth Drivers Favorable industry trends (miles driven, insurance preference) Increased fulfillment rates (procurement, inventory diversity) Customer growth (in-house / outbound effectiveness) Parts trader (market expansion) Managing regional dynamics (pricing, inventory) Entran
Slide 16: Compelling M&A Growth Opportunity
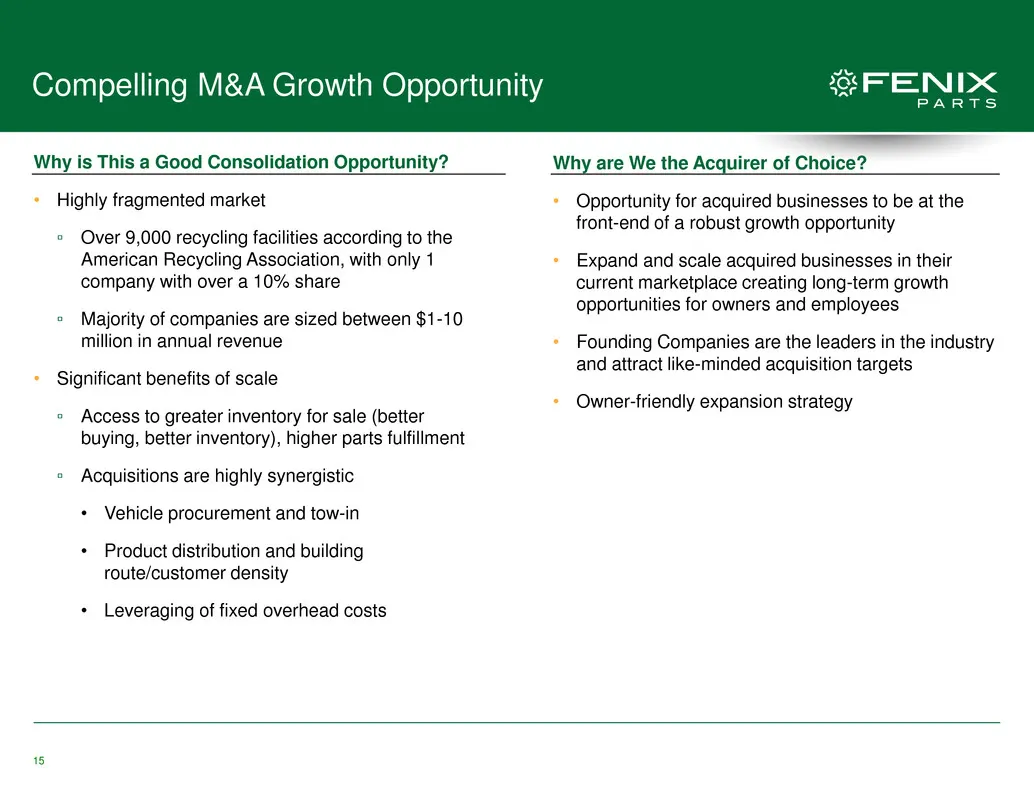
15 Compelling M&A Growth Opportunity Why is This a Good Consolidation Opportunity? • Highly fragmented market ▫ Over 9,000 recycling facilities according to the American Recycling Association, with only 1 company with over a 10% share ▫ Majority of companies are sized between $1-10 million in annual
Slide 17: Compelling M&A Growth Opportunity
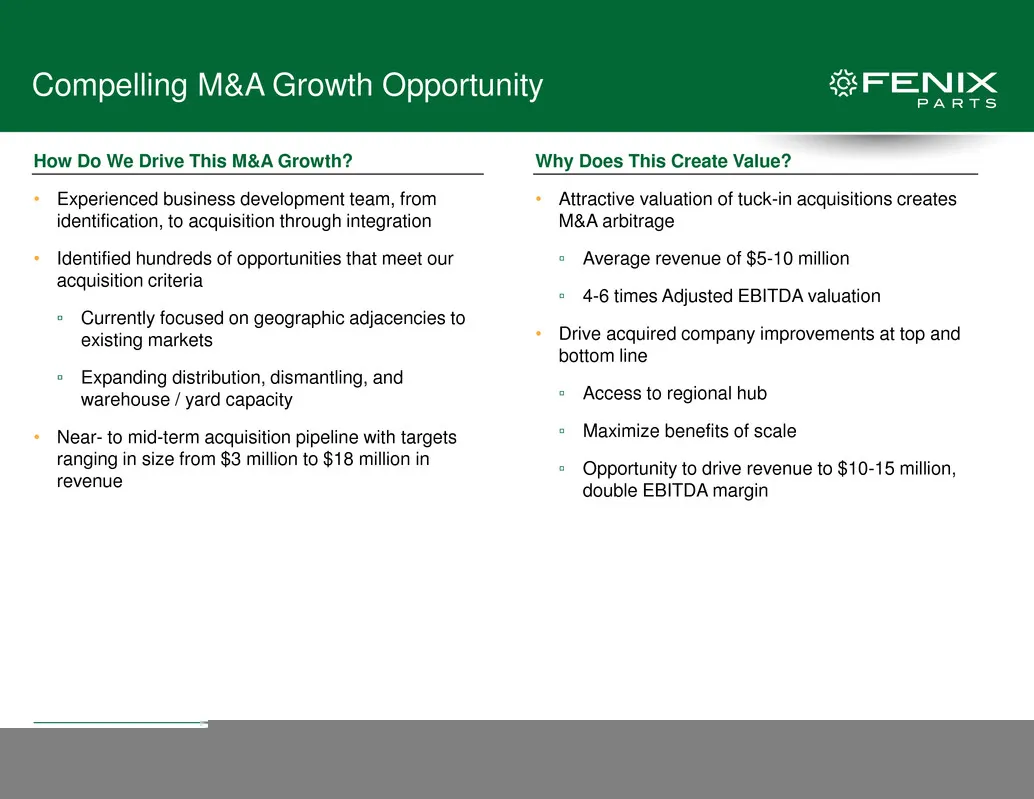
16 Compelling M&A Growth Opportunity How Do We Drive This M&A Growth? • Experienced business development team, from identification, to acquisition through integration • Identified hundreds of opportunities that meet our acquisition criteria ▫ Currently focused on geographic adjacencies to existing m
Slide 18: Fenix Acquisition Pipeline
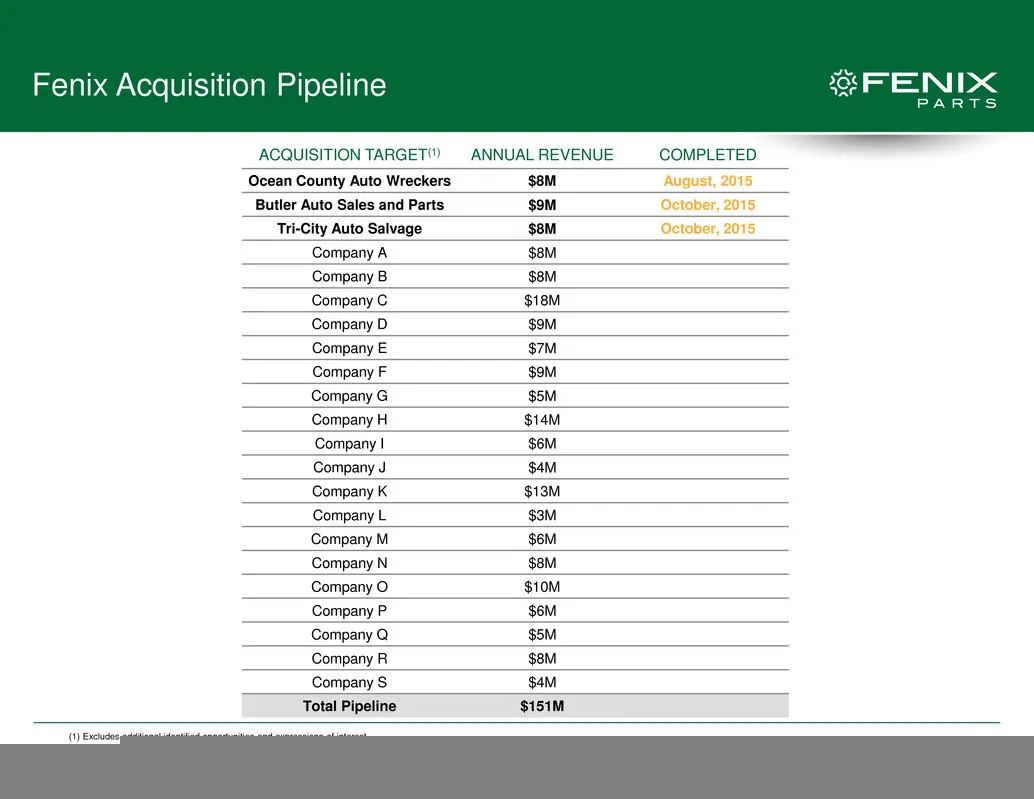
17 Fenix Acquisition Pipeline ACQUISITION TARGET(1) ANNUAL REVENUE COMPLETED Ocean County Auto Wreckers $8M August, 2015 Butler Auto Sales and Parts $9M October, 2015 Tri-City Auto Salvage $8M October, 2015 Company A $8M Company B $8M Company C $18M Company D $9M Company E $7M Company F $9M Company
Slide 19: Foundation for Growth
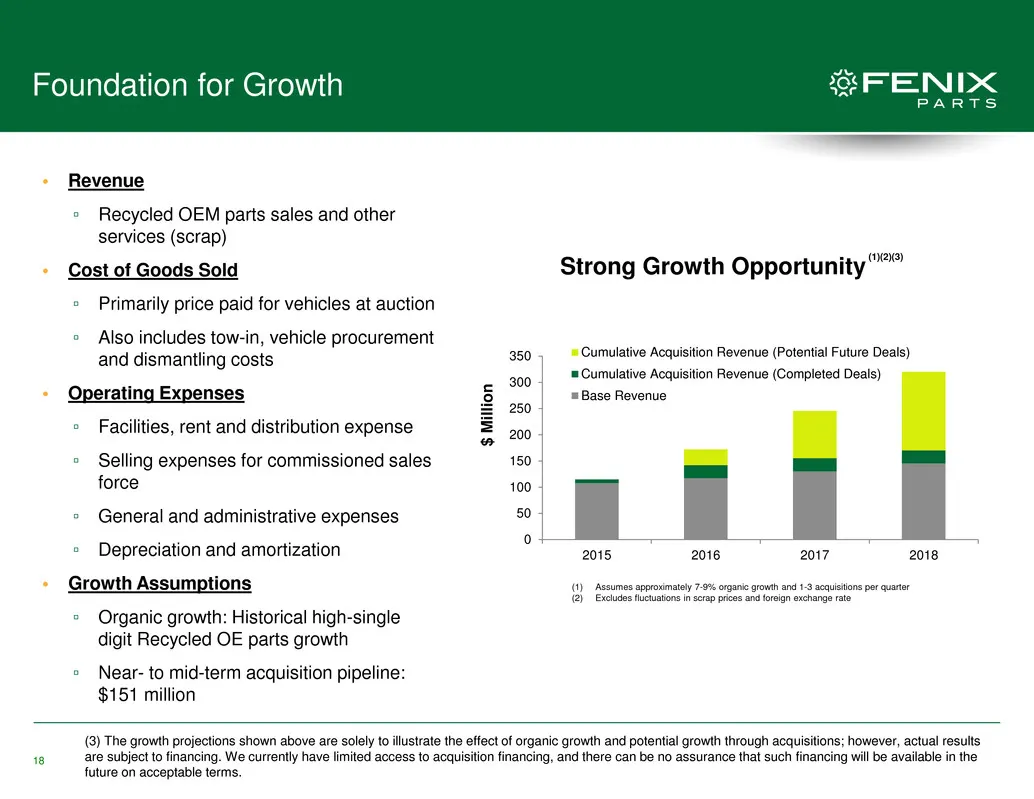
18 Foundation for Growth • Revenue ▫ Recycled OEM parts sales and other services (scrap) • Cost of Goods Sold ▫ Primarily price paid for vehicles at auction ▫ Also includes tow-in, vehicle procurement and dismantling costs • Operating Expenses ▫ Facilities, rent and distribution expense ▫ Selling ex
Slide 20: Emphasis on Recycled OE Parts Business
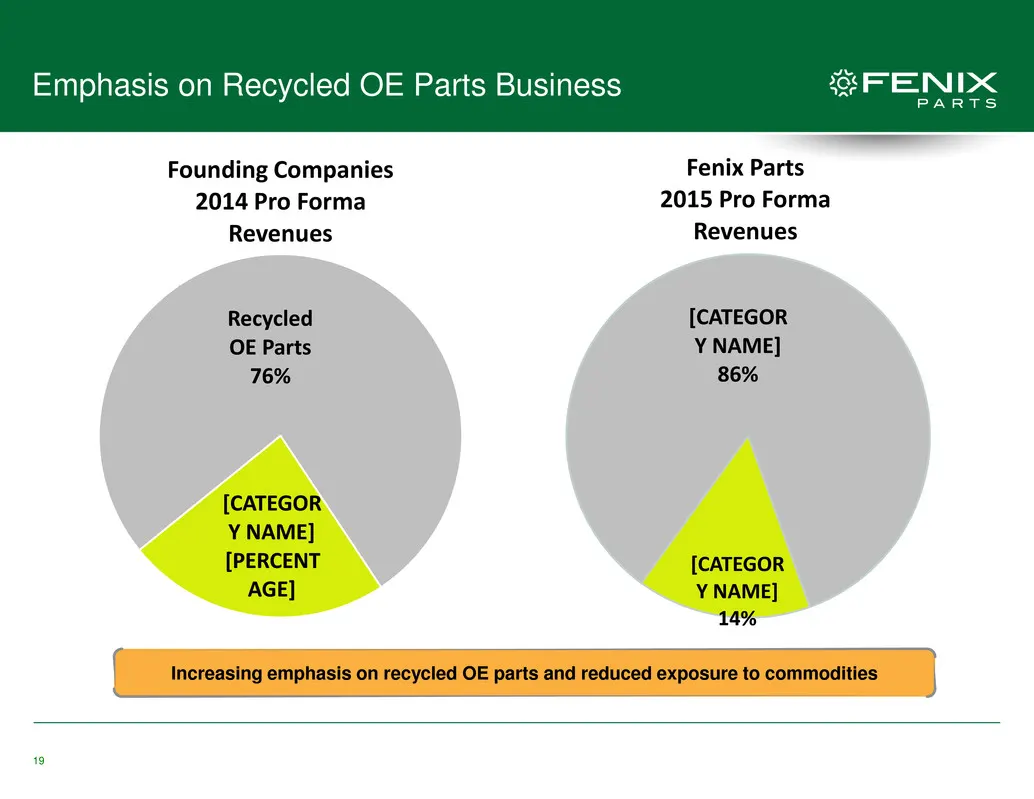
19 Emphasis on Recycled OE Parts Business Recycled OE Parts 76% [CATEGOR Y NAME] [PERCENT AGE] Founding Companies 2014 Pro Forma Revenues [CATEGOR Y NAME] 86% [CATEGOR Y NAME] 14% Fenix Parts 2015 Pro Forma Revenues Increasing emphasis on recycled OE parts and reduced exposure to commodities
Slide 21: Capital Structure
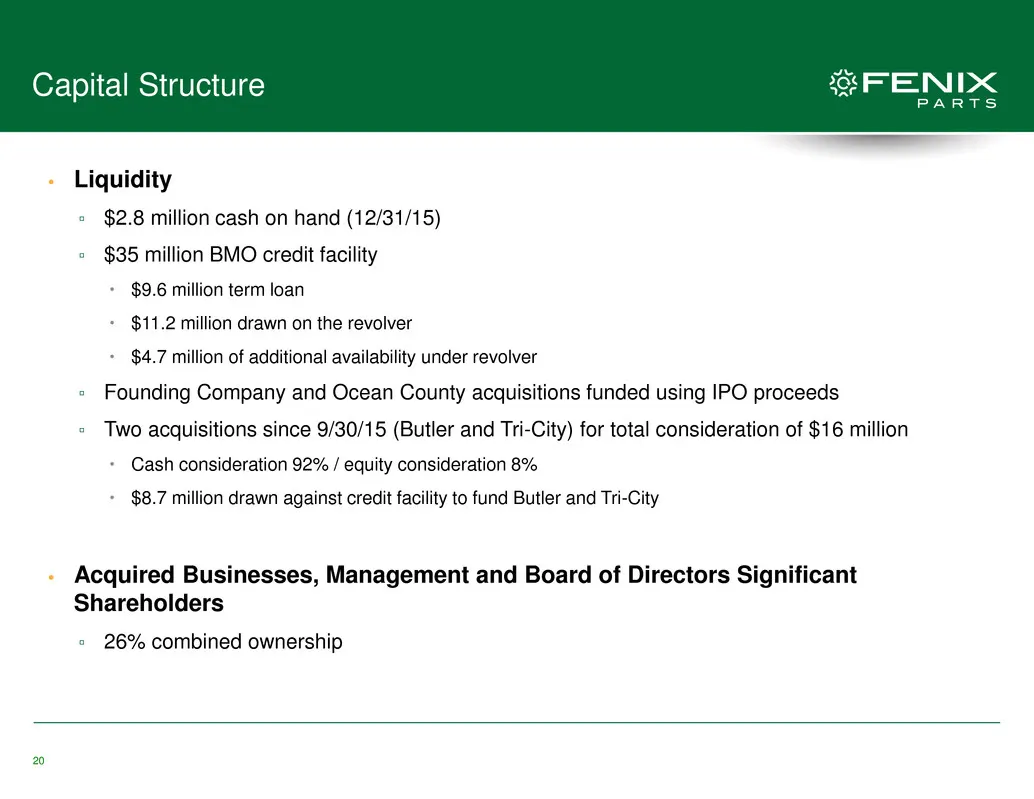
20 Capital Structure • Liquidity ▫ $2.8 million cash on hand (12/31/15) ▫ $35 million BMO credit facility $9.6 million term loan $11.2 million drawn on the revolver $4.7 million of additional availability under revolver ▫ Founding Company and Ocean County acquisitions funded using IPO proceeds
Slide 22: Clear Path for Significant Value Creation
21 Clear Path for Significant Value Creation • Large Growing Parts Business in Fragmented Market ▫ Significant progress on path to national coverage in top-125 MSAs • Well-Defined Process to Scale Operations ▫ Regional hubs and distribution drive ability to share inventory, optimize dismantle, vehic
Slide 23: Appendix
ScrFENDX< PARTS Appendix
Slide 24: Building Blocks of Revenue
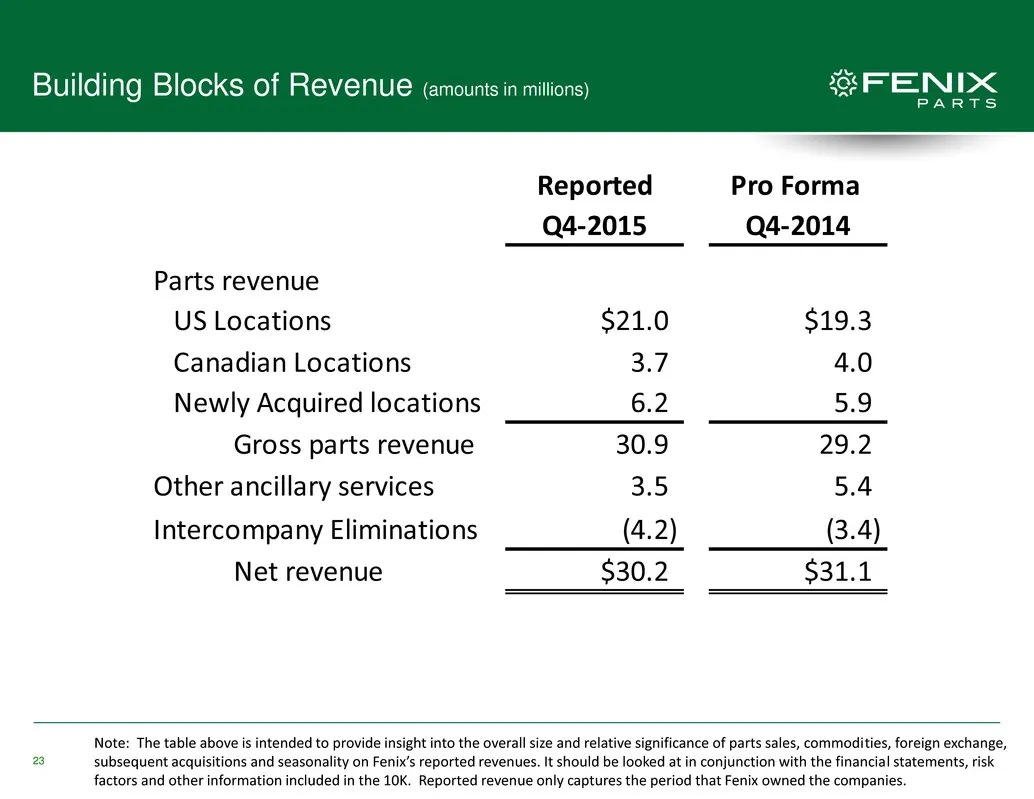
23 Building Blocks of Revenue (amounts in millions) Note: The table above is intended to provide insight into the overall size and relative significance of parts sales, commodities, foreign exchange, subsequent acquisitions and seasonality on Fenix’s reported revenues. It should be looked at in conj
Slide 25: Vehicle Procurement Metrics
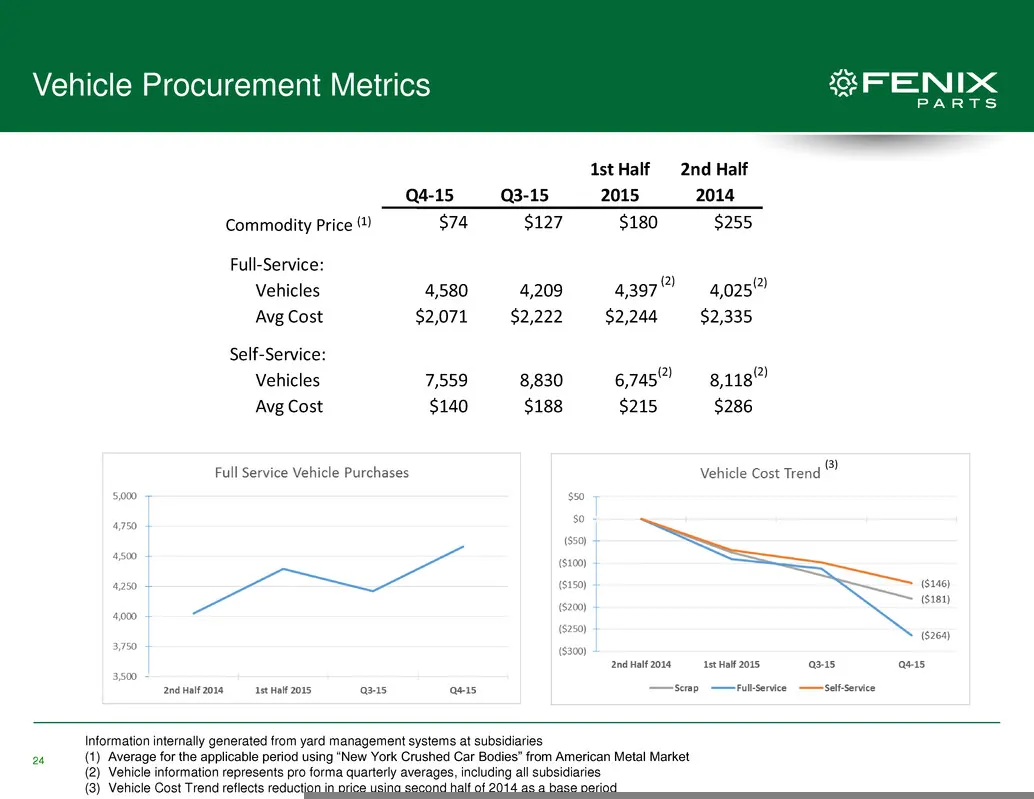
24 Vehicle Procurement Metrics 1st Half 2nd Half Q4-15 Q3-15 2015 2014 NY Crushed Cars $74 $127 $180 $255 Full-Service: Vehicles 4,580 4,209 4,397 4,025 Avg Cost $2,071 $2,222 $2,244 $2,335 Self-Service: Vehicles 7,559 8,830 6,745 8,118 Avg Cost $140 $188 $215 $286 Commodity Price Information intern
Slide 26: Operating Loss and Significant Expenses
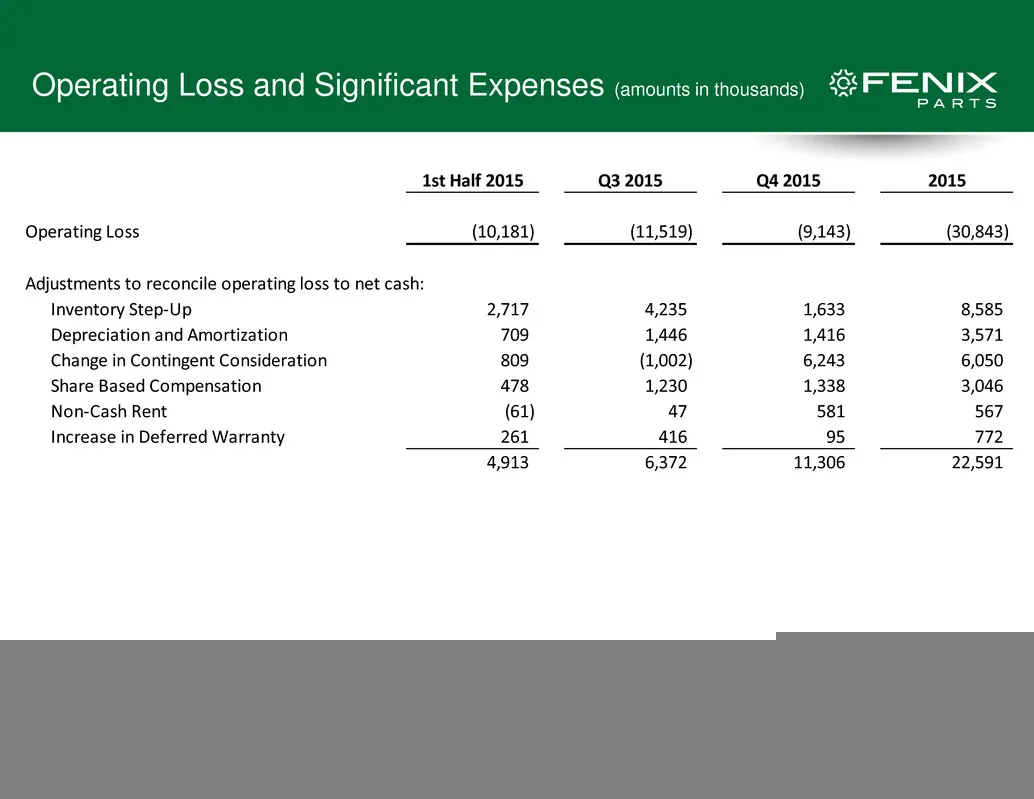
25 Operating Loss and Significant Expenses (amounts in thousands) 1st Half 2015 Q3 2015 Q4 2015 2015 Operating Loss (10,181) (11,519) (9,143) (30,843) Adjustments to reconcile operating loss to net cash: Inventory Step-Up 2,717 4,235 1,633 8,585 Depreciation and Amortization 709 1,446 1,416 3,571 Ch
Source: SEC EDGAR · 8-K filed Apr 14, 2016