Inland Real Estate — Shareholder Meeting (June 2009)
14 slides from Inland Real Estate's shareholder meeting presentation, Jun 17, 2009
Slide 1: Annual Meeting June 17, 2009
Annual Meeting June 17, 2009 www.inlandrealestate.com NYSE: IRC
Slide 2: Forward-Looking Statements
FORWARD-LOOKING STATEMENTS These presentation materials contain forward-looking statements. Forward-looking statements are statements that are not historical, including statements regarding management's intentions, beliefs, expectations, representations, plans or predictions of the future, and are t
Slide 3: IRC Snapshot Profile
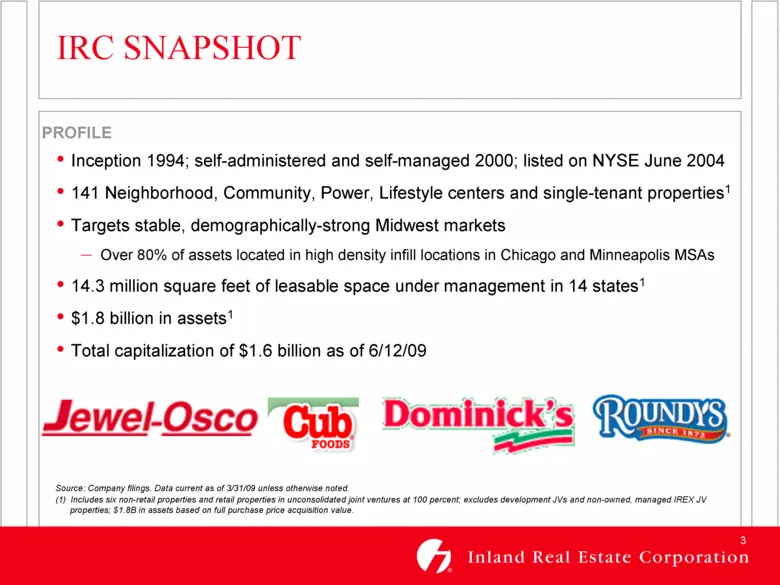
IRC SNAPSHOT PROFILE Inception 1994; self-administered and self-managed 2000; listed on NYSE June 2004 141 Neighborhood, Community, Power, Lifestyle centers and single-tenant properties1 Targets stable, demographically-strong Midwest markets Over 80% of assets located in high density infill location
Slide 4: Operating Environment
OPERATING ENVIRONMENT Challenging economic conditions continue to impact IRC and our retailer tenants: Constrained credit markets – no significant improvement to date Housing market and financial system crises Loss of investment wealth as equity markets decline Increased unemployment Decline in cons
Slide 5: Key Areas of Focus
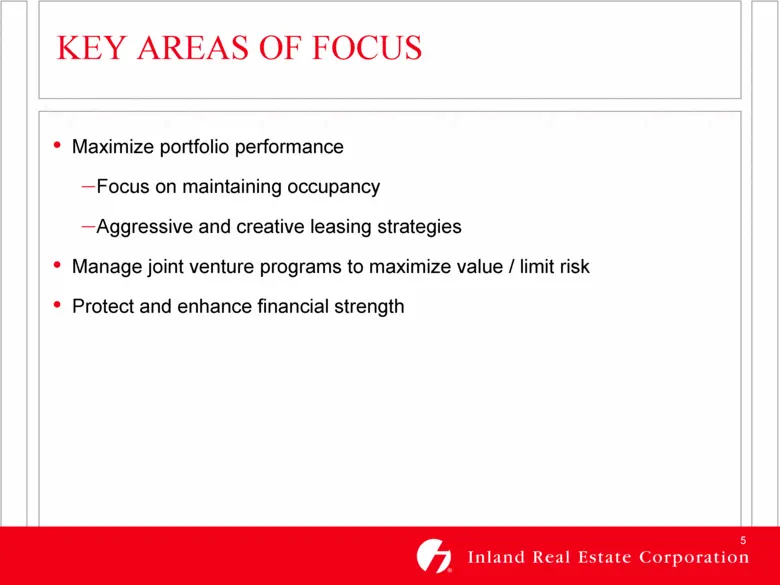
KEY AREAS OF FOCUS Maximize portfolio performance Focus on maintaining occupancy Aggressive and creative leasing strategies Manage joint venture programs to maximize value / limit risk Protect and enhance financial strength
Slide 6: Portfolio GLA by Property Type / Defensive Platform
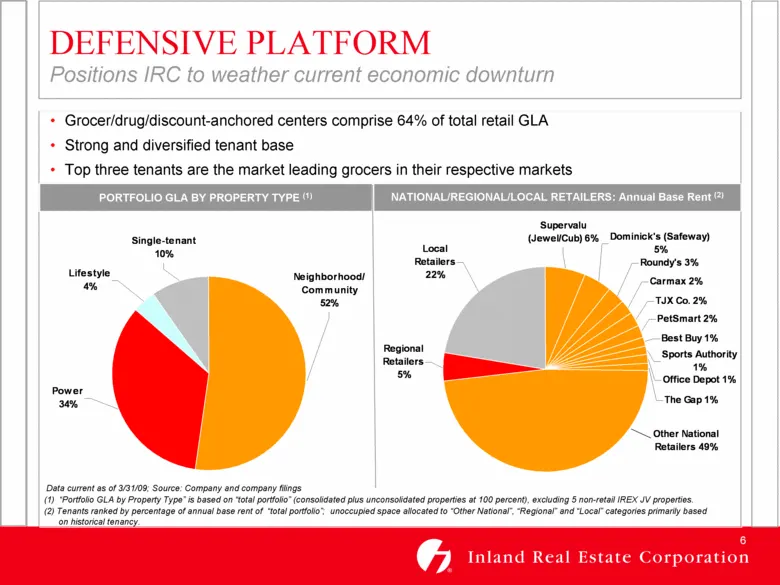
PORTFOLIO GLA BY PROPERTY TYPE (1) NATIONAL/REGIONAL/LOCAL RETAILERS: Annual Base Rent (2) DEFENSIVE PLATFORM Positions IRC to weather current economic downturn Data current as of 3/31/09; Source: Company and company filings (1) “Portfolio GLA by Property Type” is based on “total portfolio” (consoli
Slide 7: Core Markets: Chicago and Minneapolis-St. Paul
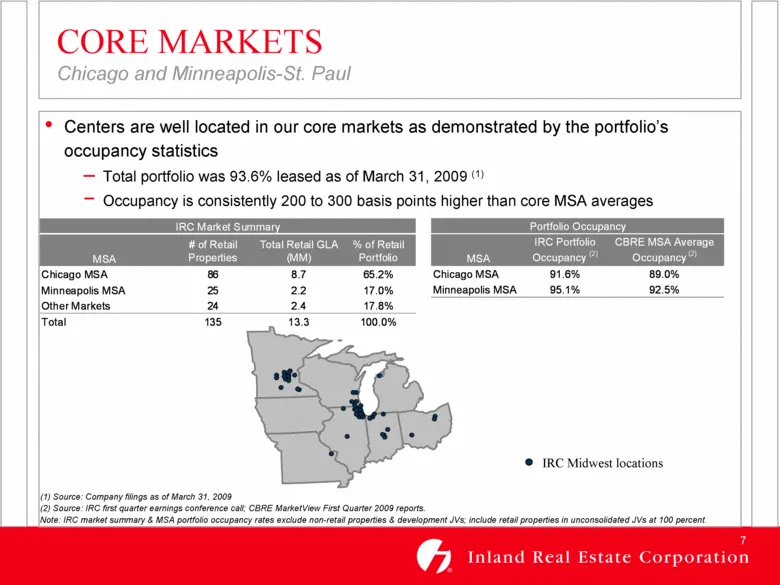
CORE MARKETS Chicago and Minneapolis-St. Paul (1) Source: Company filings as of March 31, 2009 (2) Source: IRC first quarter earnings conference call; CBRE MarketView First Quarter 2009 reports. Note: IRC market summary & MSA portfolio occupancy rates exclude non-retail properties & development JVs;
Slide 8: Attractive Market Demographics
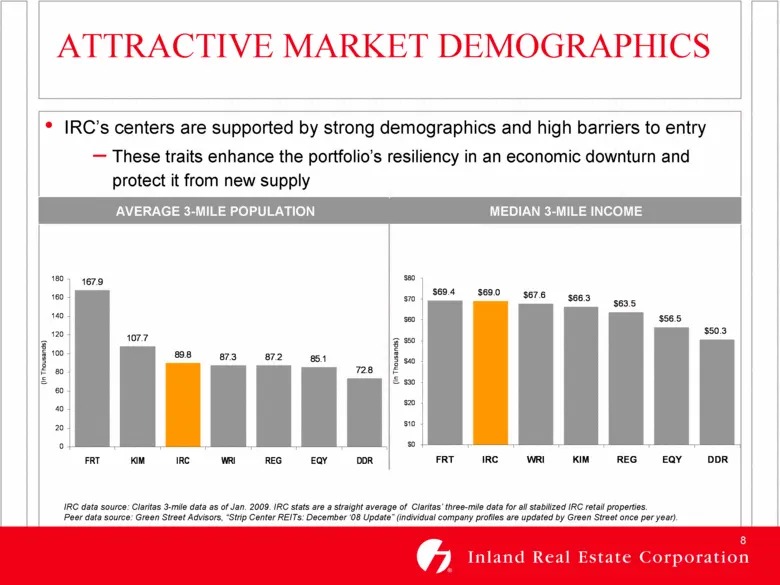
ATTRACTIVE MARKET DEMOGRAPHICS IRC data source: Claritas 3-mile data as of Jan. 2009. IRC stats are a straight average of Claritas’ three-mile data for all stabilized IRC retail properties. Peer data source: Green Street Advisors, “Strip Center REITs: December ‘08 Update” (individual company profile
Slide 9: Solid Operating Fundamentals
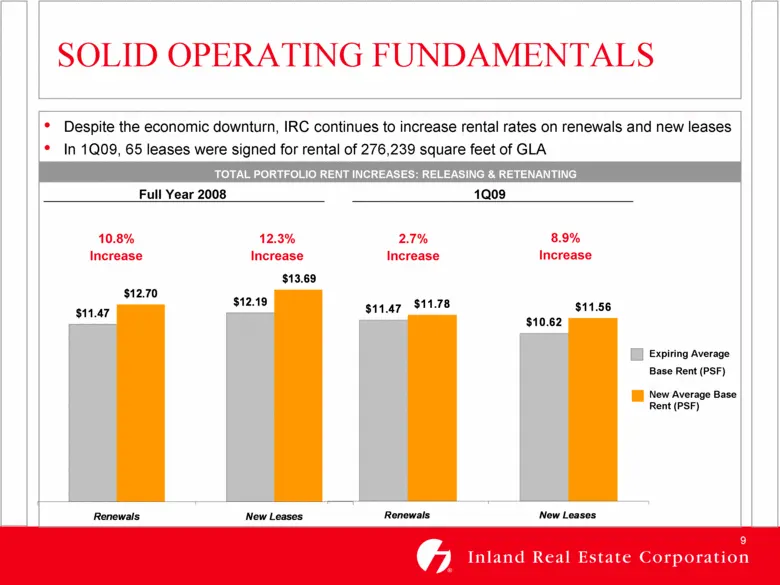
10.8% Increase 12.3% Increase 2.7% Increase 8.9% Increase SOLID OPERATING FUNDAMENTALS Despite the economic downturn, IRC continues to increase rental rates on renewals and new leases In 1Q09, 65 leases were signed for rental of 276,239 square feet of GLA Full Year 2008 Expiring Average Base Rent (P
Slide 10: Joint Ventures
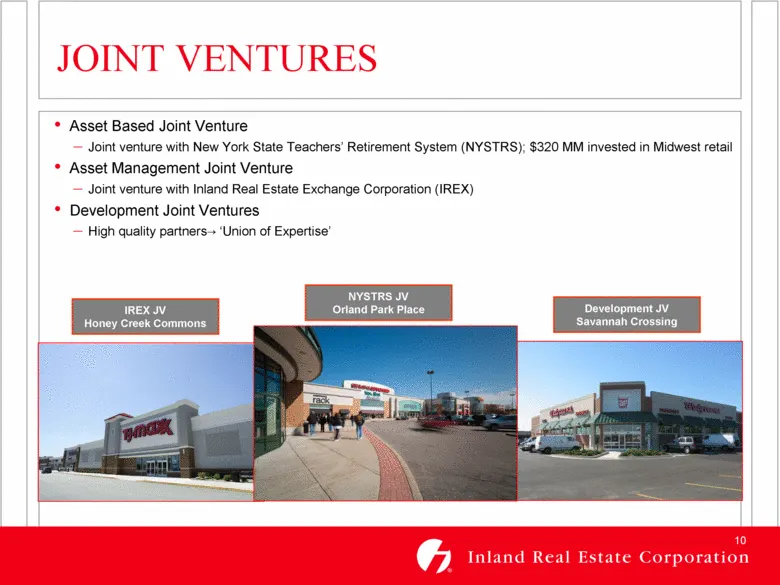
JOINT VENTURES Asset Based Joint Venture Joint venture with New York State Teachers’ Retirement System (NYSTRS); $320 MM invested in Midwest retail Asset Management Joint Venture Joint venture with Inland Real Estate Exchange Corporation (IREX) Development Joint Ventures High quality partners ‘Union
Slide 11: Maintaining a Strong Balance Sheet
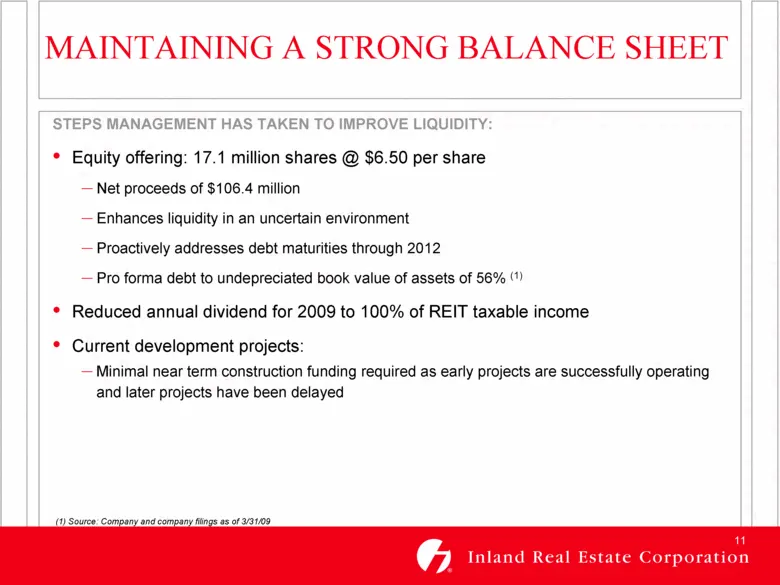
MAINTAINING A STRONG BALANCE SHEET (1) Source: Company and company filings as of 3/31/09 STEPS MANAGEMENT HAS TAKEN TO IMPROVE LIQUIDITY: Equity offering: 17.1 million shares @ $6.50 per share Net proceeds of $106.4 million Enhances liquidity in an uncertain environment Proactively addresses debt ma
Slide 12: Consolidated Debt Maturities
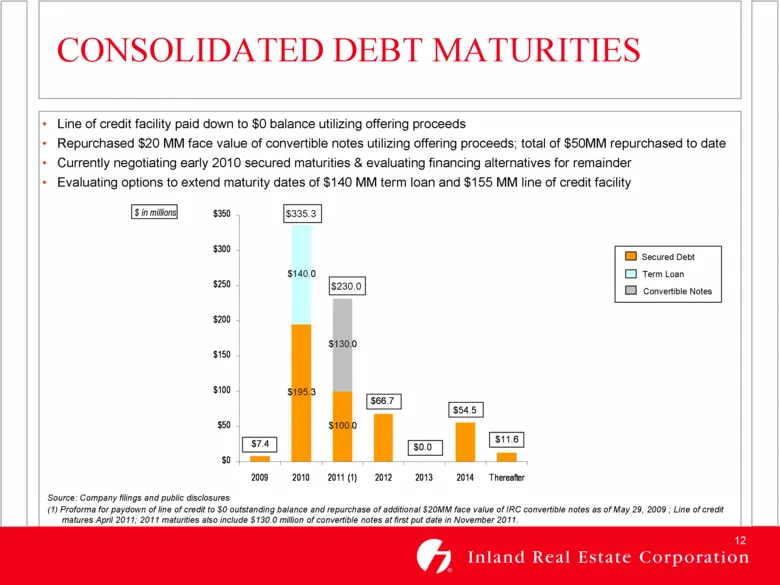
CONSOLIDATED DEBT MATURITIES Line of credit facility paid down to $0 balance utilizing offering proceeds Repurchased $20 MM face value of convertible notes utilizing offering proceeds; total of $50MM repurchased to date Currently negotiating early 2010 secured maturities & evaluating financing alter
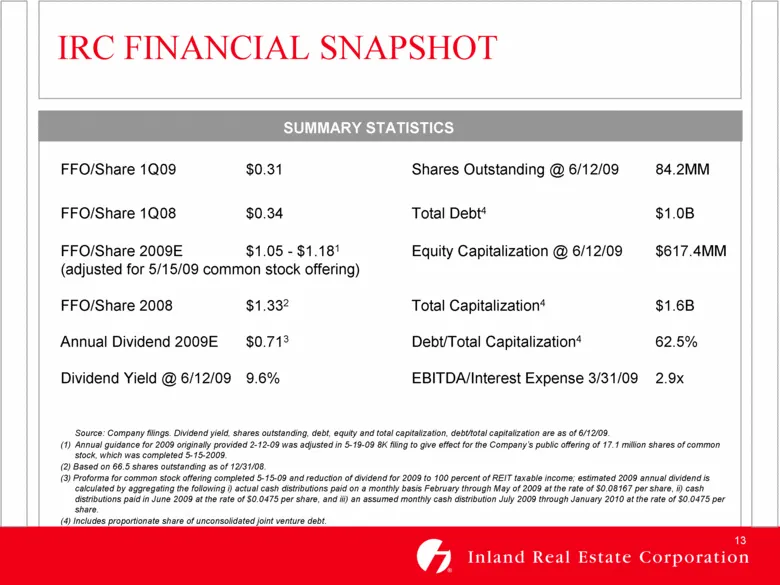
Slide 13: IRC Financial Snapshot
FFO/Share 1Q09 $0.31 Shares Outstanding @ 6/12/09 84.2MM FFO/Share 1Q08 $0.34 Total Debt4 $1.0B FFO/Share 2009E $1.05 - $1.181 Equity Capitalization @ 6/12/09 $617.4MM (adjusted for 5/15/09 common stock offering) FFO/Share 2008 $1.332 Total Capitalization4 $1.6B Annual Dividend 2009E $0.713 Debt/Tot
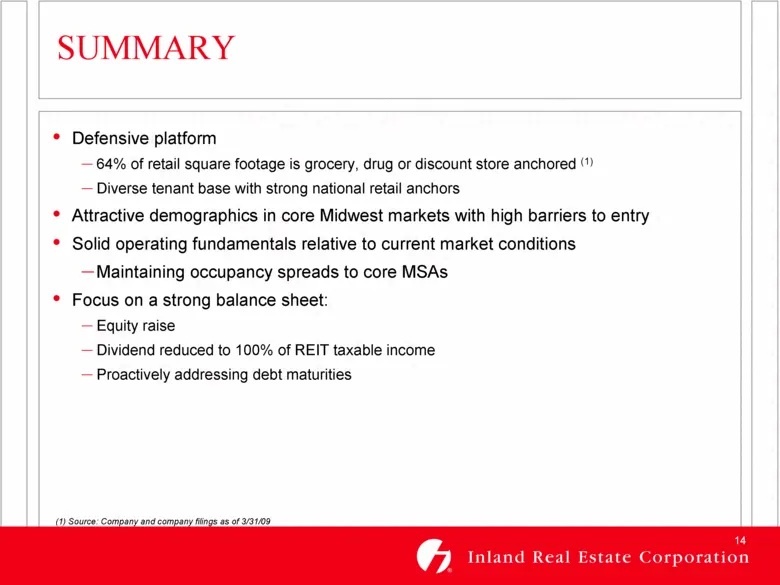
Slide 14: Summary
SUMMARY (1) Source: Company and company filings as of 3/31/09 Defensive platform 64% of retail square footage is grocery, drug or discount store anchored (1) Diverse tenant base with strong national retail anchors Attractive demographics in core Midwest markets with high barriers to entry Solid oper
Source: SEC EDGAR · 8-K filed Jun 17, 2009
More decks from Inland Real Estate Corp
 Investor Presentation (November 2015)30 slides · Nov 17, 2015
 Investor Presentation (September 2015)29 slides · Sep 16, 2015
 Investor Presentation (June 2015)29 slides · Jun 9, 2015
 Investor Presentation (May 2015)26 slides · May 15, 2015
 Investor Presentation (February 2015)26 slides · Feb 24, 2015
 Investor Presentation (November 2014)26 slides · Nov 5, 2014