Comerica — Comerica Inc /New/ — BancAnalysts Association of Boston Conference 2013
19 slides from Comerica's conference presentation, Nov 6, 2013
Slide 1: Comerica Incorporated BancAnalysts Association of Boston, Inc. November 7-8, 2013
Comerica Incorporated BancAnalysts Association of Boston, Inc.November 7- 8, 2013 Lars AndersonVice Chairman, The Business Bank Karen ParkhillVice Chairman and CFO Safe Harbor Statement Any statements in this presentation that are not historical facts are forward-looking statements as defined in the
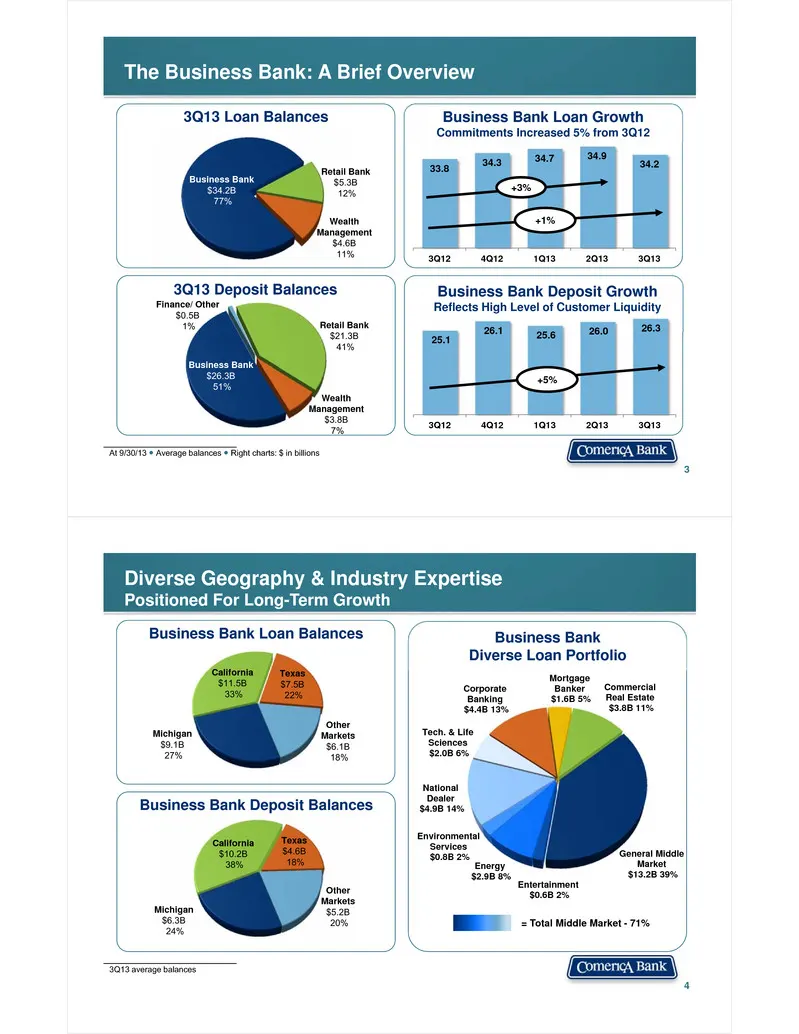
Slide 2: The Business Bank: A Brief Overview
The Business Bank: A Brief Overview 3 3Q13 Loan Balances 3Q13 Deposit BalancesFinance/ Other$0.5B1% Retail Bank$21.3B 41% WealthManagement$3.8B7% Business Bank$26.3B51% At 9/30/13 ● Average balances ● Right charts: $ in billions Wealth Management$4.6B11% Business Bank$34.2B77% Retail Bank$5.3B12% Bu
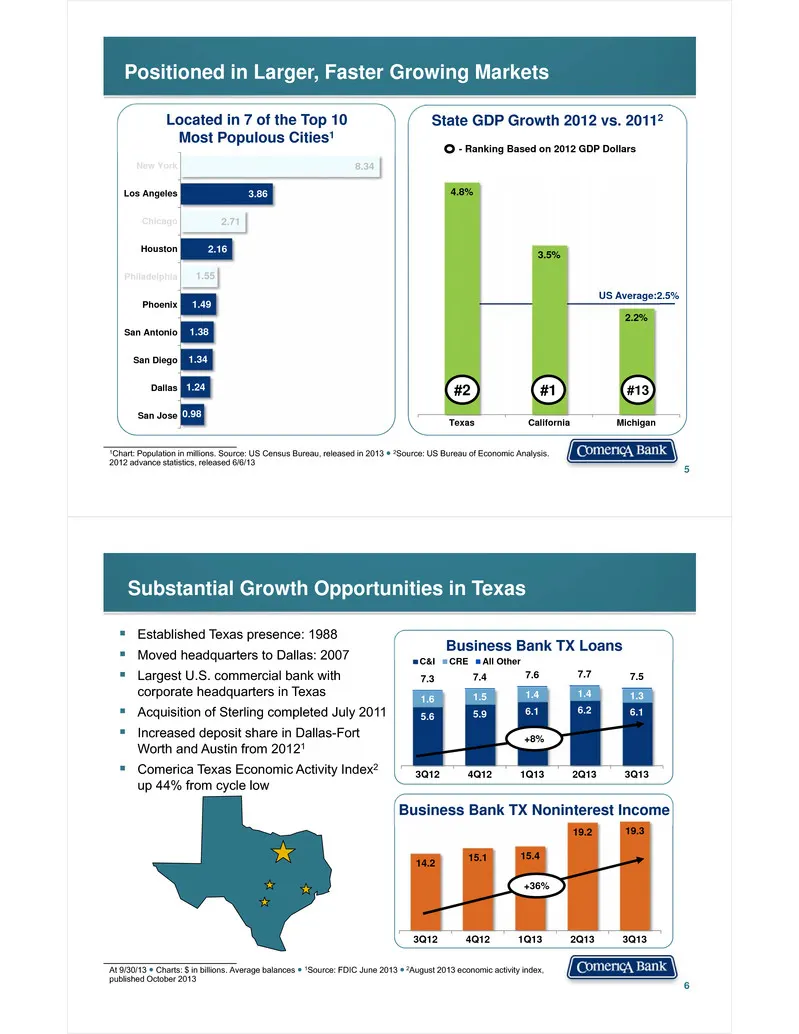
Slide 3: Positioned in Larger, Faster Growing Markets
4.8% 3.5% 2.2% Texas California Michigan 5 Positioned in Larger, Faster Growing Markets State GDP Growth 2012 vs. 20112 - Ranking Based on 2012 GDP Dollars US Average:2.5% 0.98 1.24 1.34 1.38 1.49 1.55 2.16 2.71 3.86 8.34 San Jose Dallas San Diego San Antonio Phoenix Philadelpia Houston Chicago Los
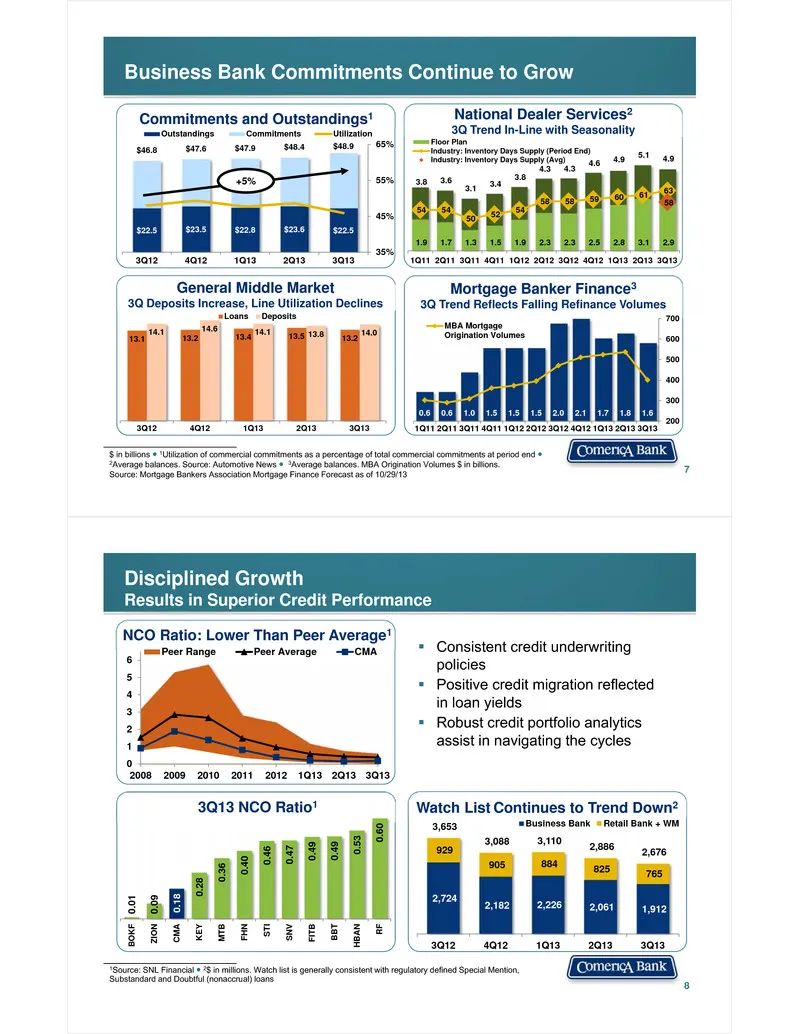
Slide 4: Business Bank Commitments Continue to Grow
$22.5 $23.5 $22.8 $23.6 $22.5 $46.8 $47.6 $47.9 $48.4 $48.9 35% 45% 55% 65% 3Q12 4Q12 1Q13 2Q13 3Q13 Outstandings Commitments Utilization $ in billions ● 1Utilization of commercial commitments as a percentage of total commercial commitments at period end ●2Average balances. Source: Automotive News ●
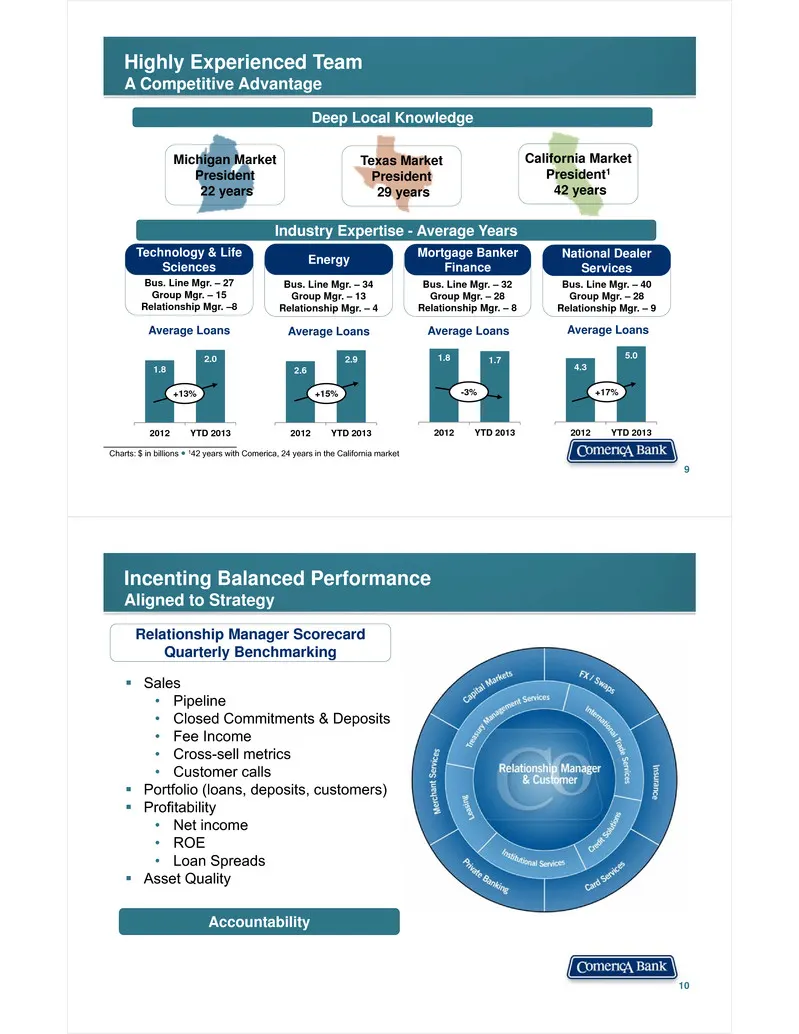
Slide 5: Highly Experienced Team: A Competitive Advantage
Highly Experienced TeamA Competitive Advantage Deep Local Knowledge 9 Michigan Market President22 years Texas Market President29 years California Market President142 years Industry Expertise - Average Years Bus. Line Mgr. – 27 Group Mgr. – 15 Relationship Mgr. –8 Technology & Life Sciences Bus. Line
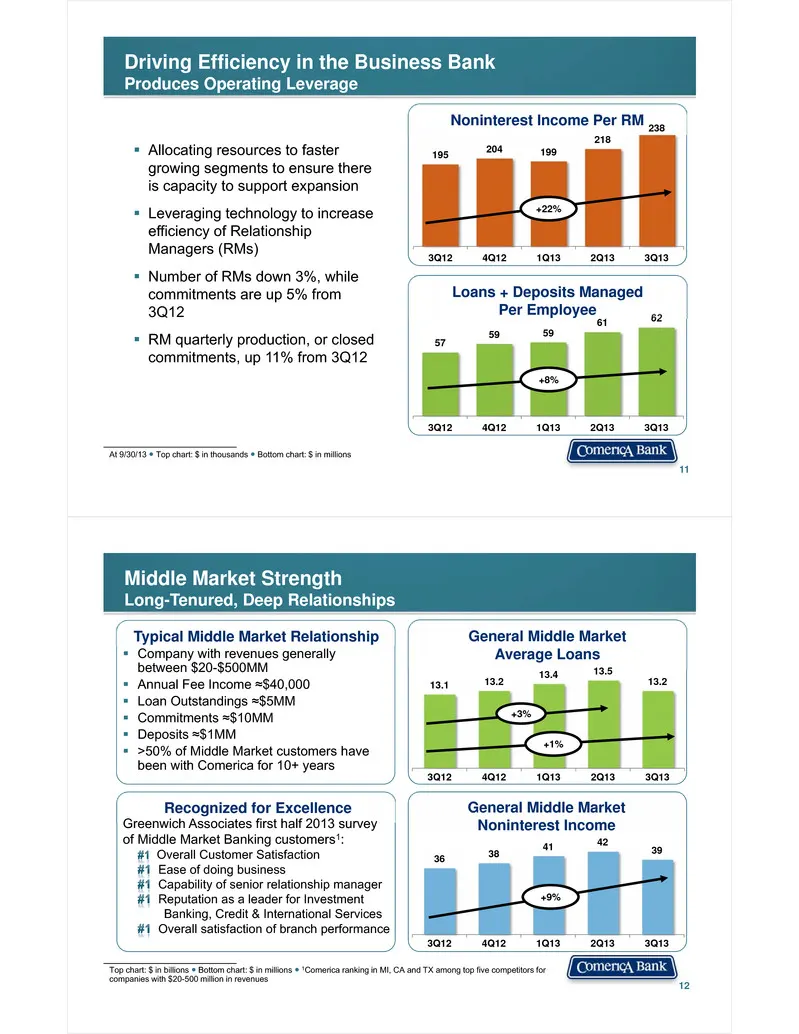
Slide 6: Driving Efficiency in the Business Bank Produces Operating Leverage
57 59 59 61 62 3Q12 4Q12 1Q13 2Q13 3Q13 Driving Efficiency in the Business BankProduces Operating Leverage 11 Allocating resources to faster growing segments to ensure there is capacity to support expansion Leveraging technology to increase efficiency of Relationship Managers (RMs) Number of R
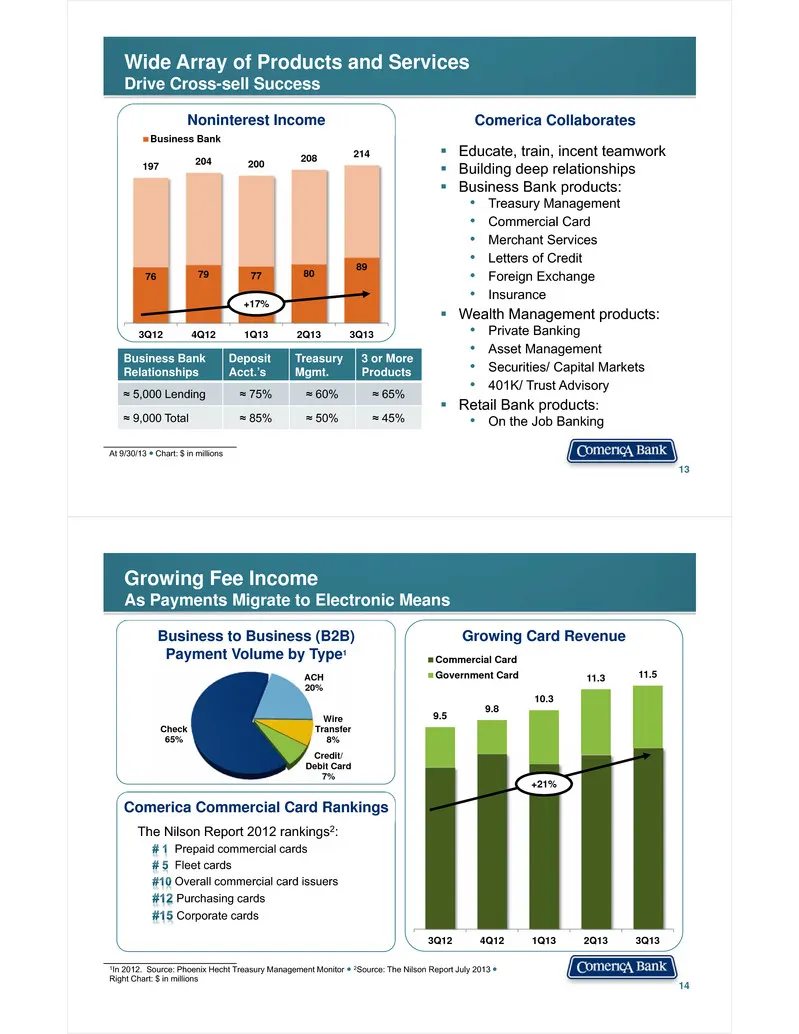
Slide 7: Wide Array of Products and Services Drive Cross-sell Success
Wide Array of Products and ServicesDrive Cross-sell Success 13 Noninterest Income At 9/30/13 ● Chart: $ in millions 76 79 77 80 89 197 204 200 208 214 3Q12 4Q12 1Q13 2Q13 3Q13 Business Bank Business Bank Relationships Deposit Acct.’s Treasury Mgmt. 3 or MoreProducts ≈ 5,000 Lending ≈ 75% ≈ 60% ≈ 65%
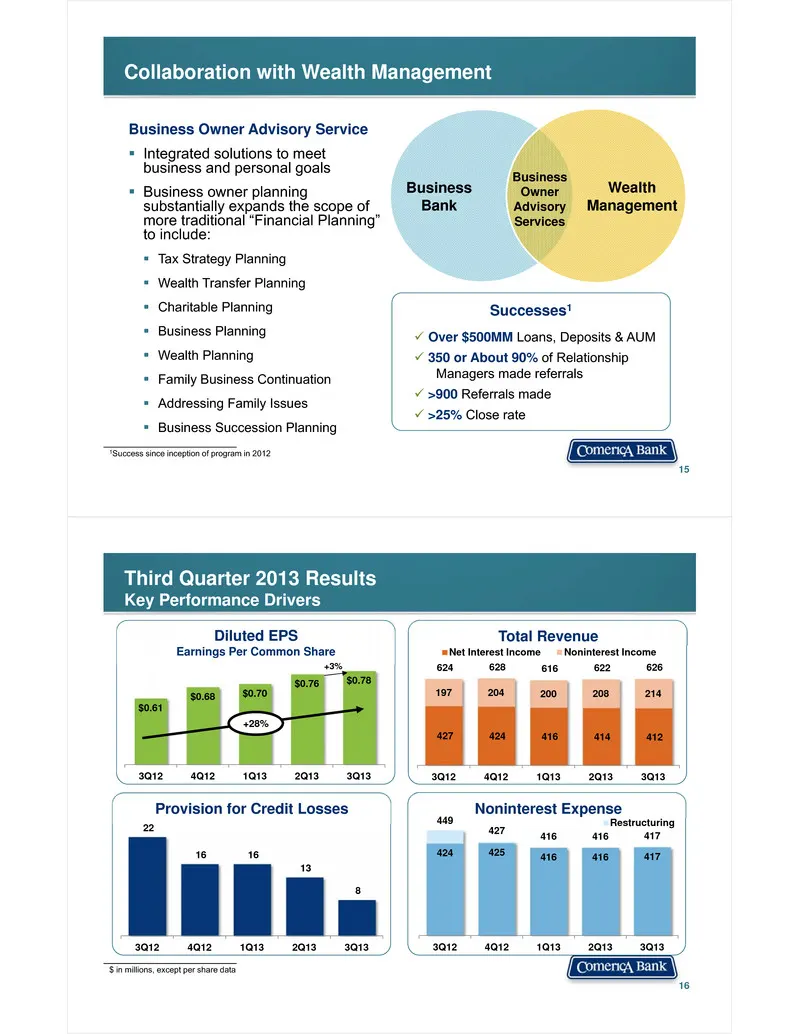
Slide 8: Collaboration with Wealth Management Business Owner Advisory Service
Collaboration with Wealth Management Business Owner Advisory Service Integrated solutions to meet business and personal goals Business owner planning substantially expands the scope of more traditional “Financial Planning” to include: Tax Strategy Planning Wealth Transfer Planning Charitab
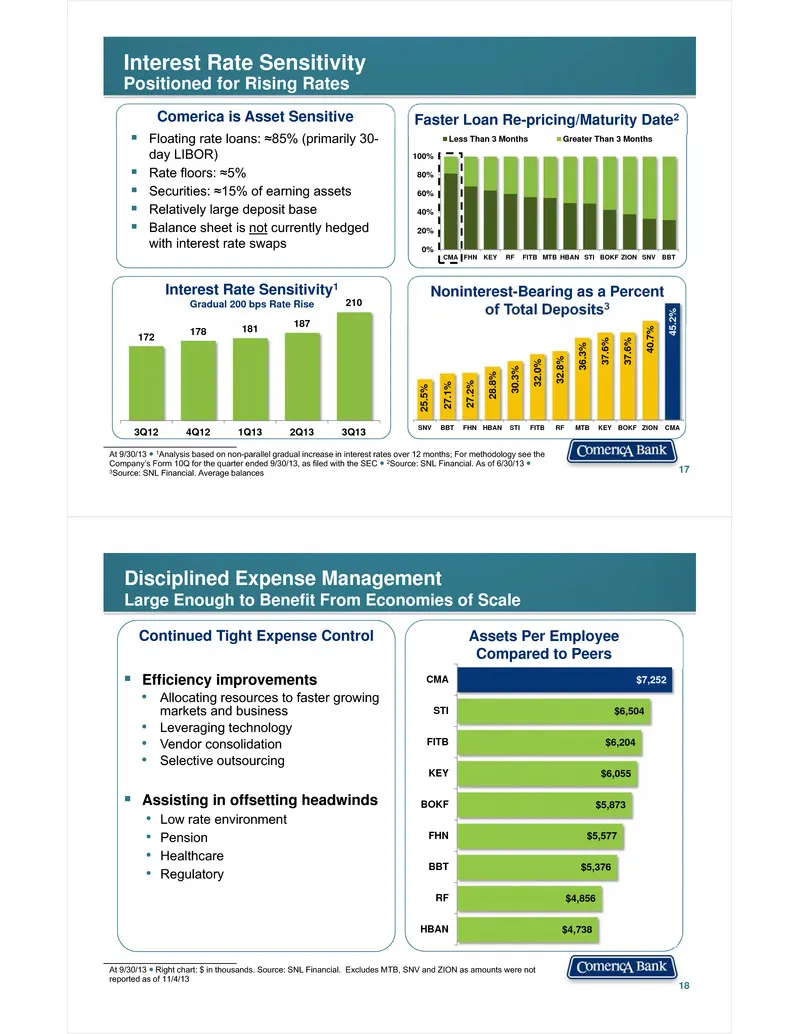
Slide 9: Positioned for Rising Rates
At 9/30/13 ● 1Analysis based on non-parallel gradual increase in interest rates over 12 months; For methodology see the Company’s Form 10Q for the quarter ended 9/30/13, as filed with the SEC ● 2Source: SNL Financial. As of 6/30/13 ●3Source: SNL Financial. Average balances Faster Loan Re-pricing/Mat
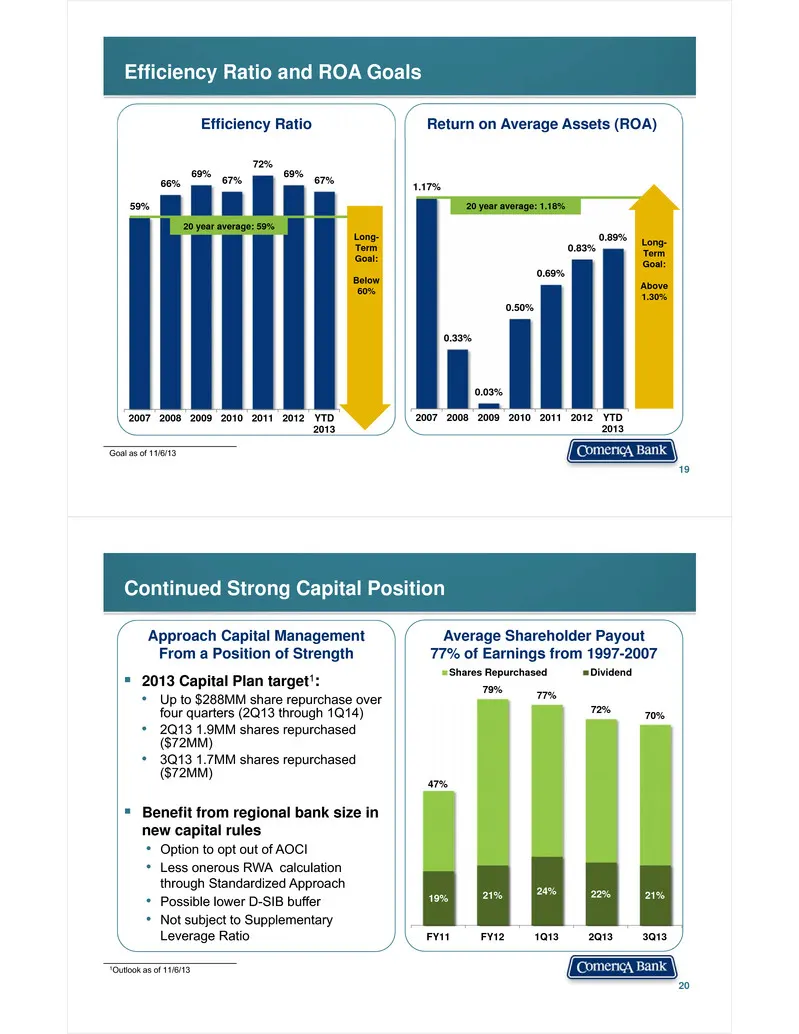
Slide 10: Efficiency Ratio and ROA Goals; Continued Strong Capital Position
Efficiency Ratio and ROA Goals 19 Goal as of 11/6/13 Efficiency Ratio Return on Average Assets (ROA) 59% 66% 69% 67% 72% 69% 67% 2007 2008 2009 2010 2011 2012 YTD2013 20 year average: 59% 1.17% 0.33% 0.03% 0.50% 0.69% 0.83% 0.89% 2007 2008 2009 2010 2011 2012 YTD2013 20 year average: 1.18% Long-Term
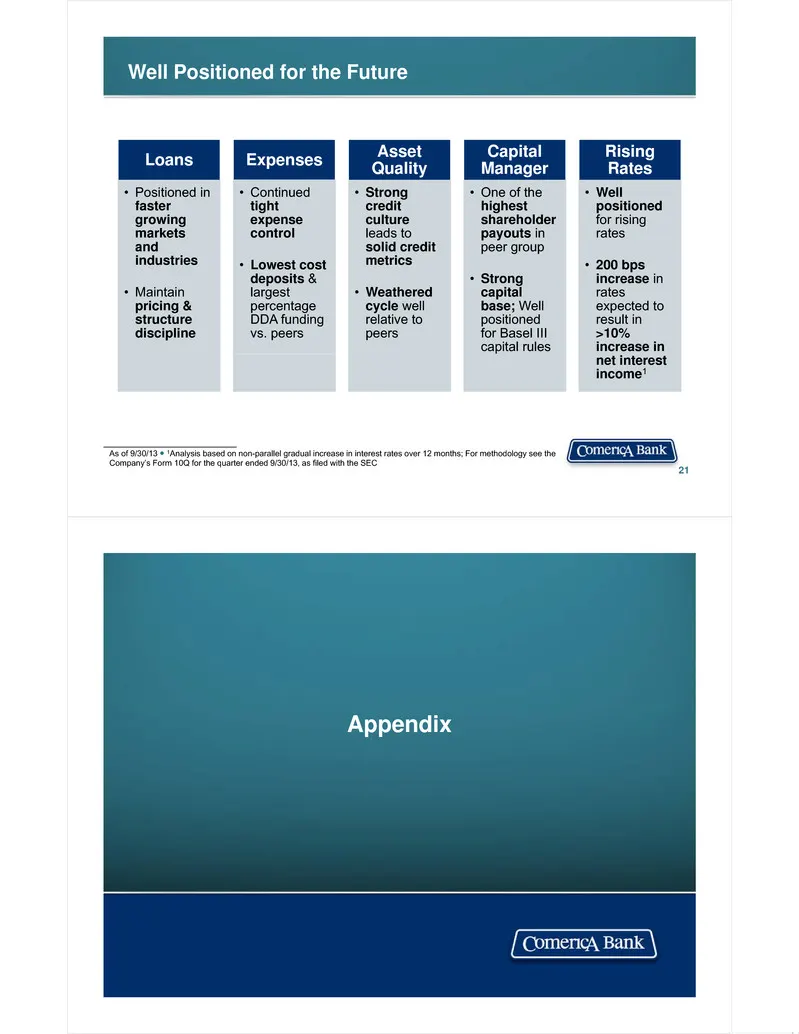
Slide 11: Well Positioned for the Future
21 As of 9/30/13 ● 1Analysis based on non-parallel gradual increase in interest rates over 12 months; For methodology see the Company’s Form 10Q for the quarter ended 9/30/13, as filed with the SEC Well Positioned for the Future Loans • Positioned in faster growing markets and industries • Maintain
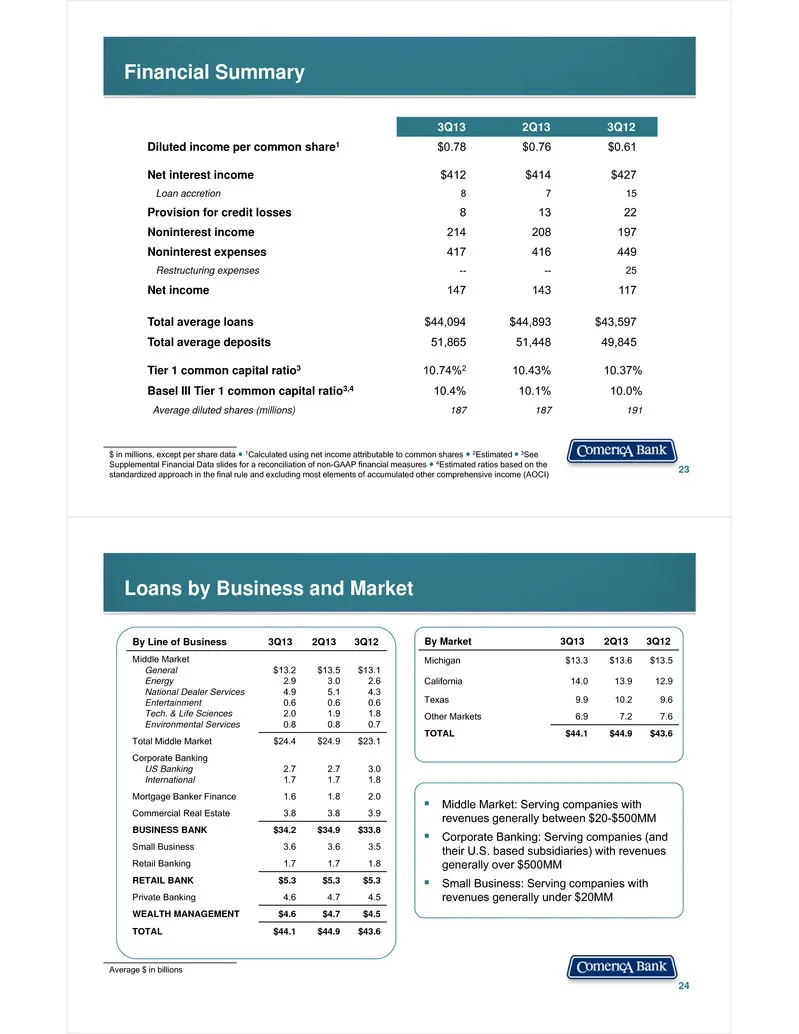
Slide 12: Financial Summary
Financial Summary 23 3Q13 2Q13 3Q12 Diluted income per common share1 $0.78 $0.76 $0.61 Net interest income $412 $414 $427 Loan accretion 8 7 15 Provision for credit losses 8 13 22 Noninterest income 214 208 197 Noninterest expenses 417 416 449 Restructuring expenses -- -- 25 Net income 147 143 117 T
Slide 13: Deposits by Business and Market
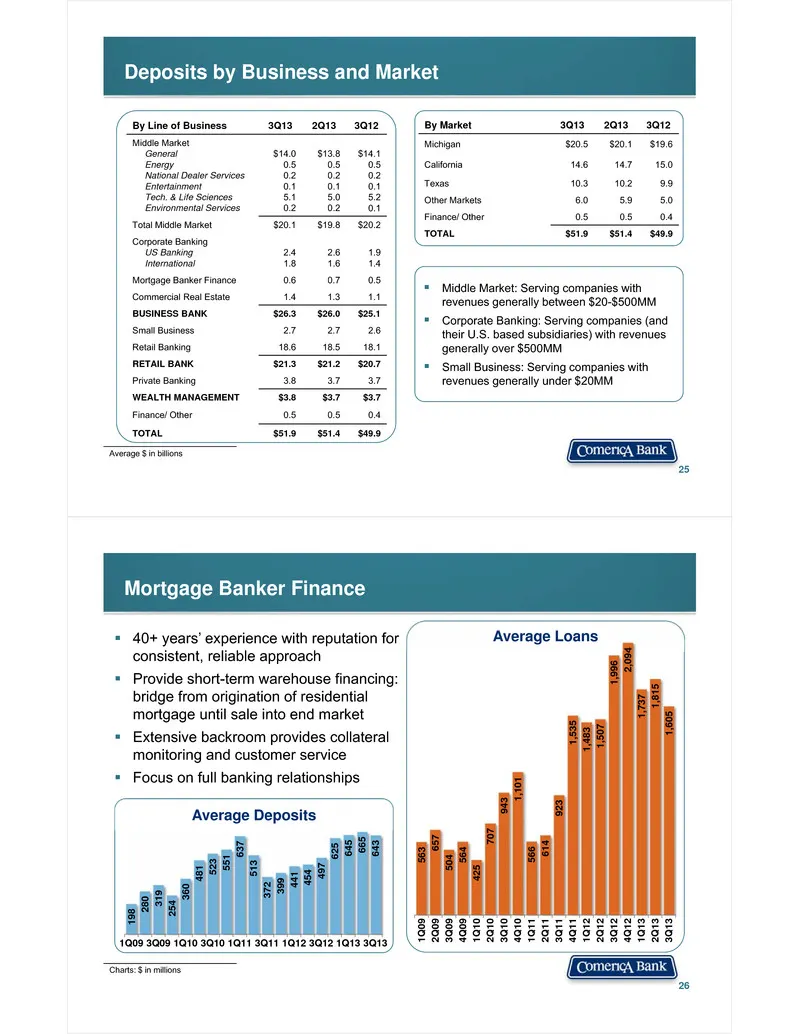
Deposits by Business and Market 25 Middle Market: Serving companies with revenues generally between $20-$500MM Corporate Banking: Serving companies (and their U.S. based subsidiaries) with revenues generally over $500MM Small Business: Serving companies with revenues generally under $20MM Aver
Slide 14: National Dealer Services Line of Business
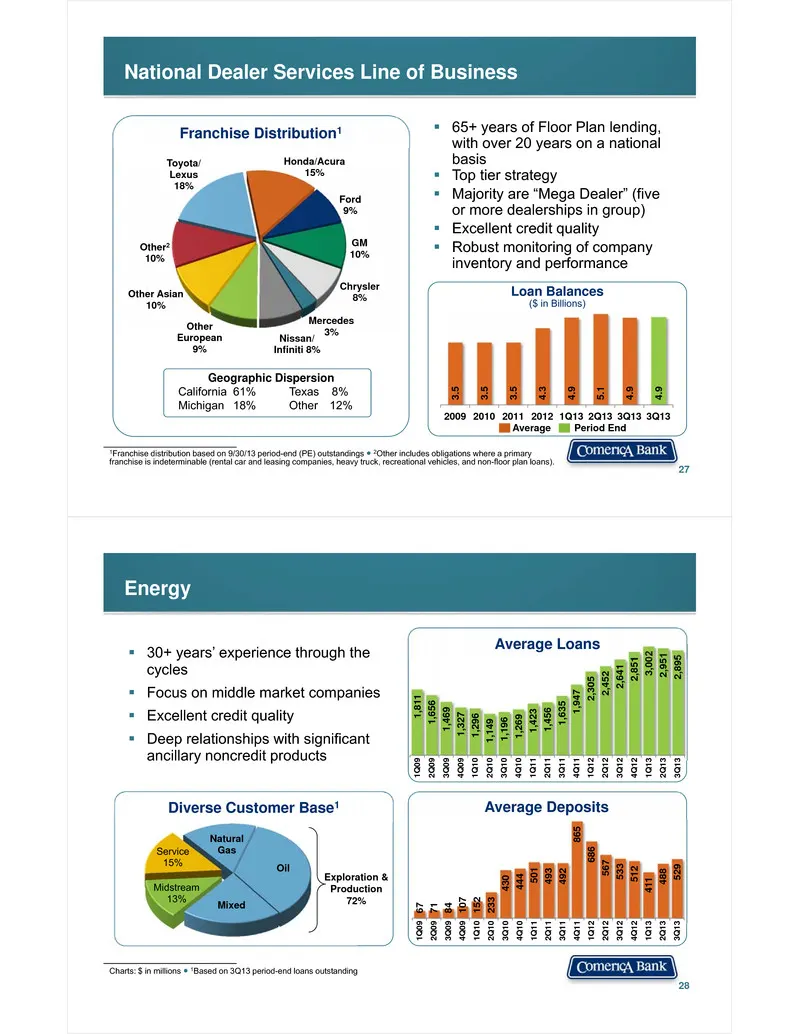
National Dealer Services Line of Business 27 Toyota/Lexus18% Honda/Acura 15% Ford 9% GM 10% Chrysler 8% Mercedes 3%Nissan/ Infiniti 8% Other European 9% Other Asian 10% Other210% 65+ years of Floor Plan lending, with over 20 years on a national basis Top tier strategy Majority are “Mega Dealer
Slide 15: Technology and Life Sciences
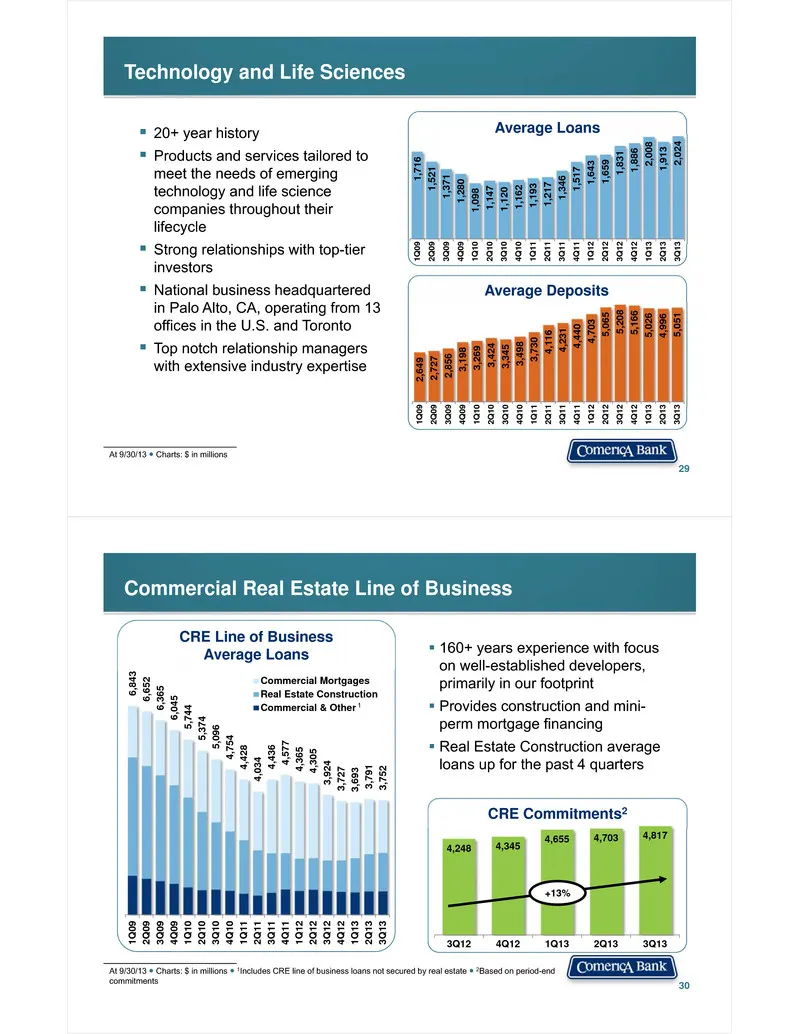
Technology and Life Sciences 20+ year history Products and services tailored to meet the needs of emerging technology and life science companies throughout their lifecycle Strong relationships with top-tier investors National business headquartered in Palo Alto, CA, operating from 13 offices
Slide 16: Shared National Credit Relationships
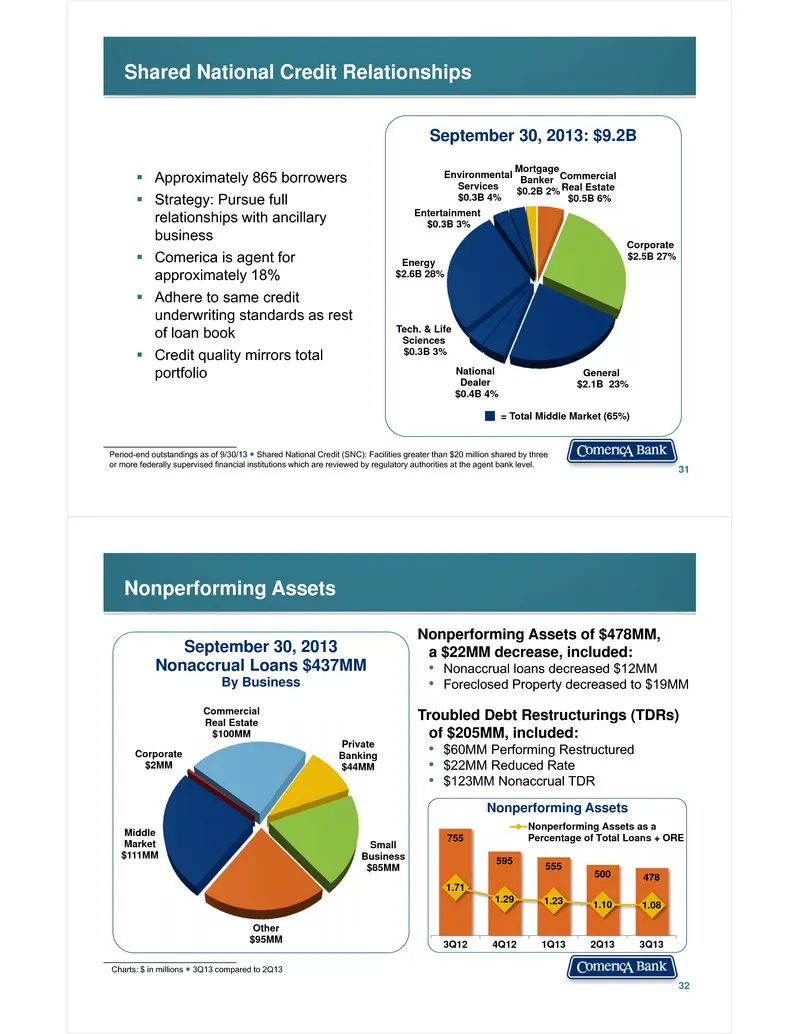
Shared National Credit Relationships 31 Approximately 865 borrowers Strategy: Pursue full relationships with ancillary business Comerica is agent for approximately 18% Adhere to same credit underwriting standards as rest of loan book Credit quality mirrors total portfolio Commercial Real E
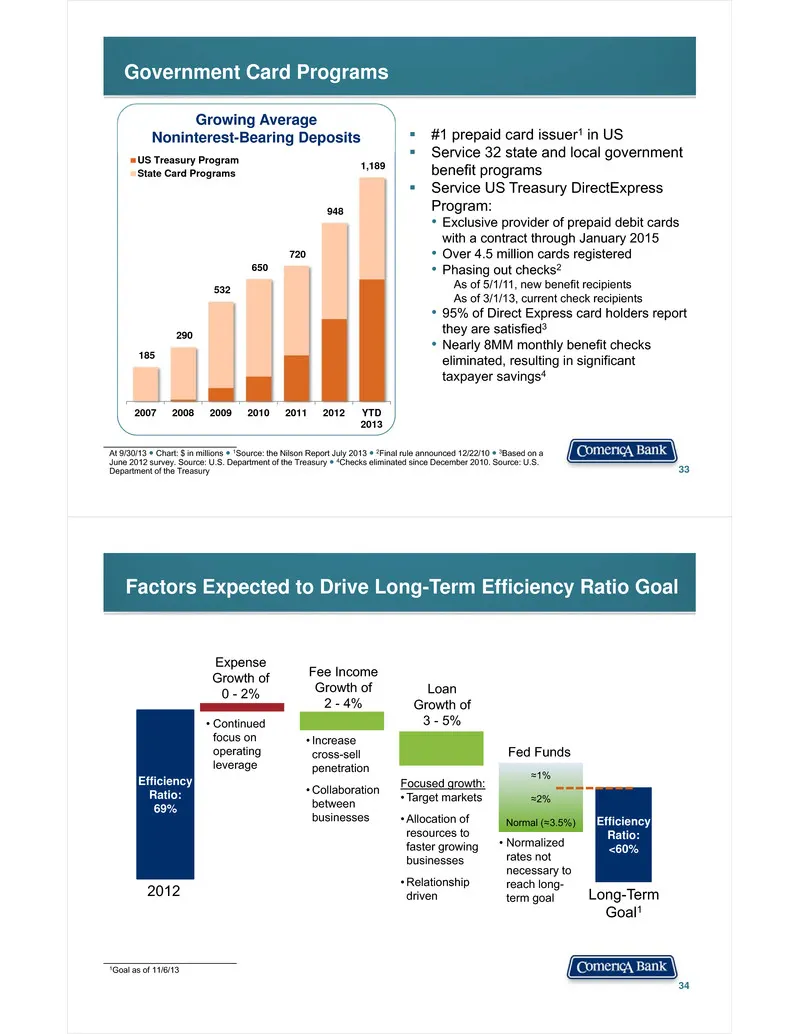
Slide 17: Government Card Programs
Growing Average Noninterest-Bearing Deposits Government Card Programs 33 #1 prepaid card issuer1 in US Service 32 state and local government benefit programs Service US Treasury DirectExpress Program:• Exclusive provider of prepaid debit cards with a contract through January 2015• Over 4.5 mil
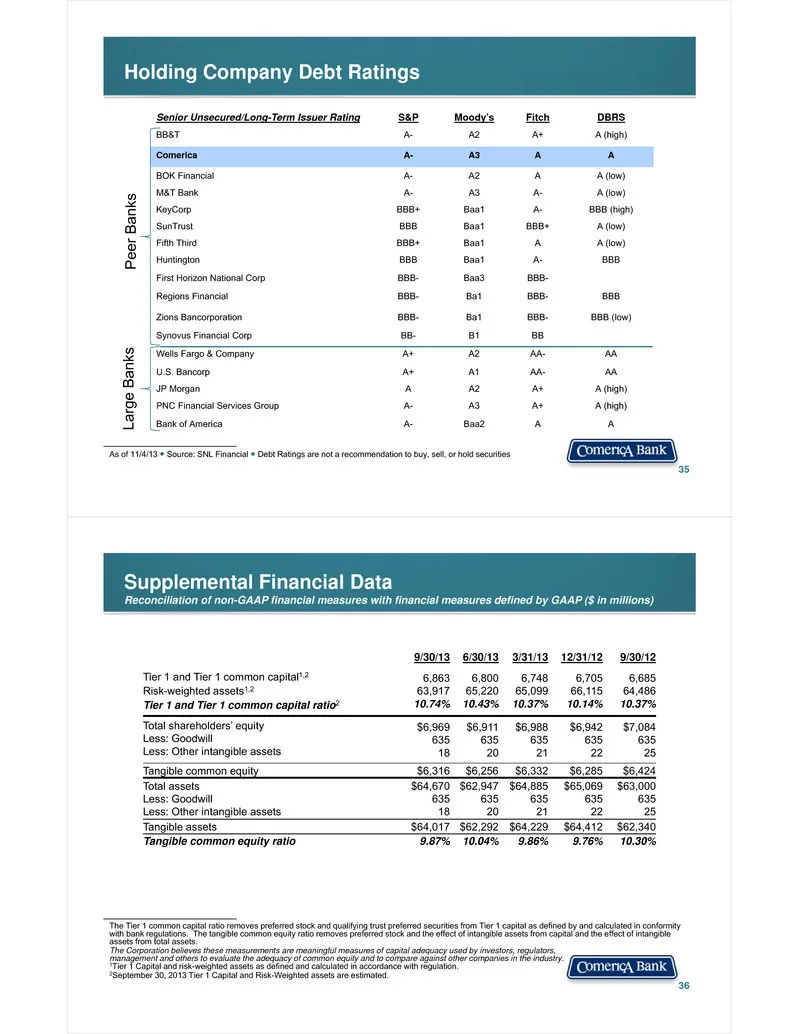
Slide 18: Holding Company Debt Ratings
Senior Unsecured/Long-Term Issuer Rating S&P Moody’s Fitch DBRS BB&T A- A2 A+ A (high) Comerica A- A3 A A BOK Financial A- A2 A A (low) M&T Bank A- A3 A- A (low) KeyCorp BBB+ Baa1 A- BBB (high) SunTrust BBB Baa1 BBB+ A (low) Fifth Third BBB+ Baa1 A A (low) Huntington BBB Baa1 A- BBB First Horizon Na
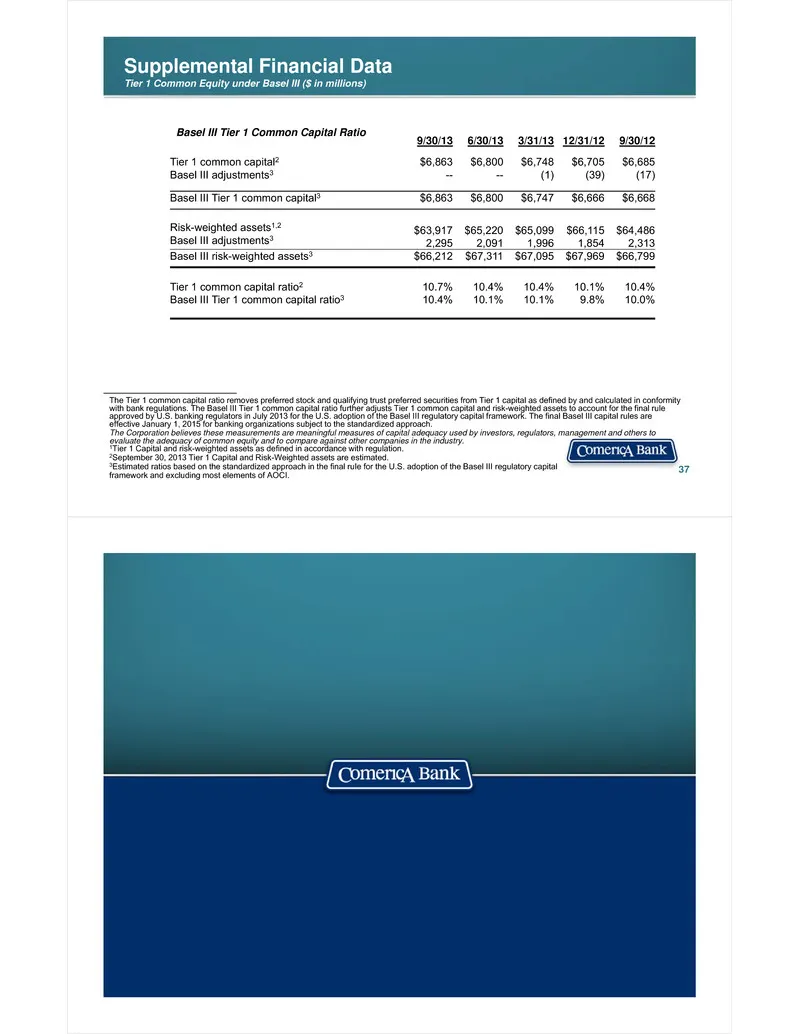
Slide 19: Supplemental Financial Data: Tier 1 Common Equity under Basel III
Supplemental Financial DataTier 1 Common Equity under Basel III ($ in millions) 37 The Tier 1 common capital ratio removes preferred stock and qualifying trust preferred securities from Tier 1 capital as defined by and calculated in conformity with bank regulations. The Basel III Tier 1 common capit
Source: SEC EDGAR · 8-K filed Nov 6, 2013
More decks from Comerica Incorporated
 Goldman Sachs Financial Services Conference 202520 slides · Dec 11, 2025
 Merger or Acquisition (October 2025)18 slides · Oct 6, 2025
 Barclays Global Financial Services Conference 202524 slides · Sep 8, 2025
 Q2 2025 Earnings Presentation24 slides · Jul 18, 2025
 Q1 2025 Earnings Presentation21 slides · Apr 21, 2025
 Q4 2024 Earnings Presentation24 slides · Jan 22, 2025