OMNOVA Solutions — Deutsche Bank's 2010 Leveraged Finance Conference
33 slides from OMNOVA Solutions's conference presentation, Oct 6, 2010
Slide 1: Deutsche Bank's 2010 Leveraged Finance Conference
Exhibit 99 Deutsche Bank’s 2010 Leveraged Finance Conference October 6-7, 2010
Slide 2: Cautionary Forward-Looking Statements
Cautionary Forward-Looking Statements • This presentation and the accompanying oral remarks include “forward-looking statements” as defined by federal securities laws. These statements, as well as any verbal statements by the Company in connection with this presentation, are intended to qualify for
Slide 3: OMNOVA management
OMNOVA management Kevin M. McMullen Chairman, Chief Executive Officer and President Michael E. Hicks Senior Vice President and Chief Financial Officer James C. LeMay Senior Vice President, Business Development, General Counsel Chester W. Fox Vice President, Treasurer 3
Slide 4: OMNOVA overview
OMNOVA overview 4
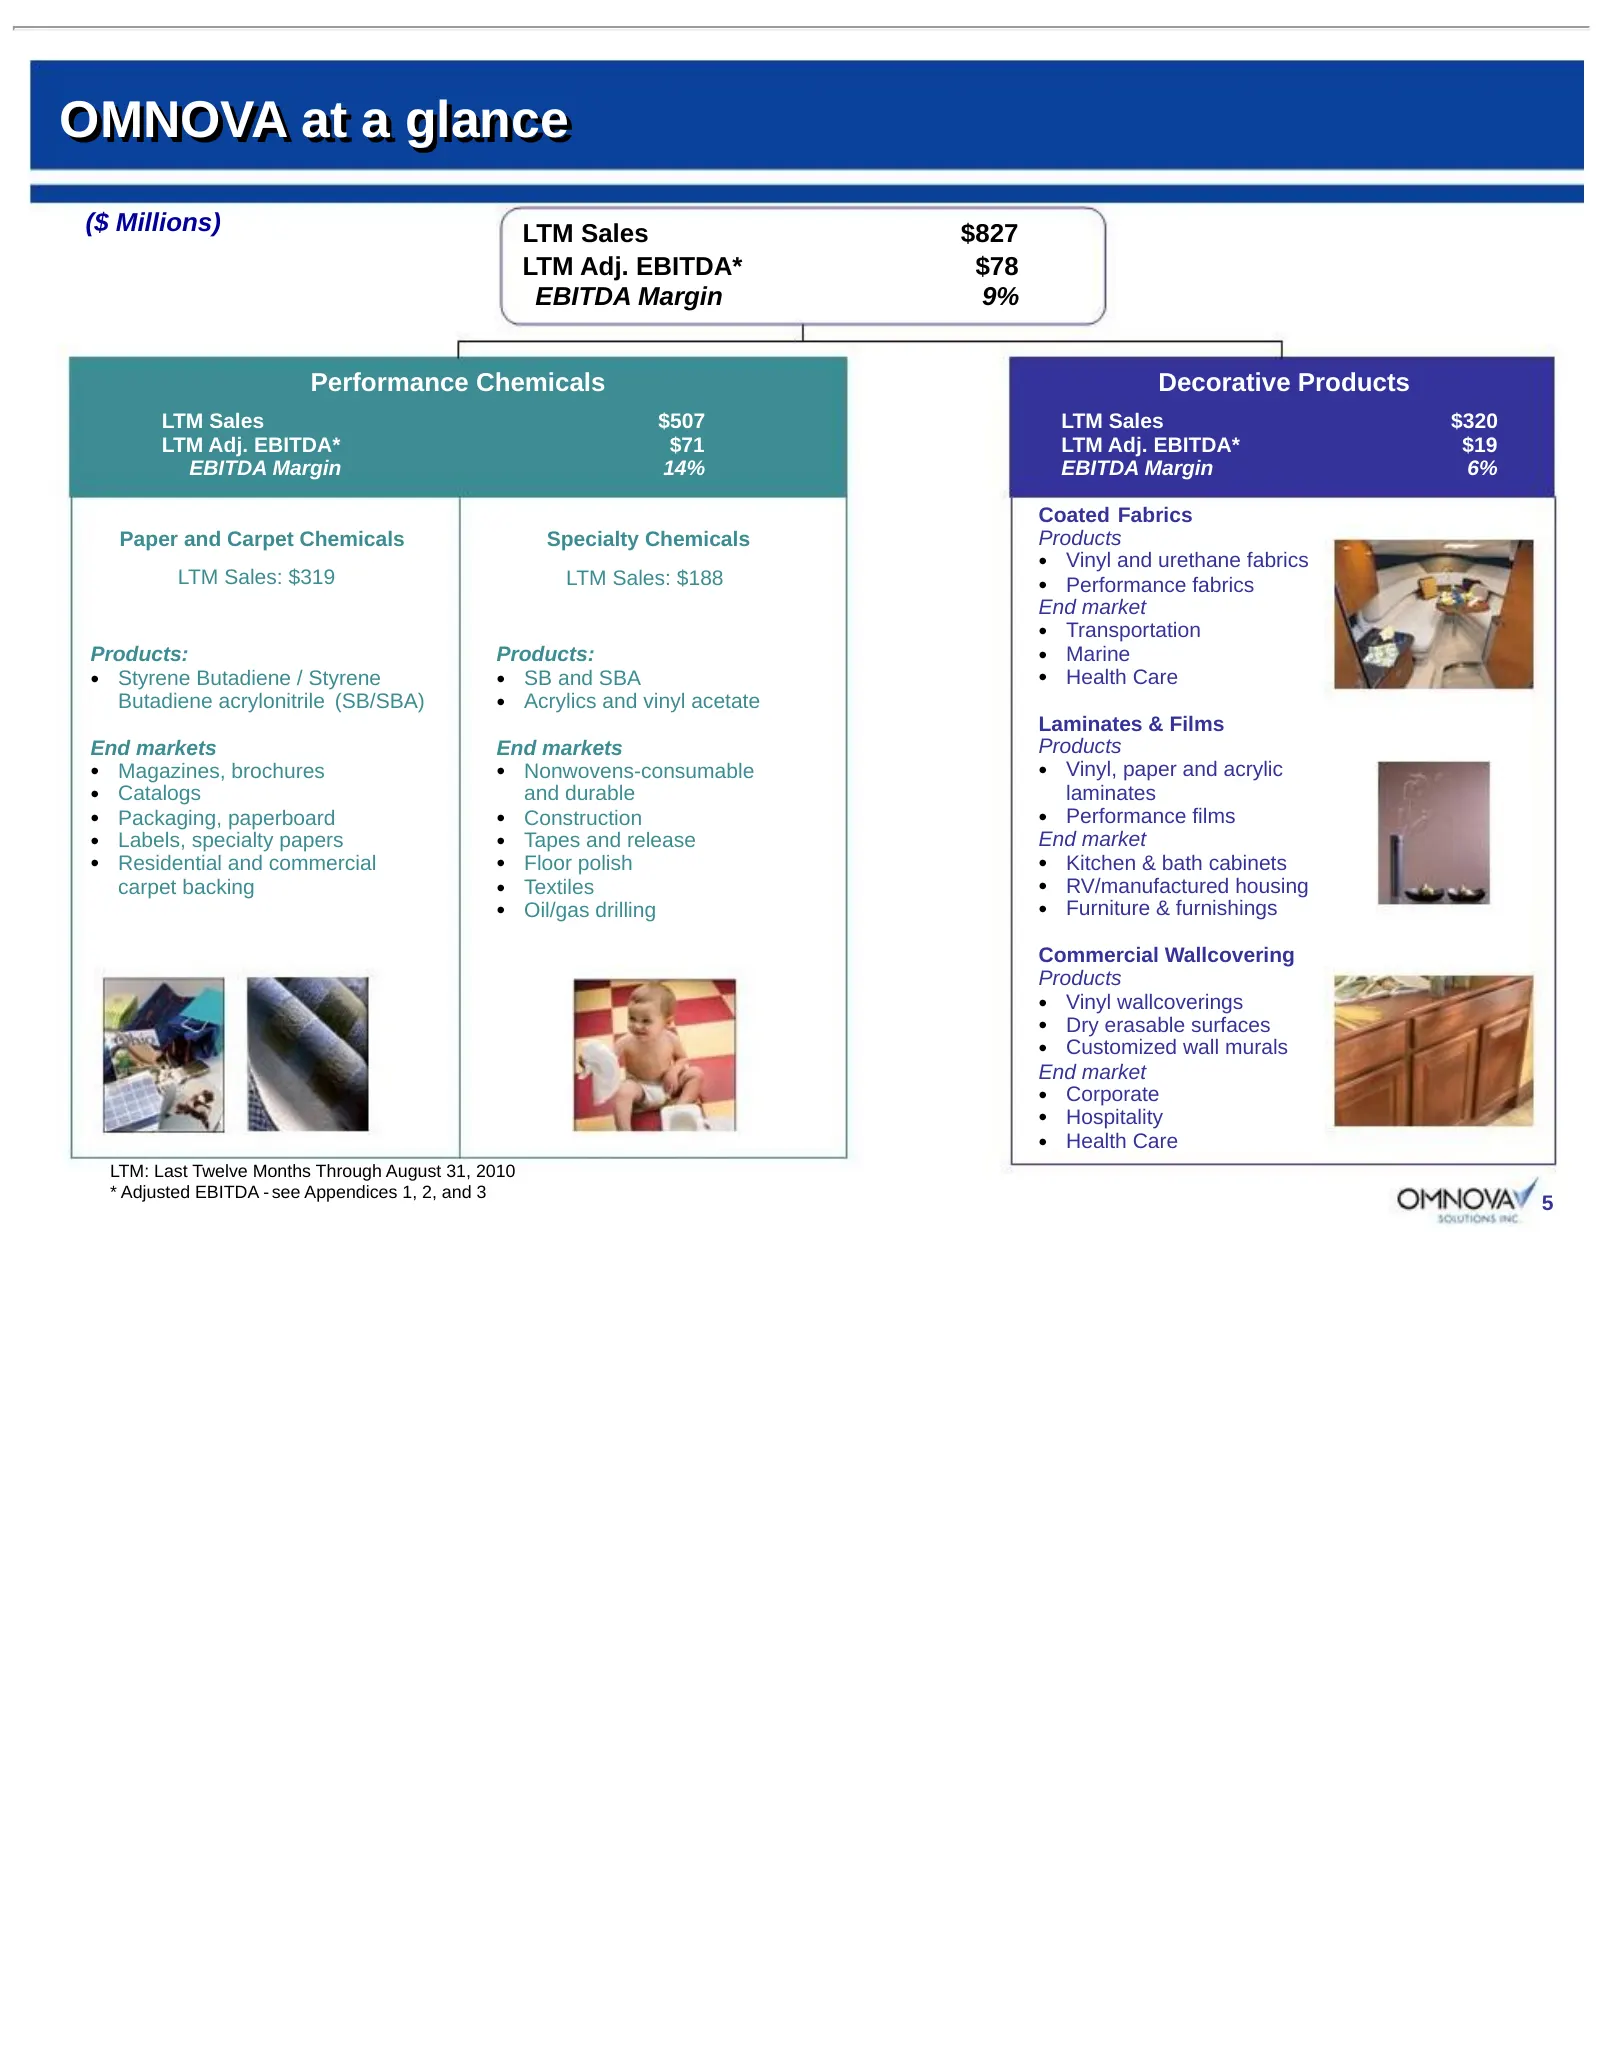
Slide 5: OMNOVA at a glance
OMNOVA at a glance ($ Millions) LTM Sales $827 LTM Adj. EBITDA* $78 EBITDA Margin 9% Performance Chemicals Decorative Products LTM Sales $507 LTM Sales $320 LTM Adj. EBITDA* $71 LTM Adj. EBITDA* $19 EBITDA Margin 14% EBITDA Margin 6% Coated Fabrics Paper and Carpet Chemicals Specialty Chemicals Prod
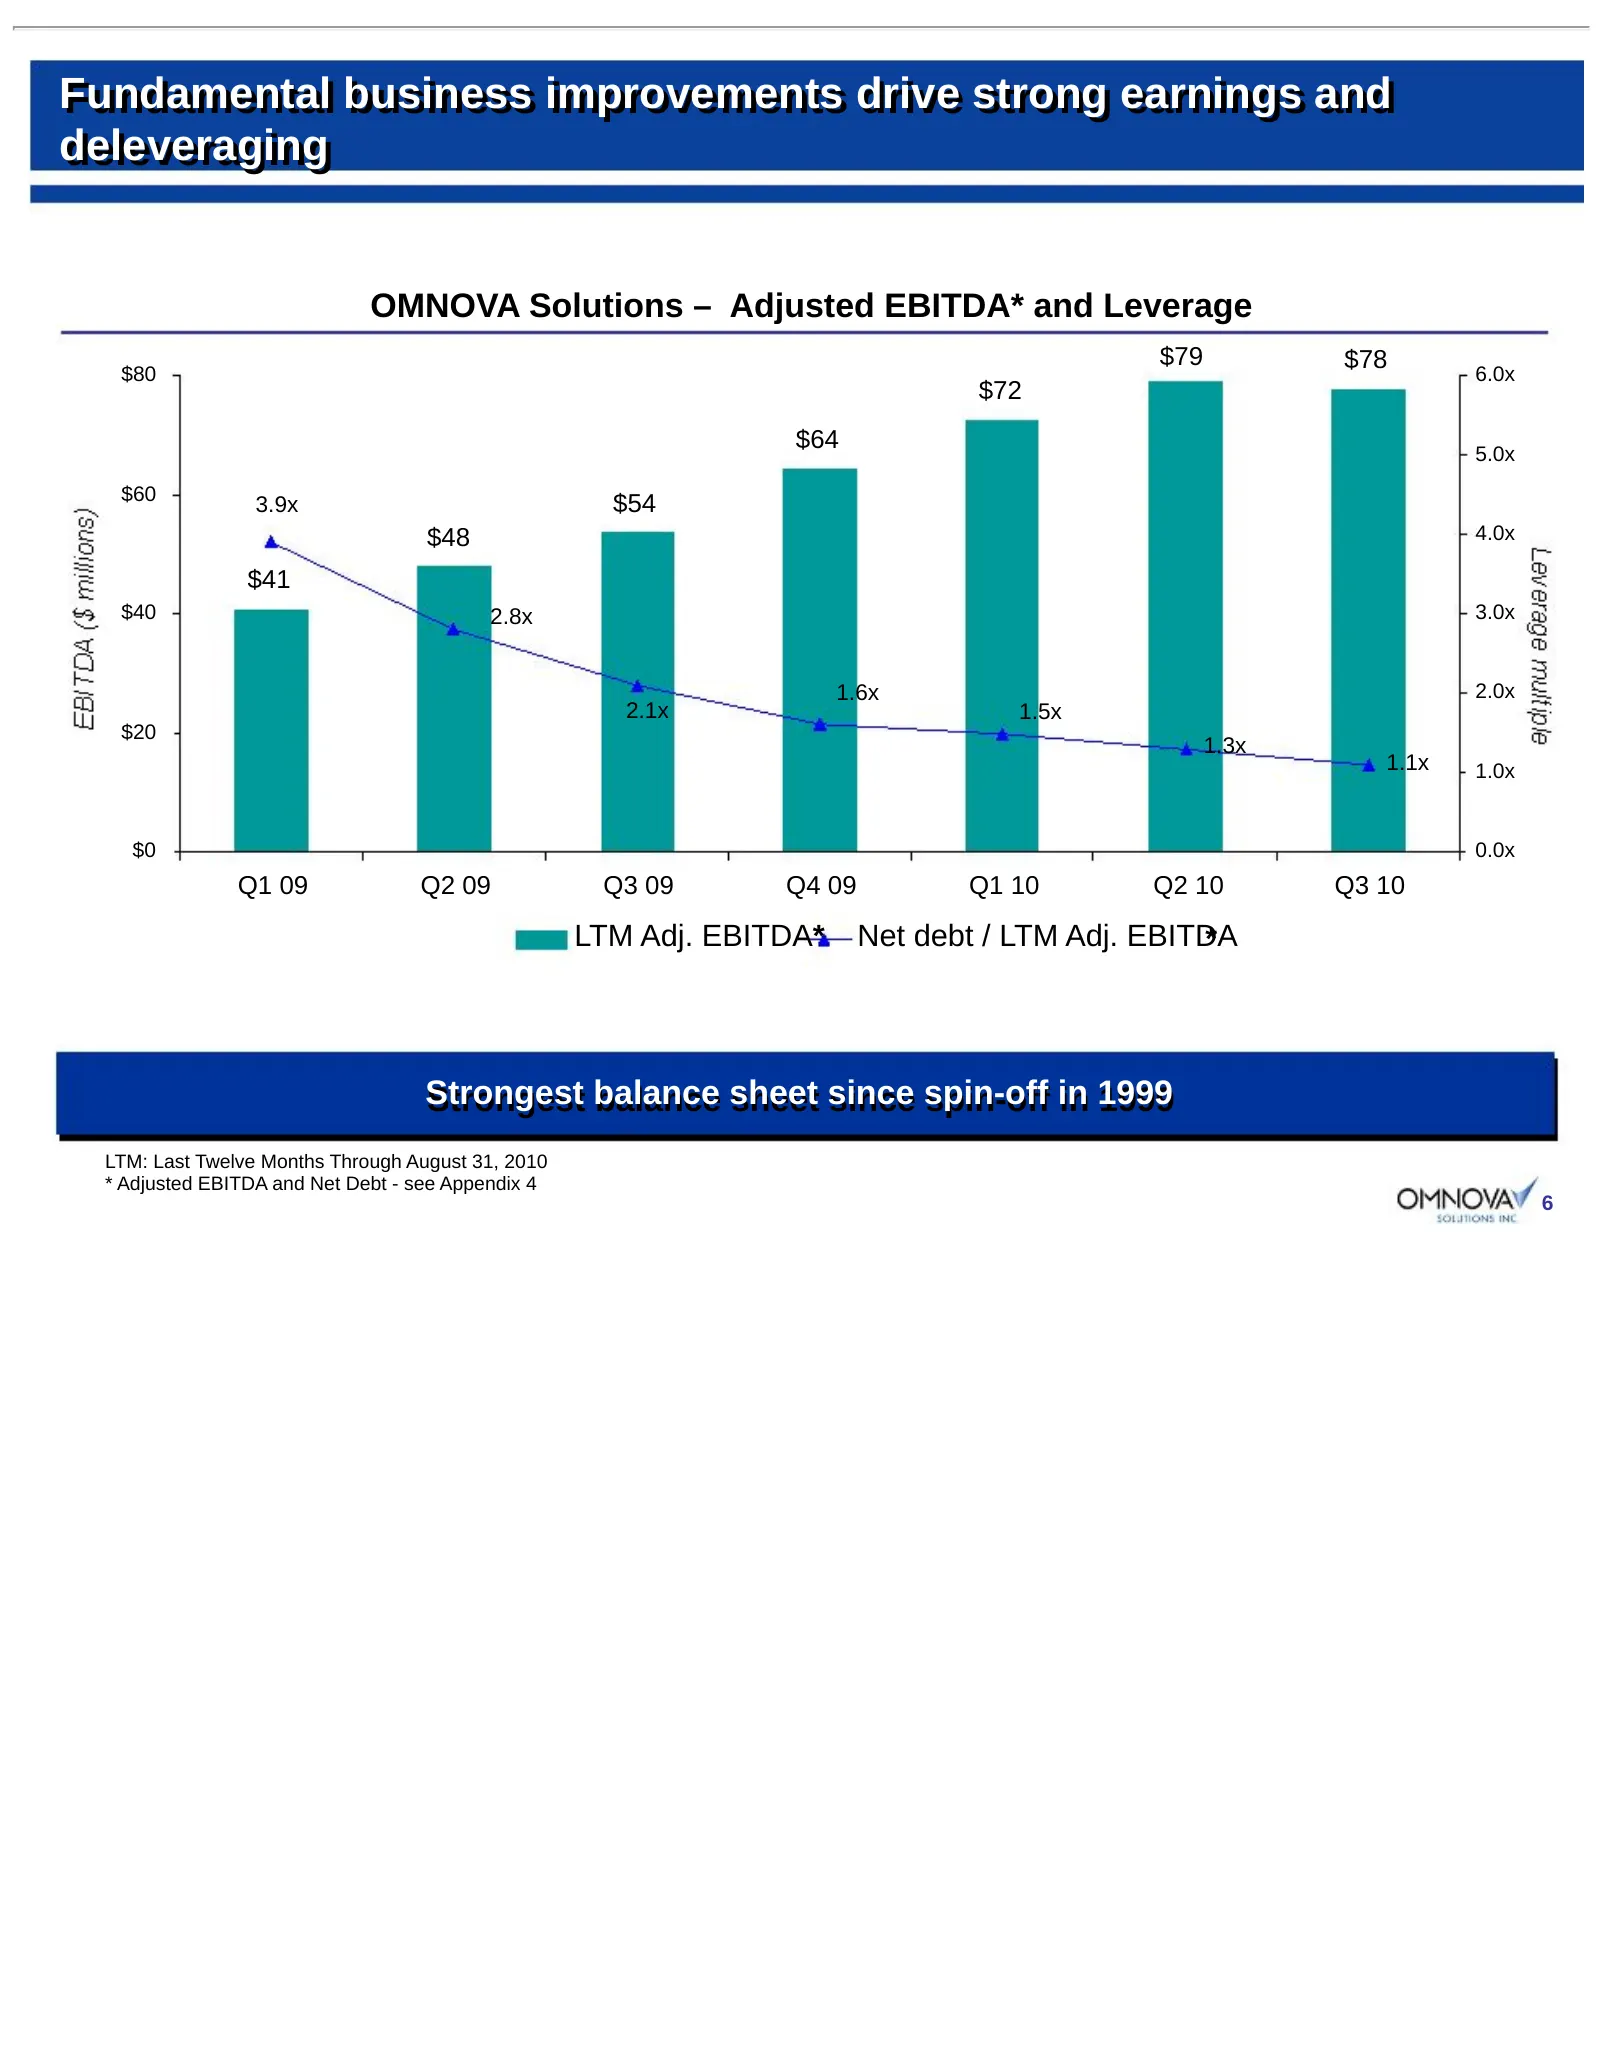
Slide 6: Fundamental business improvements drive strong earnings and deleveraging
Fundamental Fundamental business business improvements improvements drive drive strong strong earnings earnings and and deleveraging deleveraging OMNOVA Solutions – Adjusted EBITDA* and Leverage $79 $78 $80 6.0x $72 $64 5.0x $60 3.9x $54 $48 4.0x $41 $40 2.8x 3.0x 1.6x 2.0x 2.1x 1.5x $20 1.3x 1.1x 1
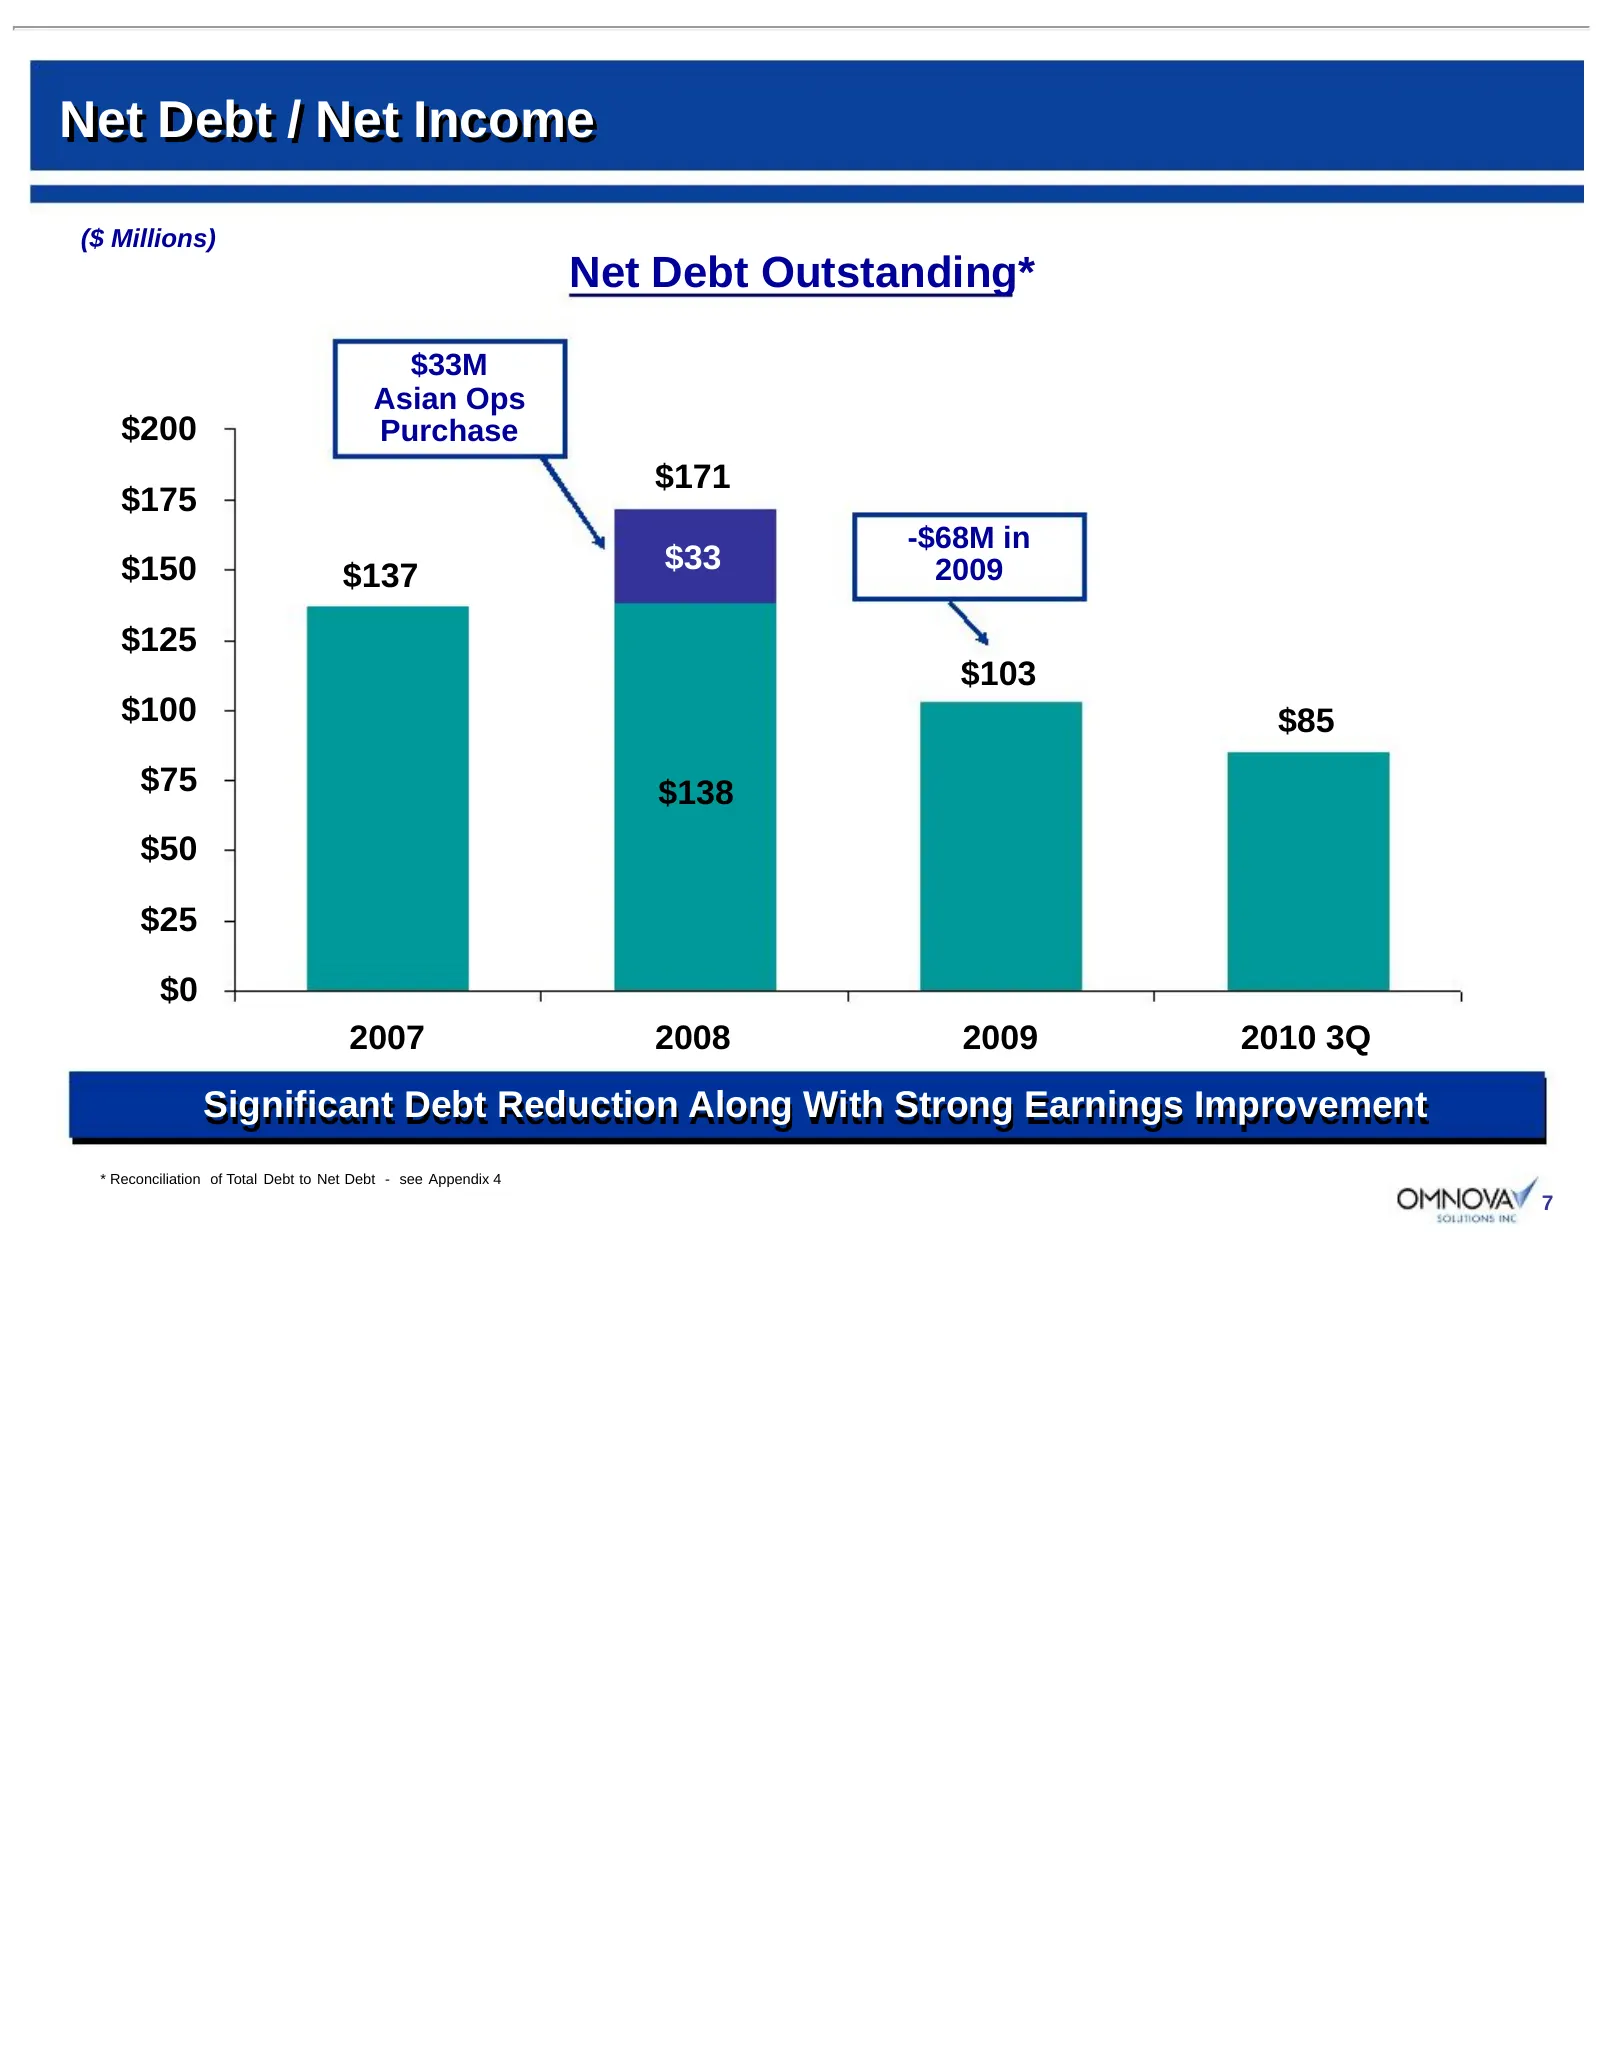
Slide 7: Net Debt / Net Income
Net Debt / Net Income ($ Millions) Net Debt Outstanding* $33M Asian Ops $200 Purchase $171 $175 -$68M in $150 $33 2009 $137 $125 $103 $100 $85 $75 $138 $50 $25 $0 2007 2008 2009 2010 3Q Significant Debt Reduction Along With Strong Earnings Improvement * Reconciliation of Total Debt to Net Debt - see
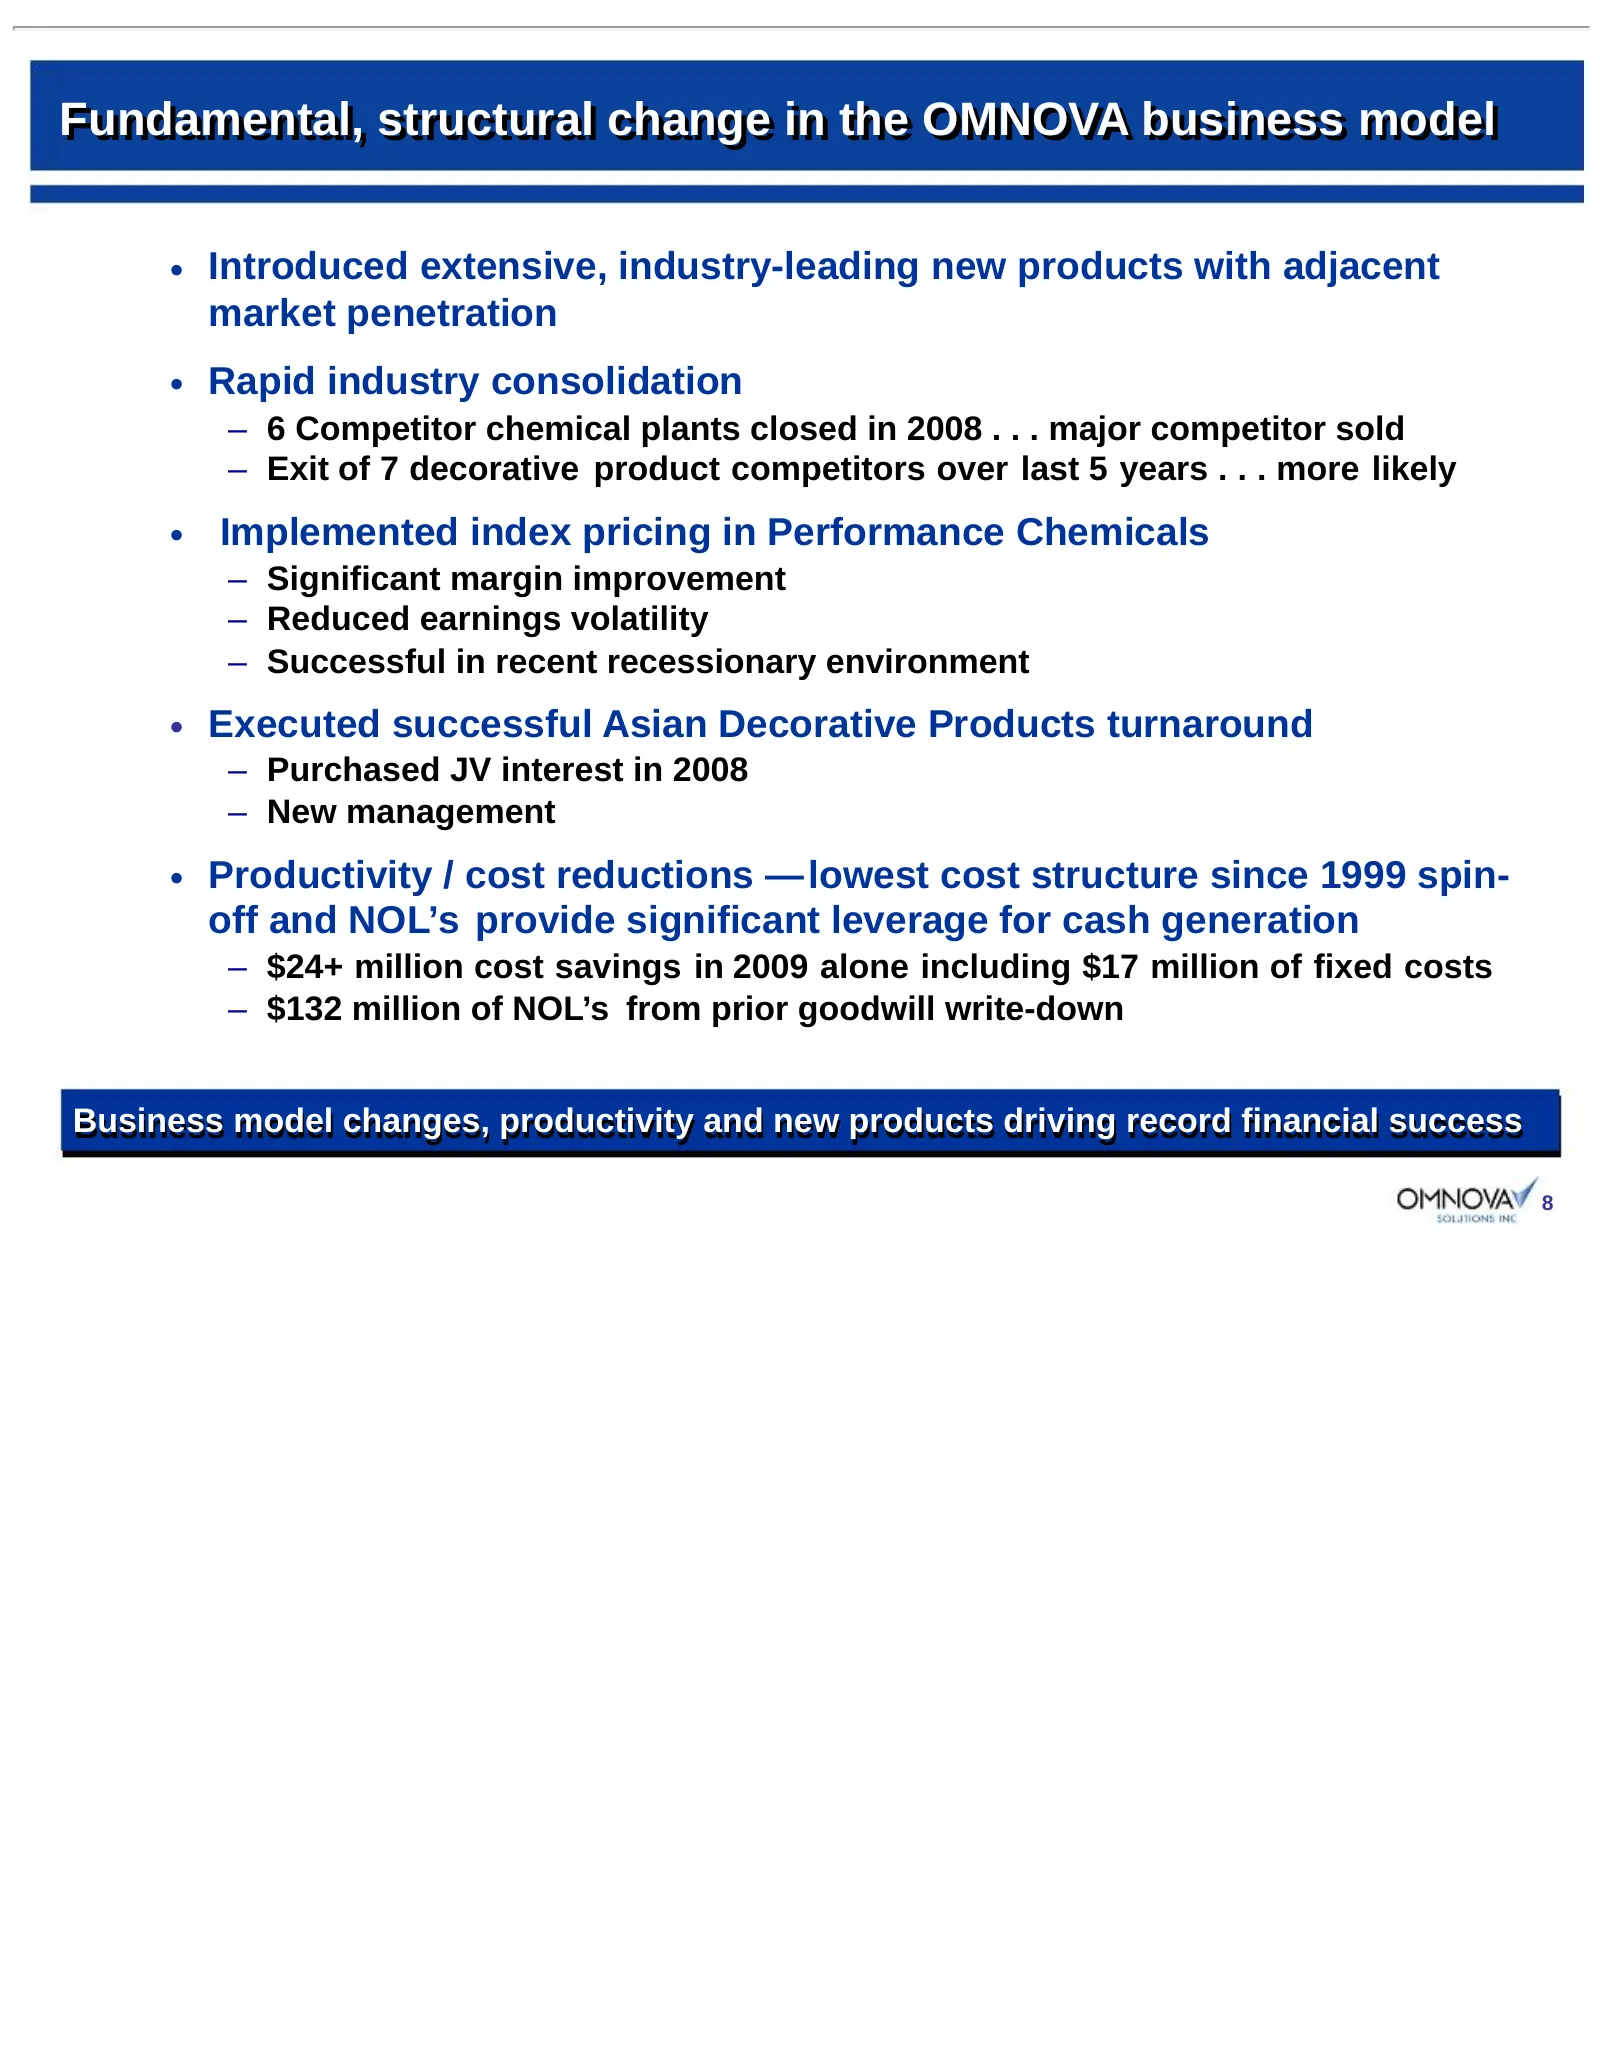
Slide 8: Fundamental, structural change in the OMNOVA business model
Fundamental, Fundamental, structural structural change change in in the the OMNOVA OMNOVA business business model model • Introduced extensive, industry-leading new products with adjacent market penetration • Rapid industry consolidation – 6 Competitor chemical plants closed in 2008 . . . major comp
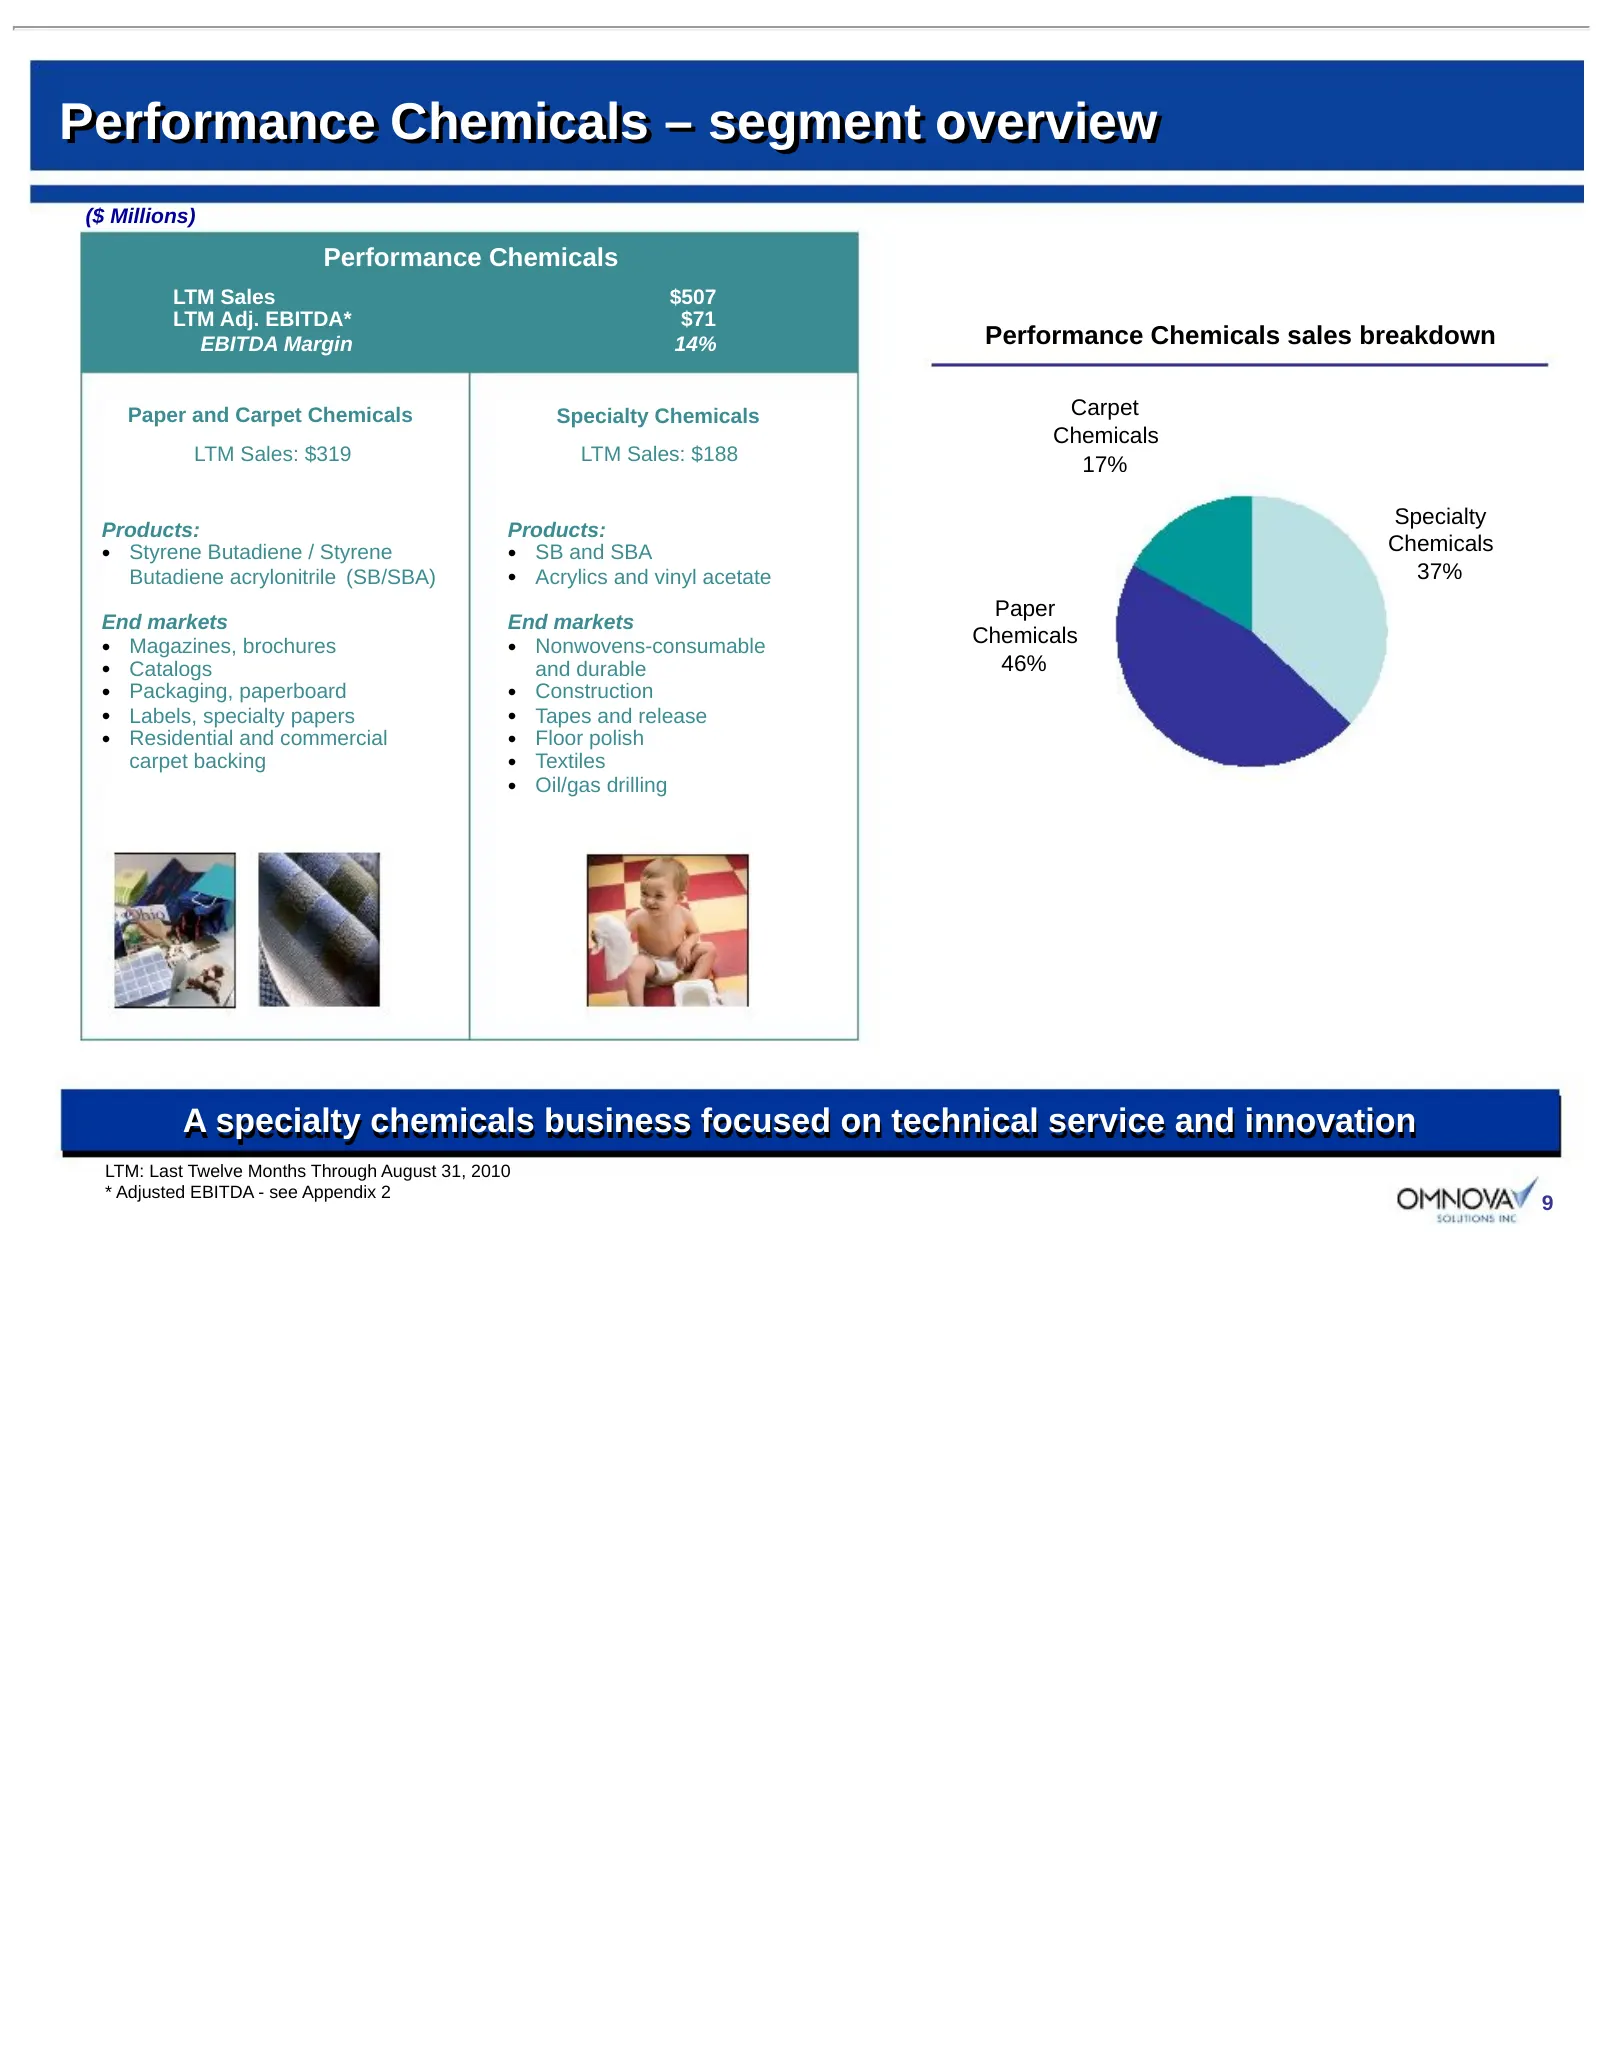
Slide 9: Performance Chemicals – segment overview
Performance Chemicals – segment overview ($ Millions) Performance Chemicals LTM Sales $507 LTM Adj. EBITDA* $71 EBITDA Margin 14% Performance Chemicals sales breakdown Paper and Carpet Chemicals Specialty Chemicals Carpet Chemicals LTM Sales: $319 LTM Sales: $188 17% Specialty Products: Products: •
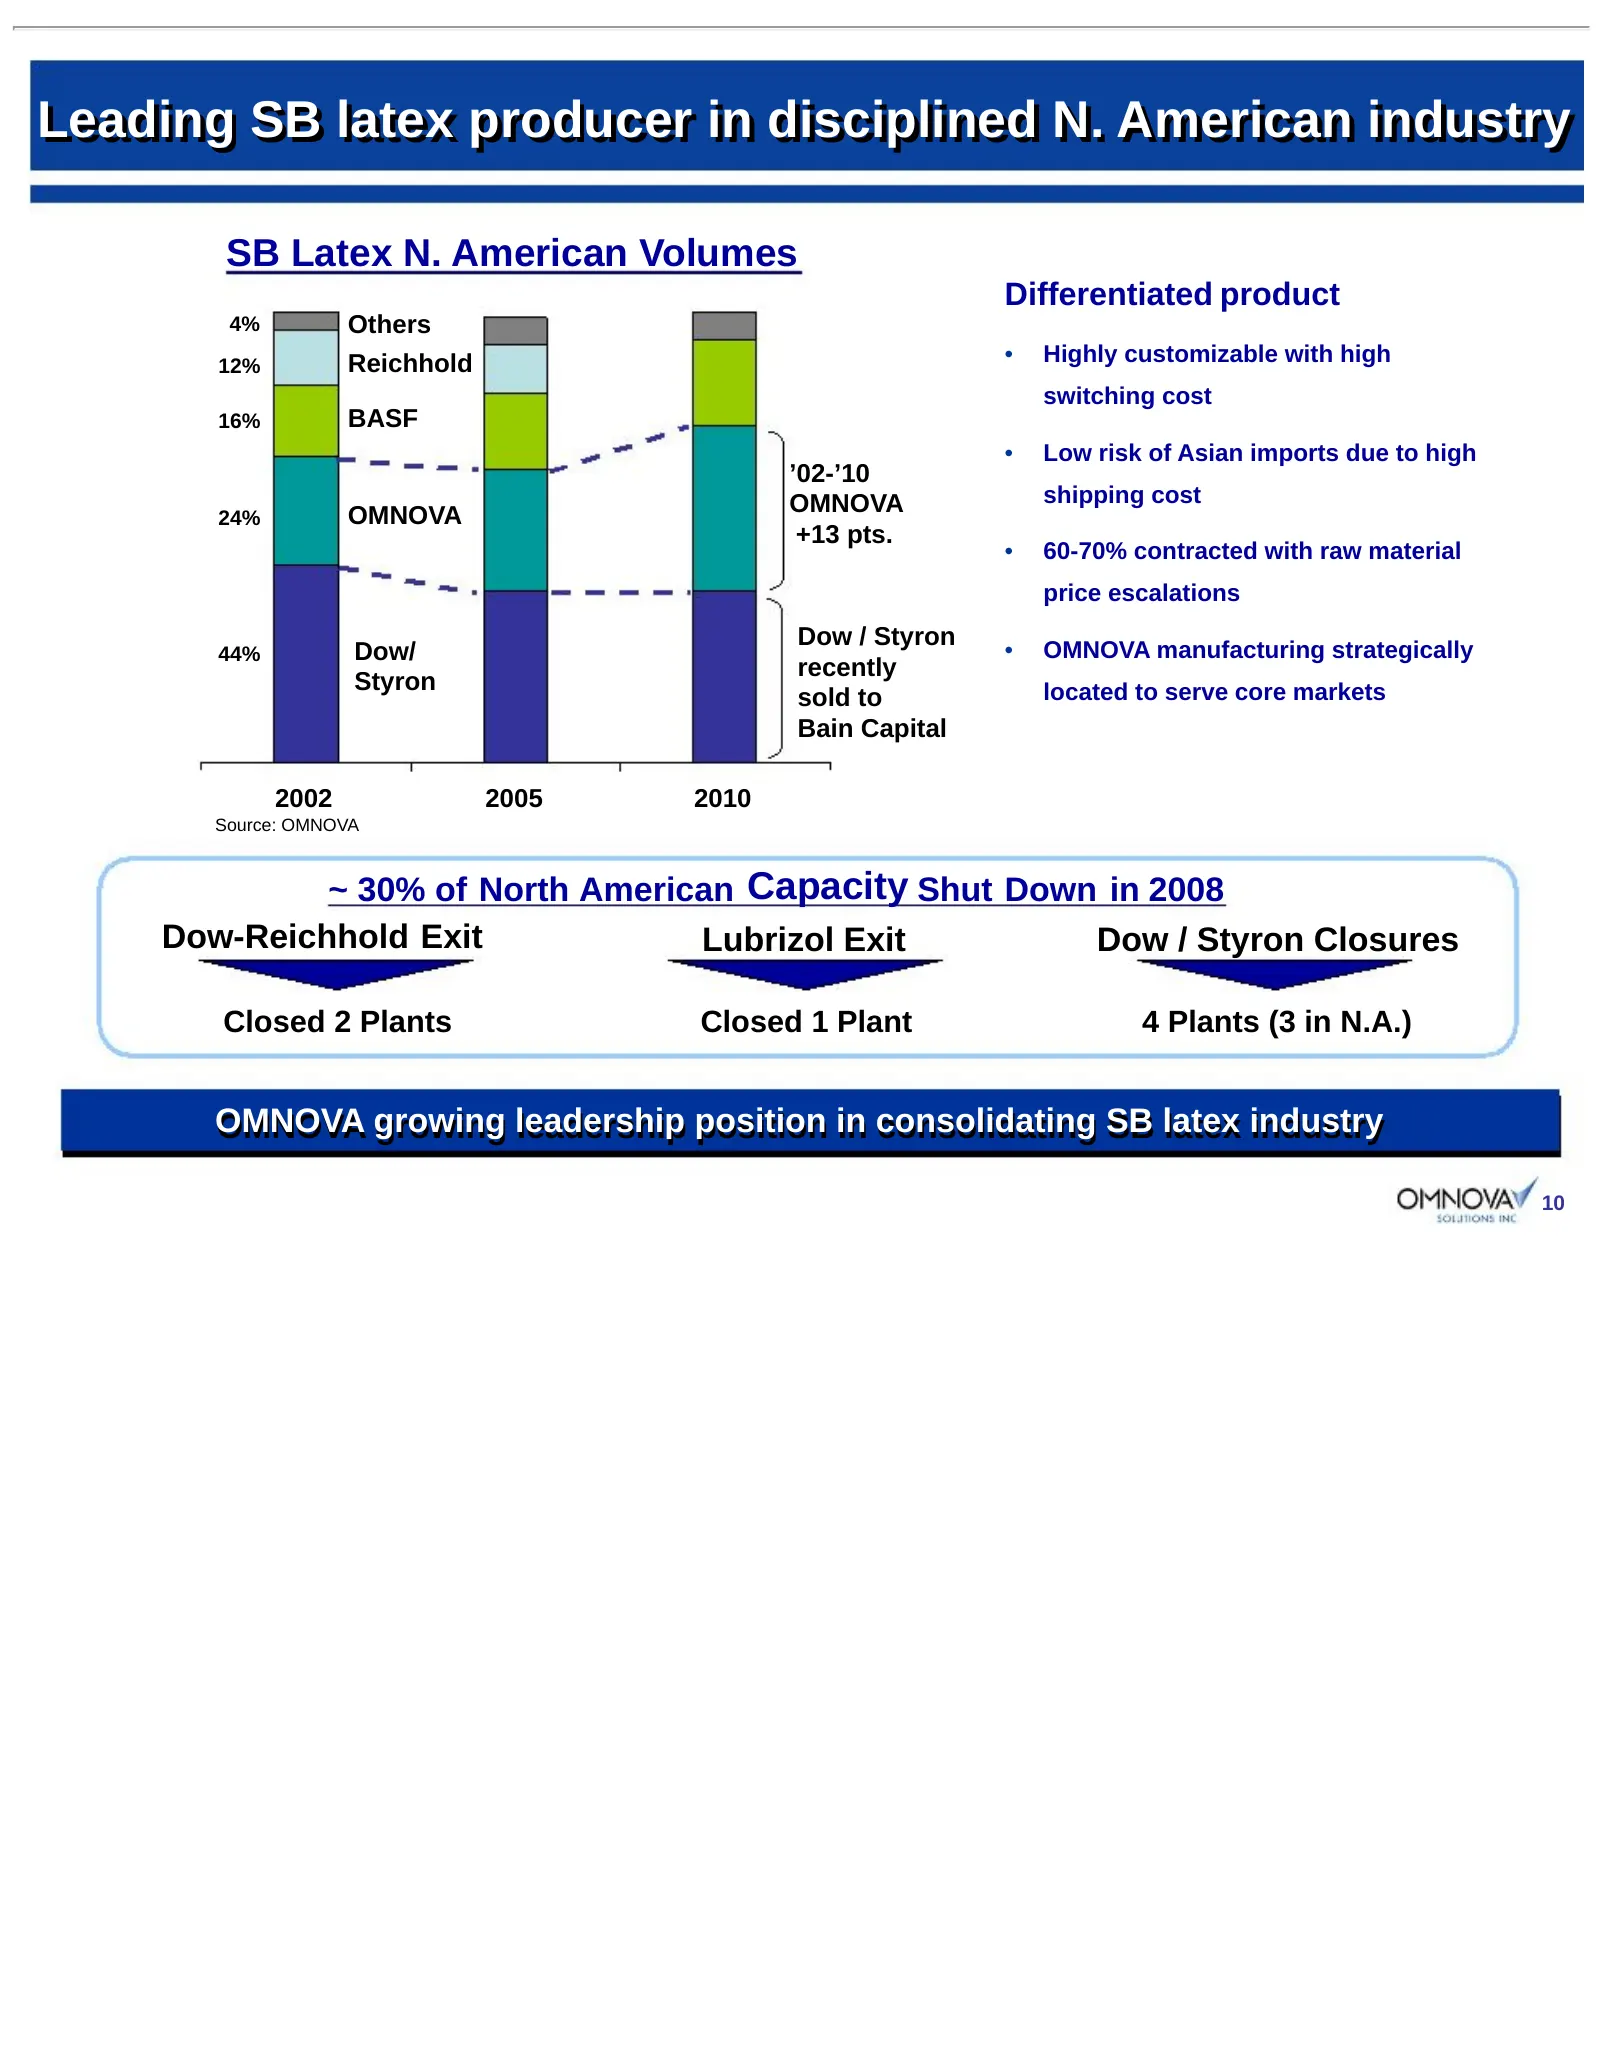
Slide 10: Leading SB latex producer in disciplined N. American industry
Leading SB latex producer in disciplined N. American industry SB Latex N. American Volumes Differentiated product 4% Others 12% Reichhold • Highly customizable with high switching cost 16% BASF • Low risk of Asian imports due to high ’02-’10 OMNOVA shipping cost 24% OMNOVA +13 pts. • 60-70% contract
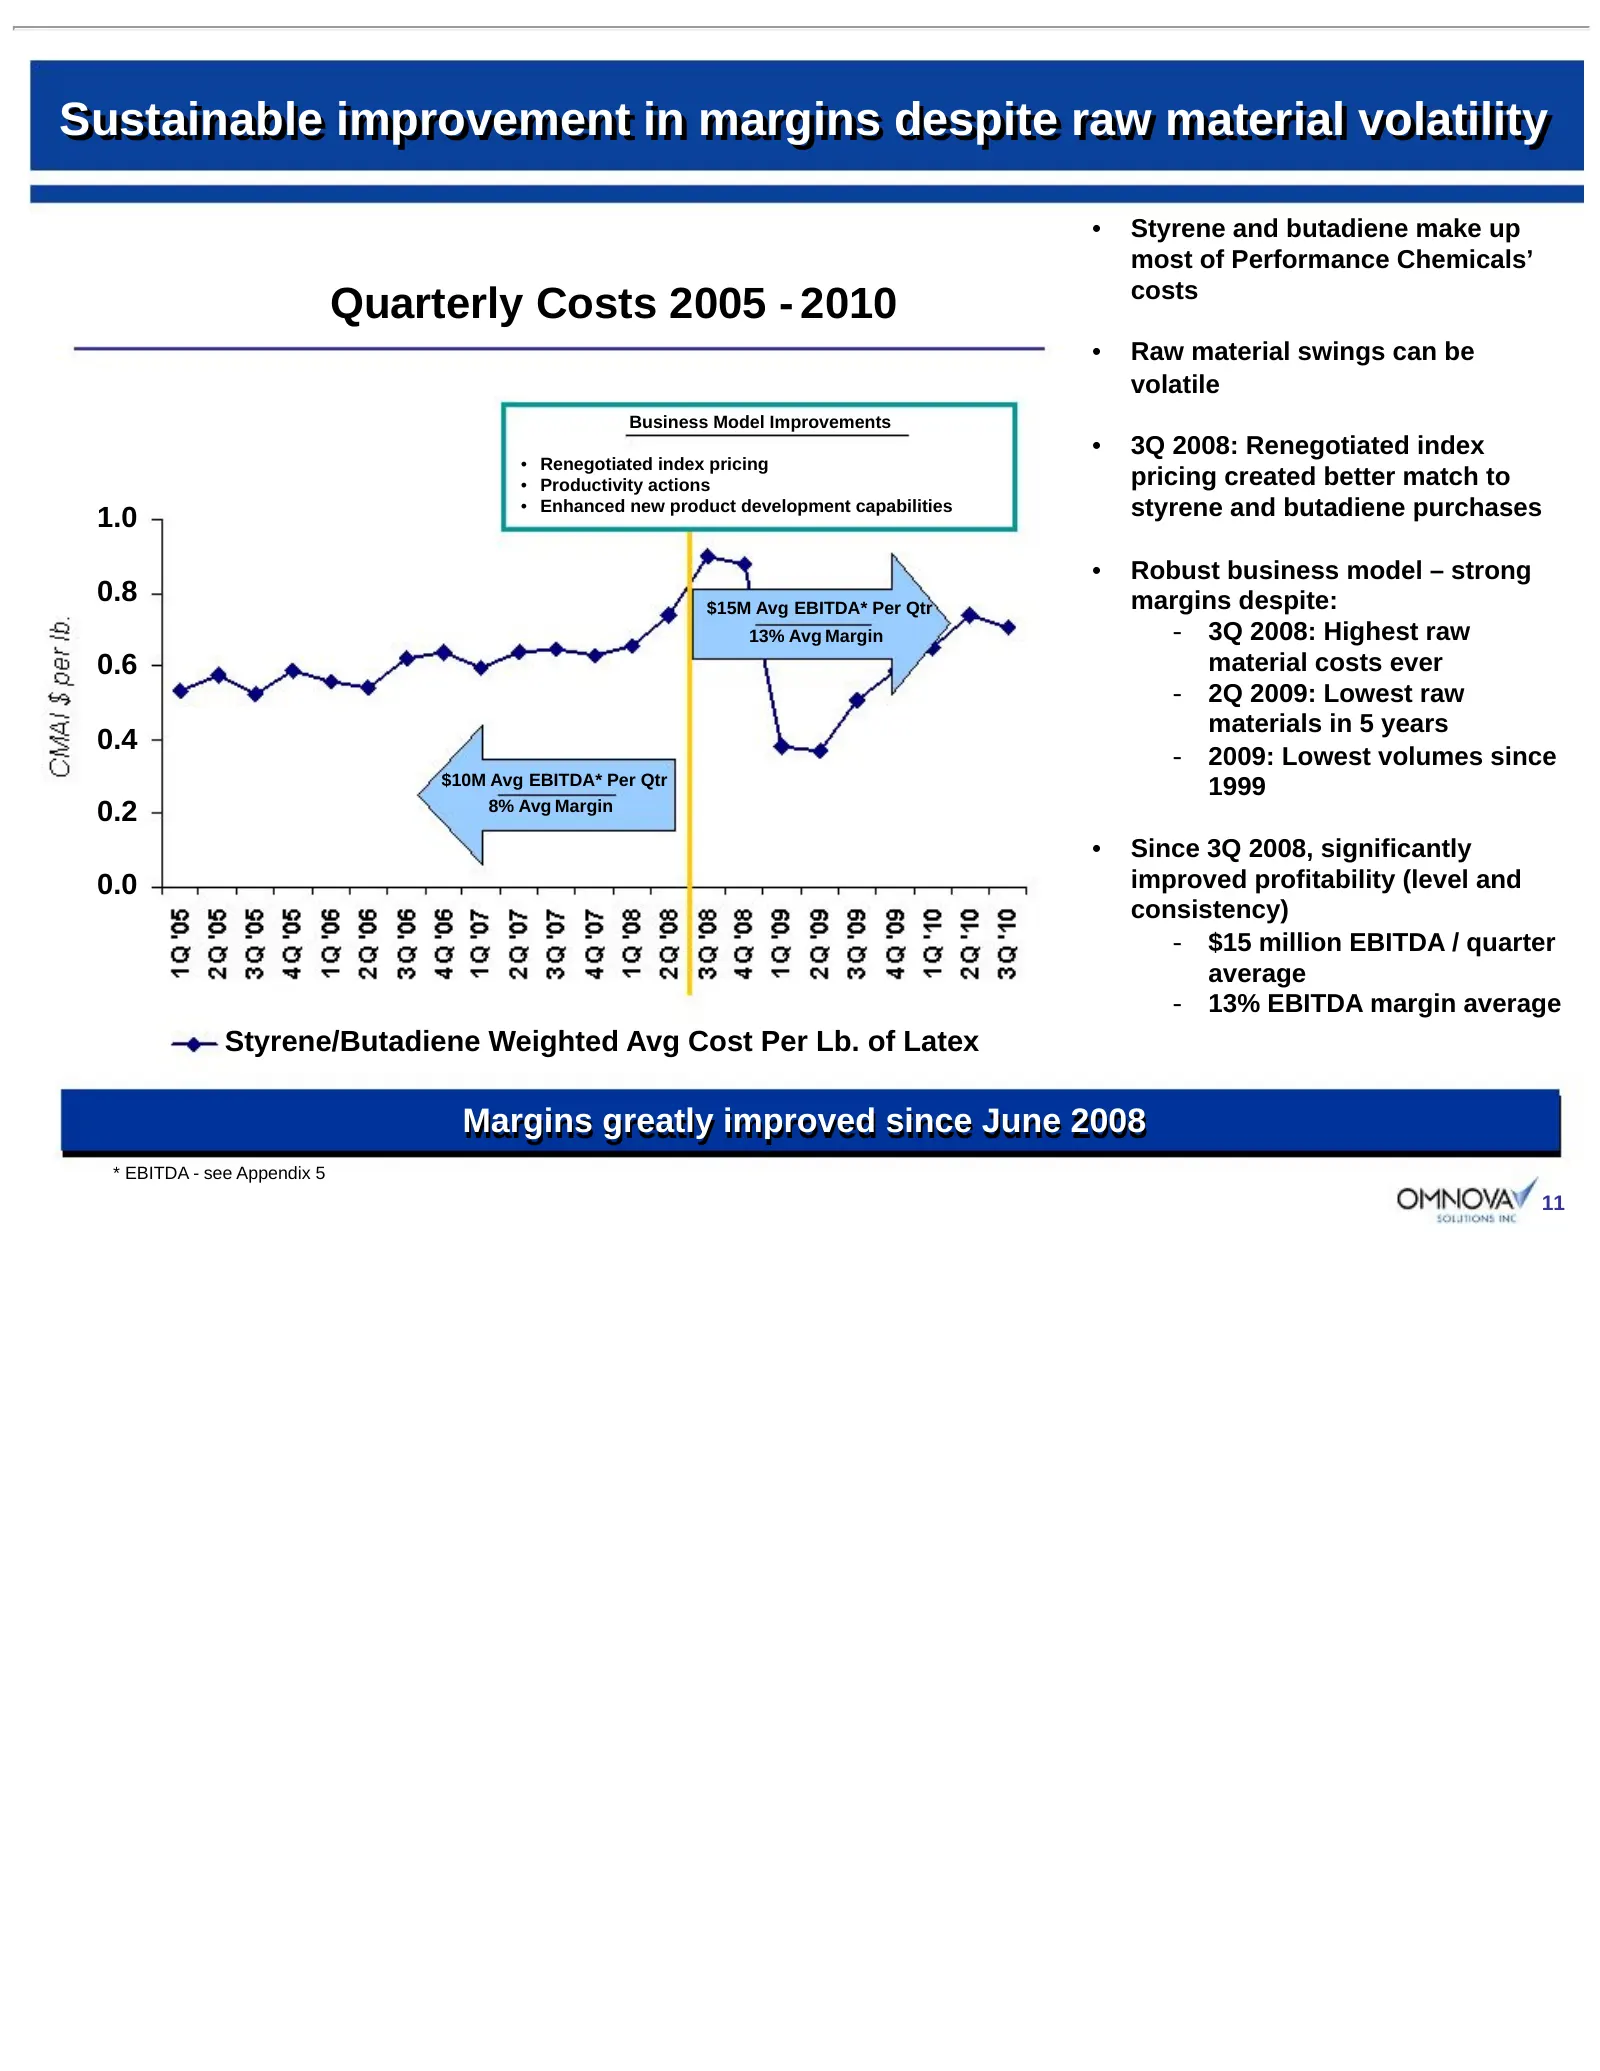
Slide 11: Sustainable improvement in margins despite raw material volatility
Sustainable Sustainable improvement improvement in in margins margins despite despite raw raw material material volatility volatility • Styrene and butadiene make up most of Performance Chemicals’ costs Quarterly Costs 2005 - 2010 • Raw material swings can be volatile Business Model Improvements • 3
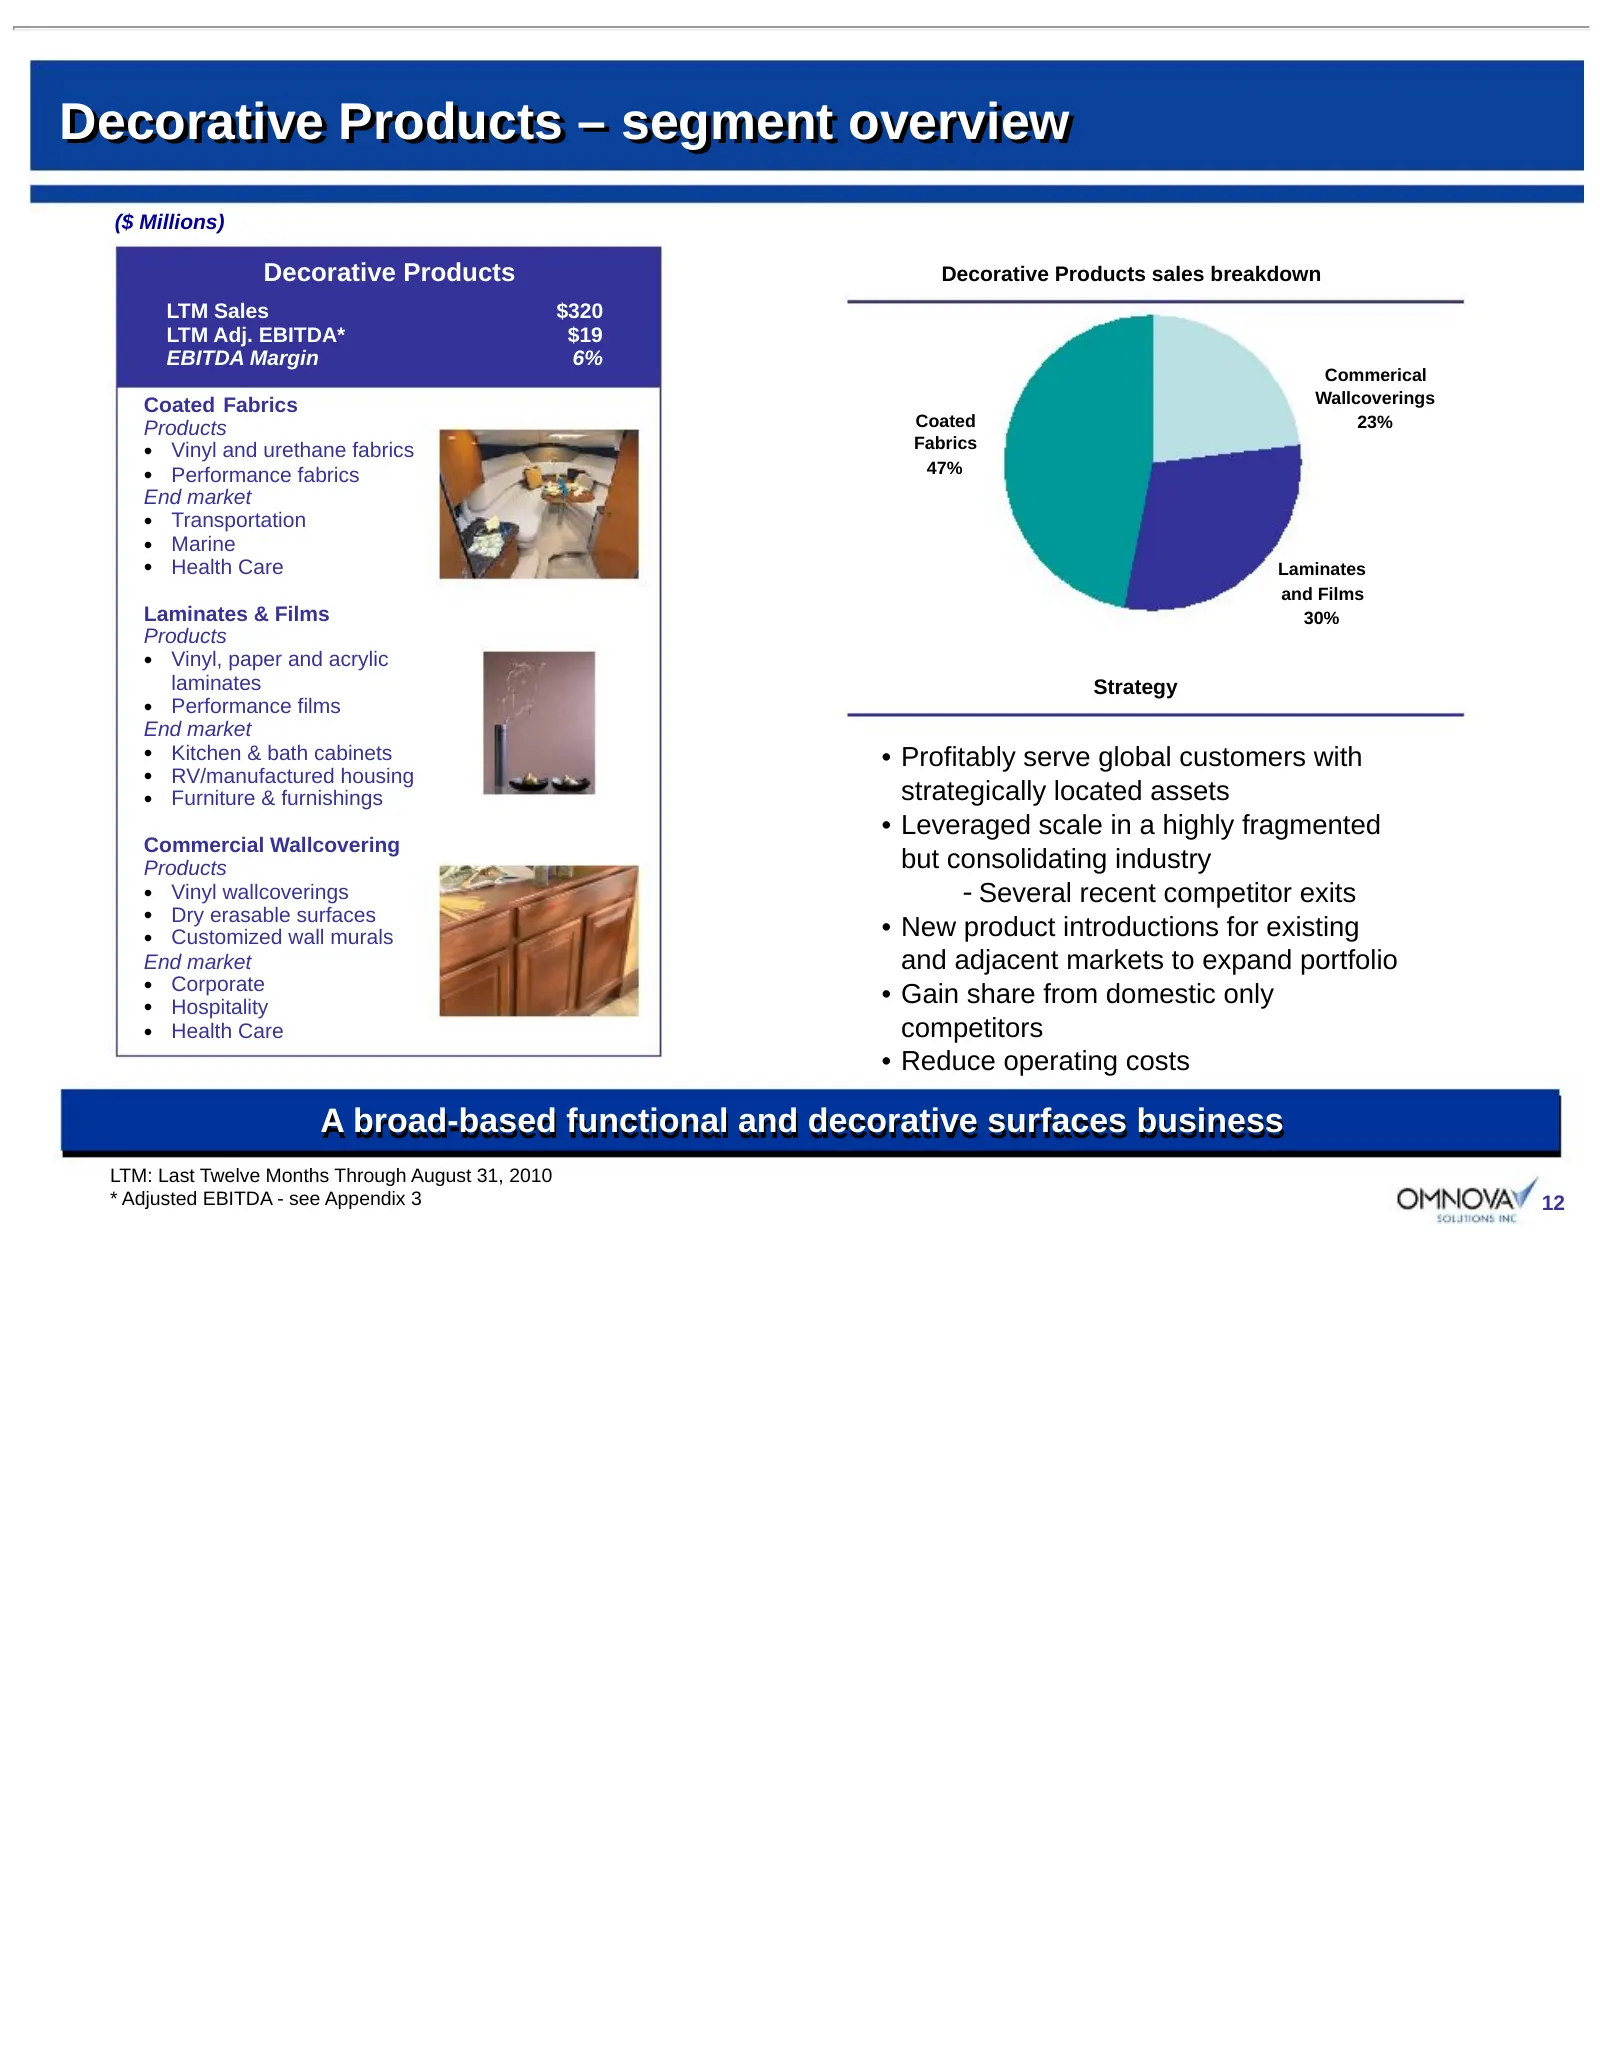
Slide 12: Decorative Products – segment overview
Decorative Products – segment overview ($ Millions) Decorative Products Decorative Products sales breakdown LTM Sales $320 LTM Adj. EBITDA* $19 EBITDA Margin 6% Commerical Coated Fabrics Wallcoverings Products Coated 23% Fabrics • Vinyl and urethane fabrics 47% • Performance fabrics End market • Tra
Slide 13: Eliokem acquisition
Eliokem acquisition 13
Slide 14: Eliokem Introduction
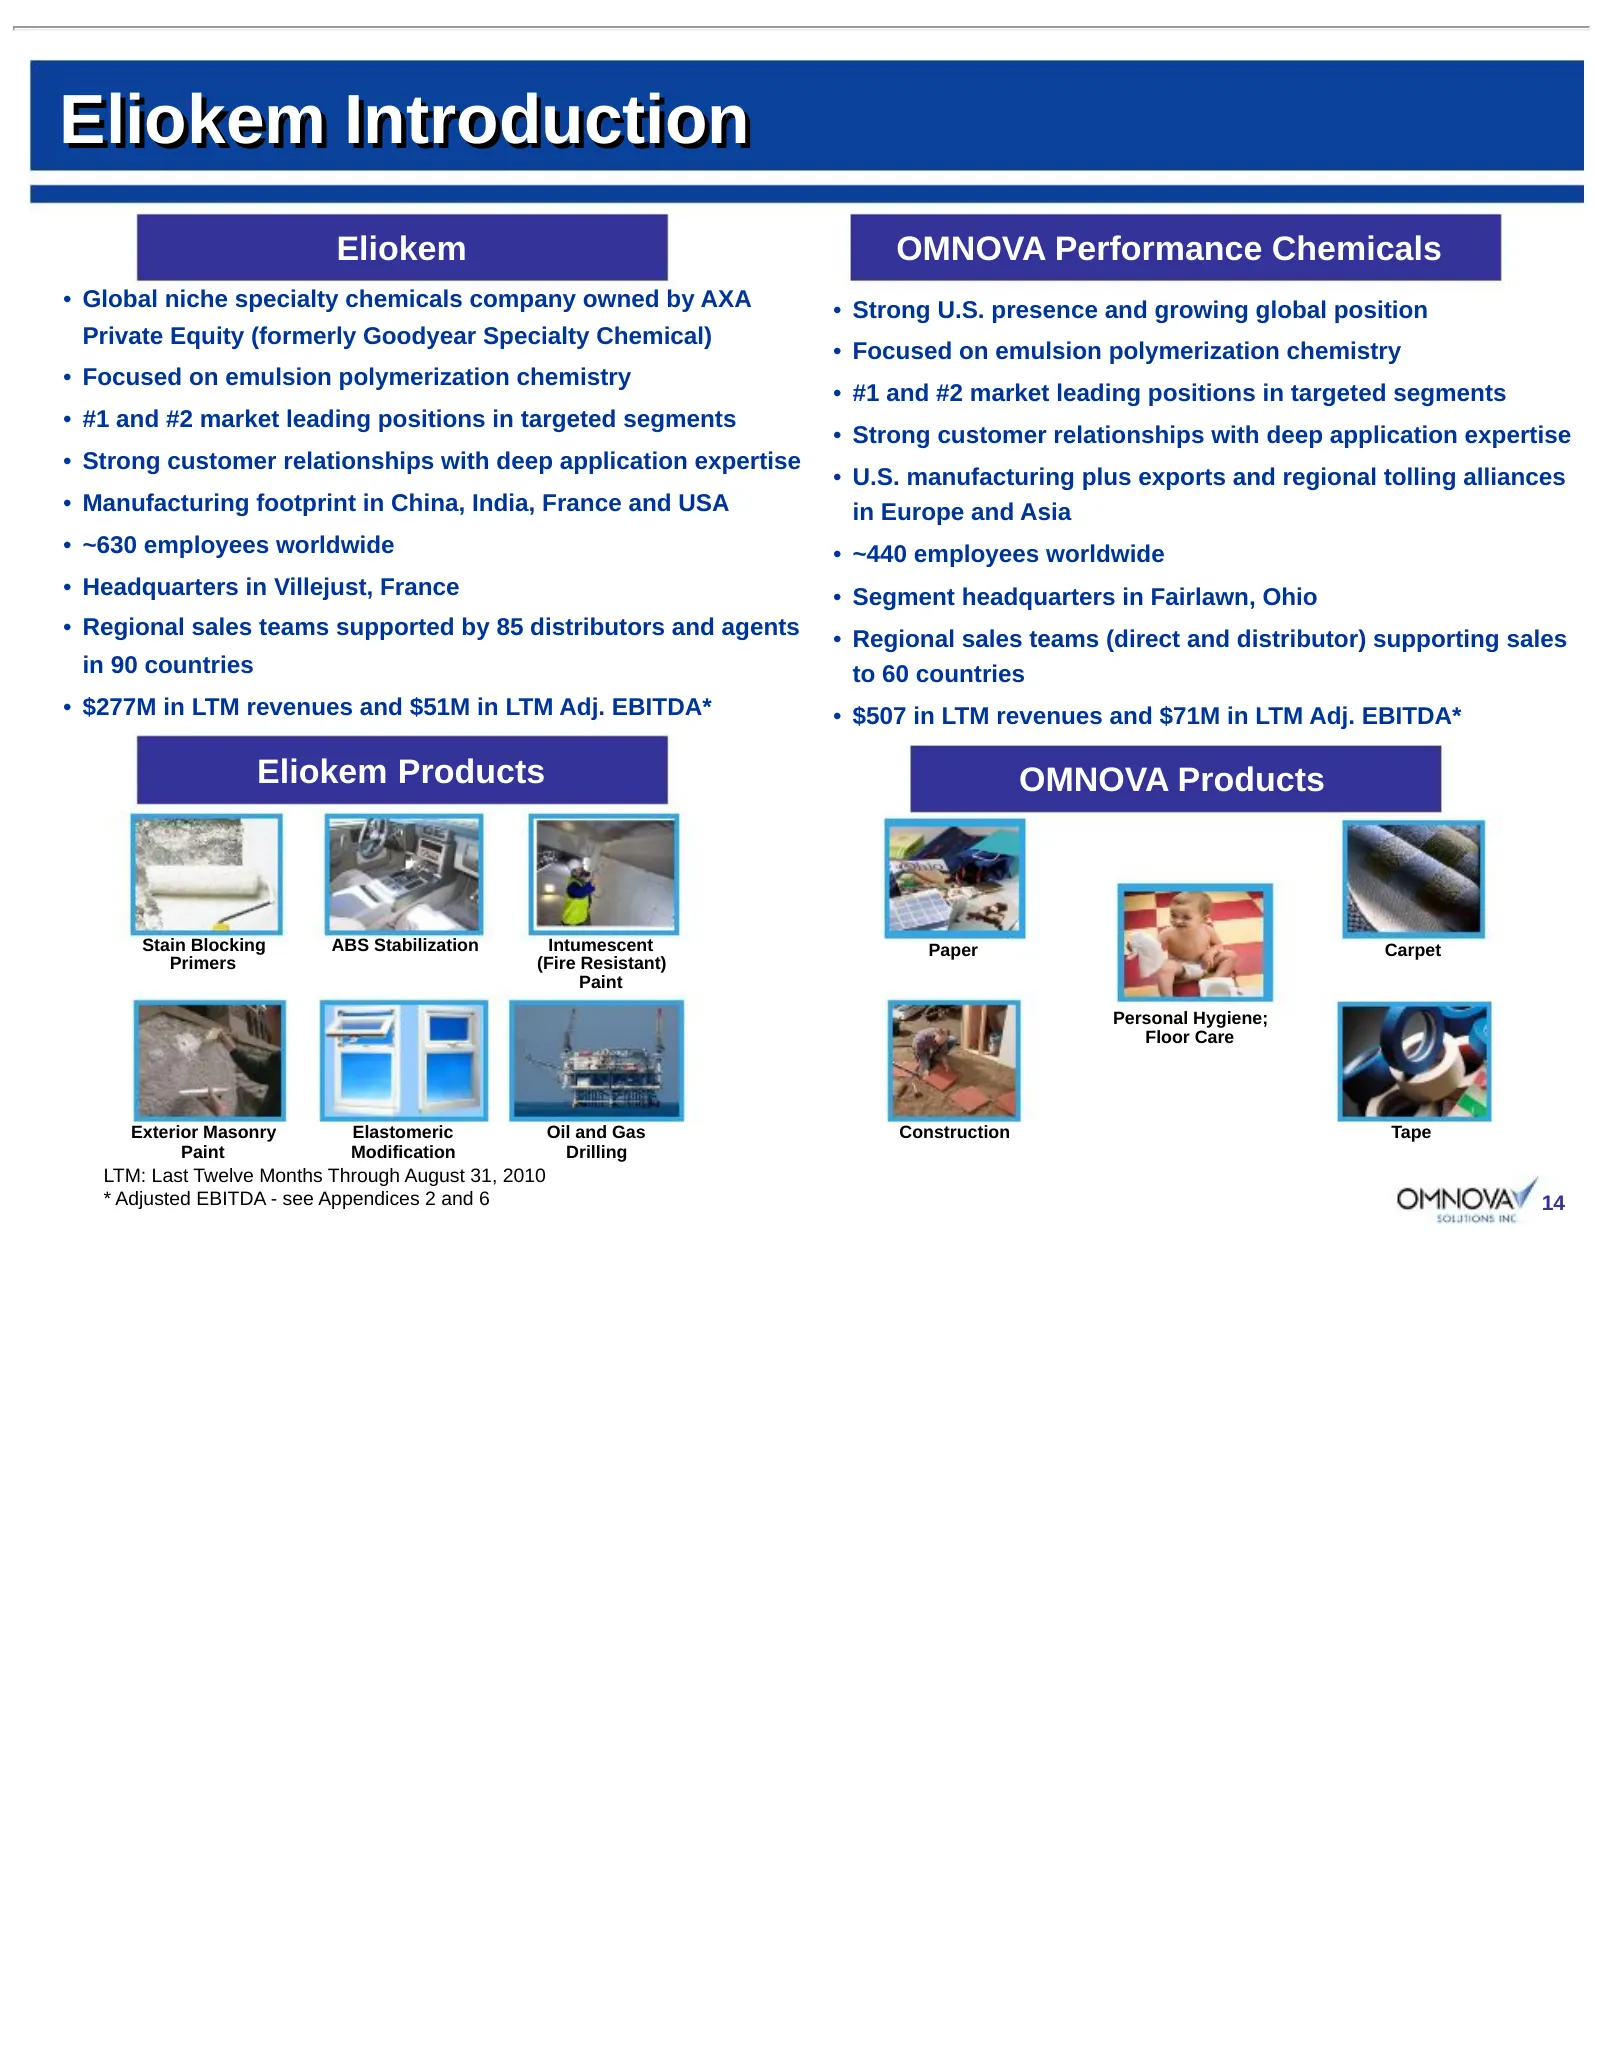
Eliokem Introduction Eliokem OMNOVA Performance Chemicals • Global niche specialty chemicals company owned by AXA • Strong U.S. presence and growing global position Private Equity (formerly Goodyear Specialty Chemical) • Focused on emulsion polymerization chemistry • Focused on emulsion polymerizati
Slide 15: Eliokem – resilient performance with upside potential
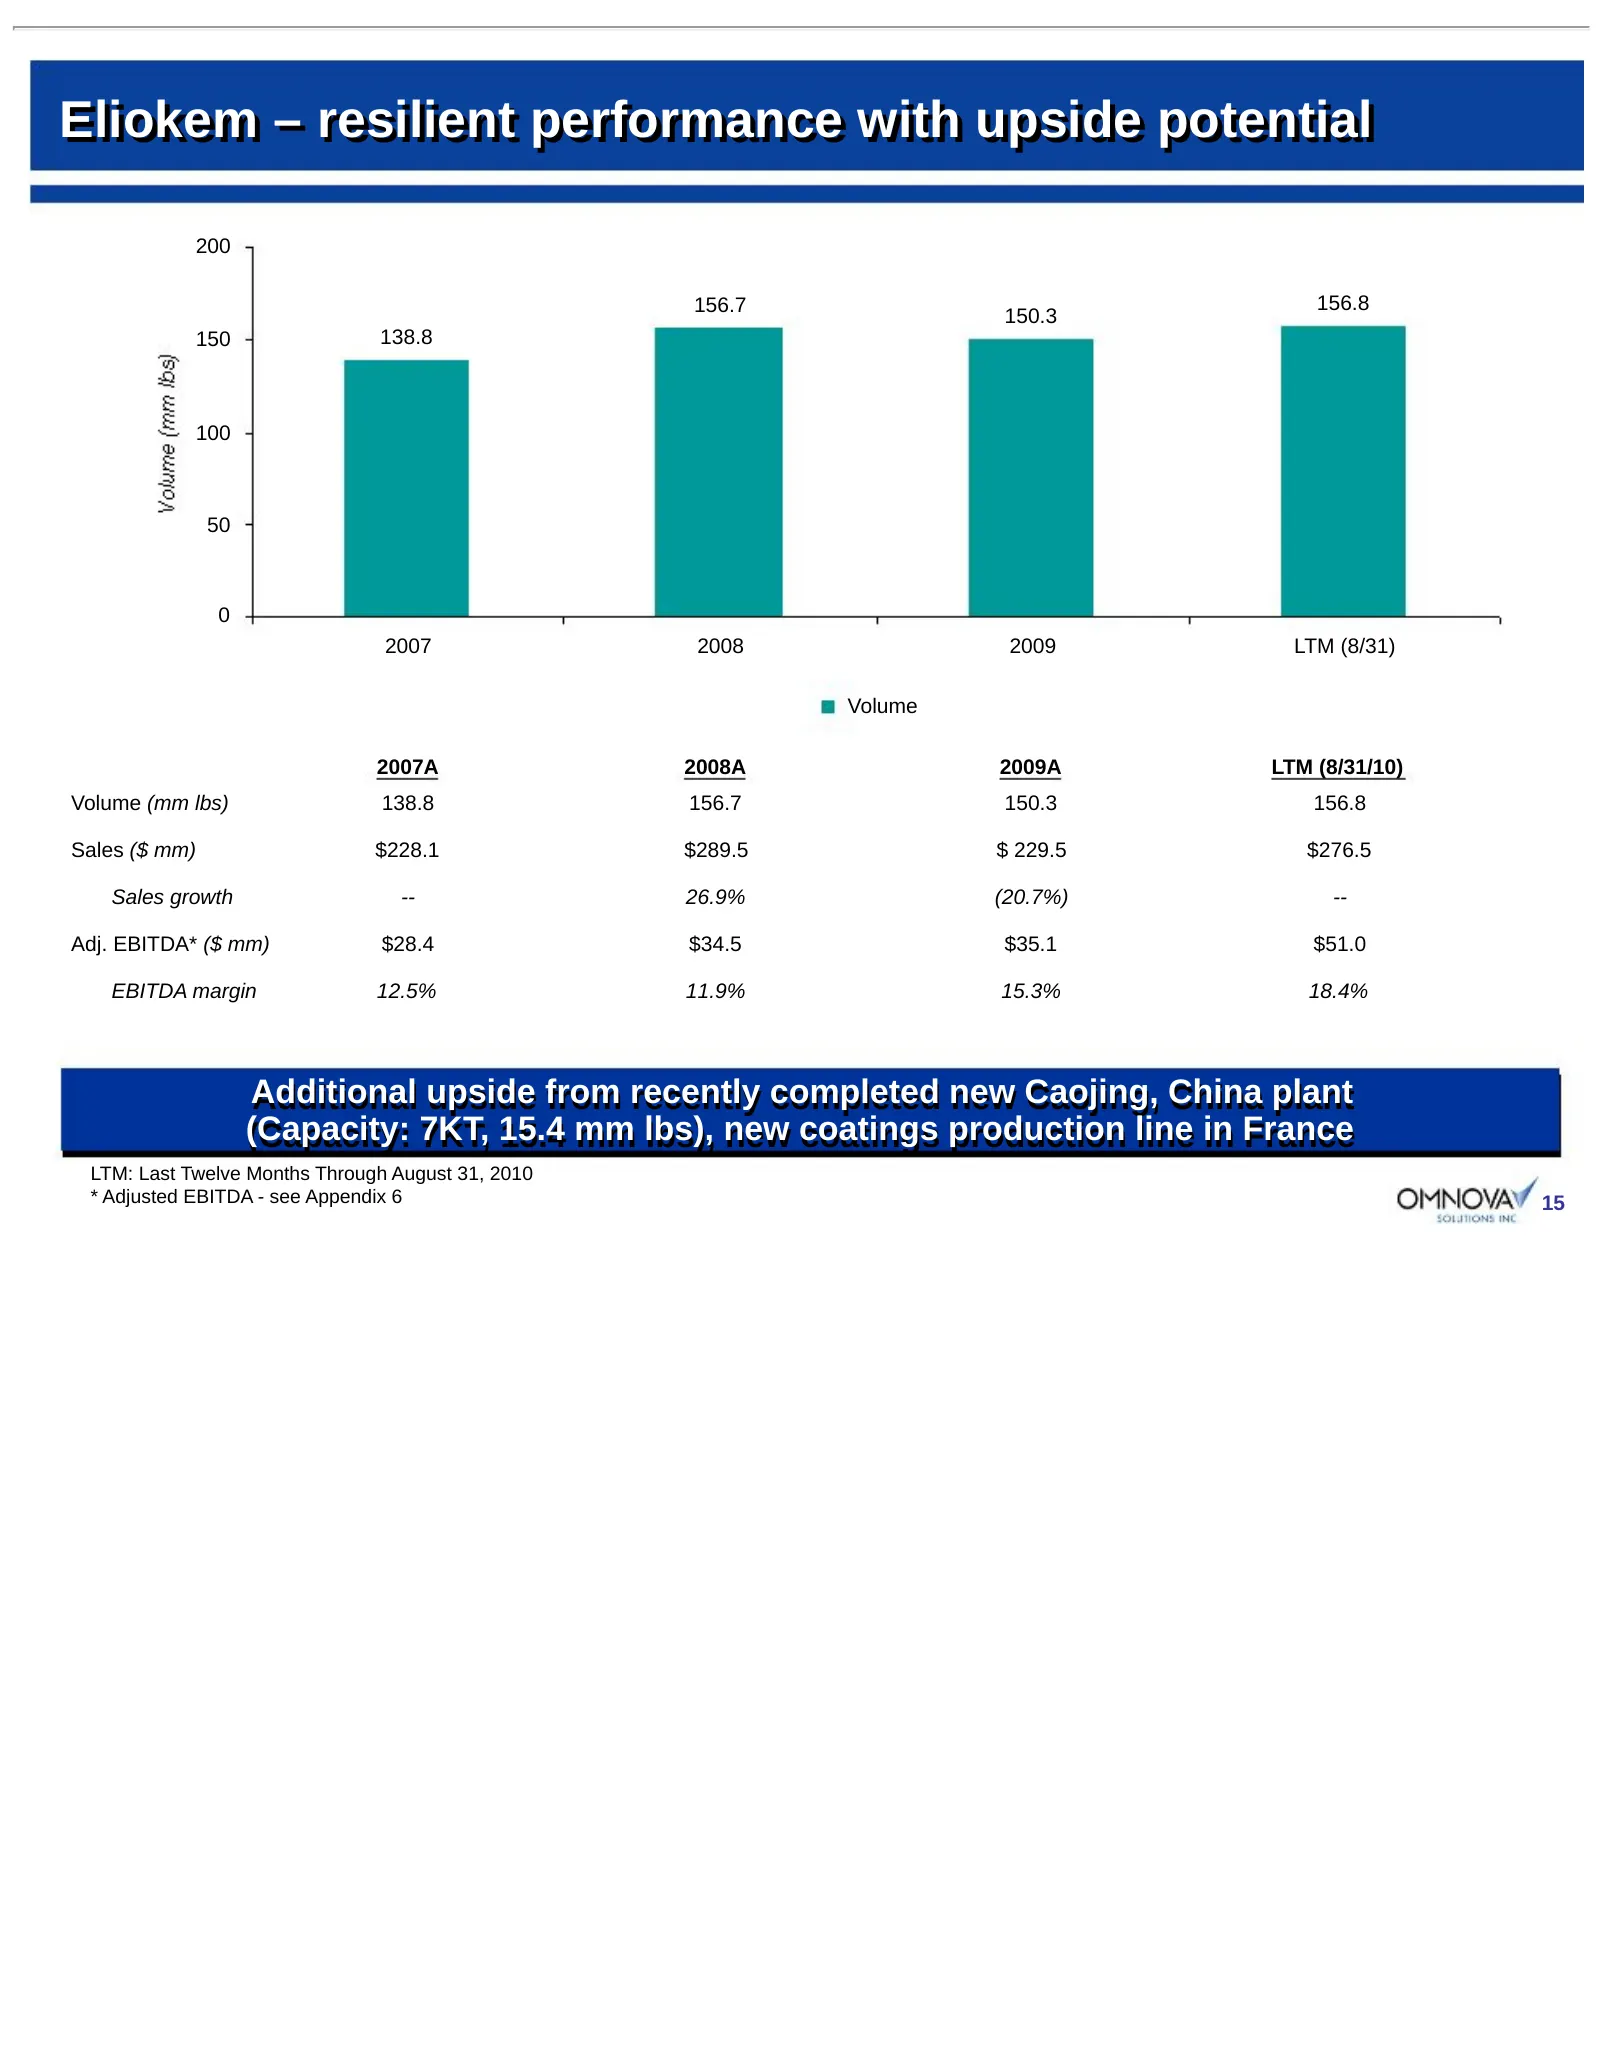
Eliokem – resilient performance with upside potential 200 156.7 156.8 150.3 150 138.8 100 50 0 2007 2008 2009 LTM (8/31) Volume 2007A 2008A 2009A LTM (8/31/10) Volume (mm lbs) 138.8 156.7 150.3 156.8 Sales ($ mm) $228.1 $289.5 $ 229.5 $276.5 Sales growth -- 26.9% (20.7%) -- Adj. EBITDA* ($ mm) $28.4
Slide 16: Acquisition Strategic Rationale
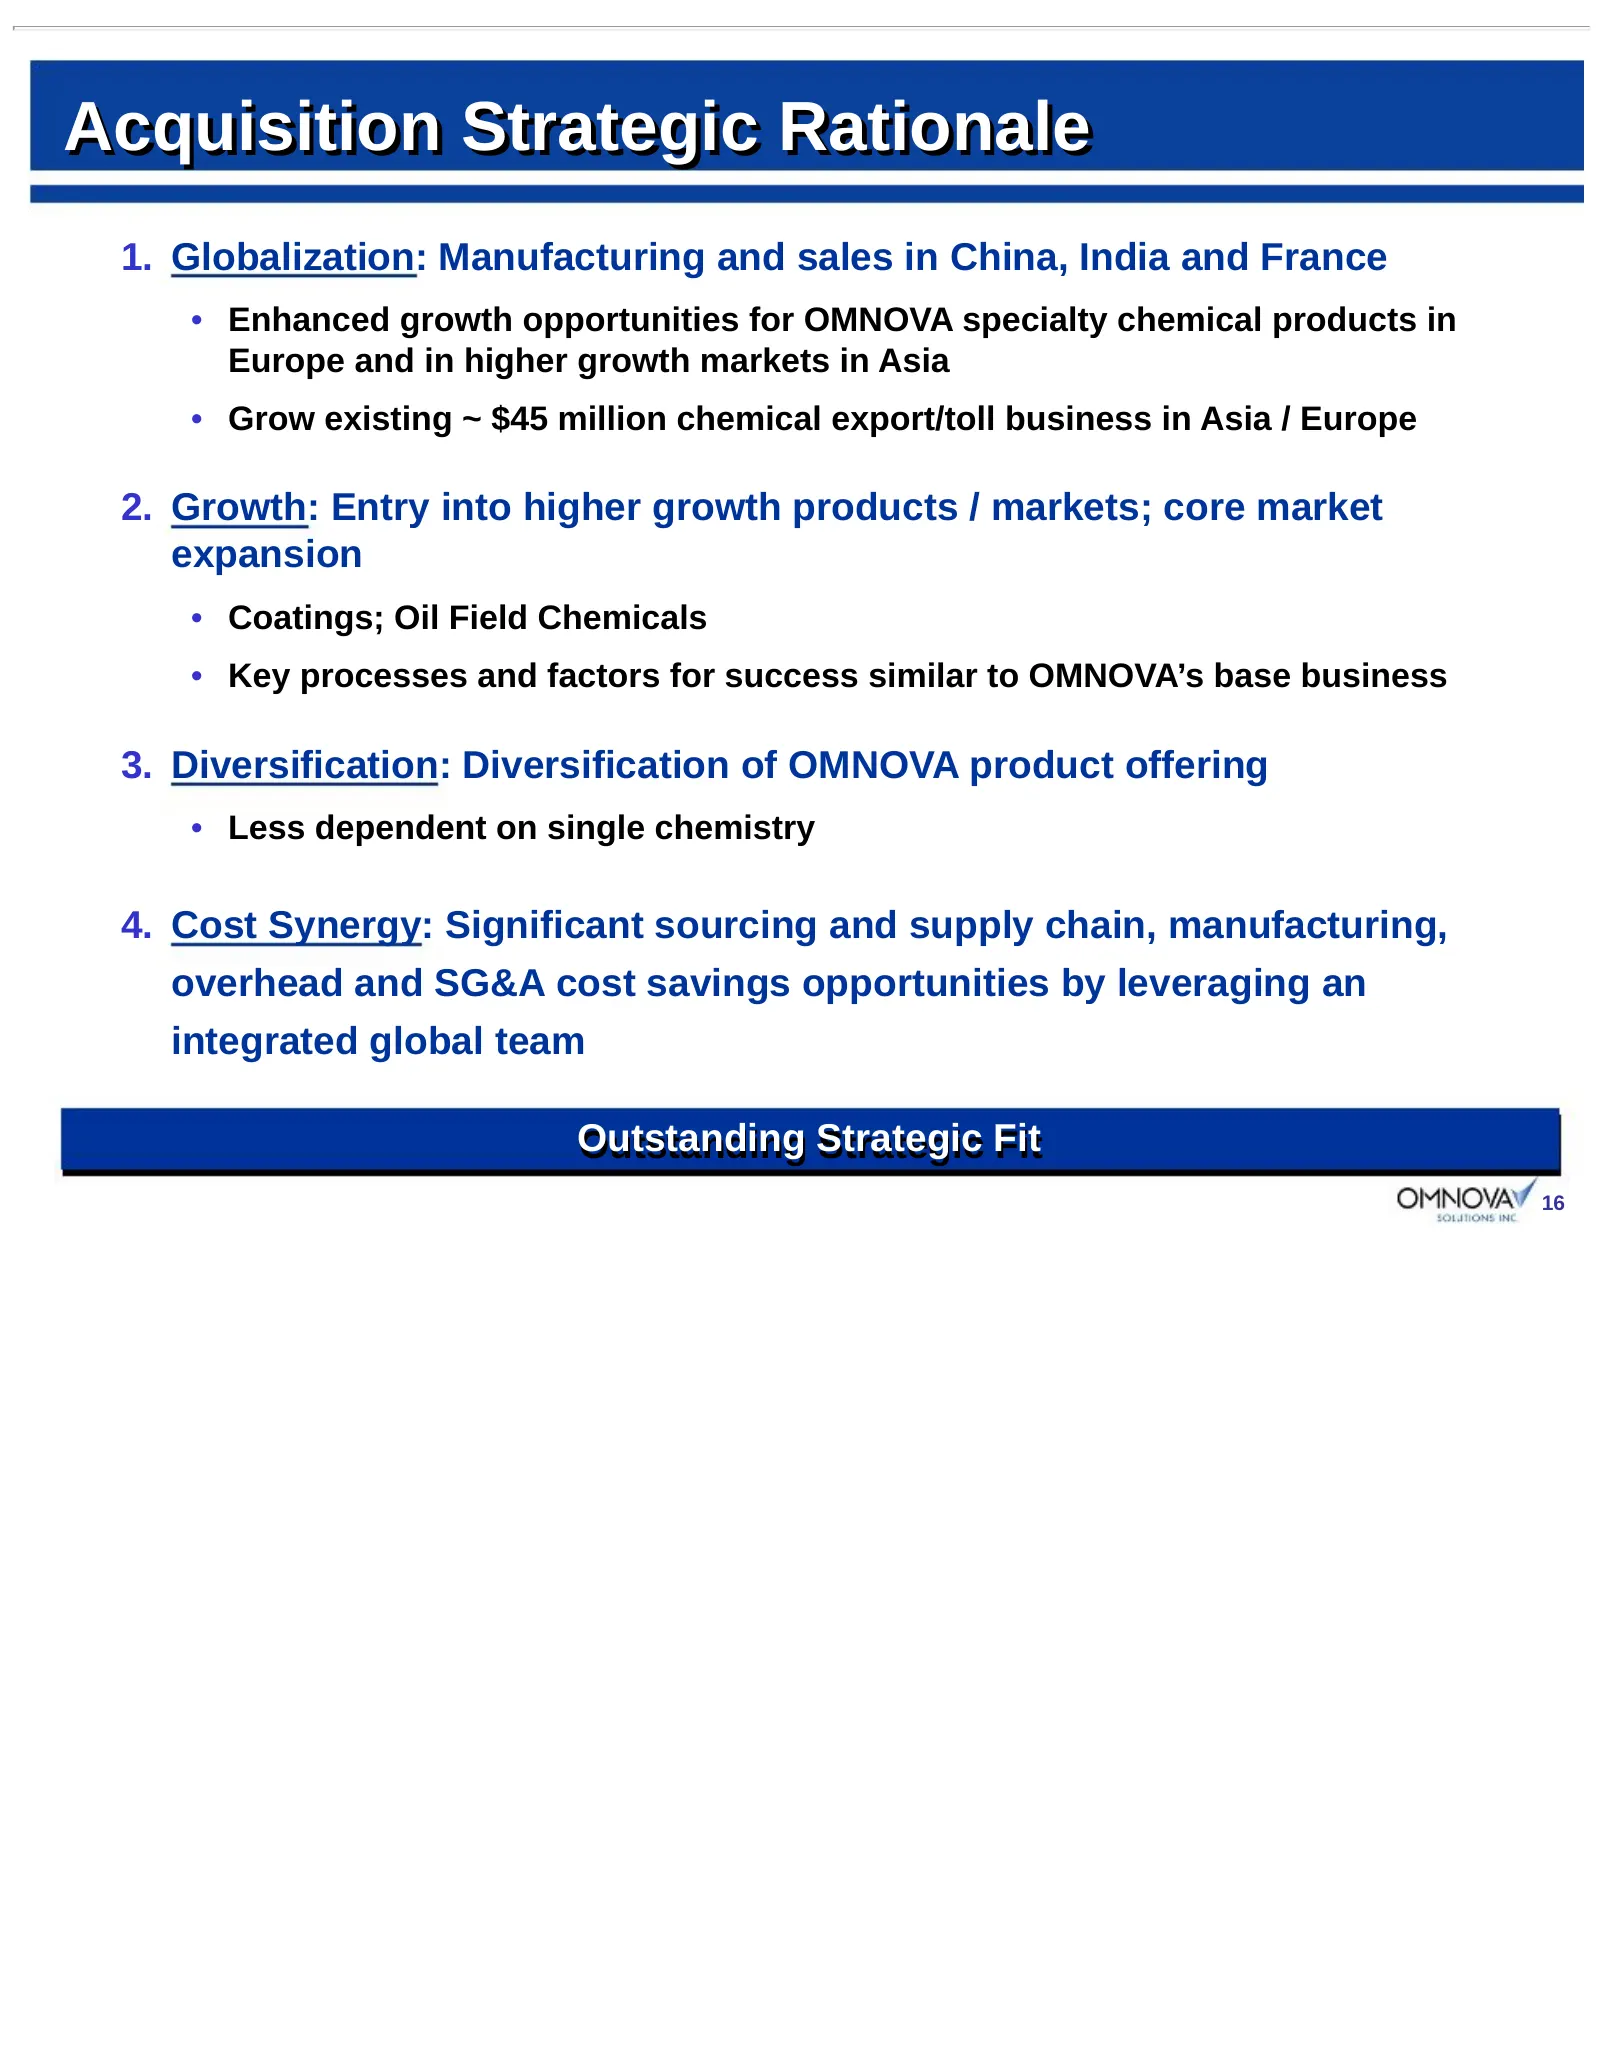
Acquisition Strategic Rationale 1. Globalization: Manufacturing and sales in China, India and France • Enhanced growth opportunities for OMNOVA specialty chemical products in Europe and in higher growth markets in Asia • Grow existing ~ $45 million chemical export/toll business in Asia / Europe 2. G
Slide 17: Pro forma historical annual financials
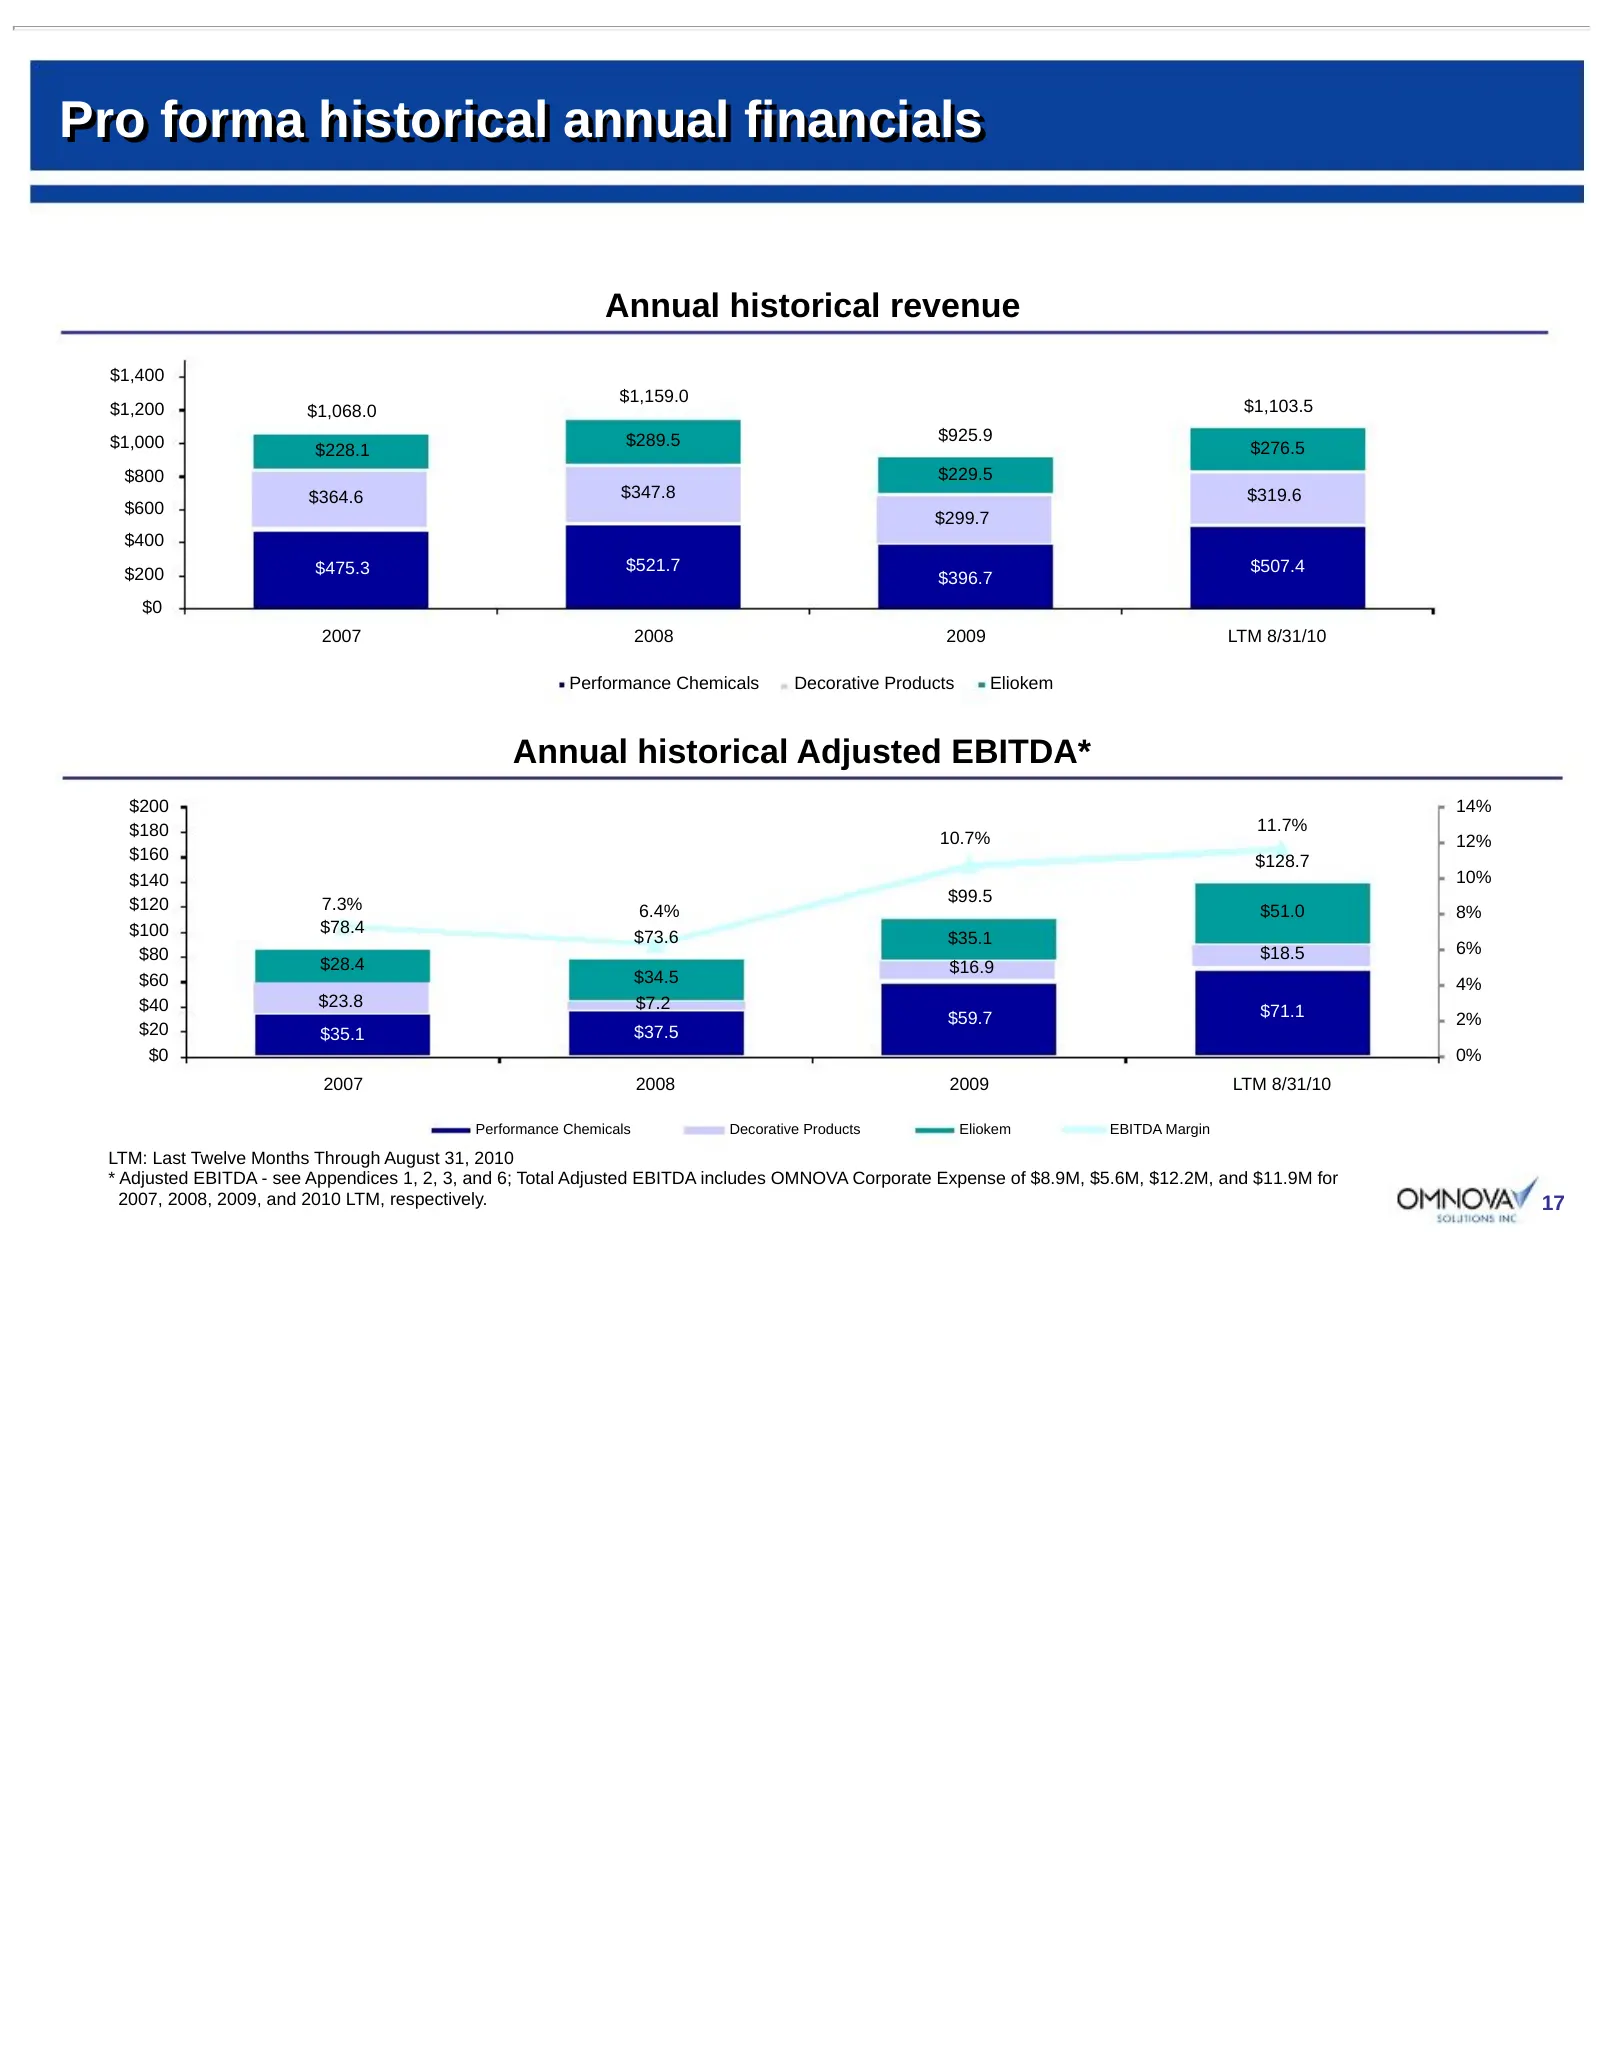
Pro forma historical annual financials Annual historical revenue $1,400 $1,159.0 $1,200 $1,068.0 $1,103.5 $1,000 $289.5 $925.9 $228.1 $276.5 $800 $229.5 $364.6 $347.8 $319.6 $600 $299.7 $400 $475.3 $521.7 $507.4 $200 $396.7 $0 2007 2008 2009 LTM 8/31/10 Performance Chemicals Decorative Products Elio
Slide 18: Creating a Global Specialty Chemicals Business
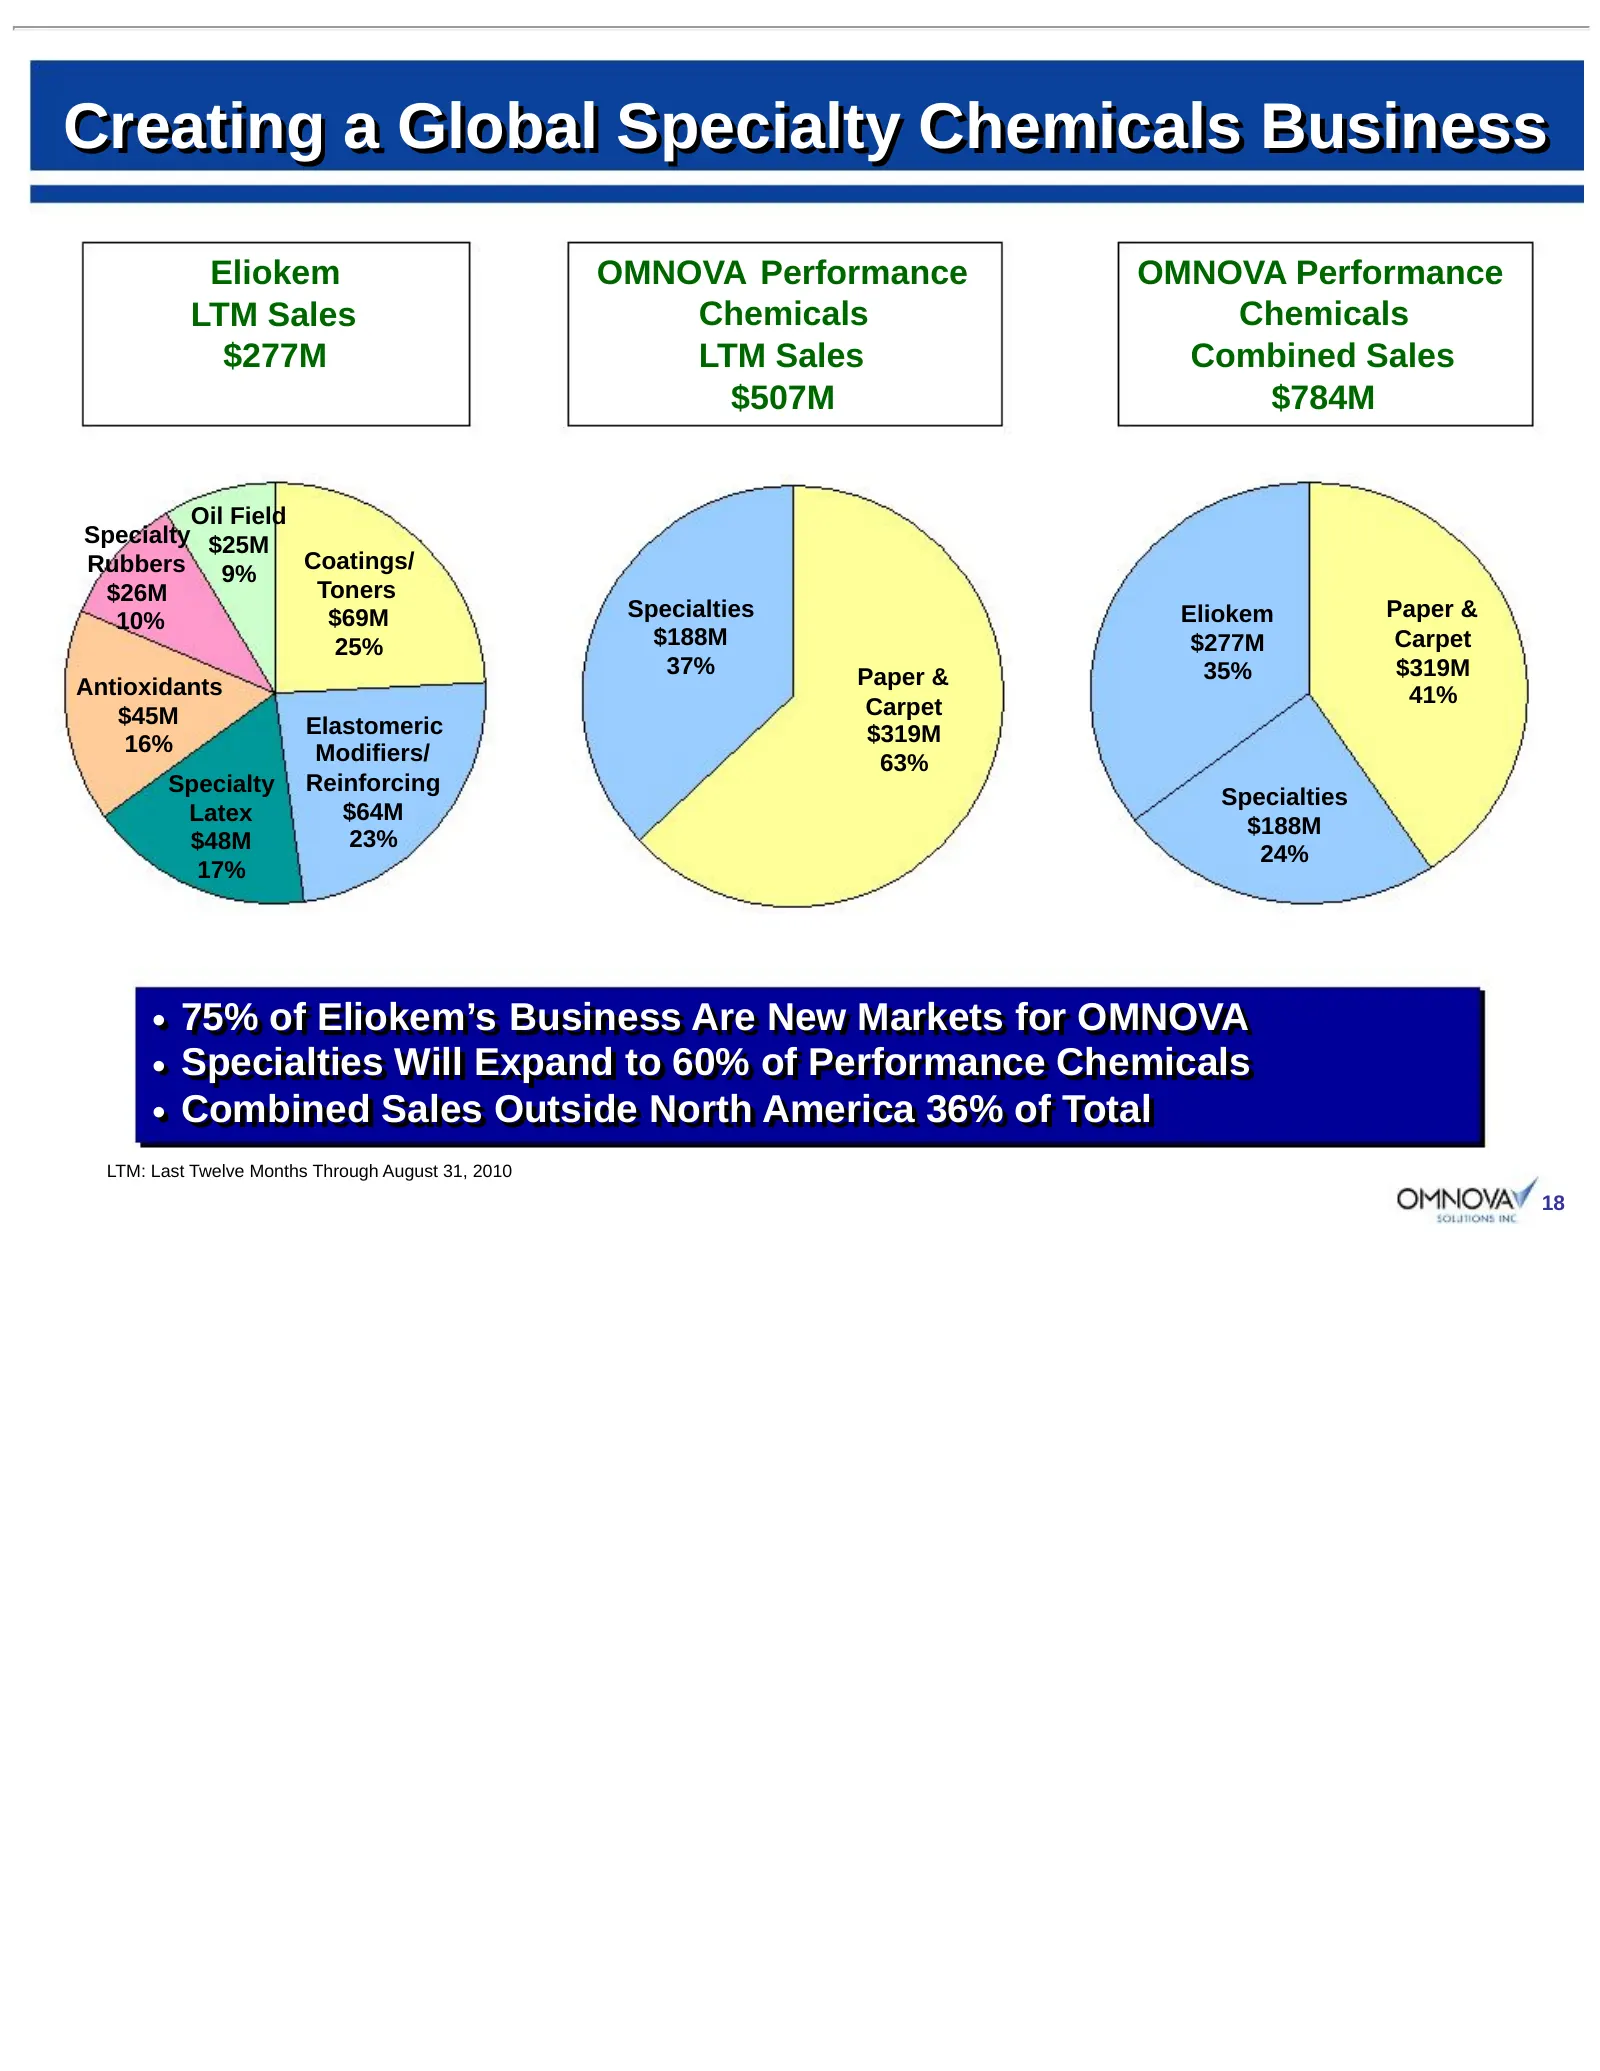
Creating a Global Specialty Chemicals Business Eliokem OMNOVA Performance OMNOVA Performance LTM Sales Chemicals Chemicals $277M LTM Sales Combined Sales $507M $784M Oil Field Specialty $25M Rubbers 9% Coatings/ $26M Toners 10% $69M Specialties Eliokem Paper & 25% $188M $277M Carpet 37% Paper & 35%
Slide 19: Global Footprint In Performance Chemicals
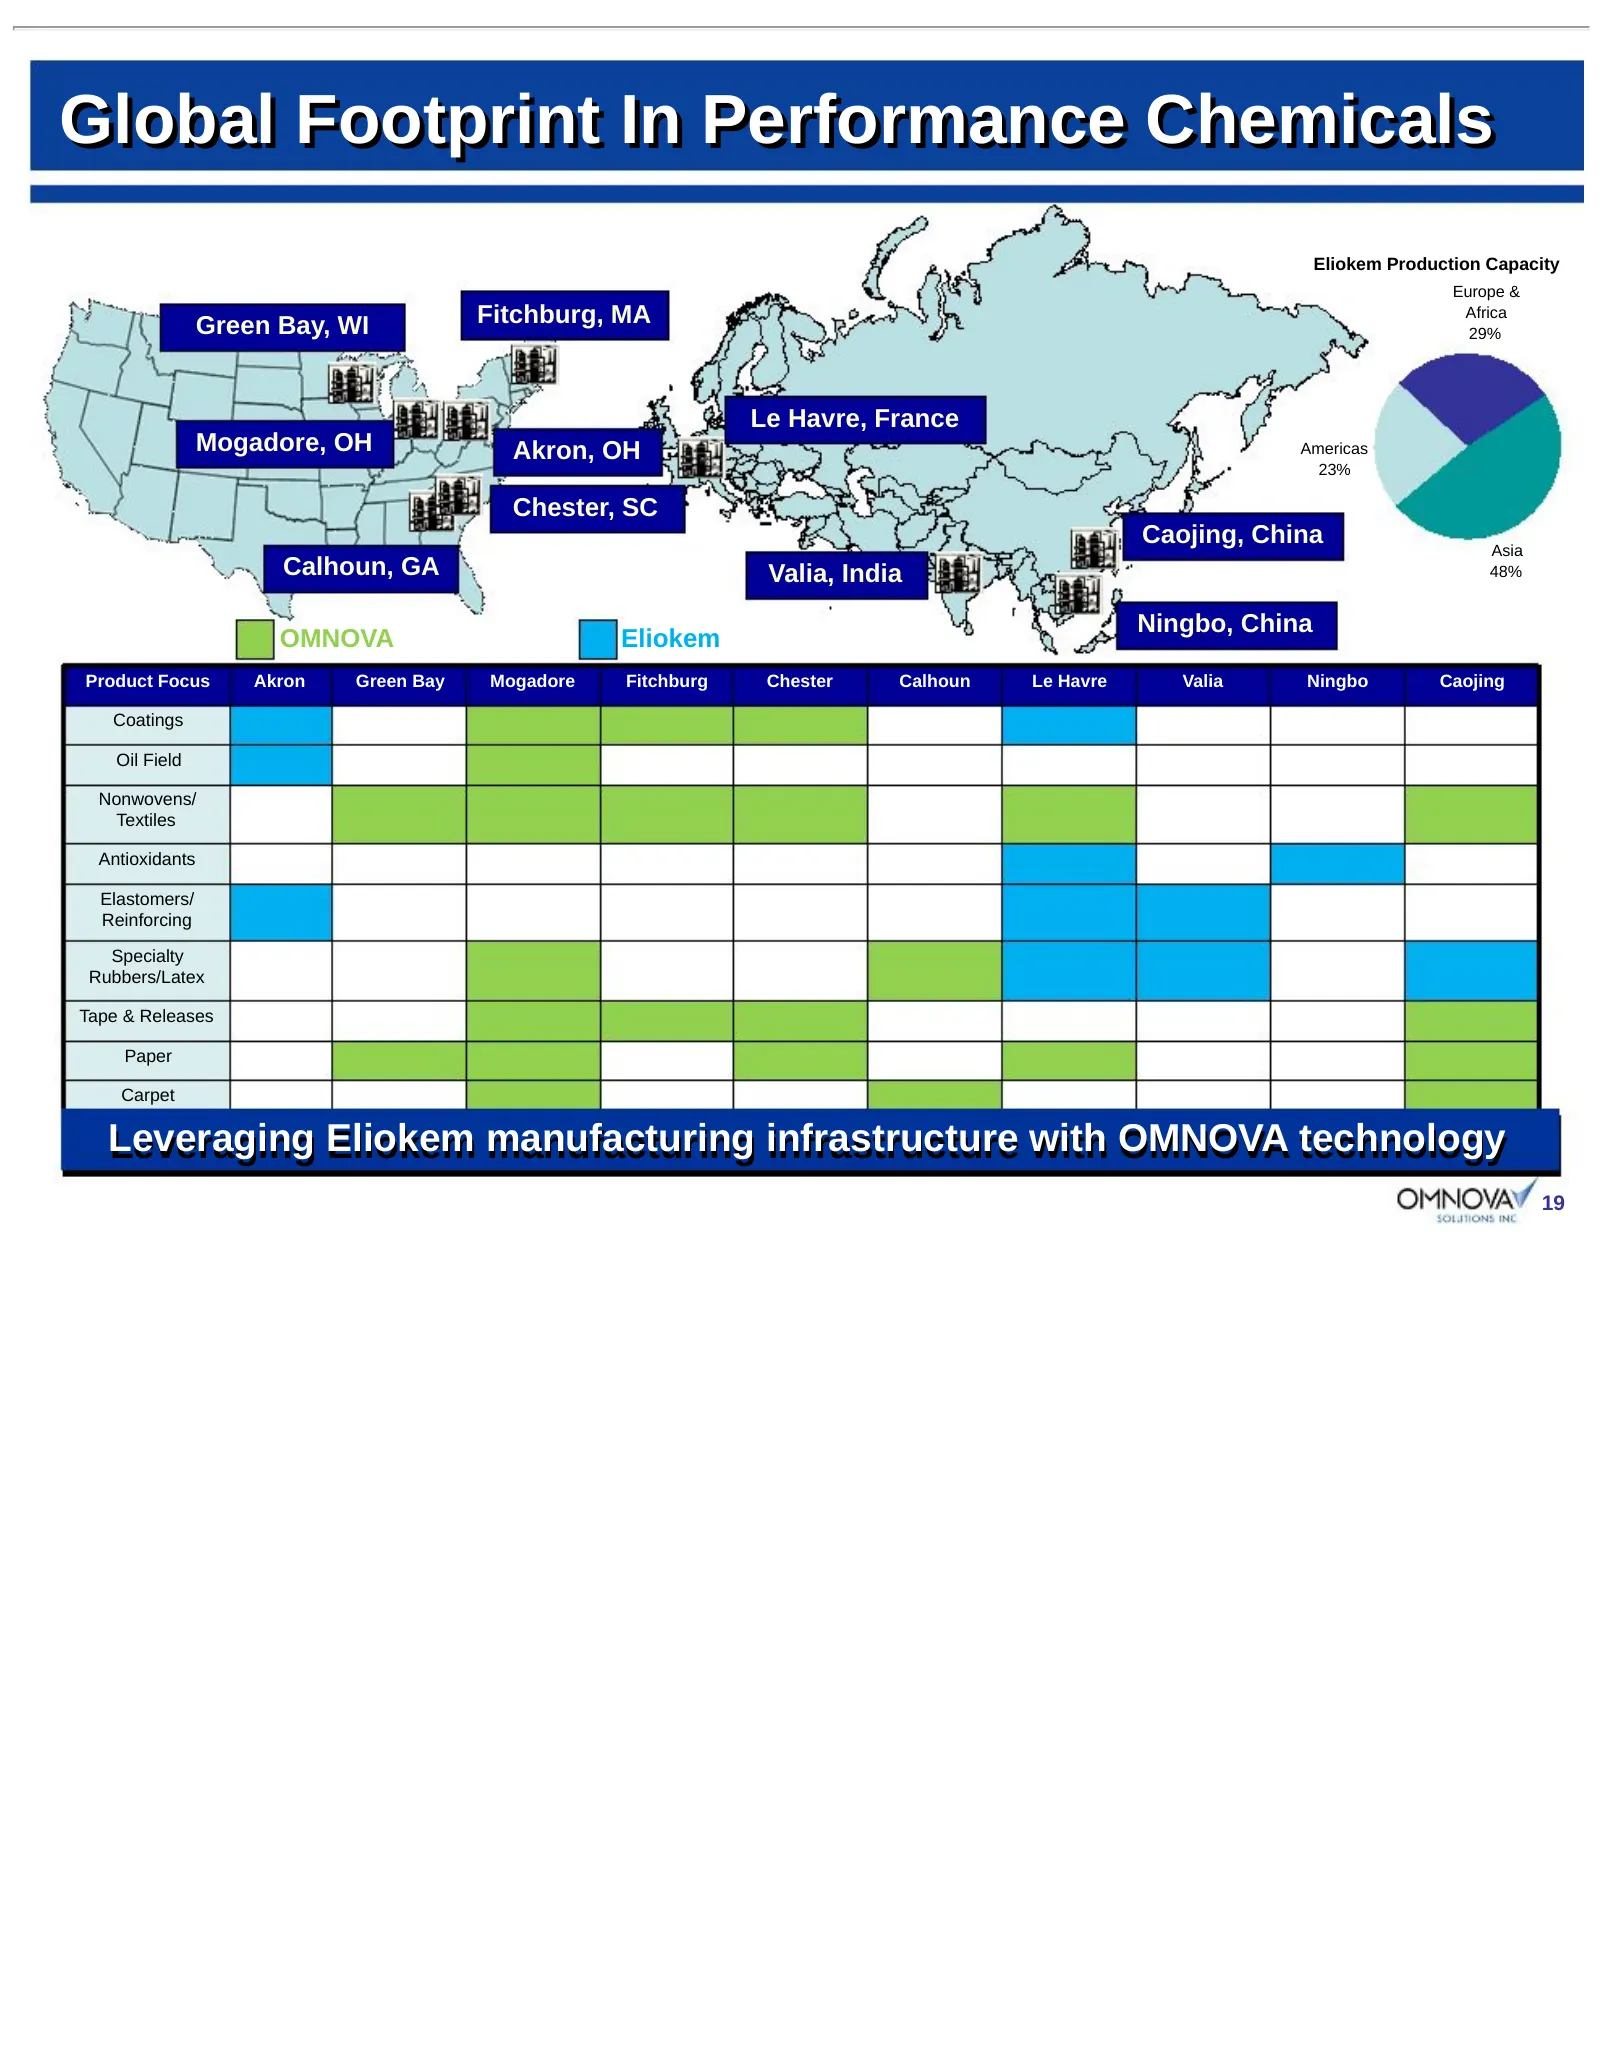
Global Footprint In Performance Chemicals Eliokem Production Capacity Europe & Green Bay, WI Fitchburg, MA Africa 29% Le Havre, France Mogadore, OH Akron, OH Americas 23% Chester, SC Caojing, China Asia Calhoun, GA Valia, India 48% Ningbo, China OMNOVA Eliokem Product Focus Akron Green Bay Mogadore
Slide 20: Enhances Performance Chemicals Profitability Profile
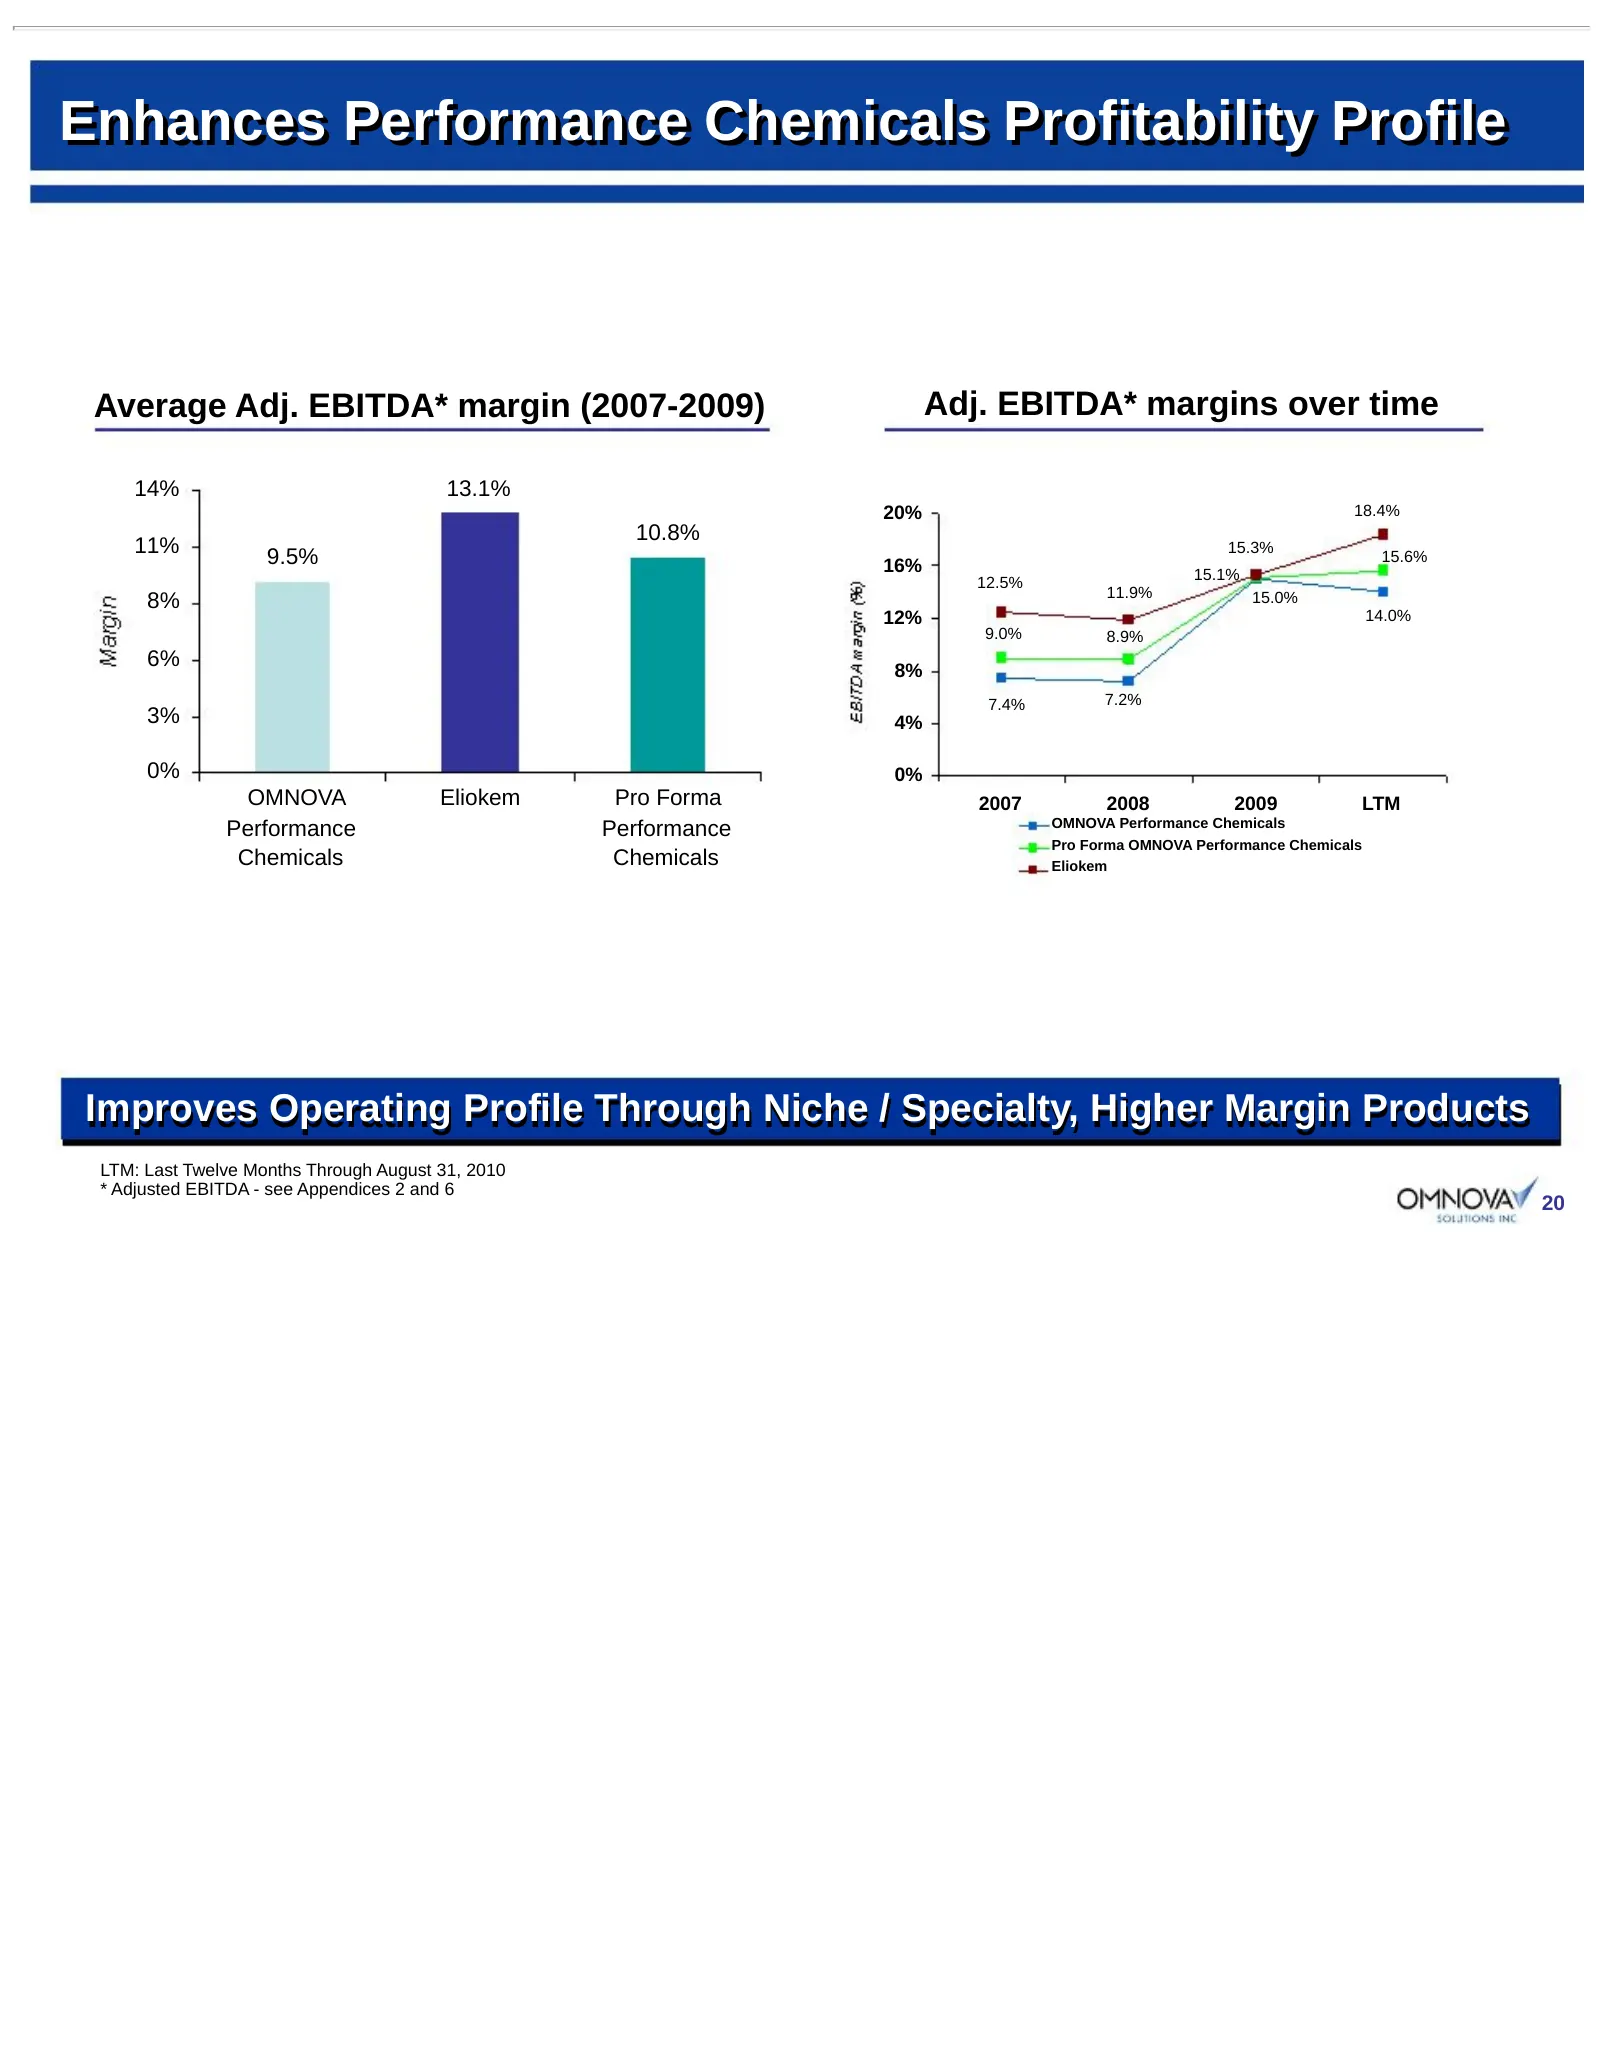
Enhances Performance Chemicals Profitability Profile Average Adj. EBITDA* margin (2007-2009) Adj. EBITDA* margins over time 14% 13.1% 20% 18.4% 10.8% 11% 15.3% 9.5% 16% 15.6% 15.1% 12.5% 11.9% 8% 15.0% 12% 14.0% 9.0% 8.9% 6% 8% 7.4% 7.2% 3% 4% 0% 0% OMNOVA Eliokem Pro Forma 2007 2008 2009 LTM OMNOVA
Slide 21: OMNOVA Consolidated - Enhanced End Use Revenue Diversification
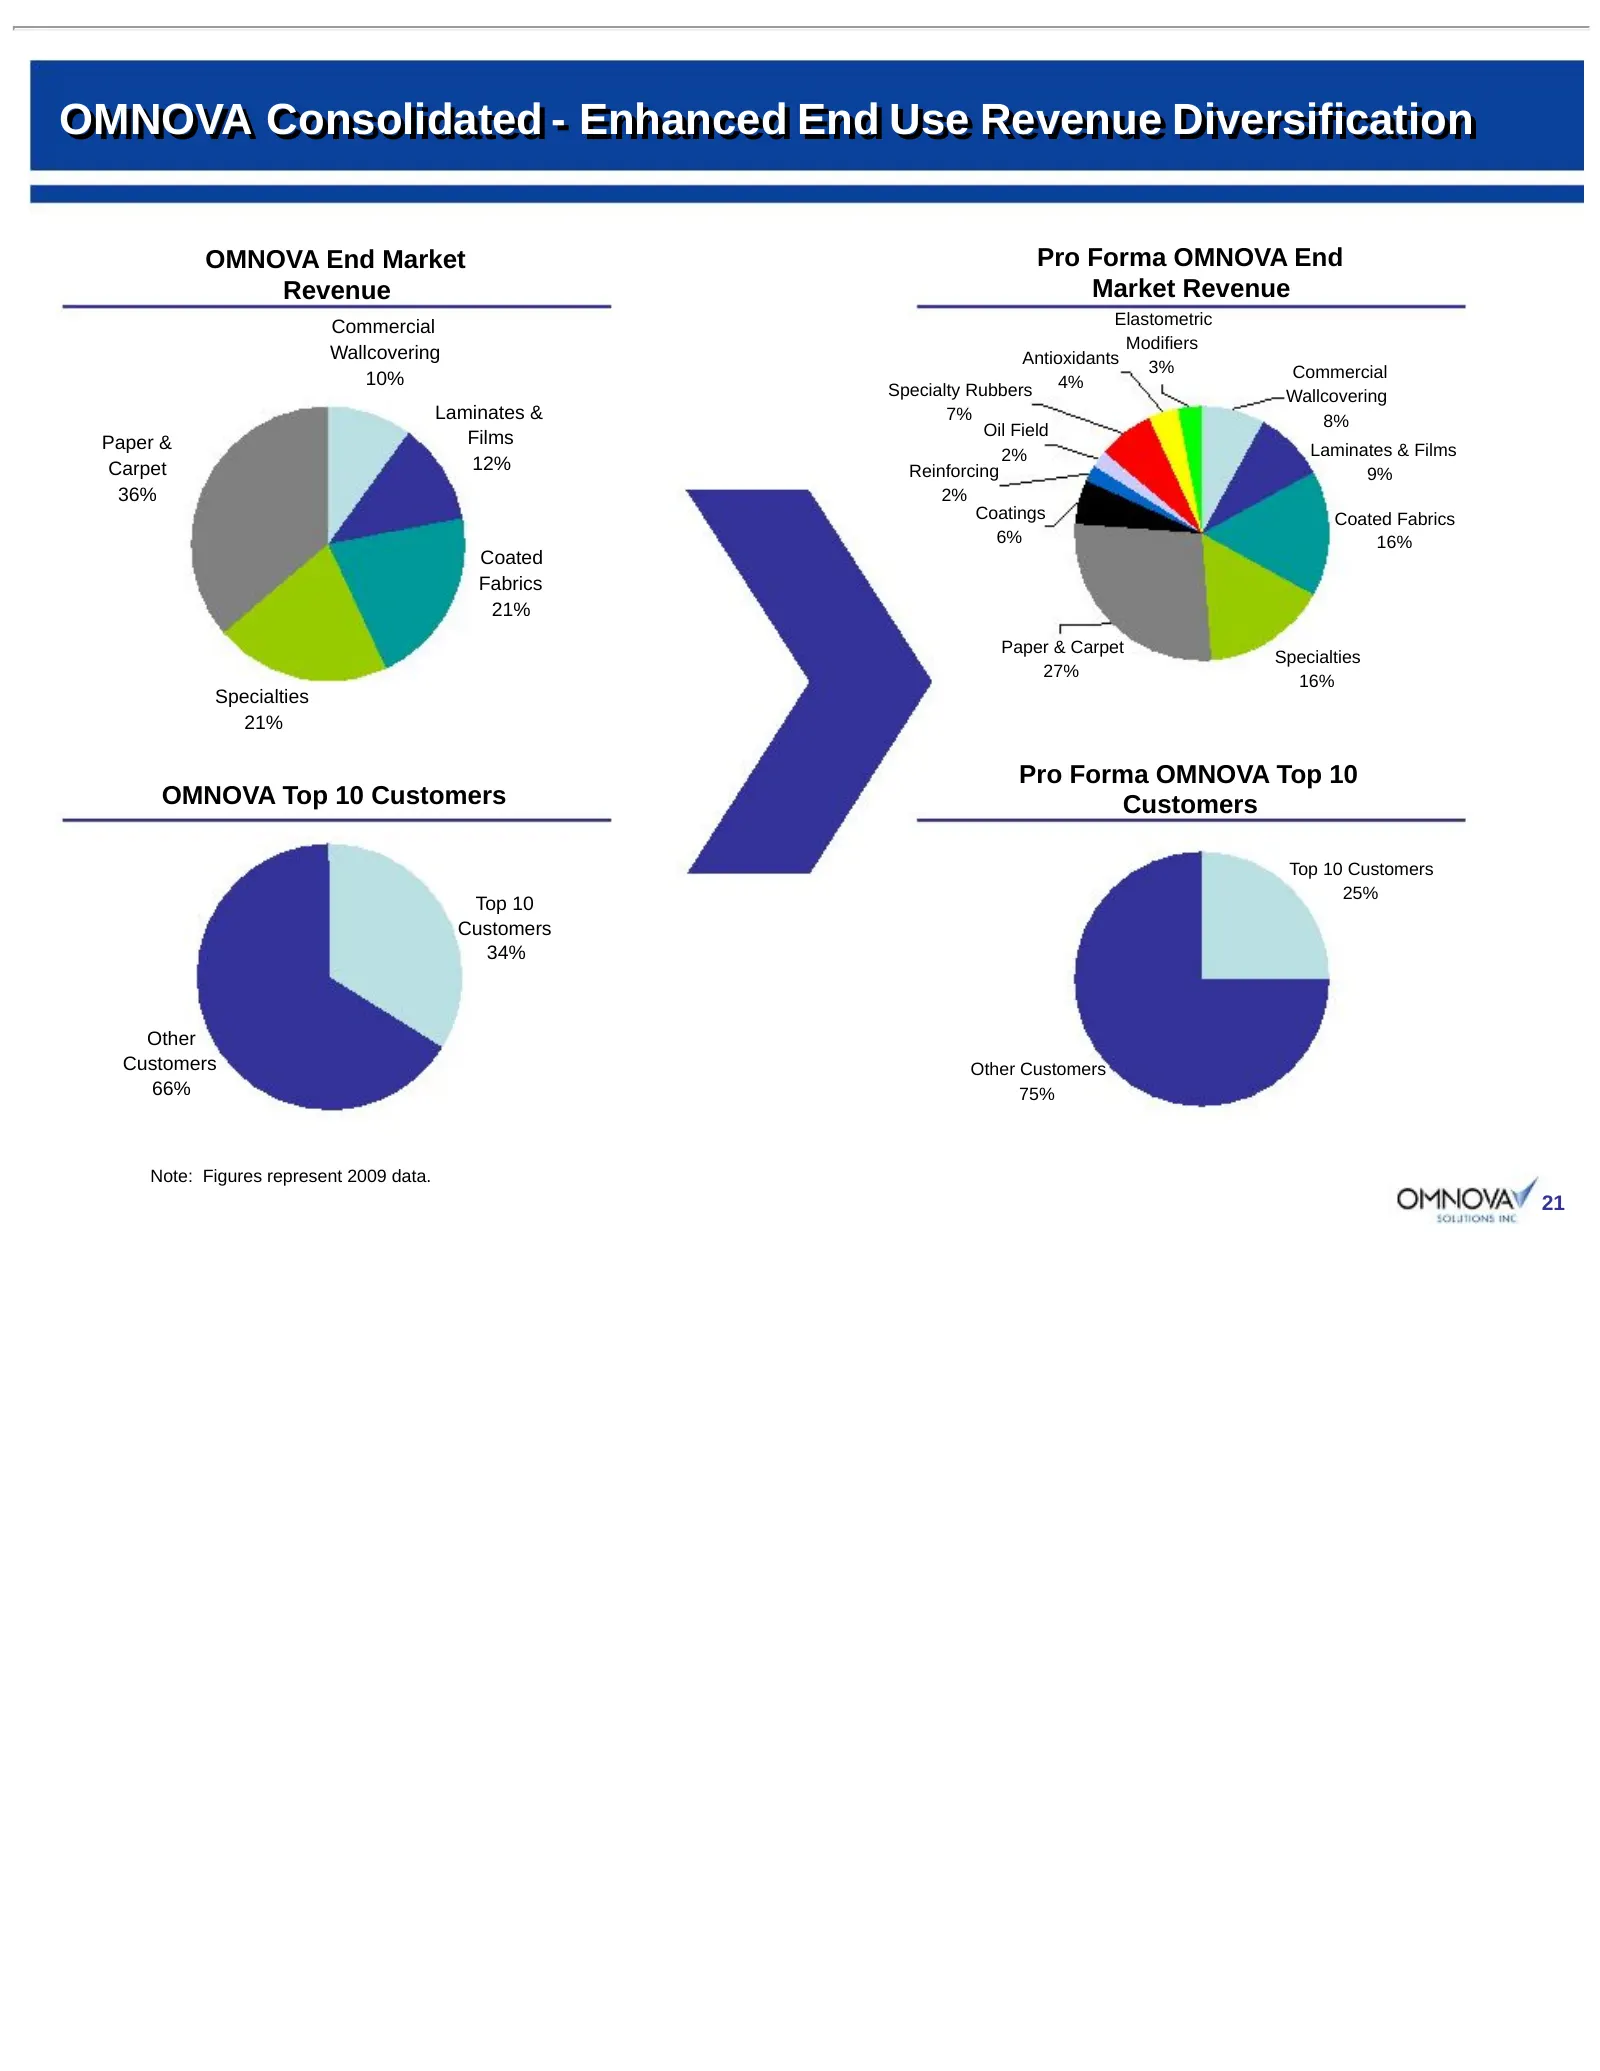
OMNOVA OMNOVA Consolidated Consolidated -- Enhanced Enhanced End End Use Use Revenue Revenue Diversification Diversification OMNOVA End Market Pro Forma OMNOVA End Revenue Market Revenue Commercial Elastometric Modifiers Wallcovering Antioxidants 3% Commercial 10% Specialty Rubbers 4% Wallcovering L
Slide 22: Accelerates OMNOVA's Global Reach On A Pro Forma Basis
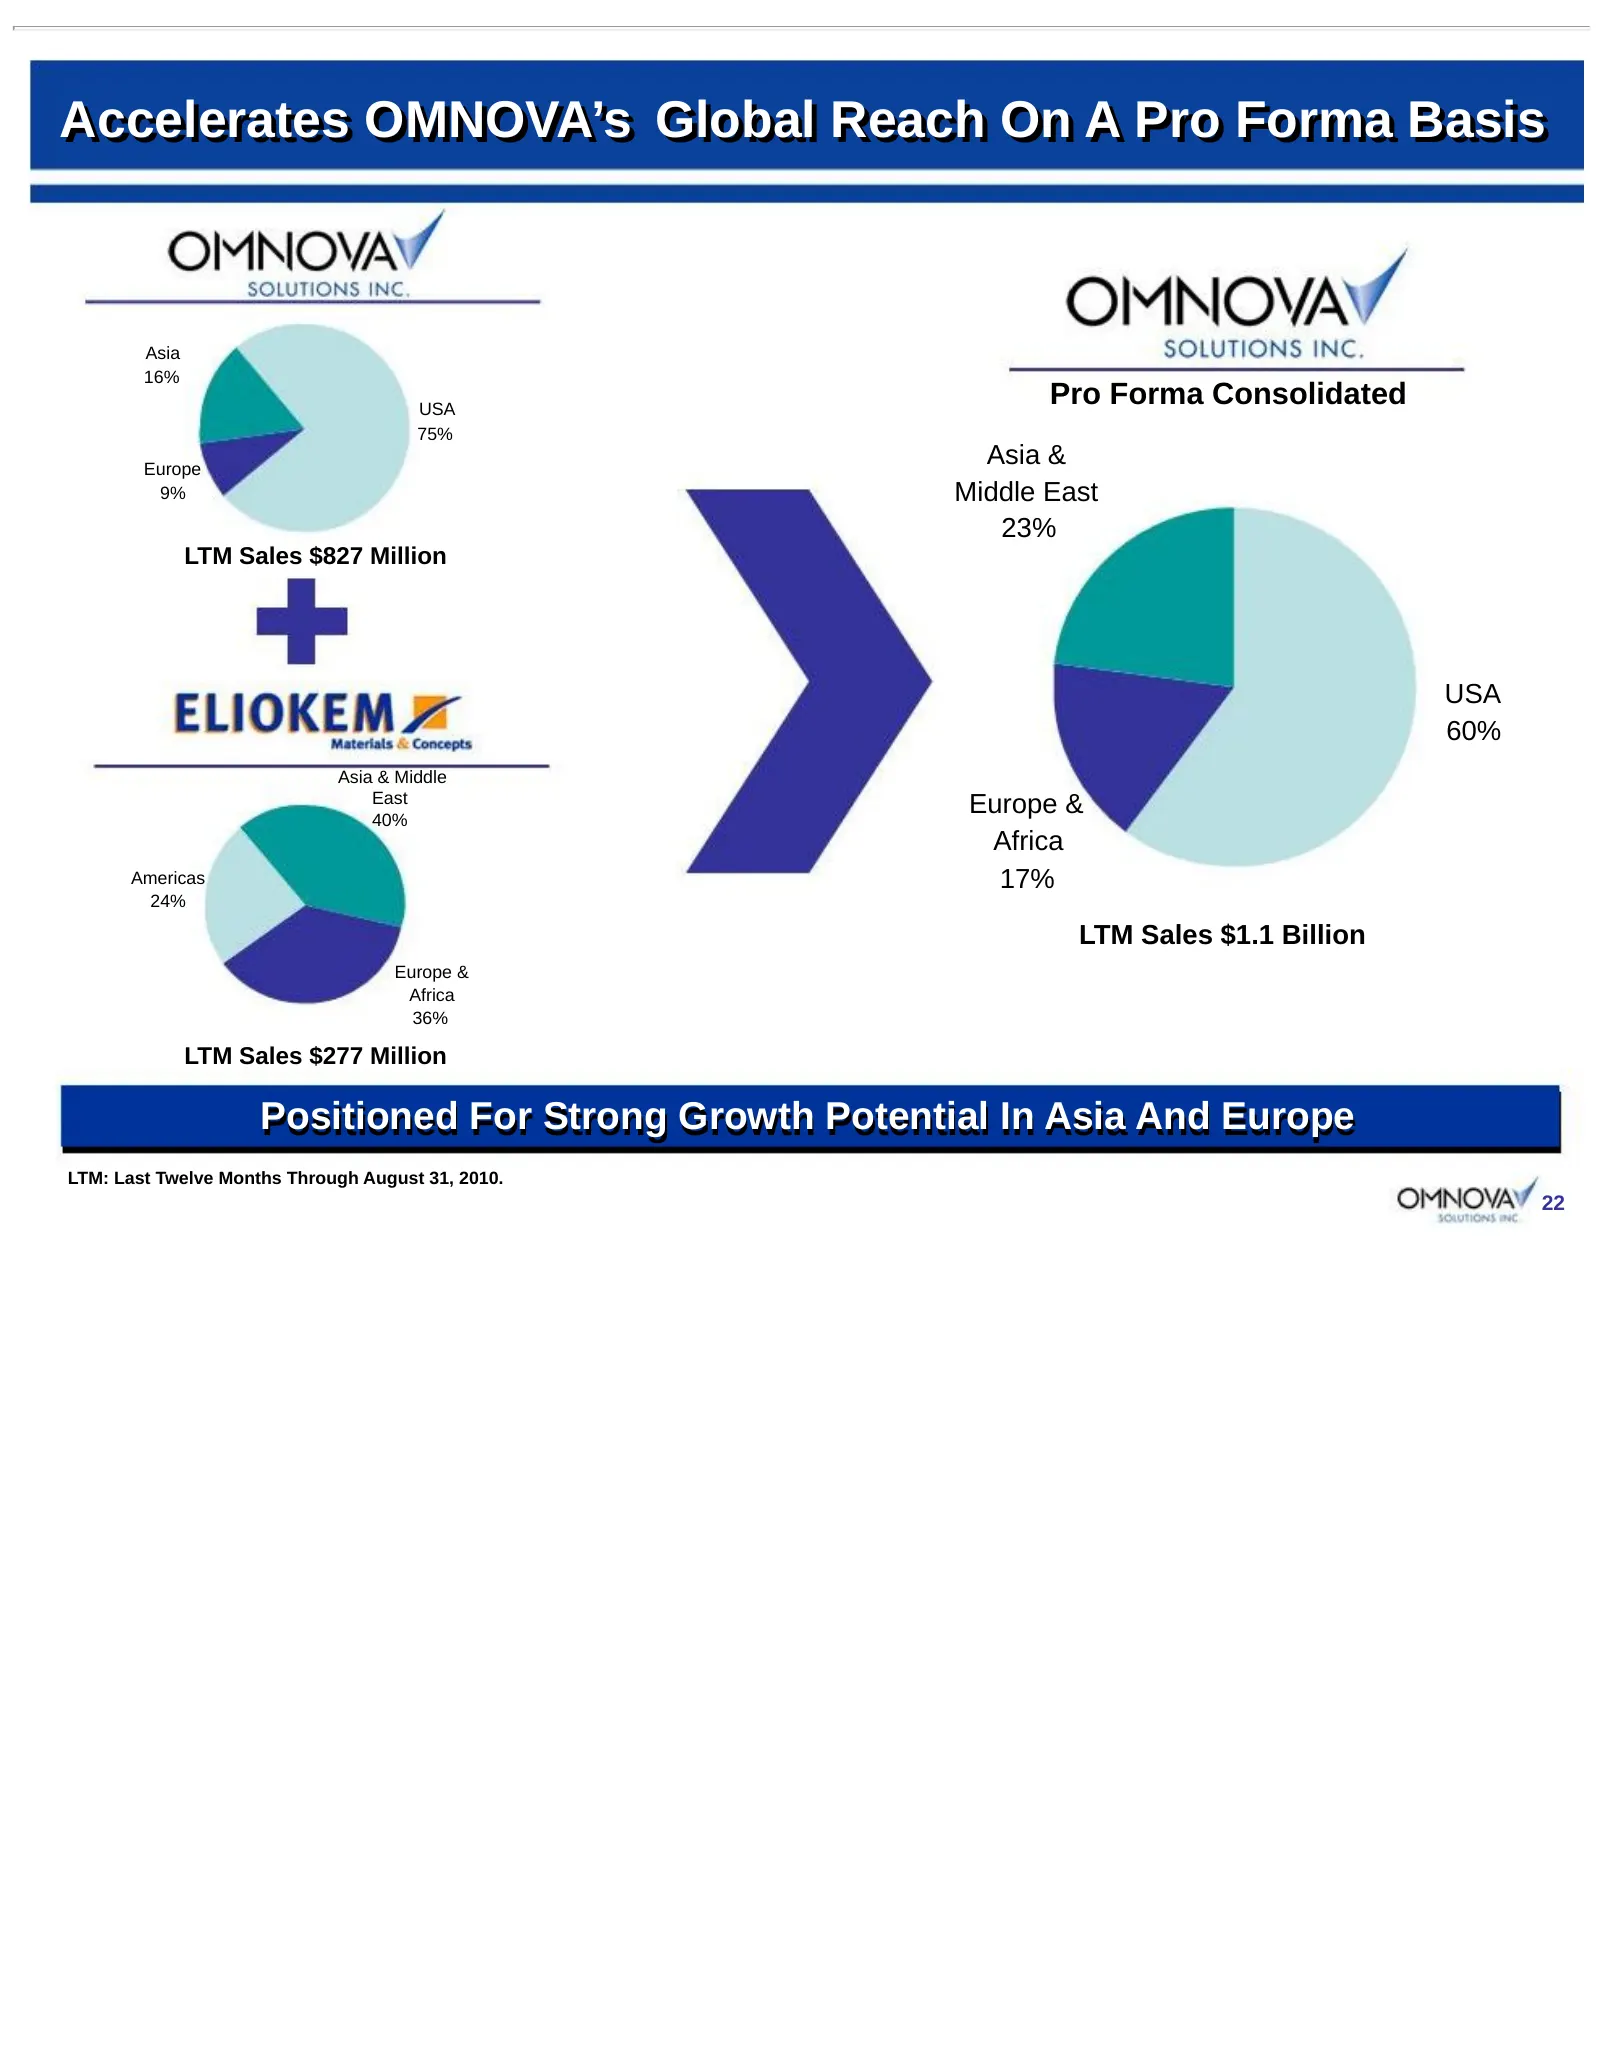
Accelerates OMNOVA’s Global Reach On A Pro Forma Basis Asia 16% USA Pro Forma Consolidated 75% Europe Asia & 9% Middle East 23% LTM Sales $827 Million USA 60% Asia & Middle East 40% Europe & Africa Americas 17% 24% LTM Sales $1.1 Billion Europe & Africa 36% LTM Sales $277 Million Positioned For Stro
Slide 23: Terms
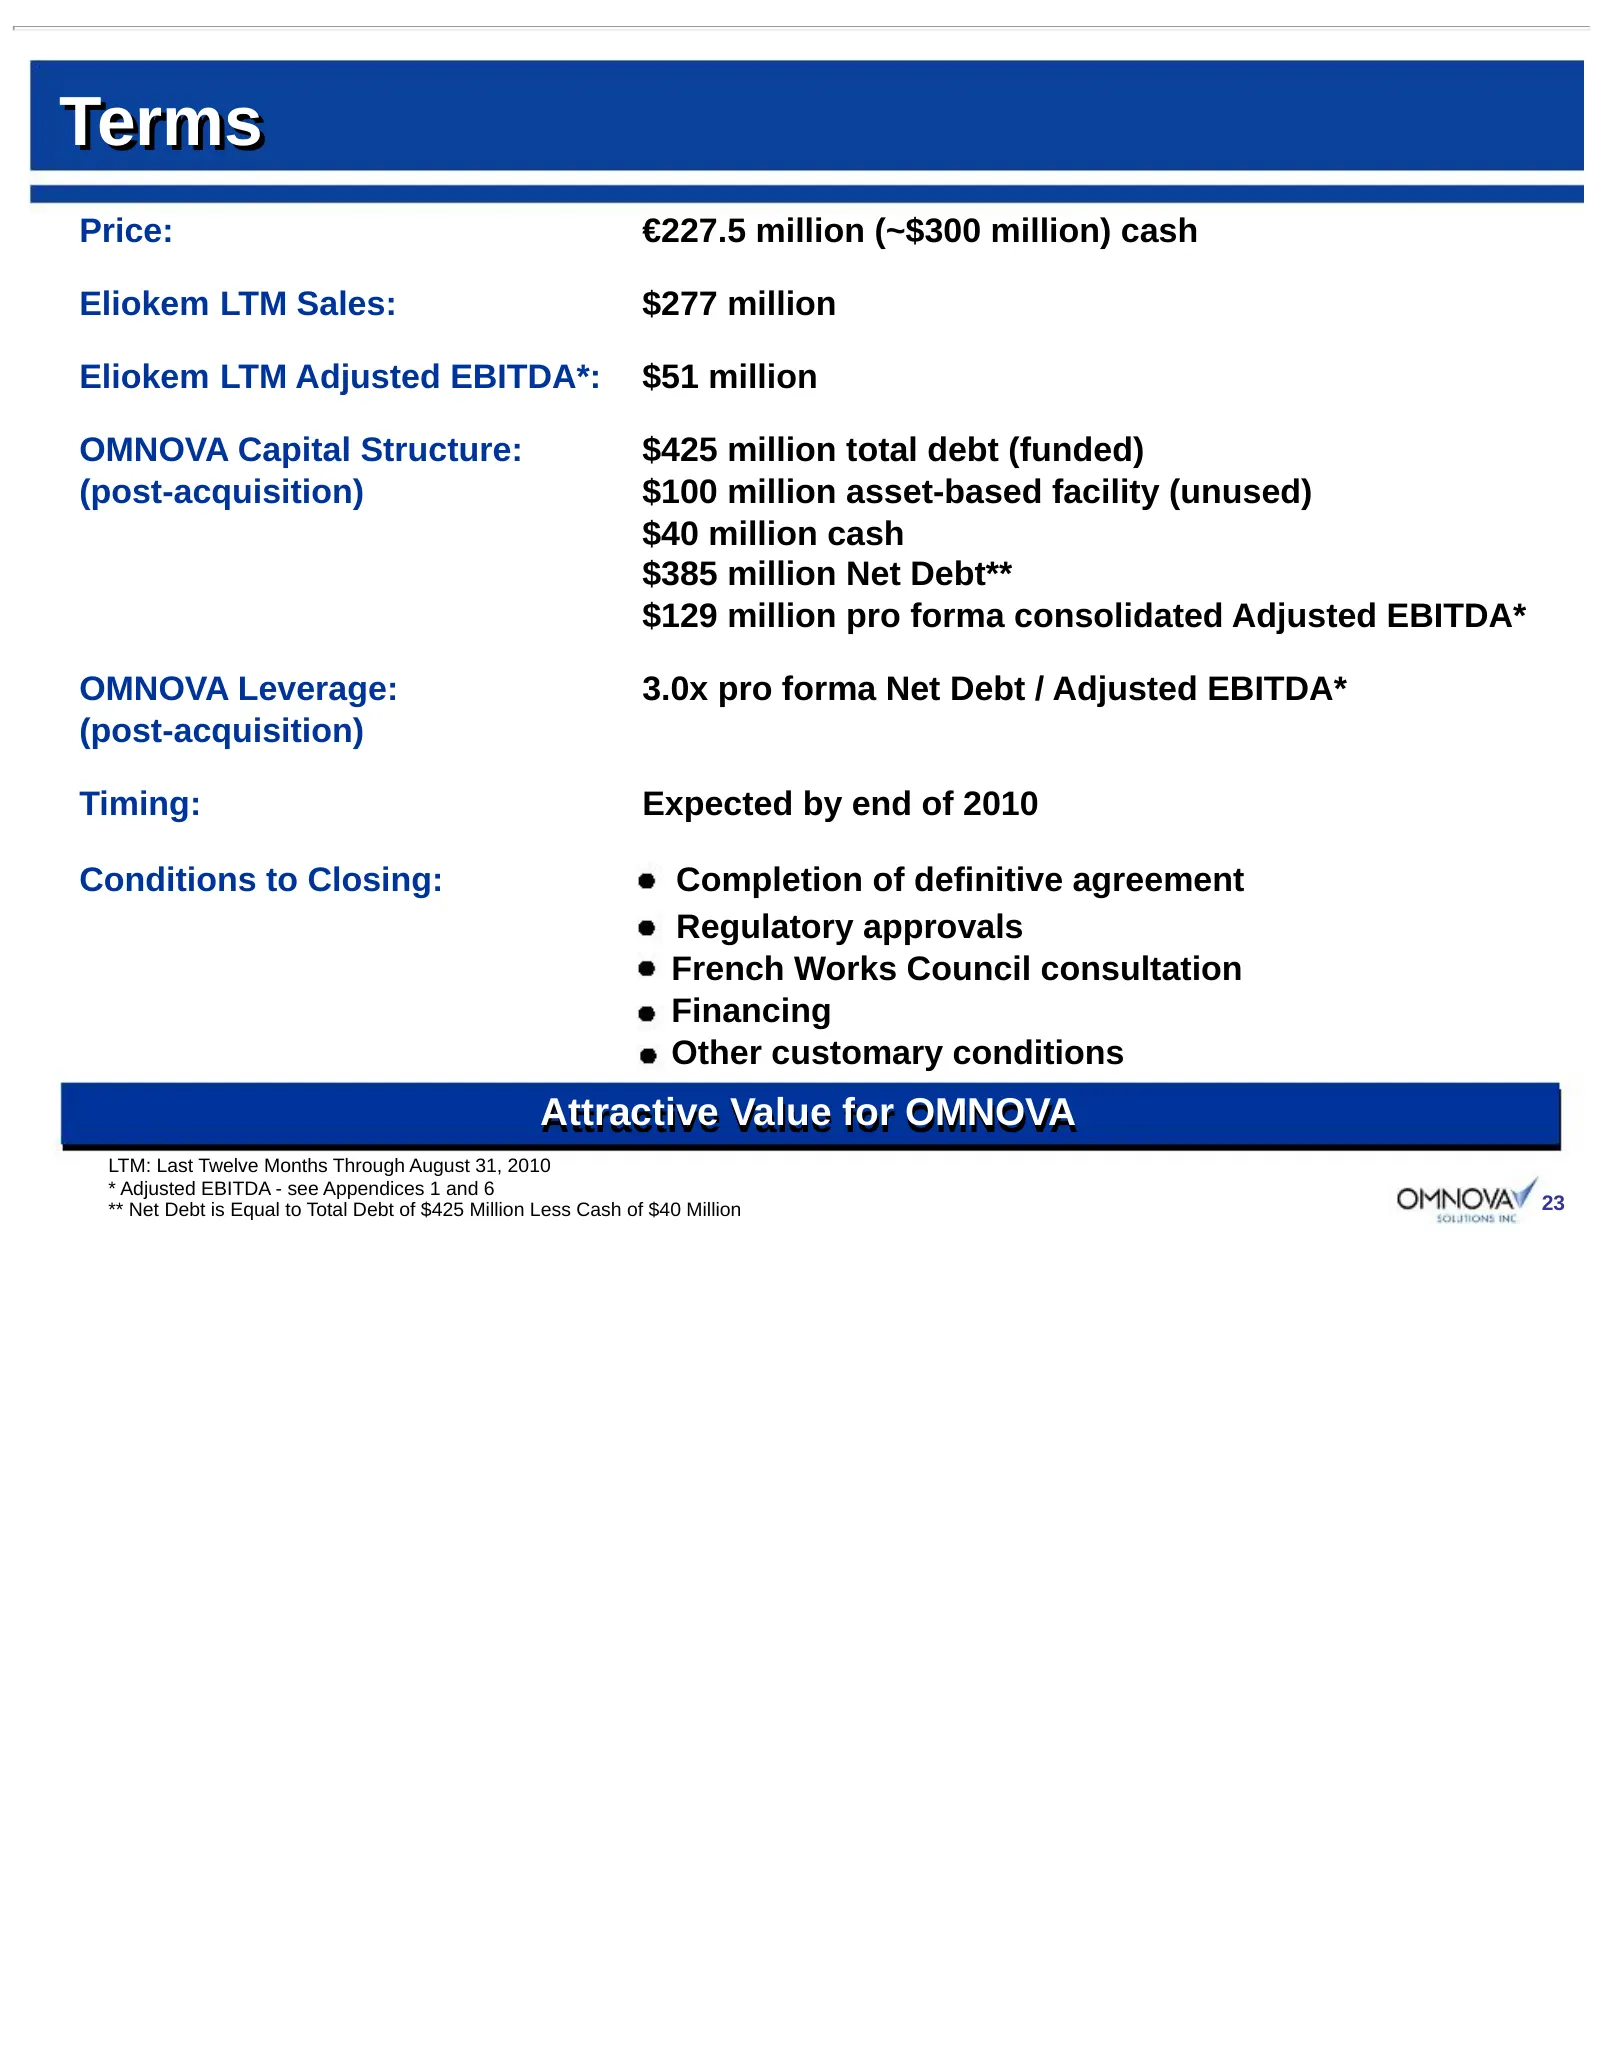
Terms Price: €227.5 million (~$300 million) cash Eliokem LTM Sales: $277 million Eliokem LTM Adjusted EBITDA*: $51 million OMNOVA Capital Structure: $425 million total debt (funded) (post-acquisition) $100 million asset-based facility (unused) $40 million cash $385 million Net Debt** $129 million pr
Slide 24: Summary – Consistent With Our Previously Stated Strategy
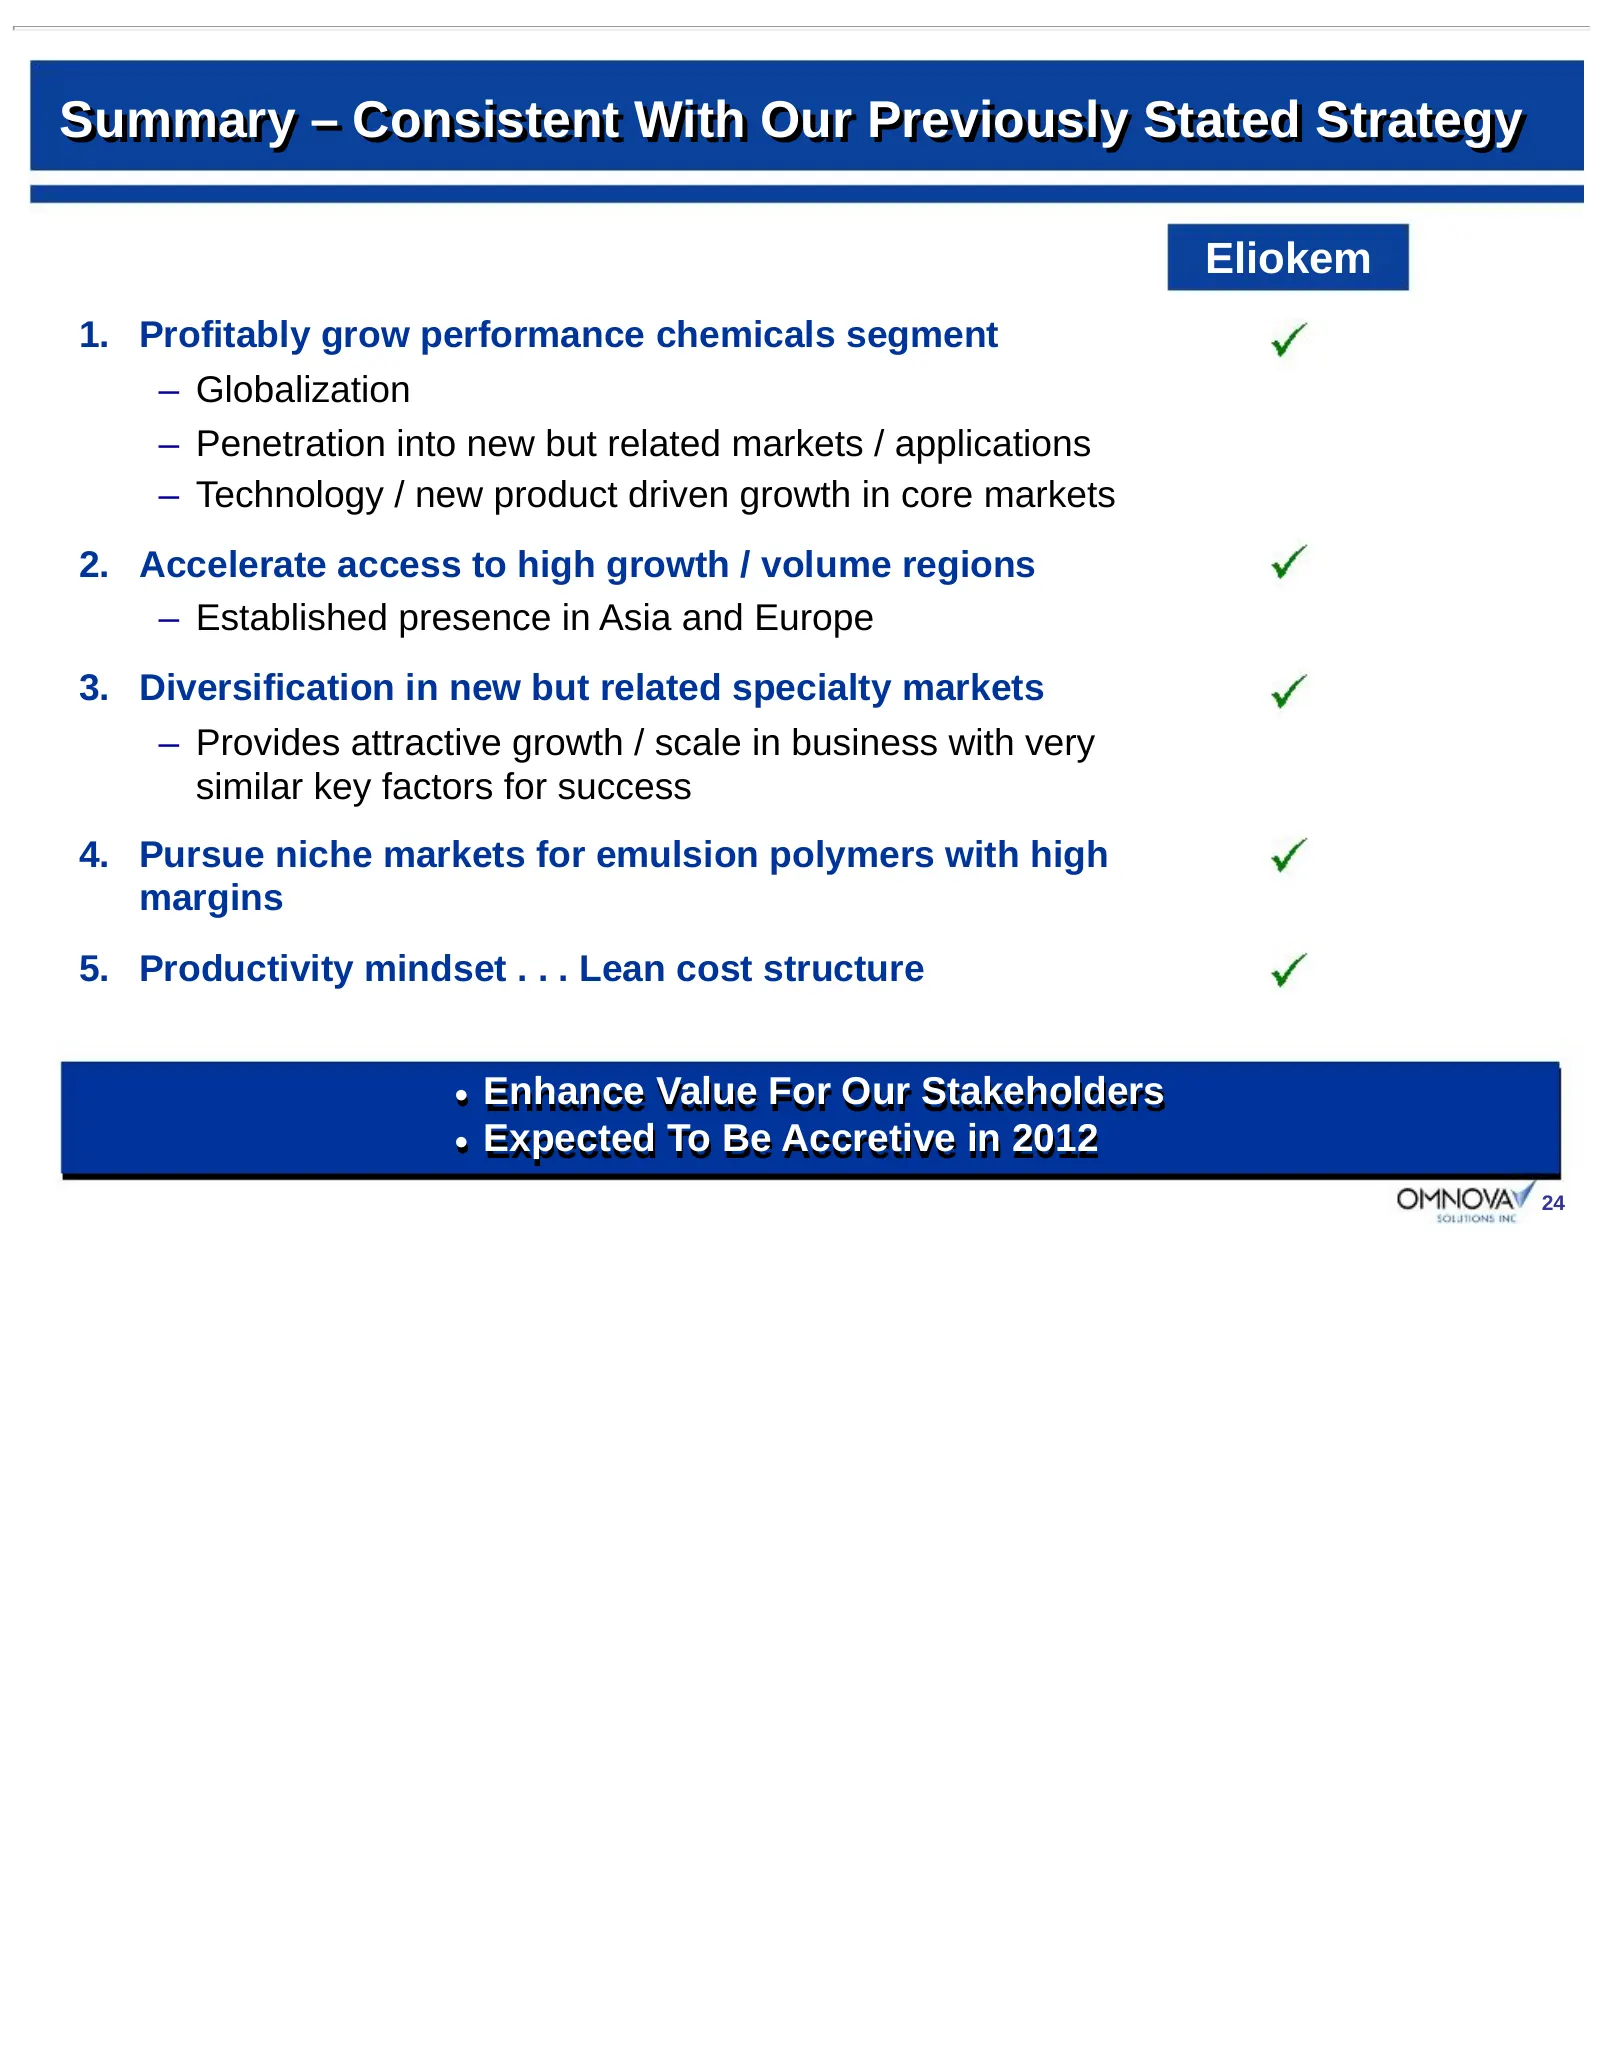
Summary – Consistent With Our Previously Stated Strategy Eliokem 1. Profitably grow performance chemicals segment – Globalization – Penetration into new but related markets / applications – Technology / new product driven growth in core markets 2. Accelerate access to high growth / volume regions –
Slide 25: Appendix
Appendix 25
Slide 26: Appendix — Non-GAAP Financial Measures
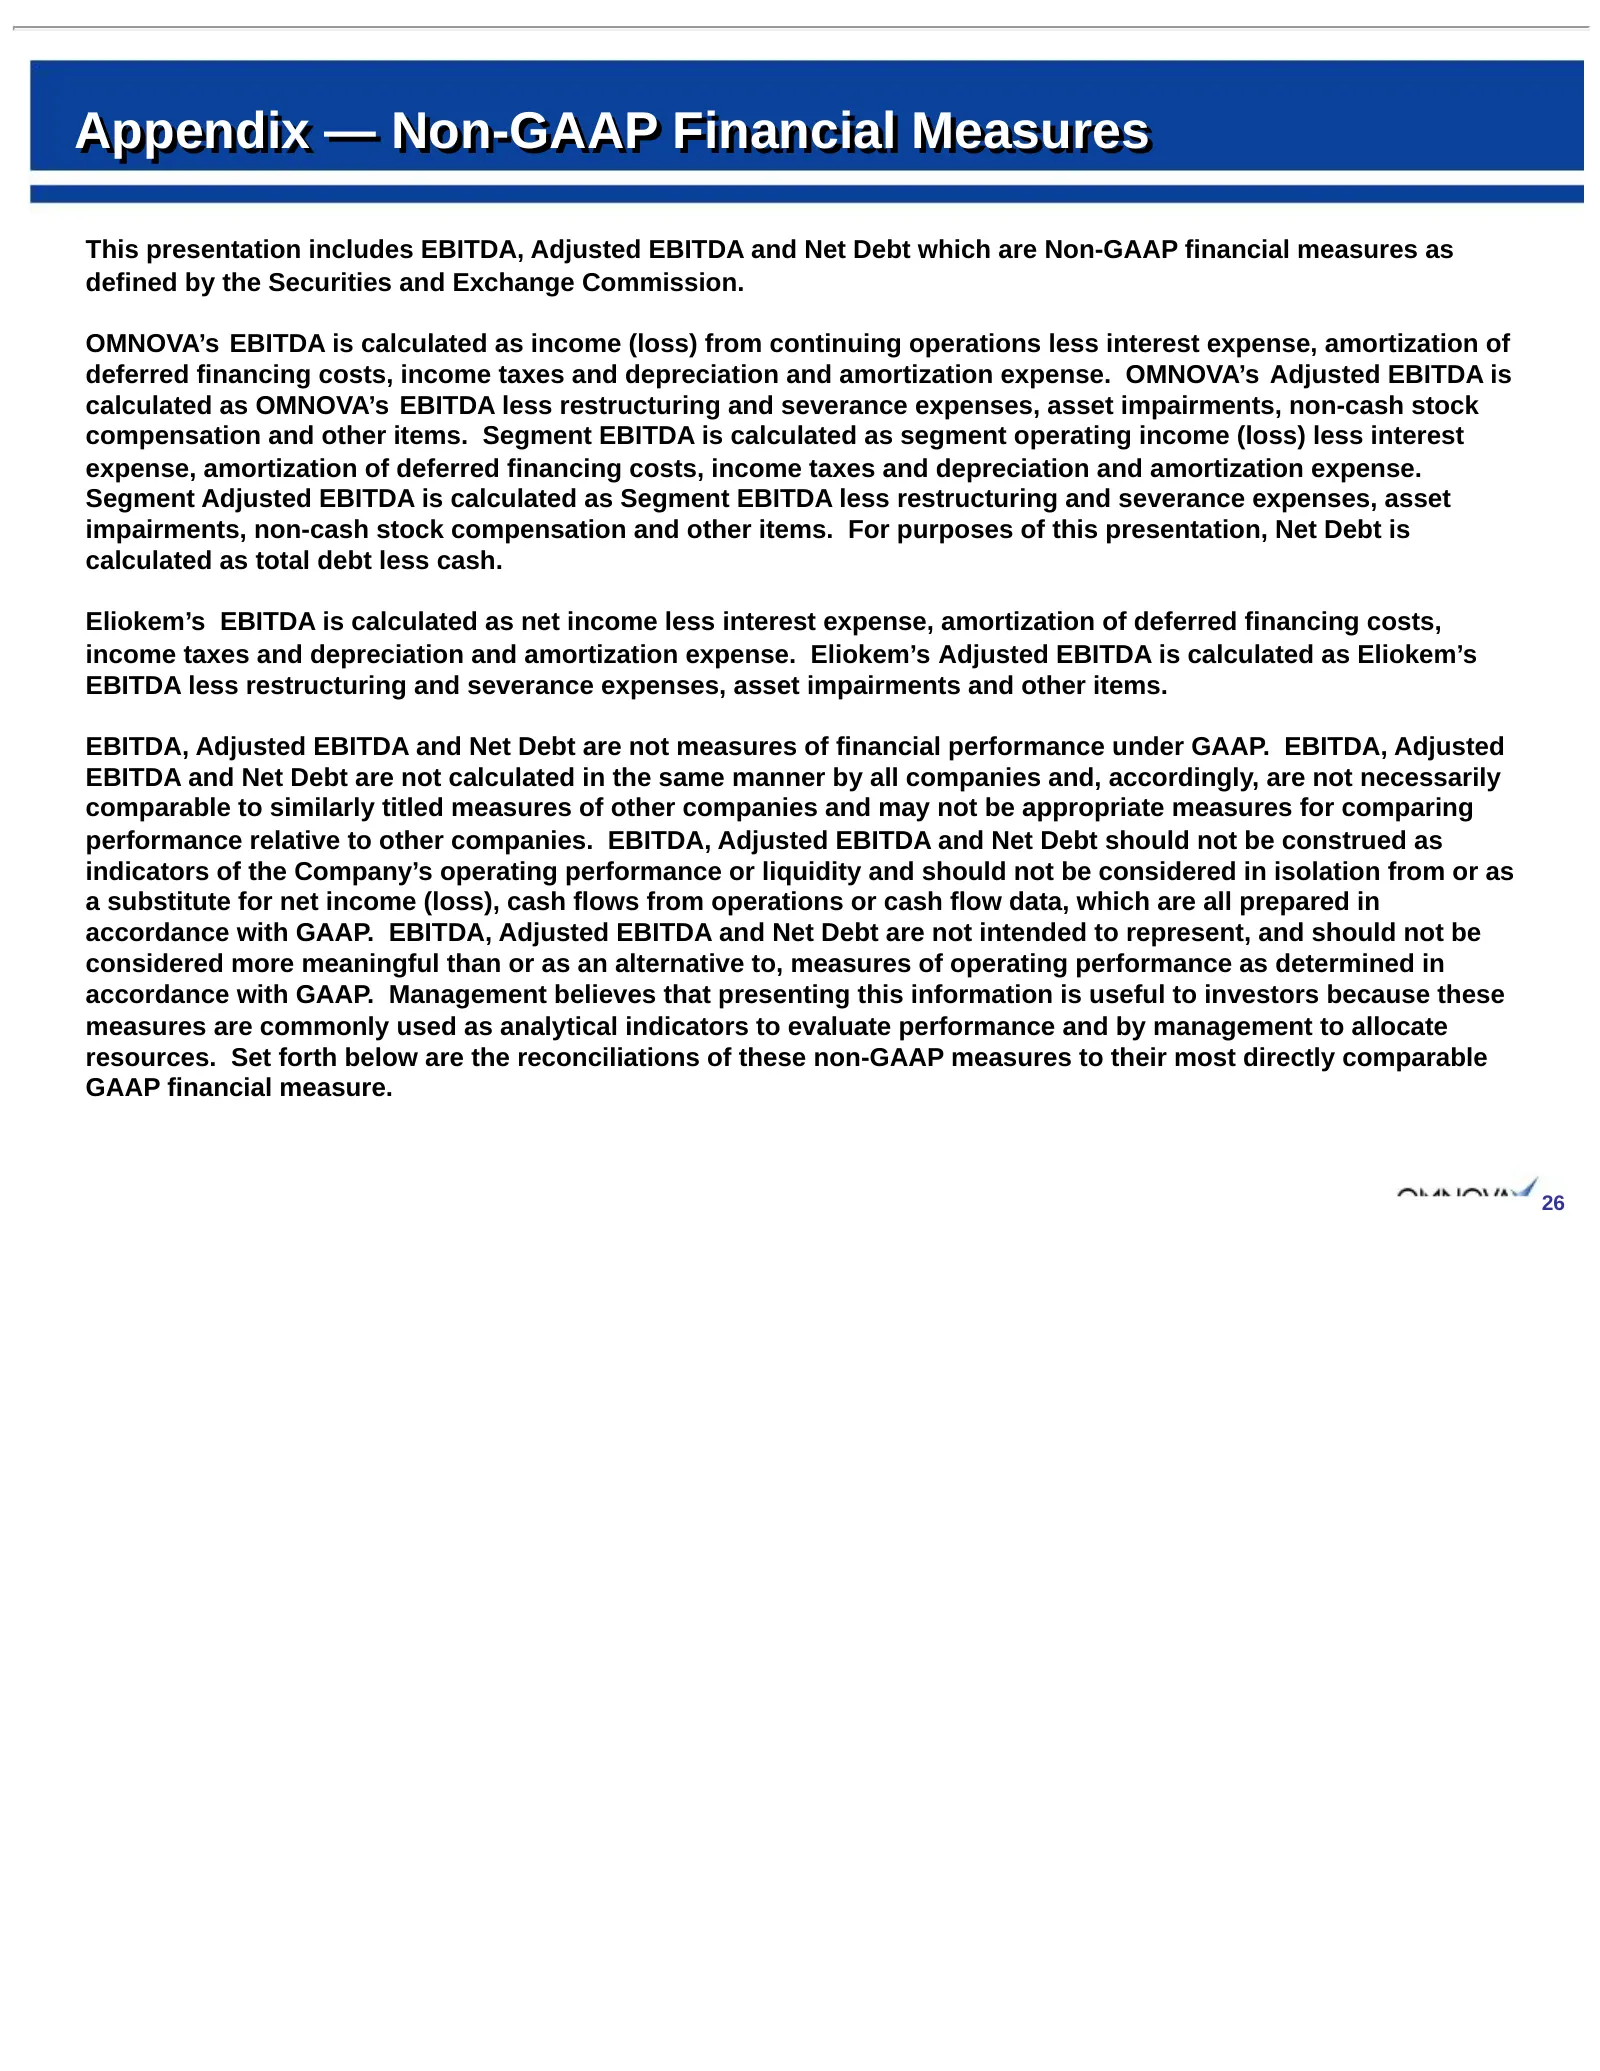
Appendix — Non-GAAP Financial Measures This presentation includes EBITDA, Adjusted EBITDA and Net Debt which are Non-GAAP financial measures as defined by the Securities and Exchange Commission. OMNOVA’s EBITDA is calculated as income (loss) from continuing operations less interest expense, amortiza
Slide 27: Appendix 1 - Adjusted EBITDA
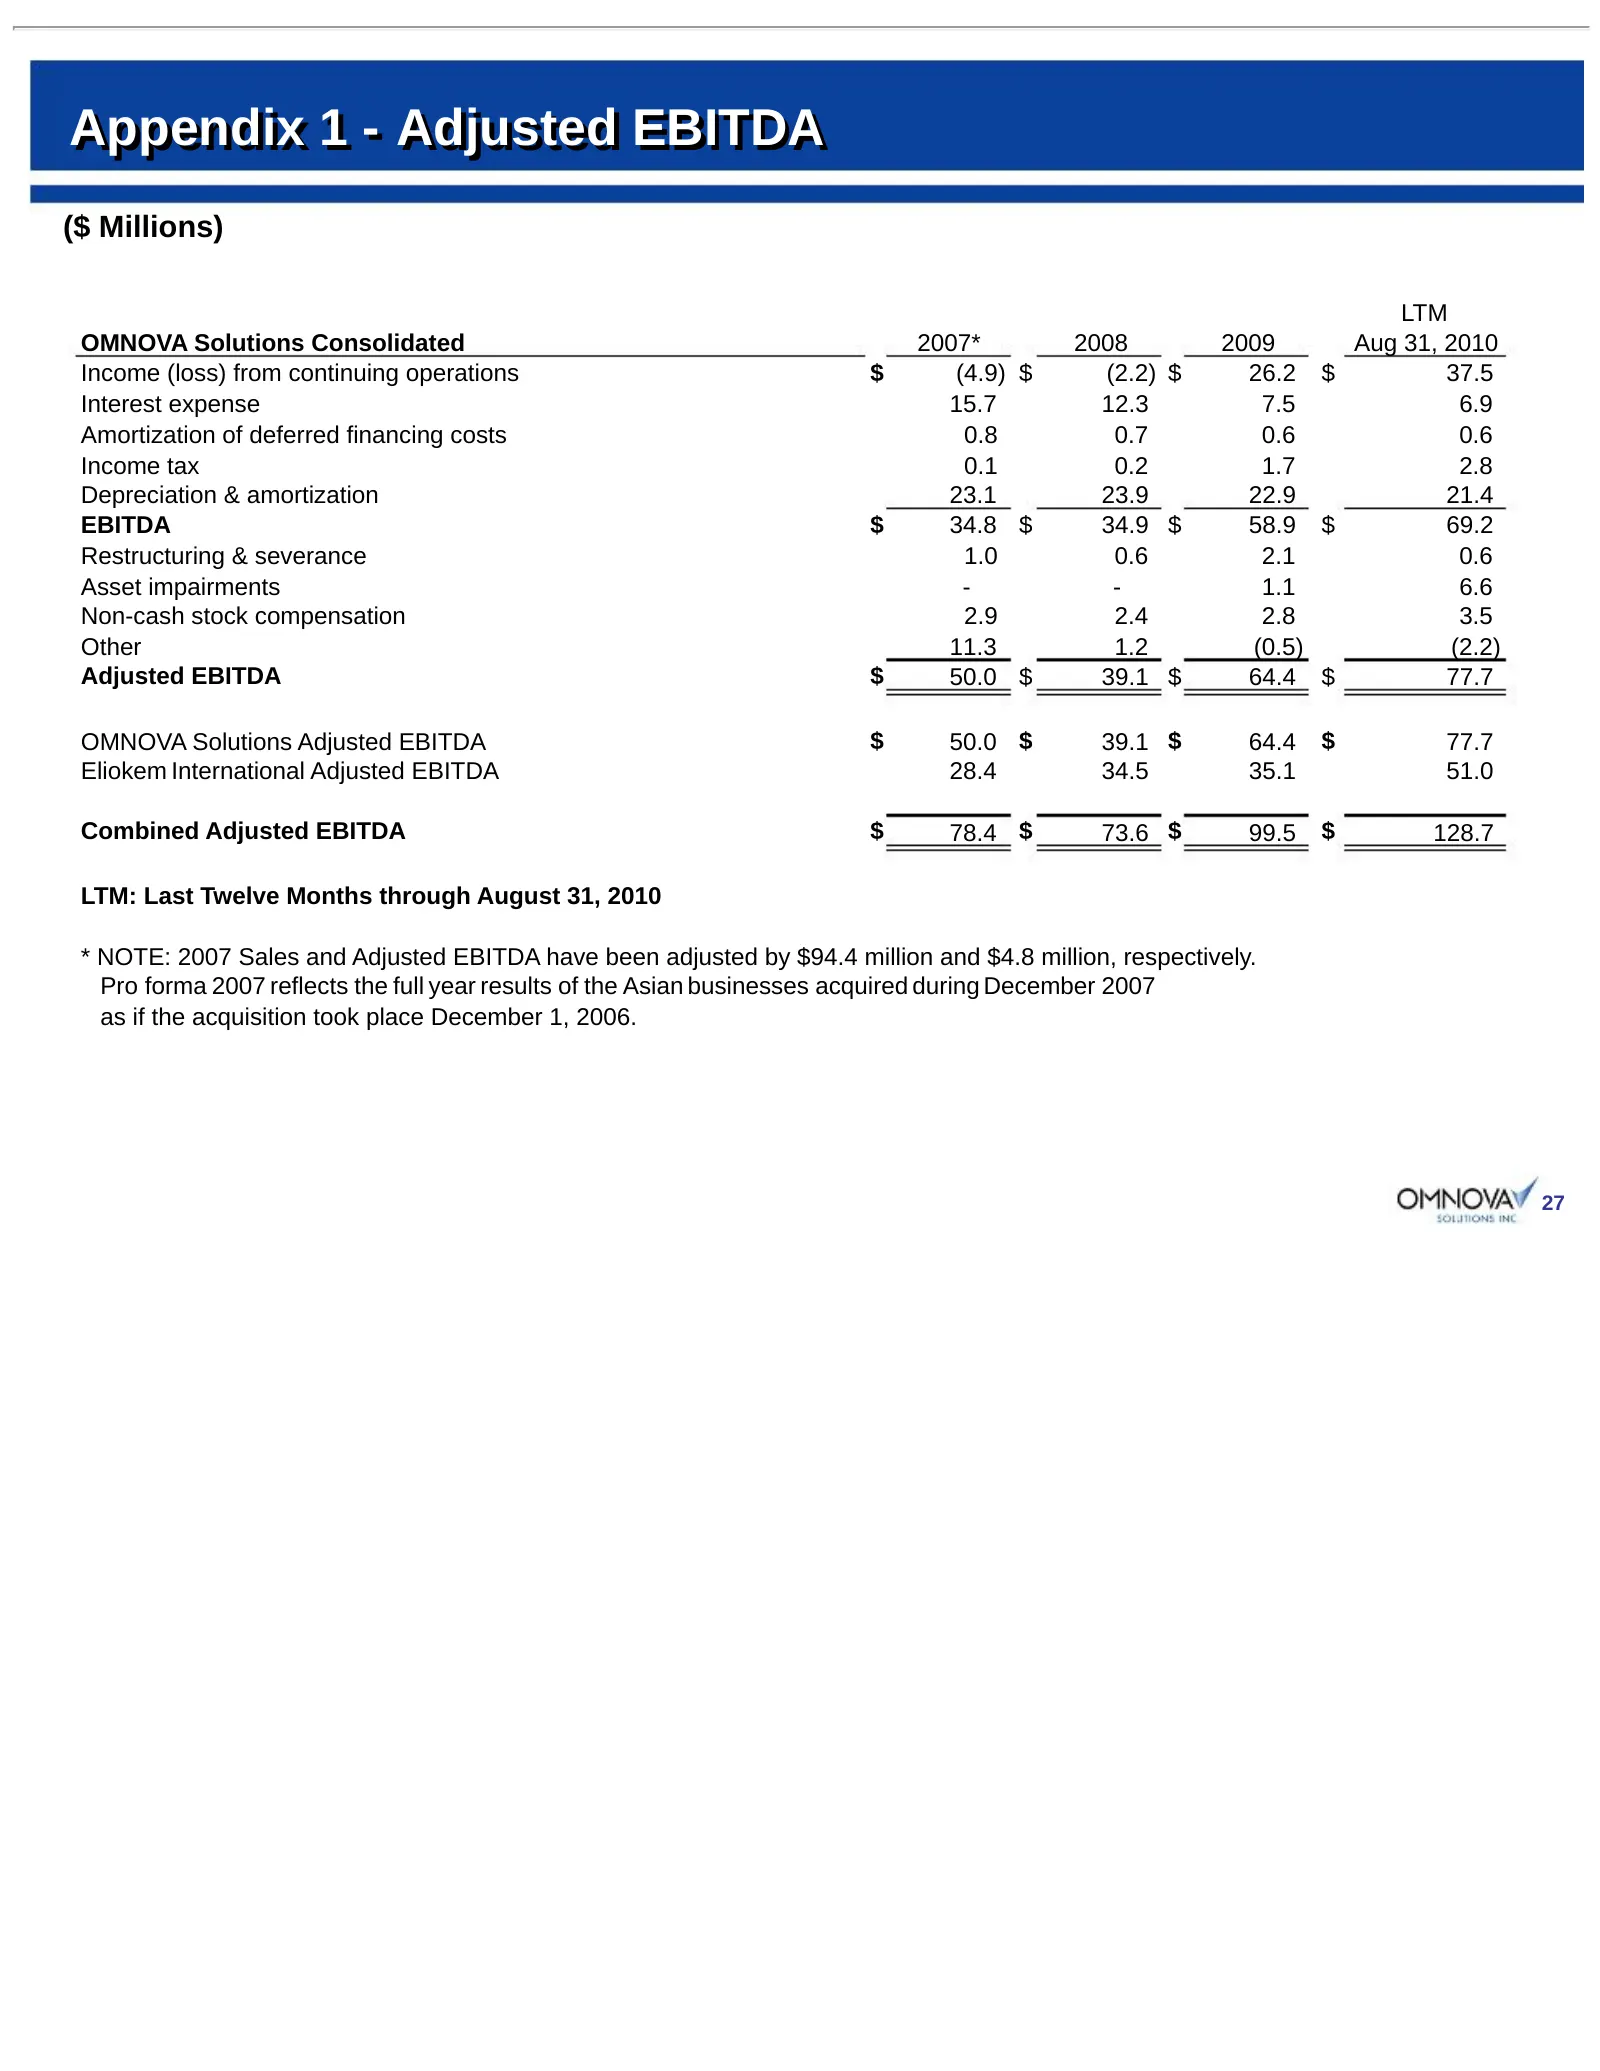
Appendix 1 - Adjusted EBITDA ($ Millions) LTM OMNOVA Solutions Consolidated 2007* 2008 2009 Aug 31, 2010 Income (loss) from continuing operations $ (4.9) $ (2.2) $ 26.2 $ 37.5 Interest expense 15.7 12.3 7.5 6.9 Amortization of deferred financing costs 0.8 0.7 0.6 0.6 Income tax 0.1 0.2 1.7 2.8 Depre
Slide 28: Appendix 2 - Adjusted EBITDA
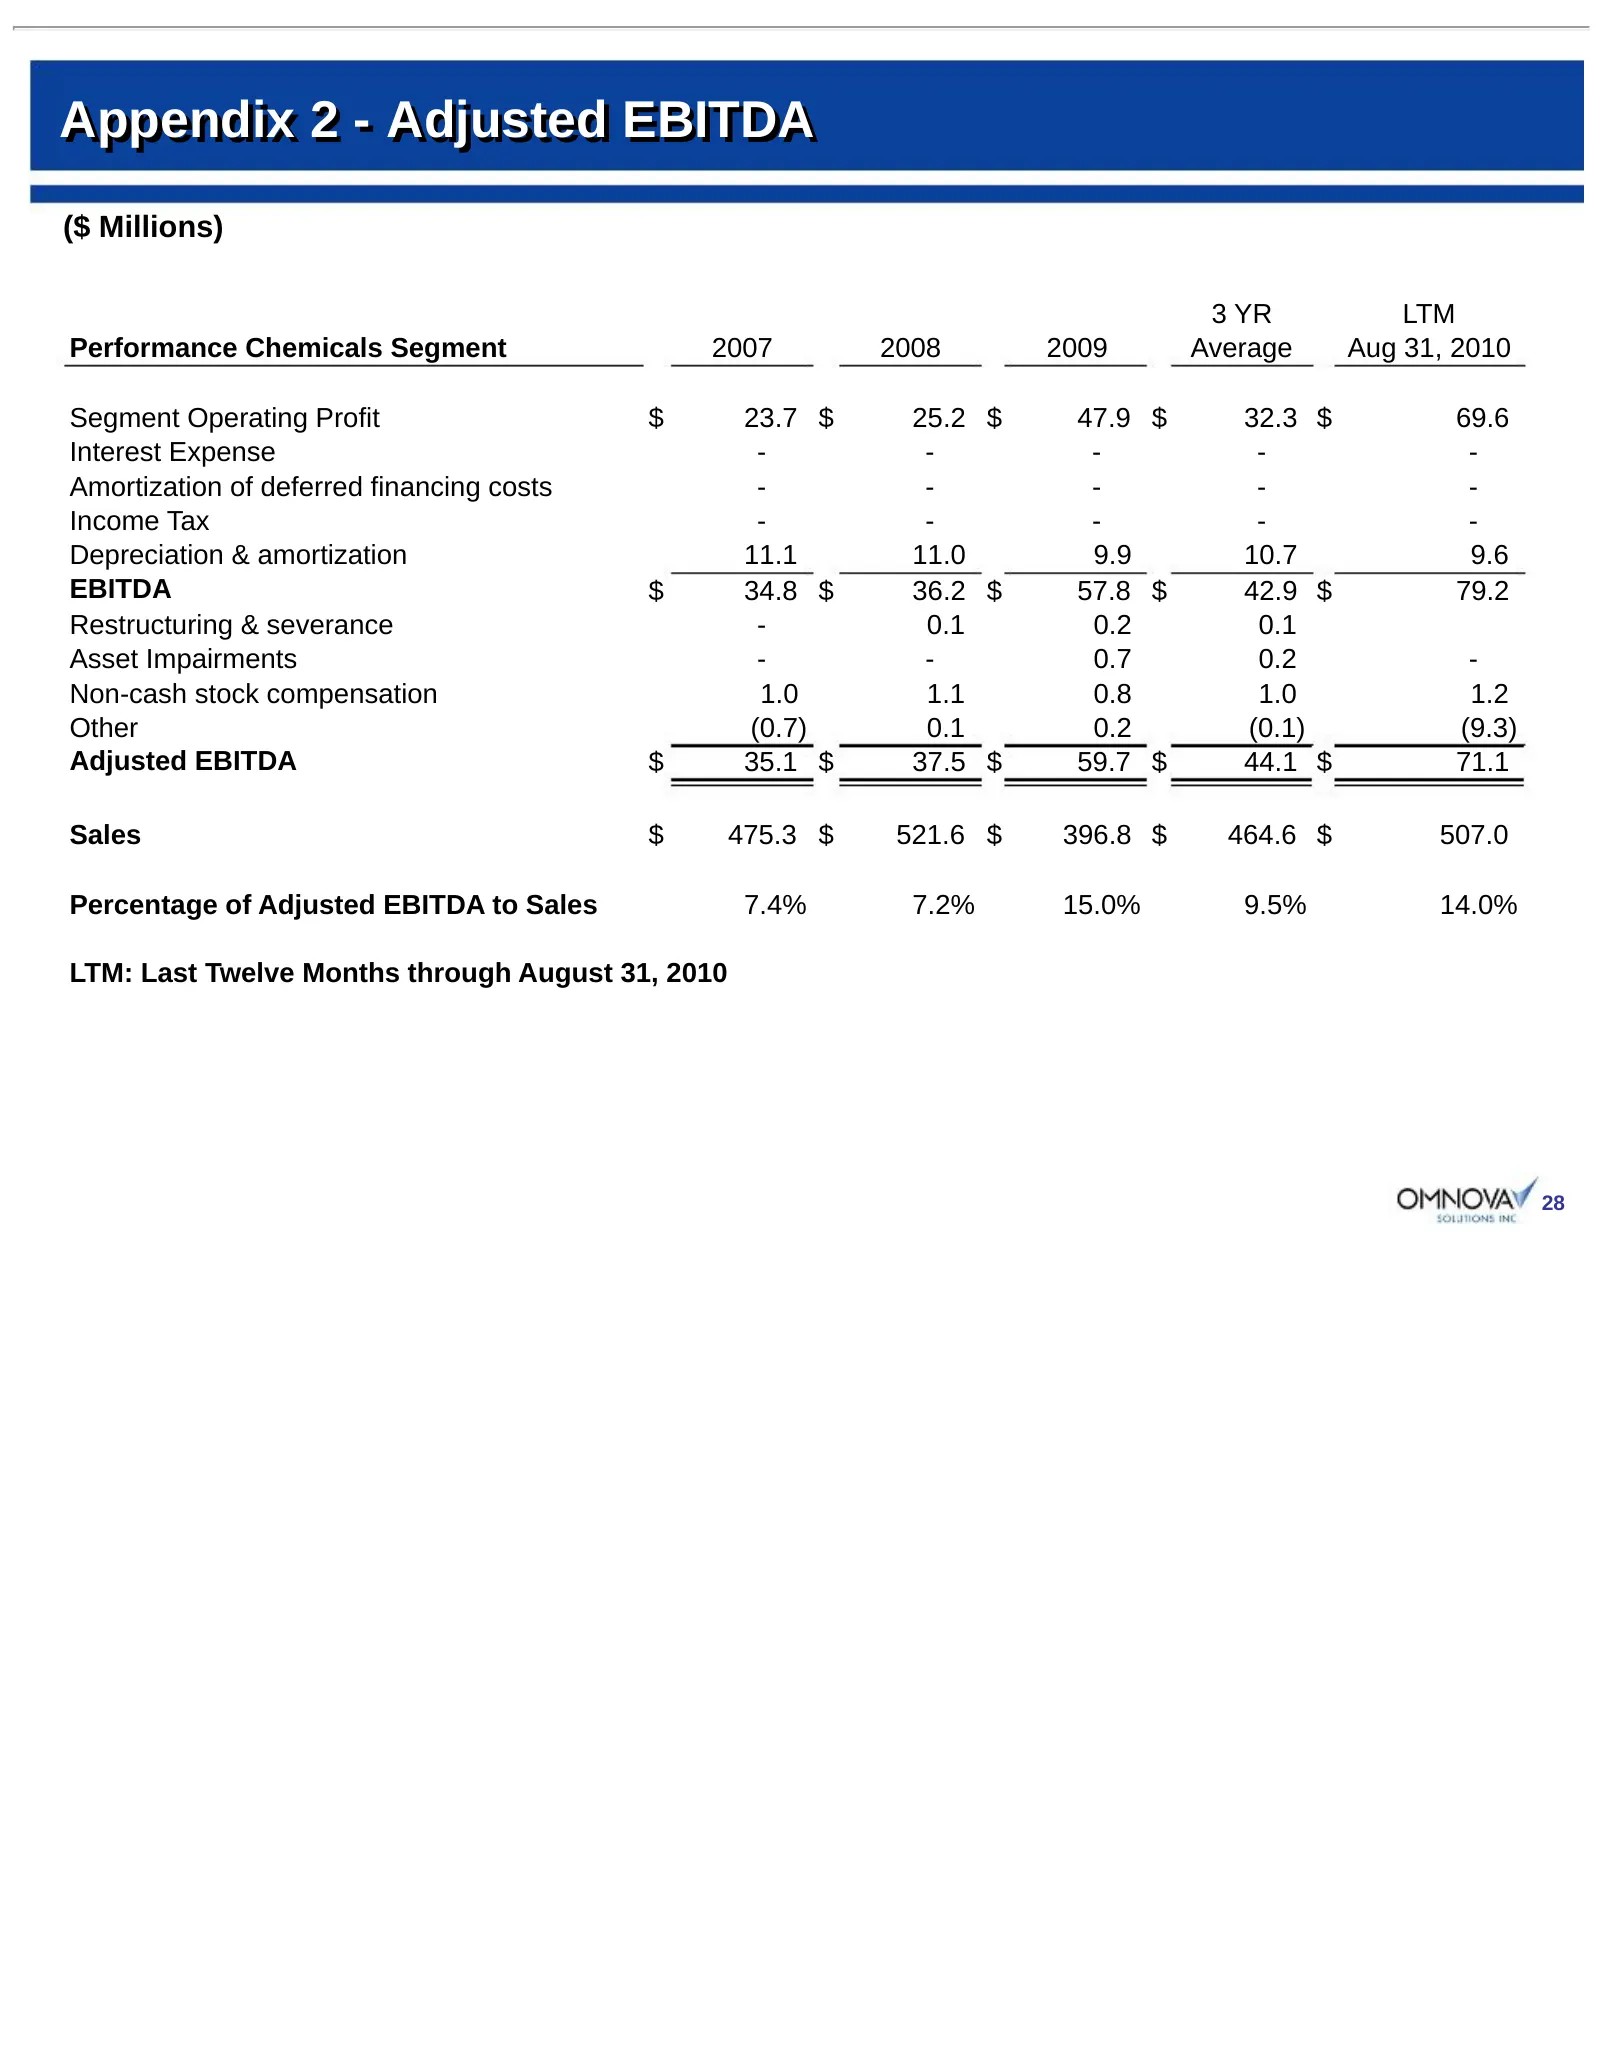
Appendix 2 - Adjusted EBITDA ($ Millions) 3 YR LTM Performance Chemicals Segment 2007 2008 2009 Average Aug 31, 2010 Segment Operating Profit $ 23.7 $ 25.2 $ 47.9 $ 32.3 $ 69.6 Interest Expense - - - - - Amortization of deferred financing costs - - - - - Income Tax - - - - - Depreciation & amortizat
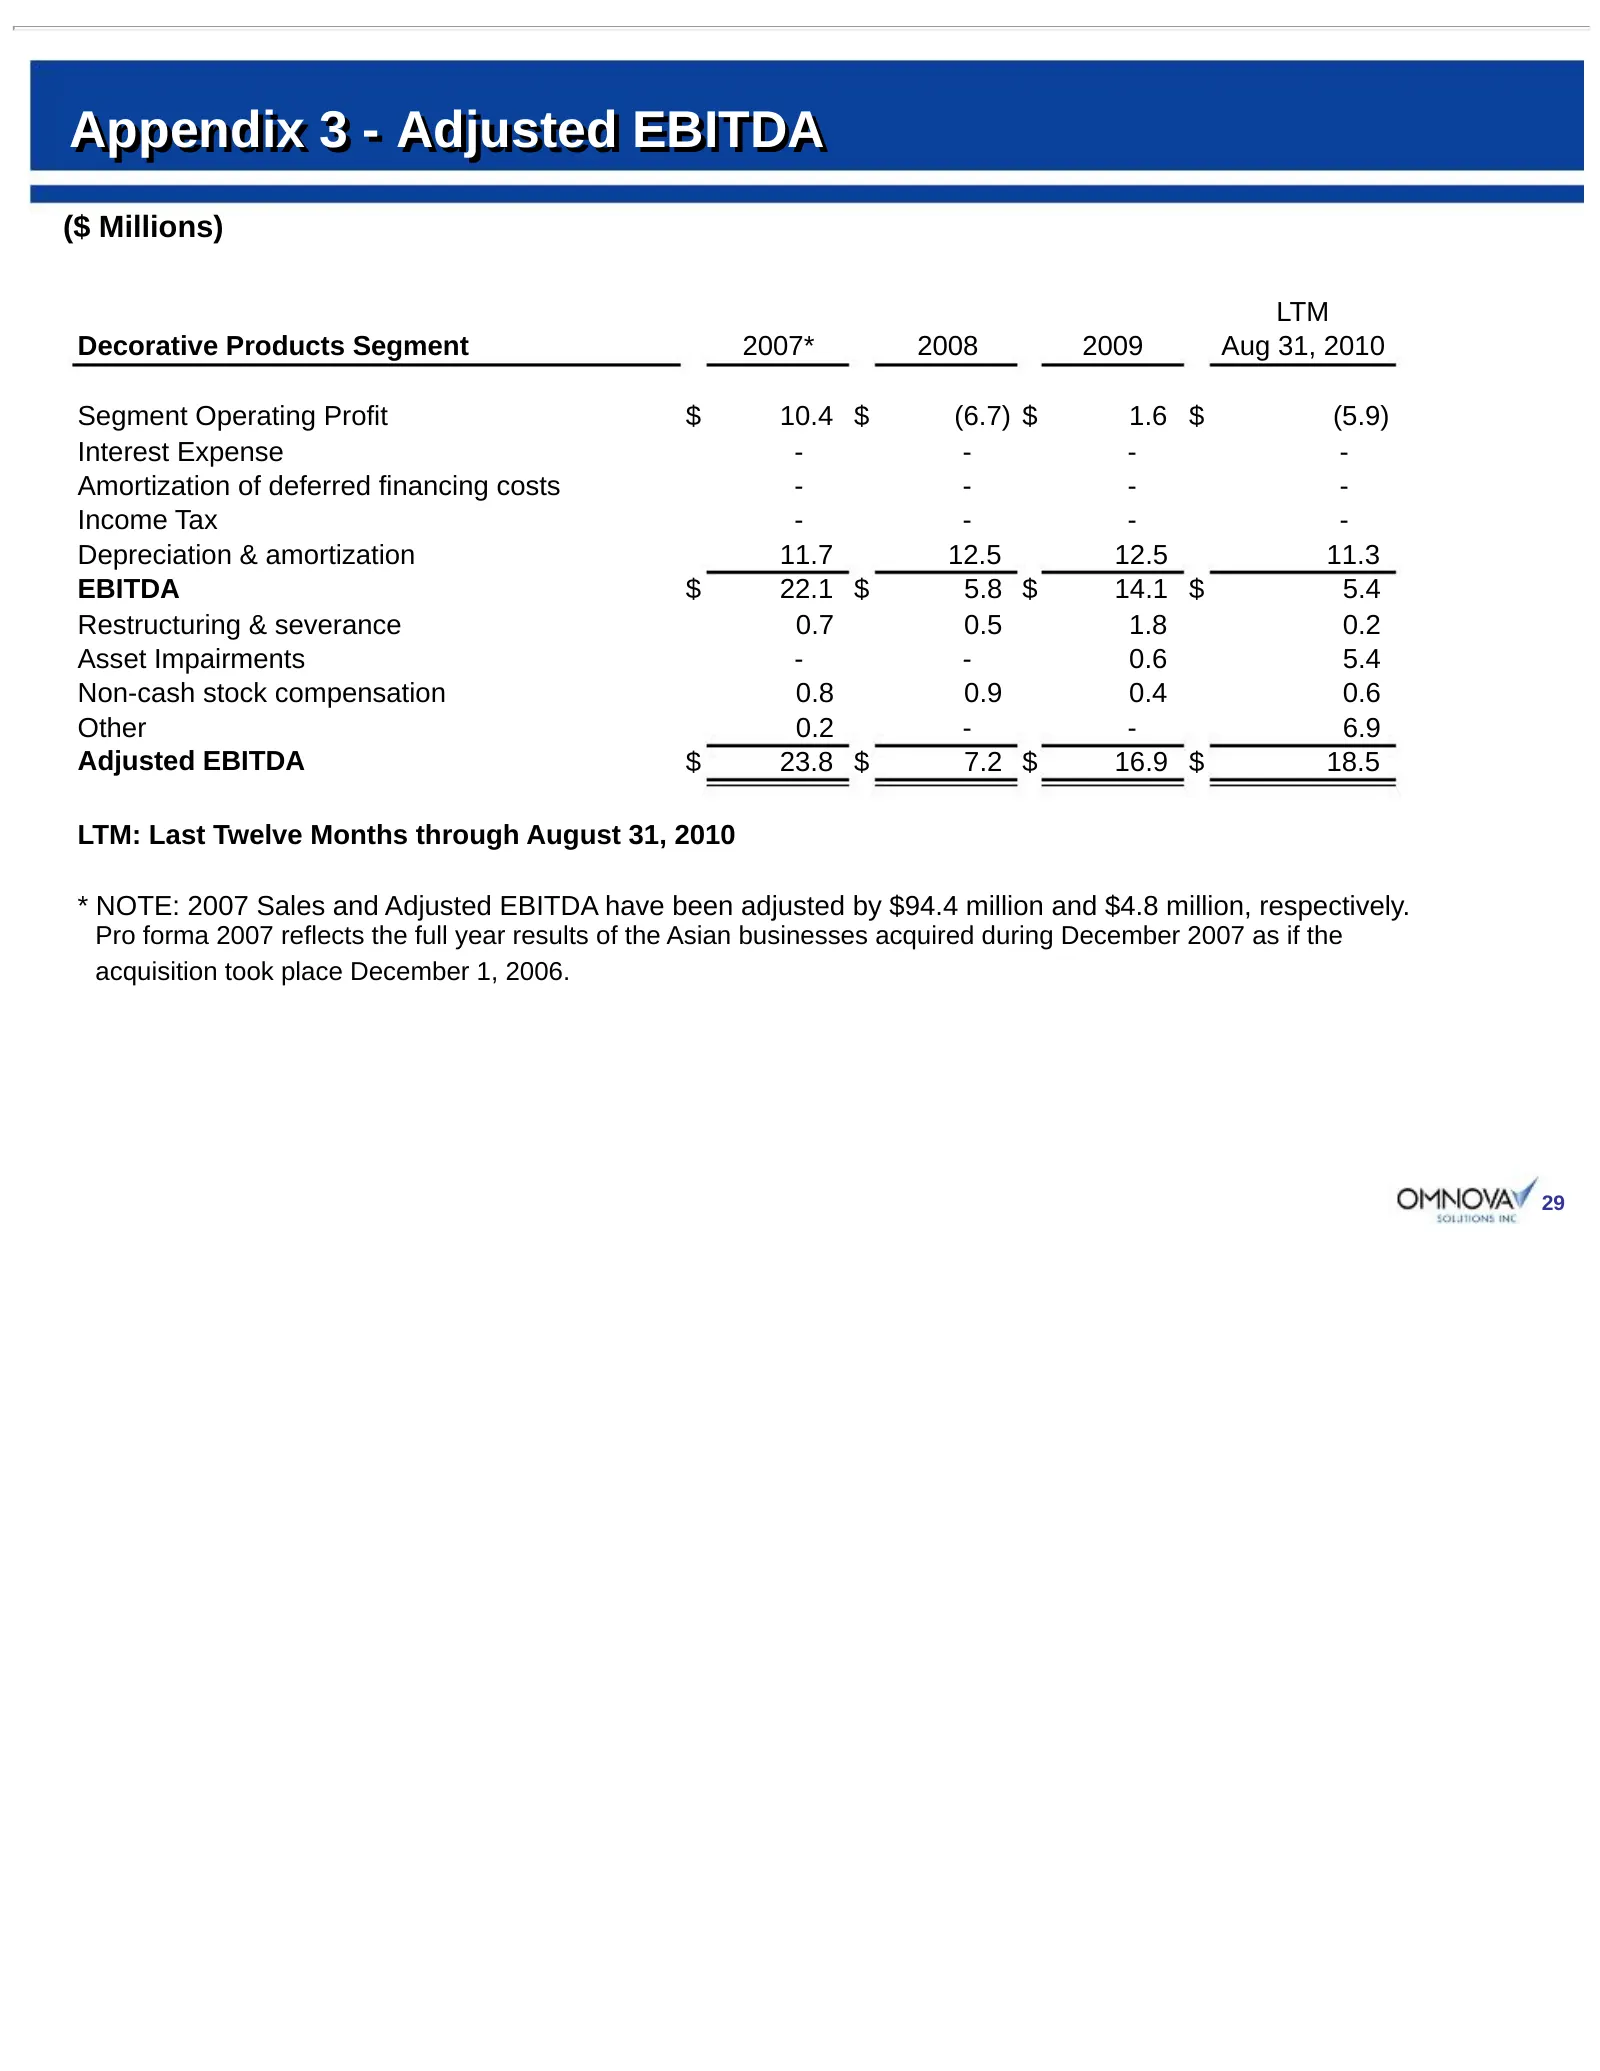
Slide 29: Appendix 3 - Adjusted EBITDA
Appendix 3 - Adjusted EBITDA ($ Millions) LTM Decorative Products Segment 2007* 2008 2009 Aug 31, 2010 Segment Operating Profit $ 10.4 $ (6.7) $ 1.6 $ (5.9) Interest Expense - - - - Amortization of deferred financing costs - - - - Income Tax - - - - Depreciation & amortization 11.7 12.5 12.5 11.3 EB
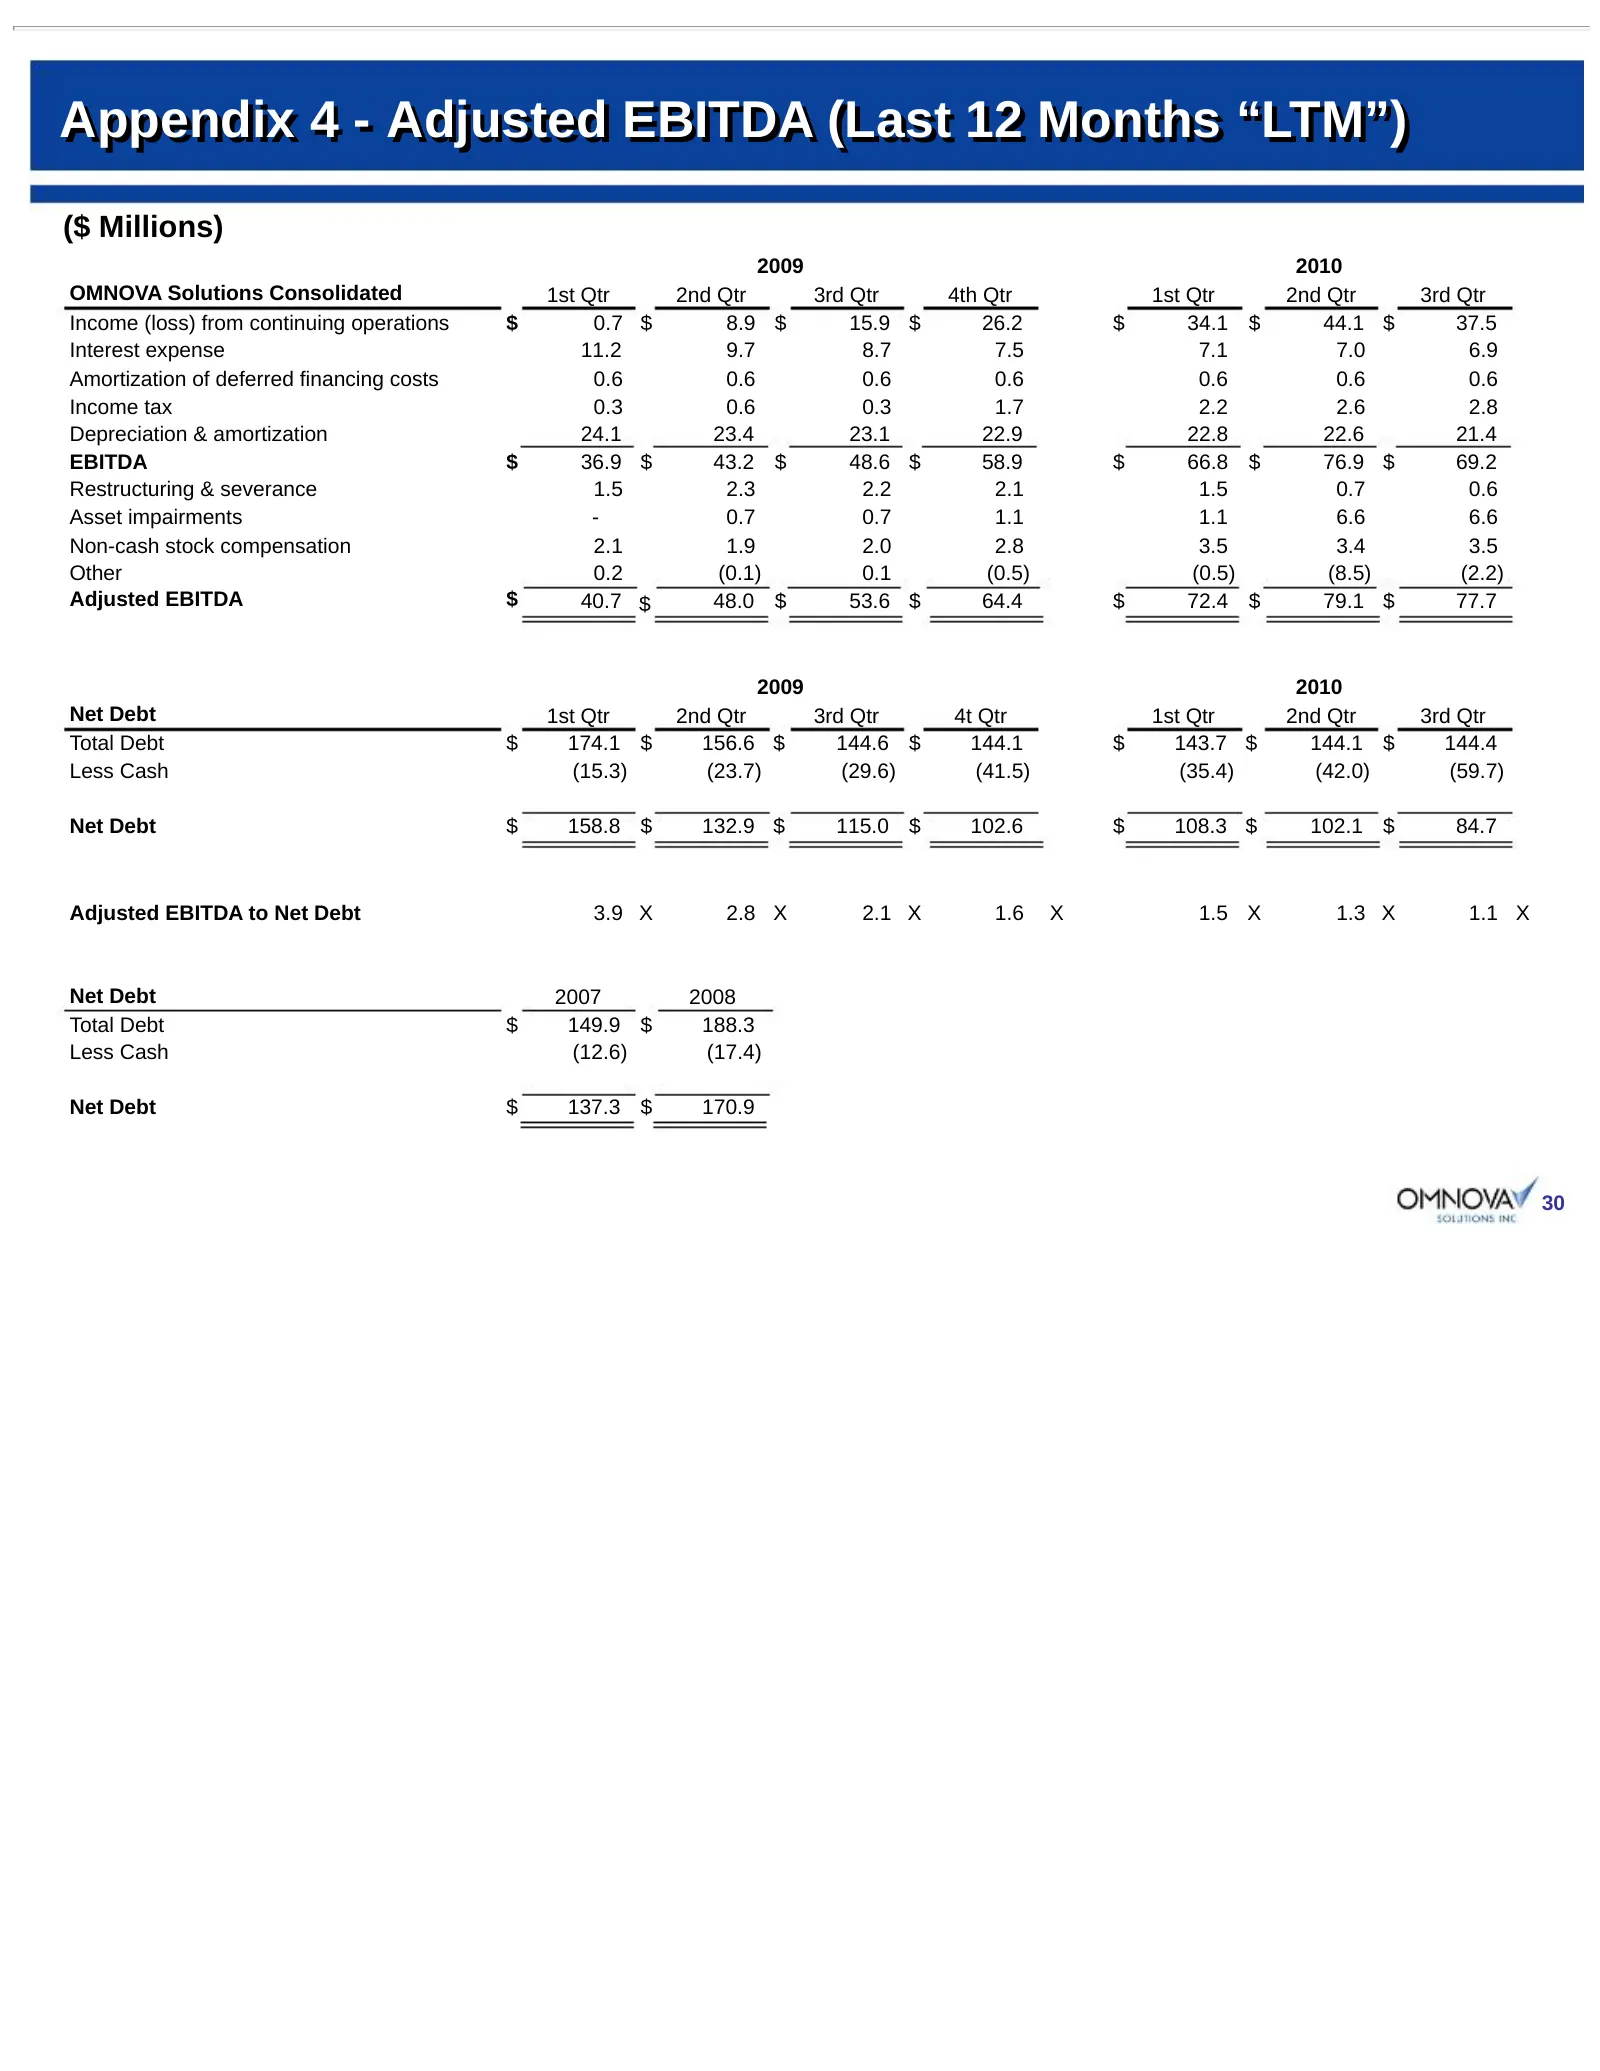
Slide 30: Appendix 4 - Adjusted EBITDA (Last 12 Months)
Appendix 4 - Adjusted EBITDA (Last 12 Months “LTM”) ($ Millions) 2009 2010 OMNOVA Solutions Consolidated 1st Qtr 2nd Qtr 3rd Qtr 4th Qtr 1st Qtr 2nd Qtr 3rd Qtr Income (loss) from continuing operations $ 0.7 $ 8.9 $ 15.9 $ 26.2 $ 34.1 $ 44.1 $ 37.5 Interest expense 11.2 9.7 8.7 7.5 7.1 7.0 6.9 Amort
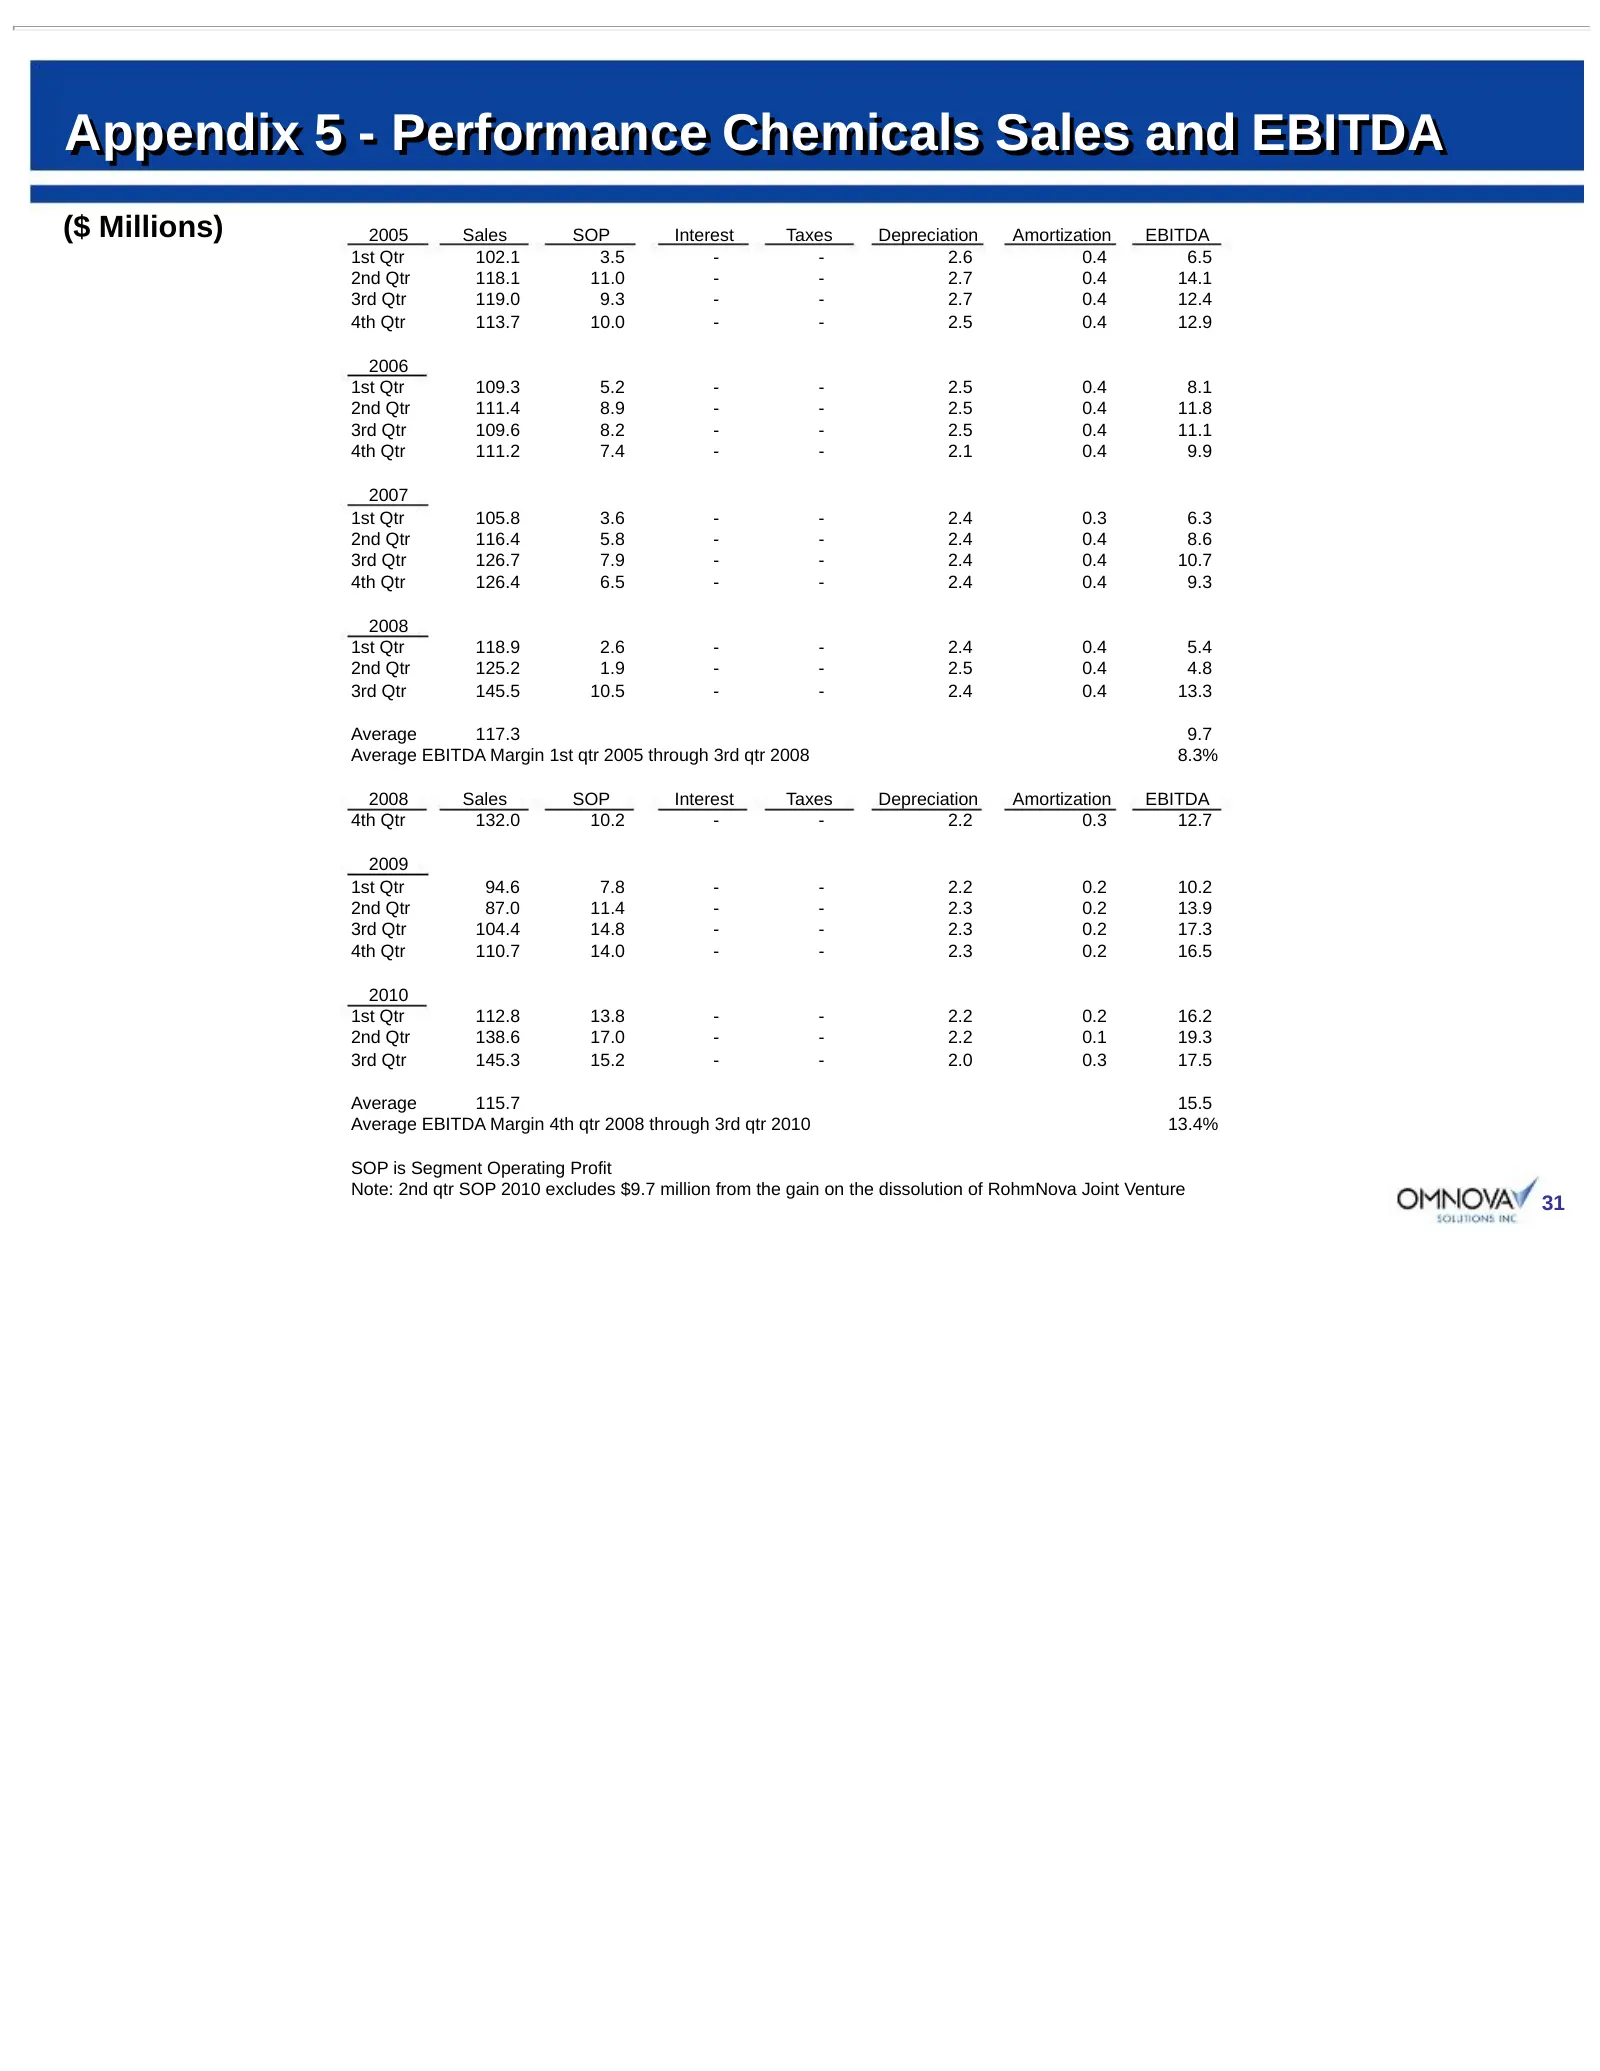
Slide 31: Appendix 5 - Performance Chemicals Sales and EBITDA
Appendix 5 - Performance Chemicals Sales and EBITDA ($ Millions) 2005 Sales SOP Interest Taxes Depreciation Amortization EBITDA 1st Qtr 102.1 3.5 - - 2.6 0.4 6.5 2nd Qtr 118.1 11.0 - - 2.7 0.4 14.1 3rd Qtr 119.0 9.3 - - 2.7 0.4 12.4 4th Qtr 113.7 10.0 - - 2.5 0.4 12.9 2006 1st Qtr 109.3 5.2 - - 2.5
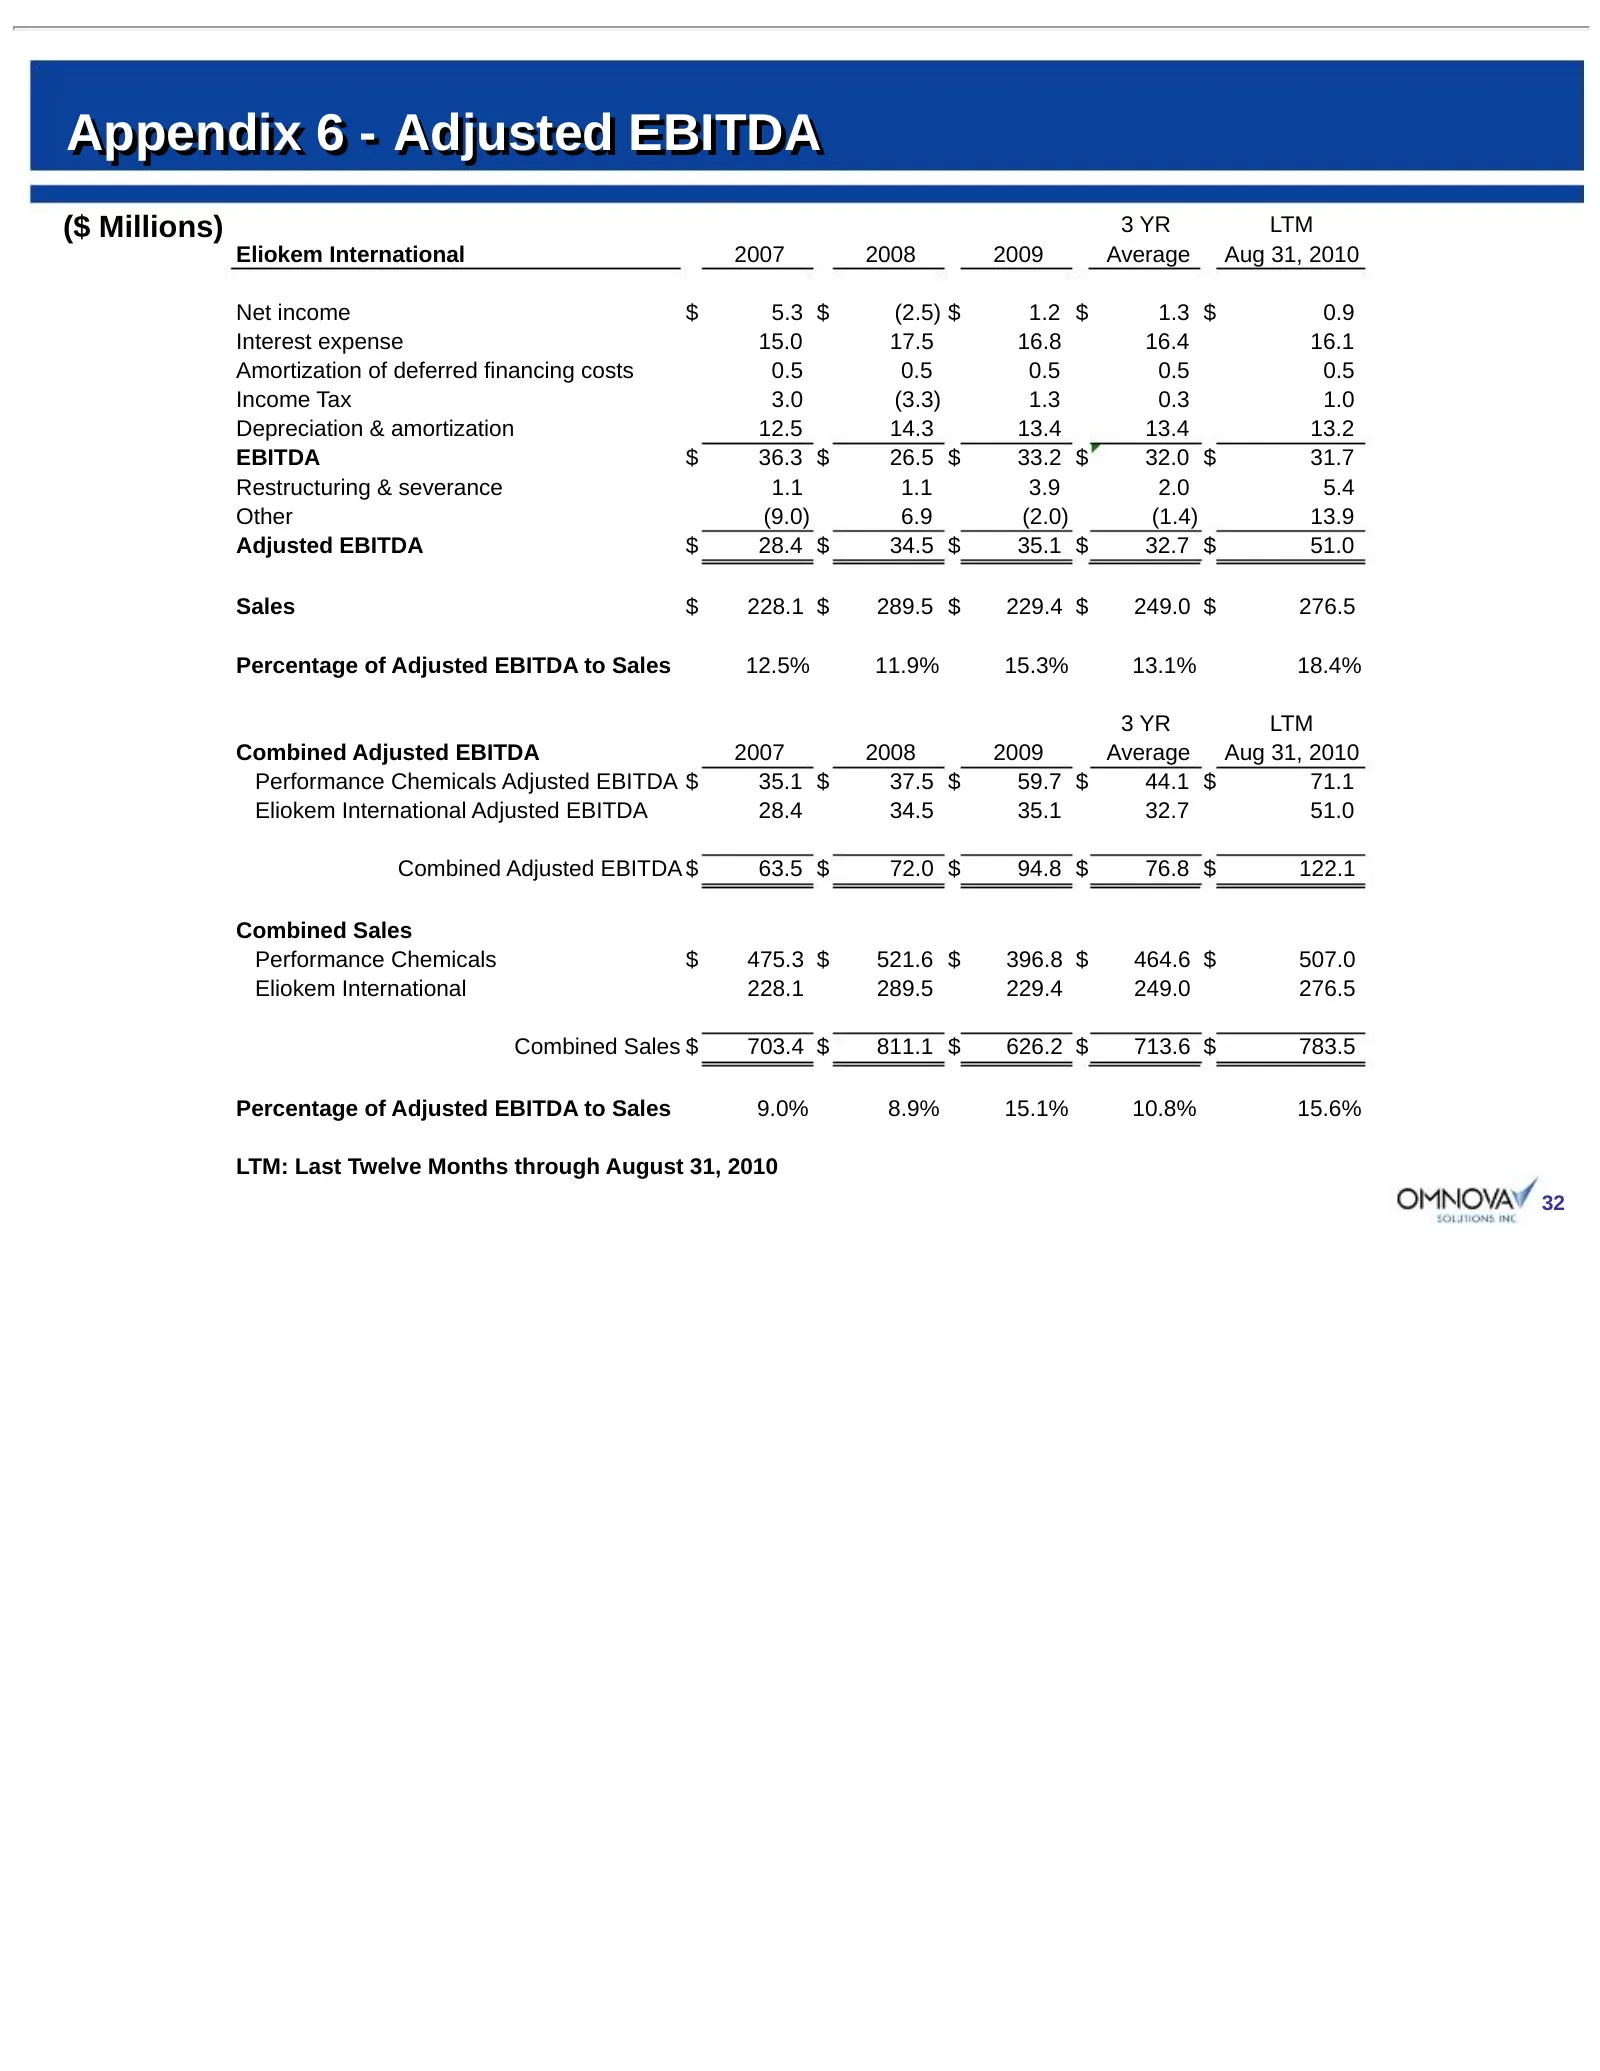
Slide 32: Appendix 6 - Adjusted EBITDA
Appendix 6 - Adjusted EBITDA ($ Millions) 3 YR LTM Eliokem International 2007 2008 2009 Average Aug 31, 2010 Net income $ 5.3 $ (2.5) $ 1.2 $ 1.3 $ 0.9 Interest expense 15.0 17.5 16.8 16.4 16.1 Amortization of deferred financing costs 0.5 0.5 0.5 0.5 0.5 Income Tax 3.0 (3.3) 1.3 0.3 1.0 Depreciation
Slide 33: OMNOVA Solutions Inc.
OMNOVAW SOLUTIONS INC.
Source: SEC EDGAR · 8-K filed Oct 6, 2010
More decks from OMNOVA Solutions Inc
 Merger or Acquisition (July 2019)24 slides · Jul 3, 2019
 Q1 2019 Earnings Presentation32 slides · Mar 27, 2019
 Investor Presentation (February 2019)34 slides · Feb 22, 2019
 Q3 2018 Earnings Presentation32 slides · Sep 26, 2018
 Investor Presentation (July 2018)32 slides · Jul 20, 2018
 Investor Presentation (April 2018)32 slides · Apr 11, 2018