Chaparral Energy — Wells Fargo conference December 2014
53 slides from Chaparral Energy's conference presentation, Dec 9, 2014
Slide 1: Chaparral Wells Fargo December 2014
Chaparral Wells Fargo December 2014
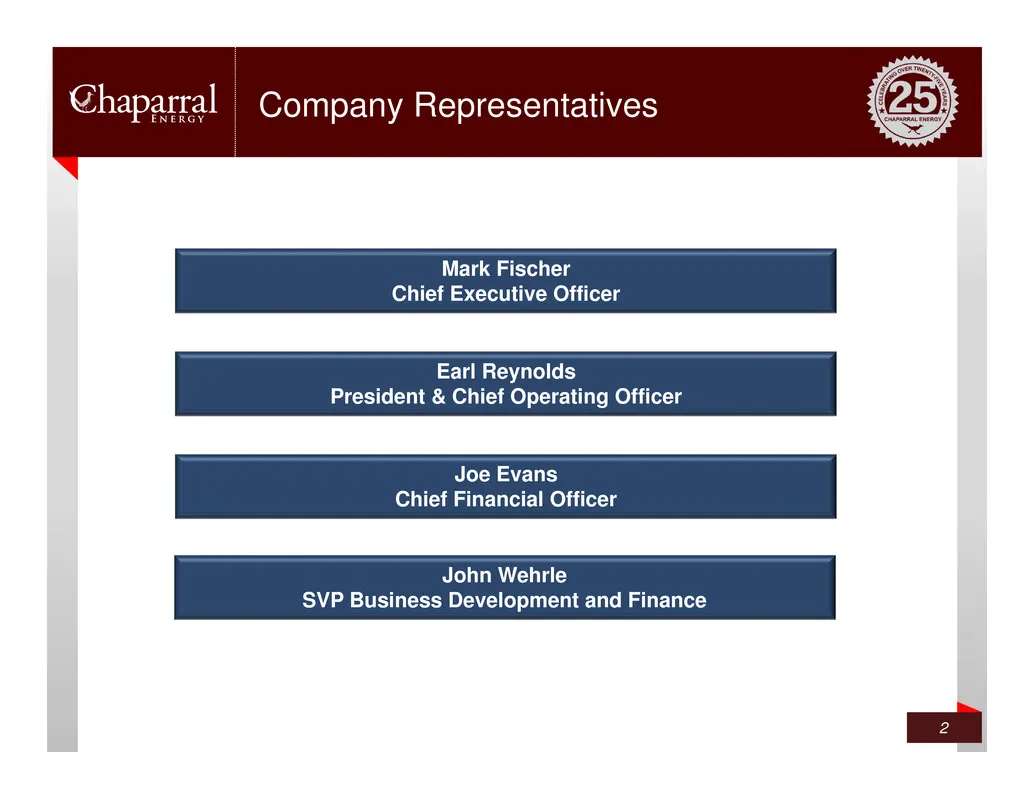
Slide 2: Company Representatives
Company Representatives 2 Mark Fischer Chief Executive Officer Earl Reynolds President & Chief Operating Officer Joe Evans Chief Financial Officer John Wehrle SVP Business Development and Finance
Slide 3: Forward-Looking Statements
This presentation contains "forward-looking statements" within the meaning of Section 27A of the Securities Act of 1933, as amended, and Section 21E of the Securities Exchange Act of 1934, as amended. These forward-looking statements are subject to certain risks, trends and uncertainties that could
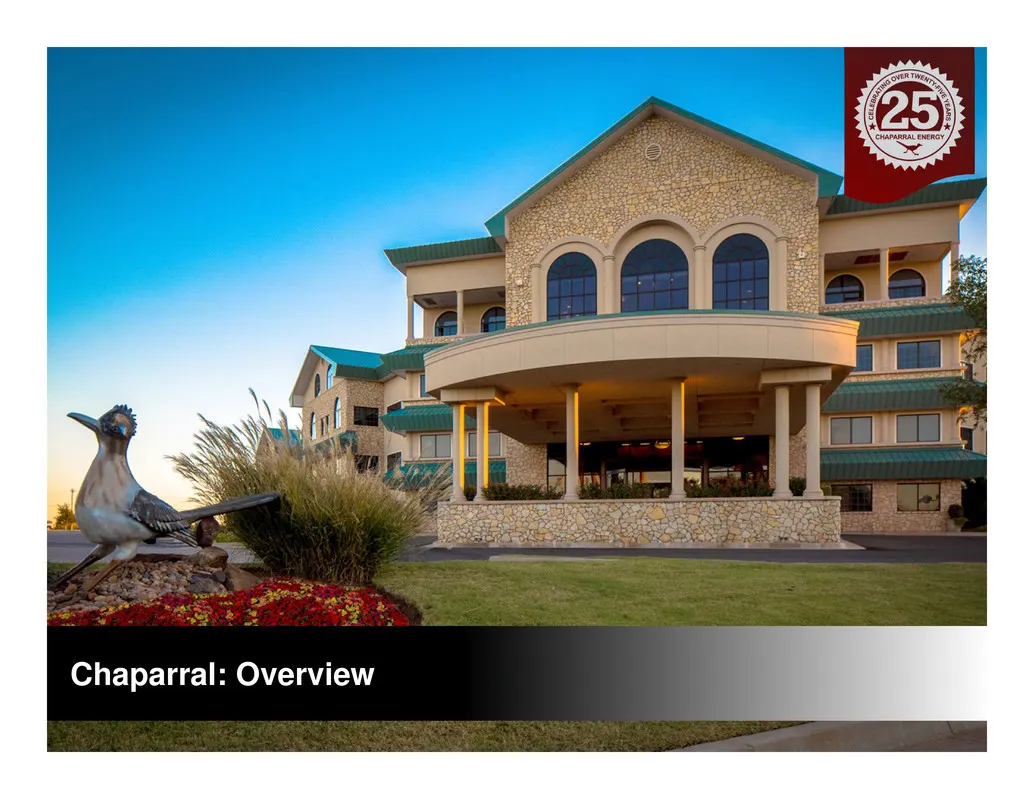
Slide 4: Chaparral: Overview
Chaparral: Overview
Slide 5: 2014 3Q Highlights
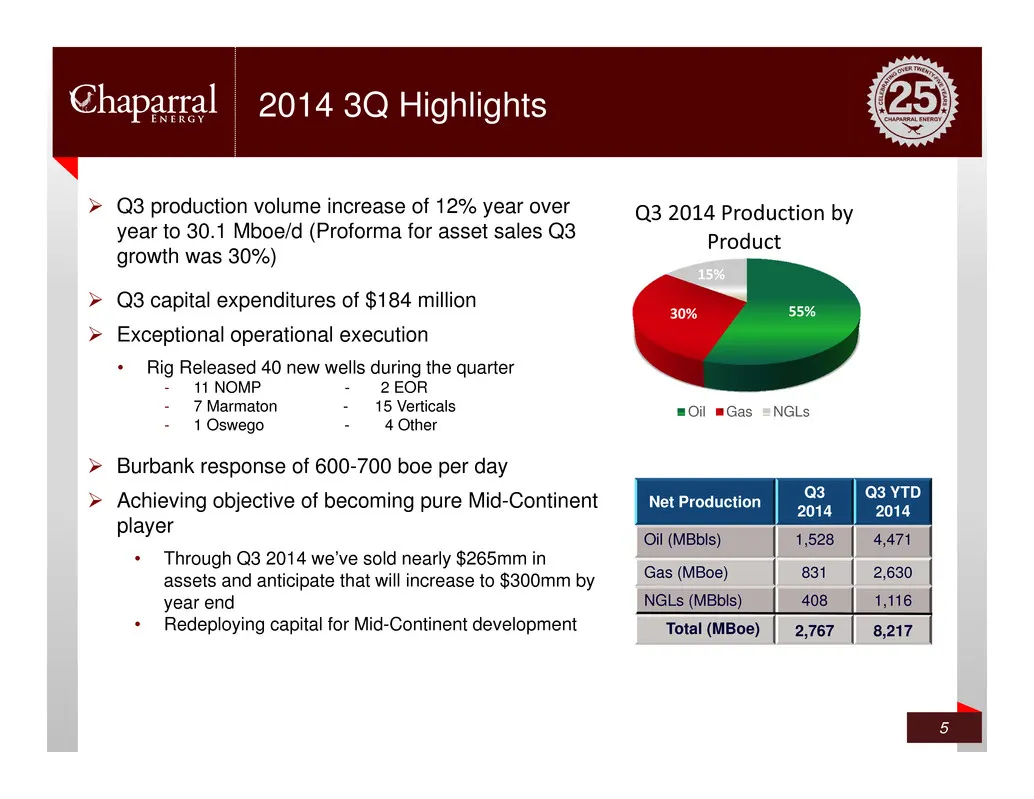
2014 3Q Highlights 5 55%30% 15% Q3 2014 Production by Product Oil Gas NGLs Net Production Q3 2014 Q3 YTD 2014 Oil (MBbls) 1,528 4,471 Gas (MBoe) 831 2,630 NGLs (MBbls) 408 1,116 Total (MBoe) 2,767 8,217 Q3 production volume increase of 12% year over year to 30.1 Mboe/d (Proforma for asset sales Q3
Slide 6: Strong Track Record of Growth
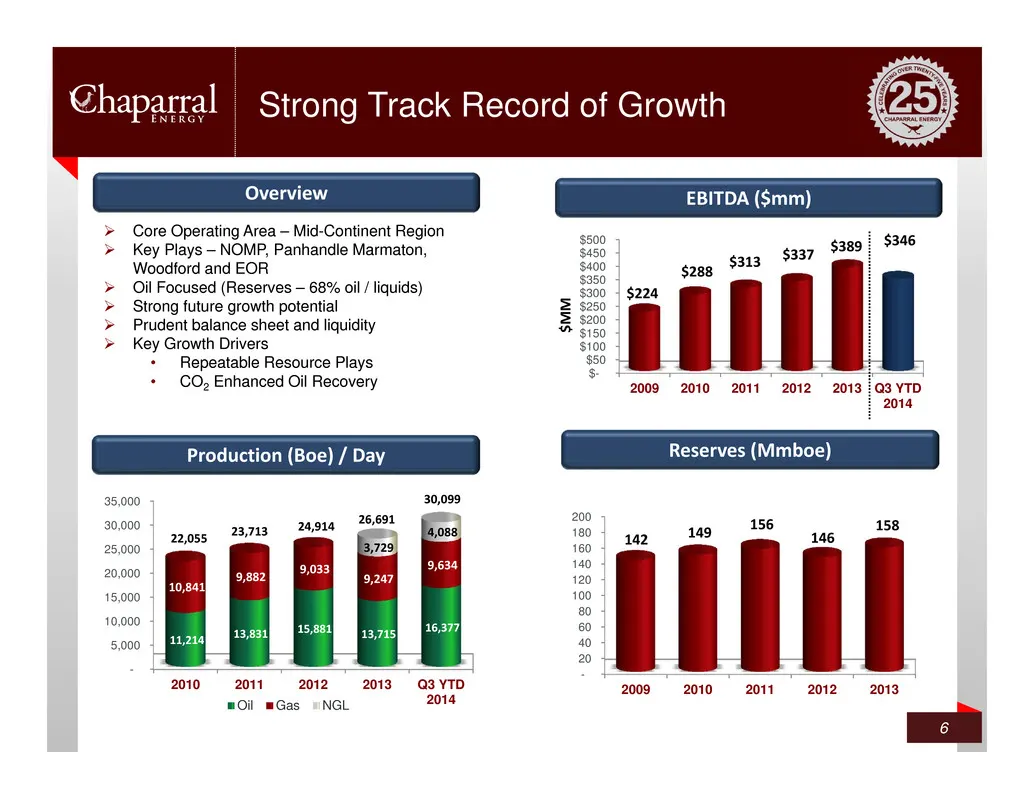
Strong Track Record of Growth 6 Production (Boe) / Day EBITDA ($mm) Reserves (Mmboe) $- $50 $100 $150 $200 $250 $300 $350 $400 $450 $500 2009 2010 2011 2012 2013 Q3 YTD 2014 $224 $288 $313 $337 $389 $346 $ M M - 20 40 60 80 100 120 140 160 180 200 2009 2010 2011 2012 2013 142 149 156 146 158 Overvie
Slide 7: Our Position
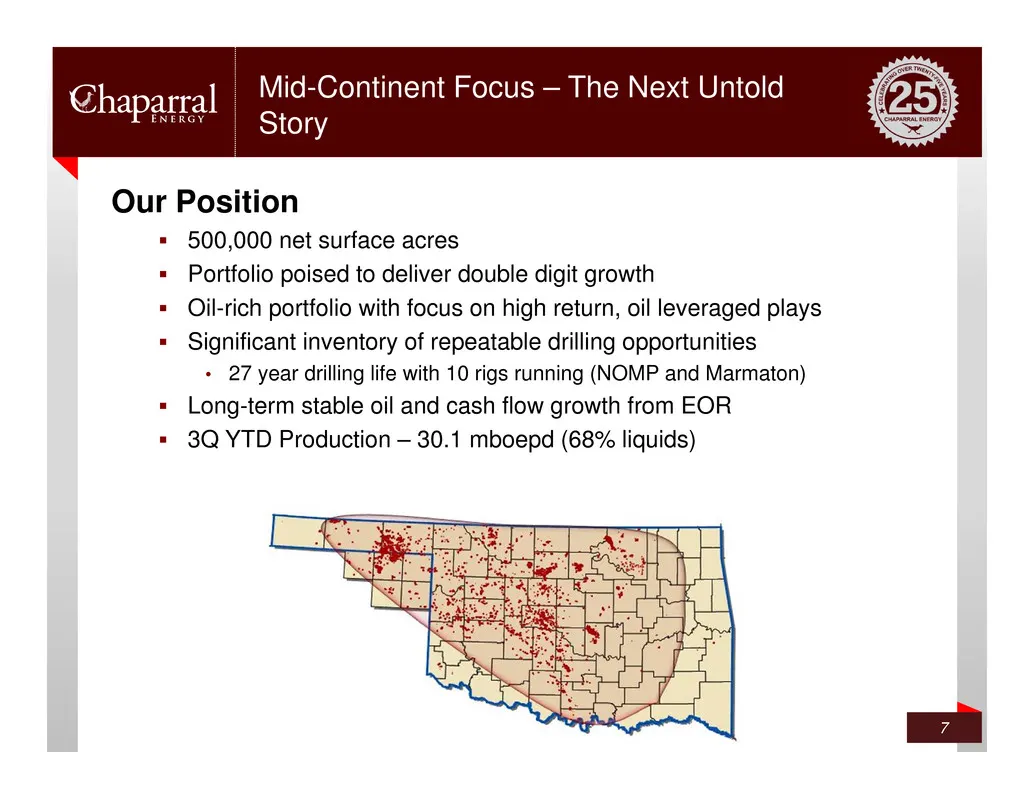
Our Position 500,000 net surface acres Portfolio poised to deliver double digit growth Oil-rich portfolio with focus on high return, oil leveraged plays Significant inventory of repeatable drilling opportunities • 27 year drilling life with 10 rigs running (NOMP and Marmaton) Long-term sta
Slide 8: Why Mid-Continent - Mid-Continent Advantages
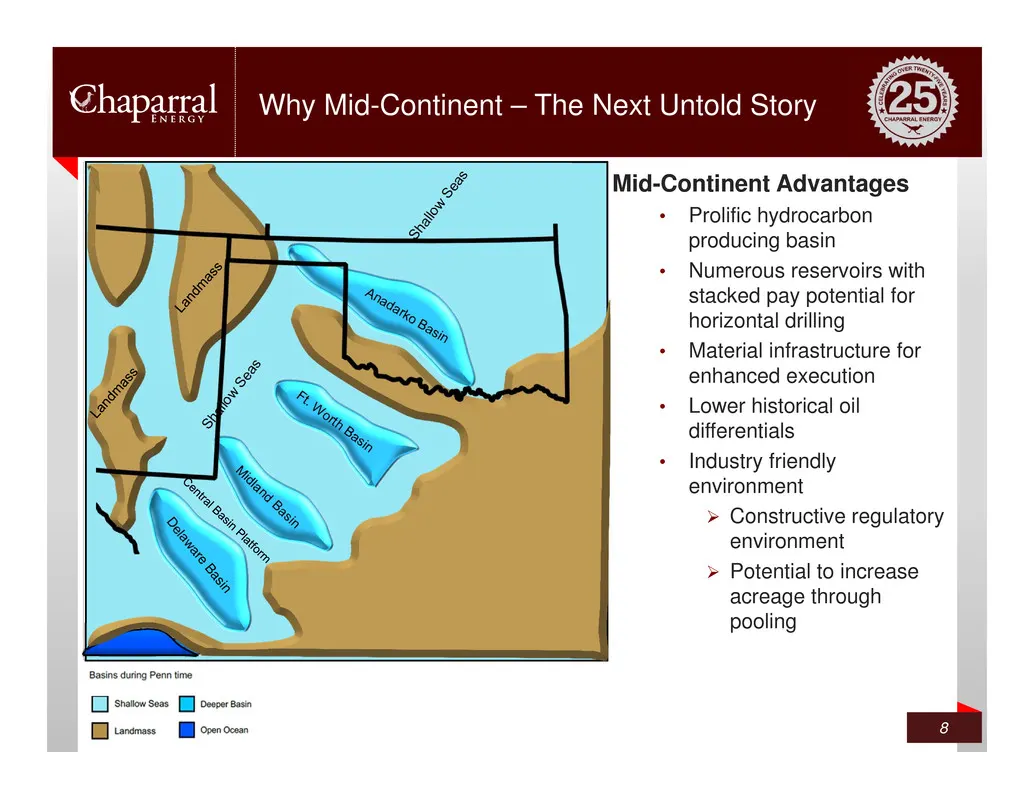
Mid-Continent Advantages • Prolific hydrocarbon producing basin • Numerous reservoirs with stacked pay potential for horizontal drilling • Material infrastructure for enhanced execution • Lower historical oil differentials • Industry friendly environment Constructive regulatory environment Poten
Slide 9: Leader Among Mid-Continent Peers in Oil Production
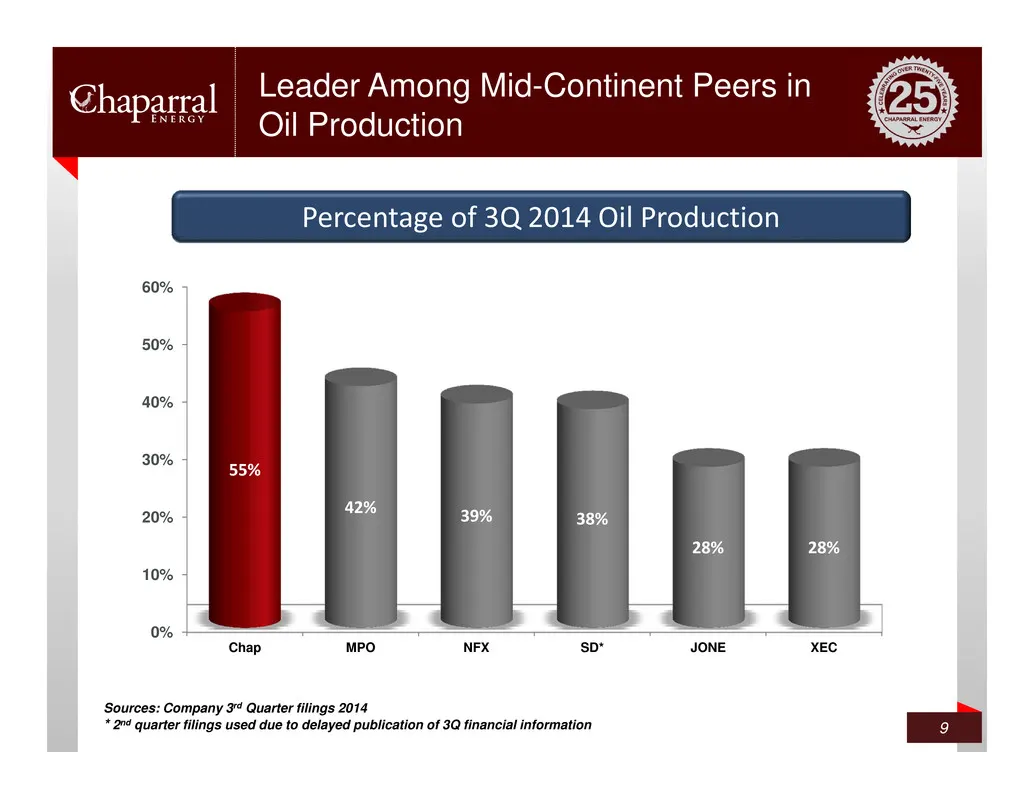
Leader Among Mid-Continent Peers in Oil Production 9 Percentage of 3Q 2014 Oil Production $300 0% 10% 20% 30% 40% 50% 60% Chap MPO NFX SD* JONE XEC 55% 42% 39% 38% 28% 28% Sources: Company 3rd Quarter filings 2014 * 2nd quarter filings used due to delayed publication of 3Q financial information
Slide 10: Long Reserve Life Index and Deep Drilling Inventory
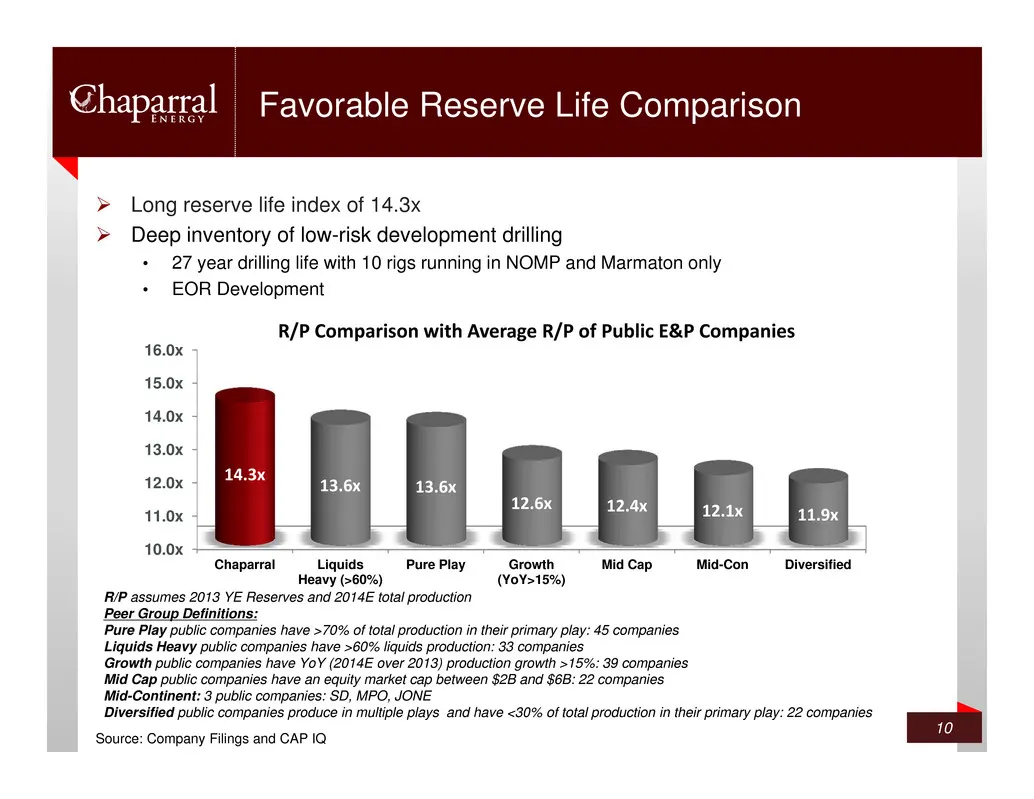
Long reserve life index of 14.3x Deep inventory of low-risk development drilling • 27 year drilling life with 10 rigs running in NOMP and Marmaton only • EOR Development Favorable Reserve Life Comparison 10 R/P assumes 2013 YE Reserves and 2014E total production Peer Group Definitions: Pure Play
Slide 11: High Netbacks and All-in Returns are Key Focus
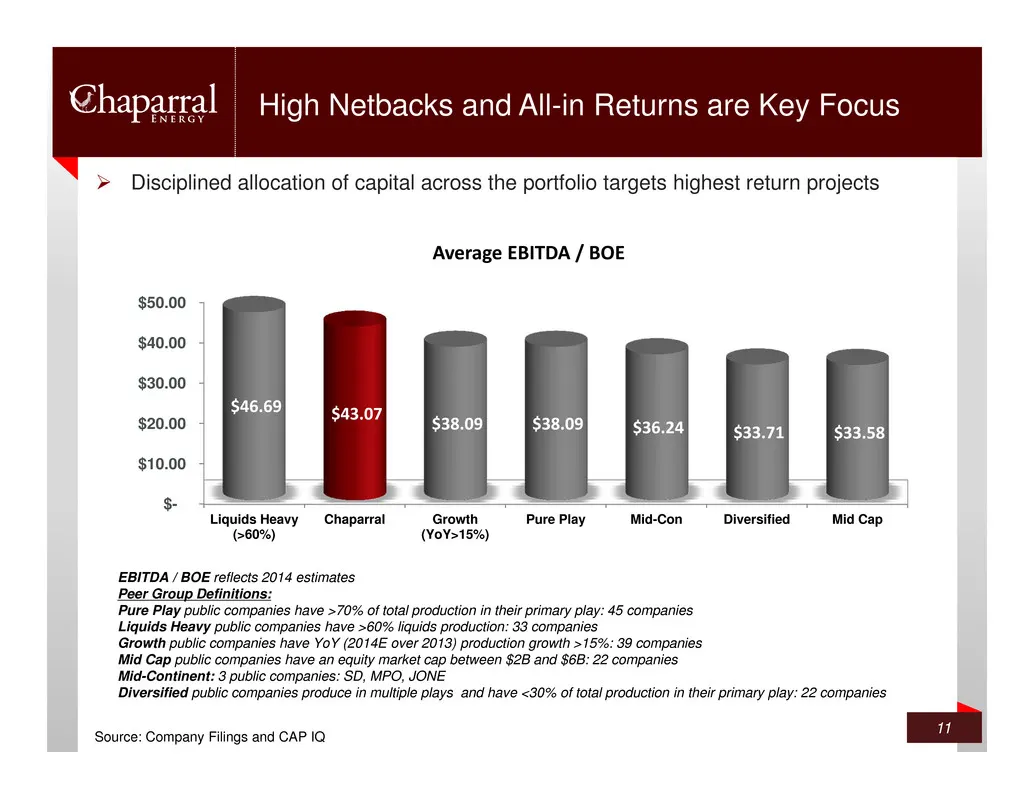
Disciplined allocation of capital across the portfolio targets highest return projects High Netbacks and All-in Returns are Key Focus 11 EBITDA / BOE reflects 2014 estimates Peer Group Definitions: Pure Play public companies have >70% of total production in their primary play: 45 companies Liquids
Slide 12: Low PDP Decline Rate
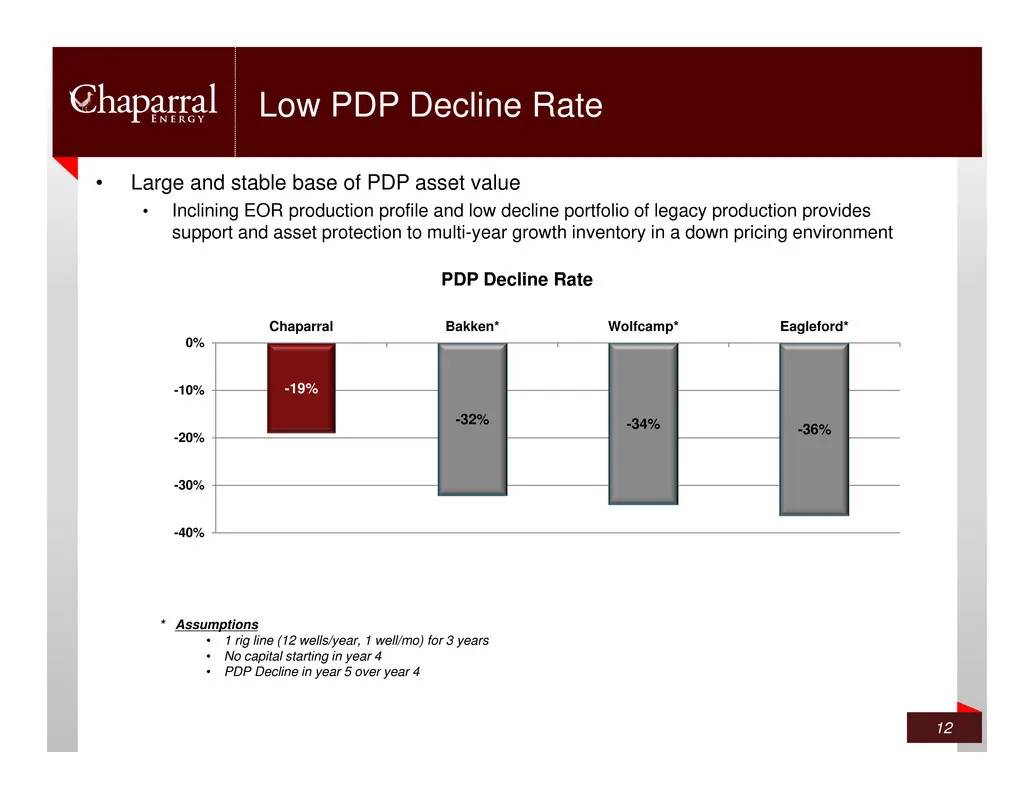
• Large and stable base of PDP asset value • Inclining EOR production profile and low decline portfolio of legacy production provides support and asset protection to multi-year growth inventory in a down pricing environment Low PDP Decline Rate 12 -19% -32% -34% -36% -40% -30% -20% -10% 0% Chaparral
Slide 13: Core Plays
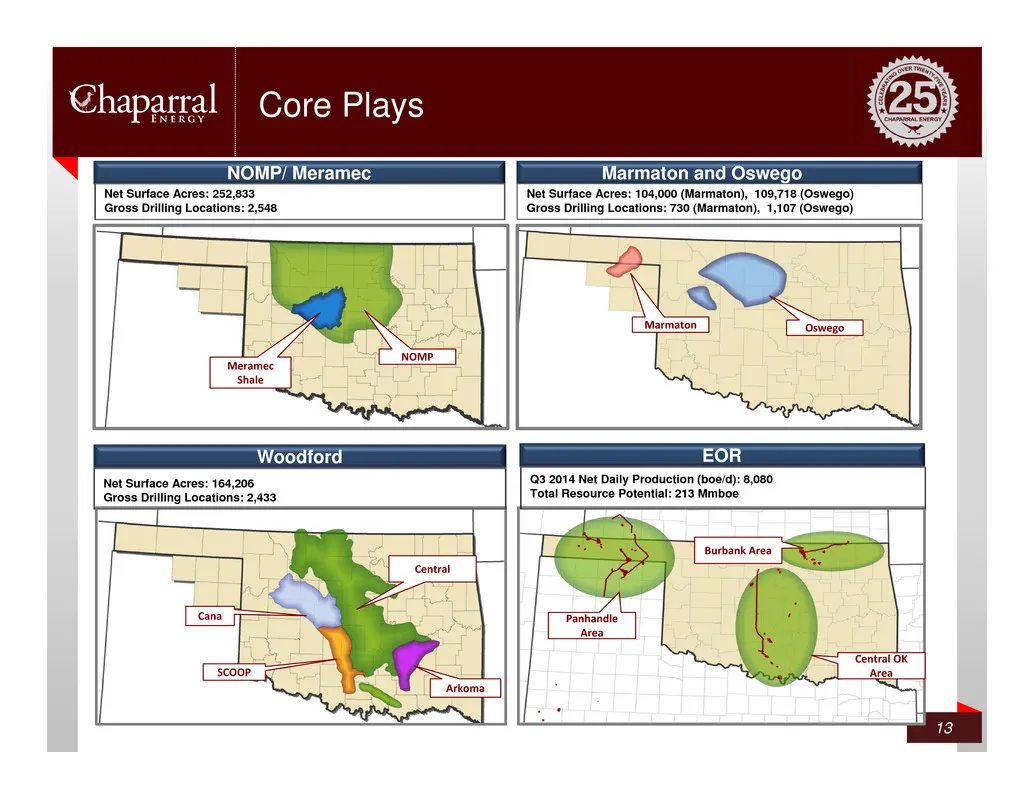
NOMP/ Meramec Marmaton and Oswego Core Plays Net Surface Acres: 252,833 Gross Drilling Locations: 2,548 Net Surface Acres: 104,000 (Marmaton), 109,718 (Oswego) Gross Drilling Locations: 730 (Marmaton), 1,107 (Oswego) 13 Woodford Net Surface Acres: 164,206 Gross Drilling Locations: 2,433 Cana SCOOP A
Slide 14: Stacked High Quality Oil Plays
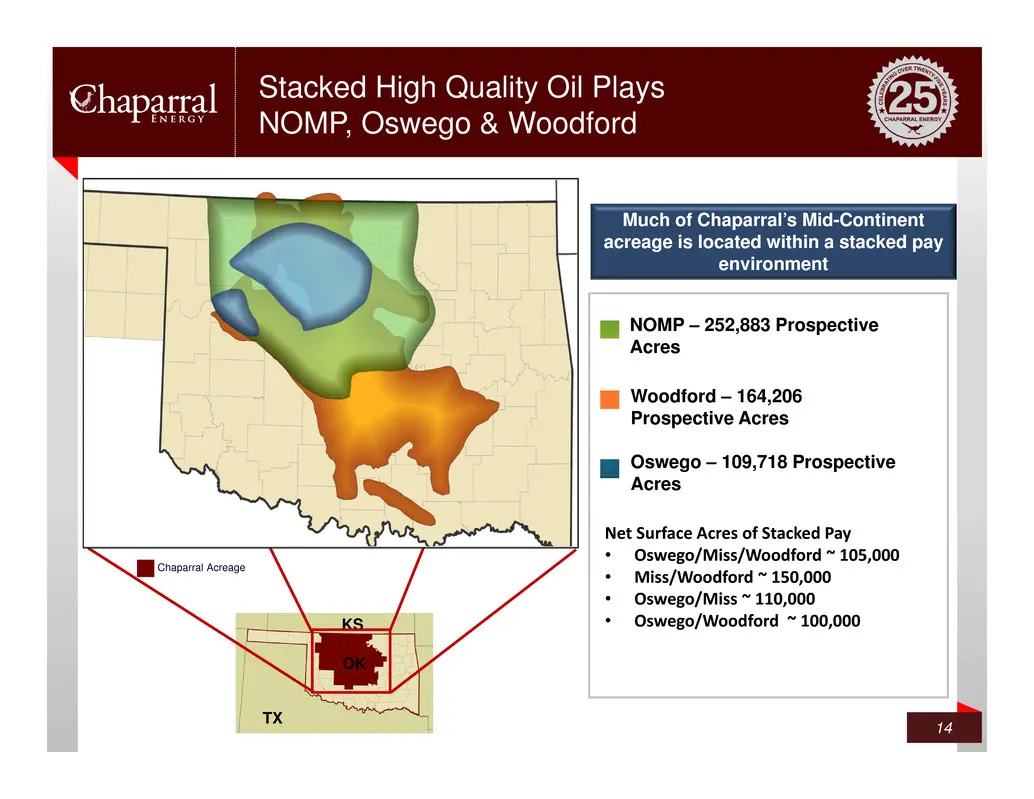
Stacked High Quality Oil Plays NOMP, Oswego & Woodford 14 OK TX KS Chaparral Acreage Much of Chaparral’s Mid-Continent acreage is located within a stacked pay environment NOMP – 252,883 Prospective Acres Woodford – 164,206 Prospective Acres Oswego – 109,718 Prospective Acres Net Surface Acres of Sta
Slide 15: Multiple Mid-Continent Pay Zones
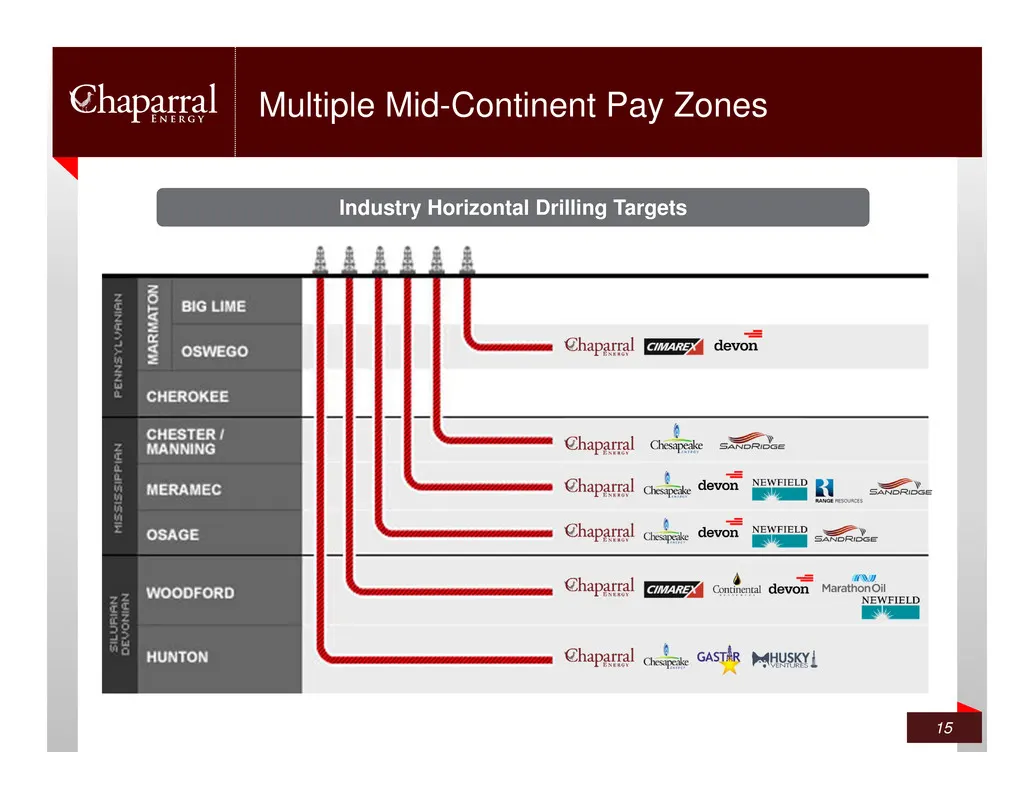
Multiple Mid-Continent Pay Zones 15 Industry Horizontal Drilling Targets
Slide 16: Horizontal Drilling Inventory and Play Resource Potential
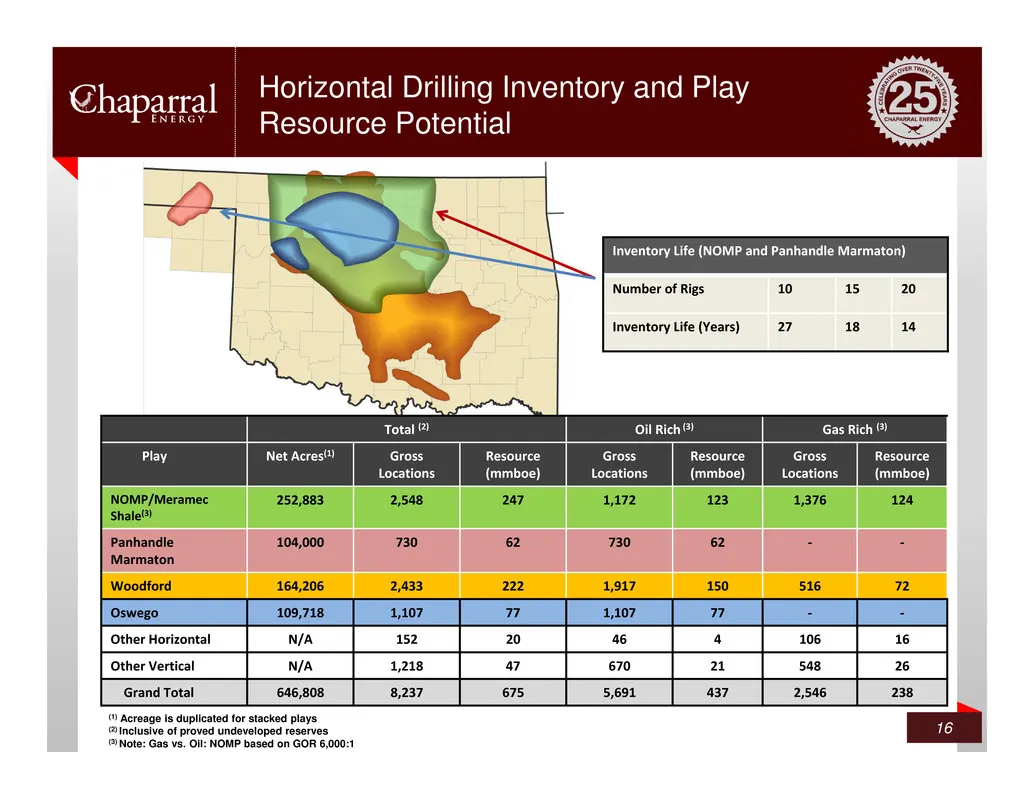
Horizontal Drilling Inventory and Play Resource Potential 16 Total (2) Oil Rich (3) Gas Rich (3) Play Net Acres(1) Gross Locations Resource (mmboe) Gross Locations Resource (mmboe) Gross Locations Resource (mmboe) NOMP/Meramec Shale(3) 252,883 2,548 247 1,172 123 1,376 124 Panhandle Marmaton 104,000
Slide 17: Capital Budget
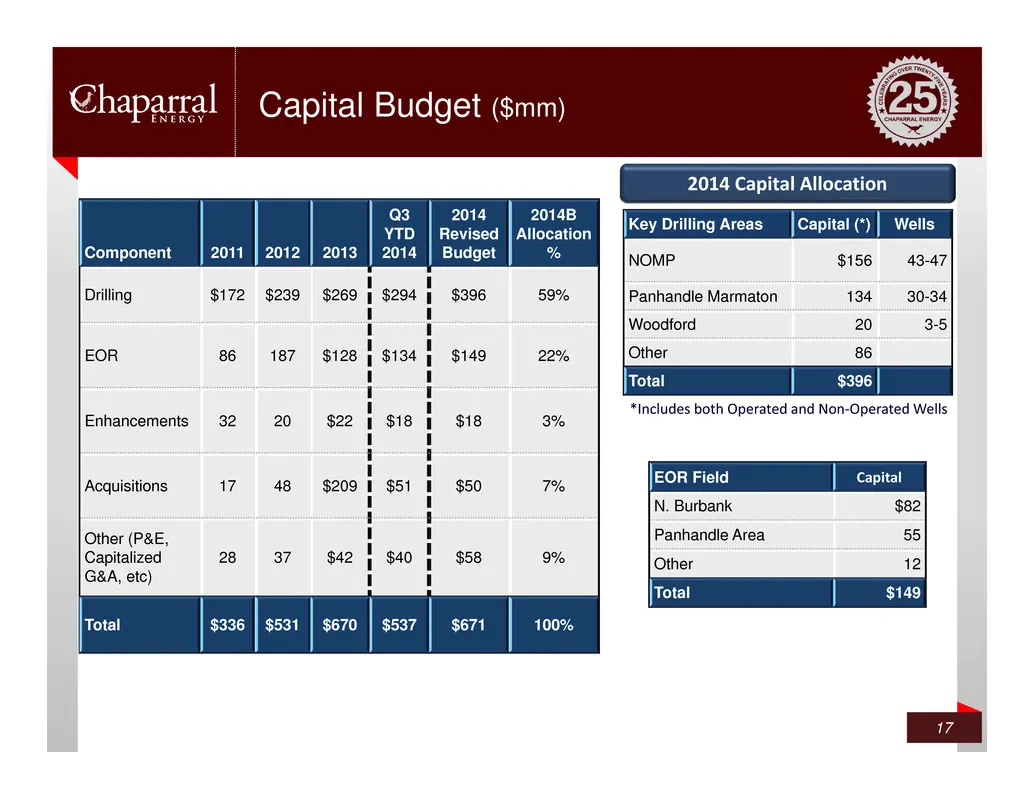
Capital Budget ($mm) 17 Component 2011 2012 2013 Q3 YTD 2014 2014 Revised Budget 2014B Allocation % Drilling $172 $239 $269 $294 $396 59% EOR 86 187 $128 $134 $149 22% Enhancements 32 20 $22 $18 $18 3% Acquisitions 17 48 $209 $51 $50 7% Other (P&E, Capitalized G&A, etc) 28 37 $42 $40 $58 9% Total $3
Slide 18: Expected Returns in our Core Areas
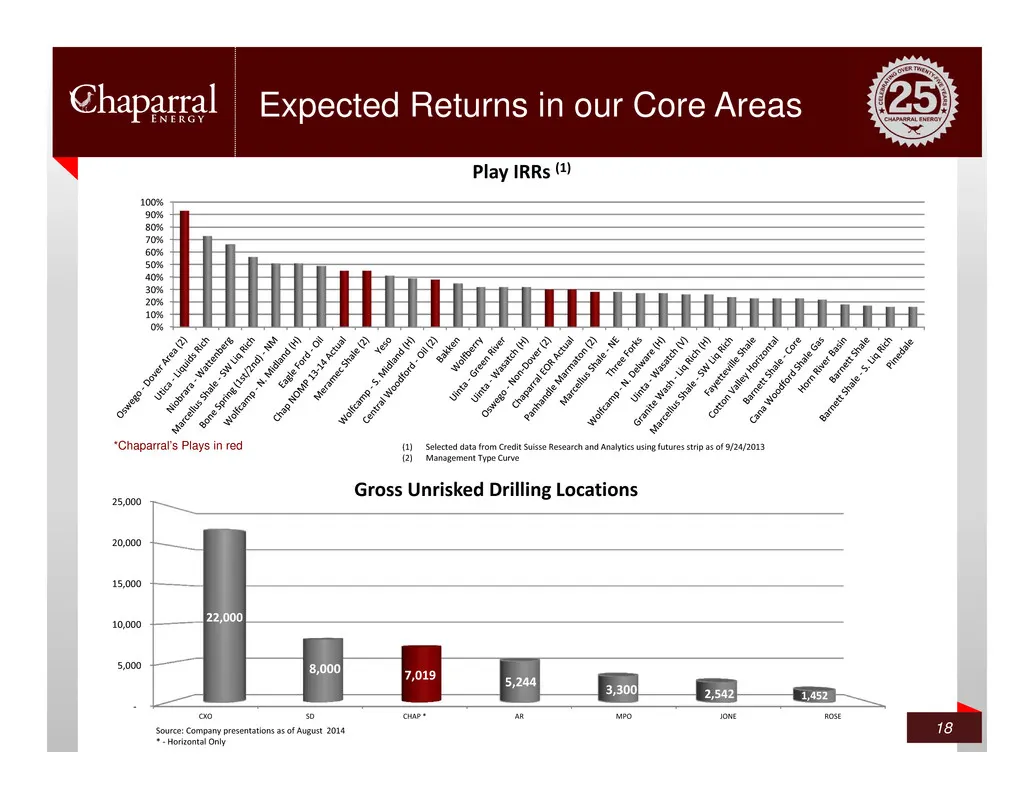
Expected Returns in our Core Areas 18 0% 10% 20% 30% 40% 50% 60% 70% 80% 90% 100% Play IRRs (1) ‐ 5,000 10,000 15,000 20,000 25,000 CXO SD CHAP * AR MPO JONE ROSE 22,000 8,000 7,019 5,244 3,300 2,542 1,452 Gross Unrisked Drilling Locations *Chaparral’s Plays in red (1) Selected data from Credit Suis
Slide 19: Over 1 BBOE Reserve and Inventory Upside Potential
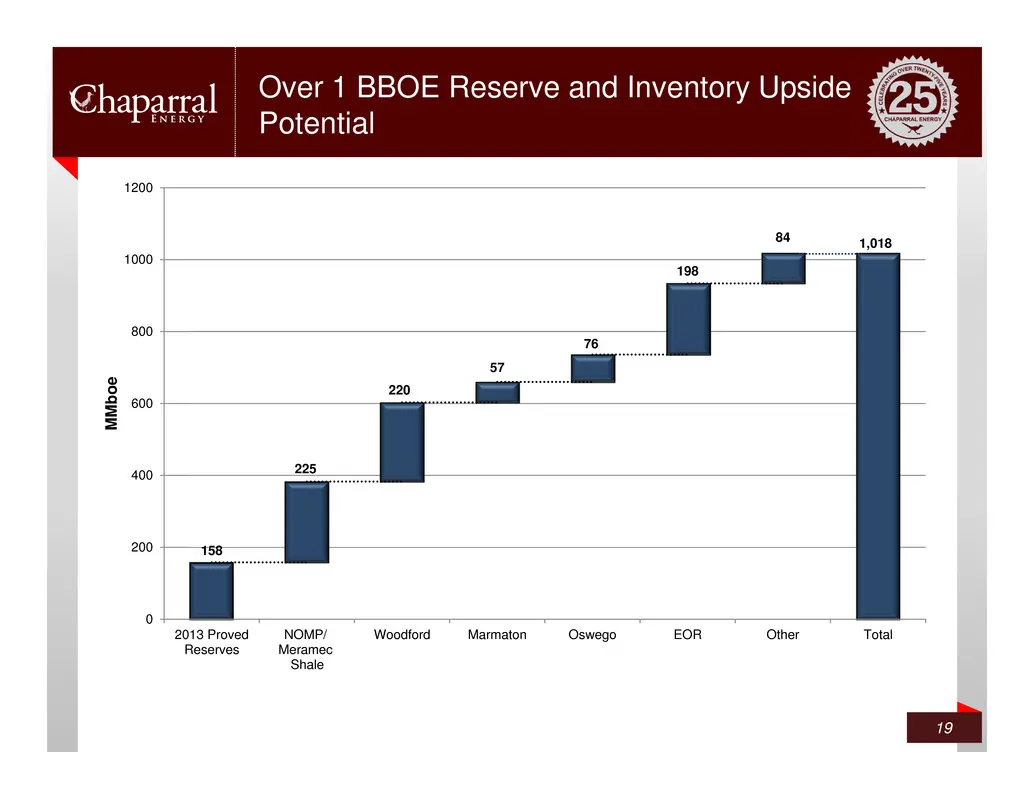
158 225 220 57 76 198 84 1,018 0 200 400 600 800 1000 1200 2013 Proved Reserves NOMP/ Meramec Shale Woodford Marmaton Oswego EOR Other Total M M b o e Over 1 BBOE Reserve and Inventory Upside Potential 19
Slide 20: NOMP Resource Potential
NOMP Resource Potential
Slide 21: Northern Oklahoma Mississippi Play (NOMP)
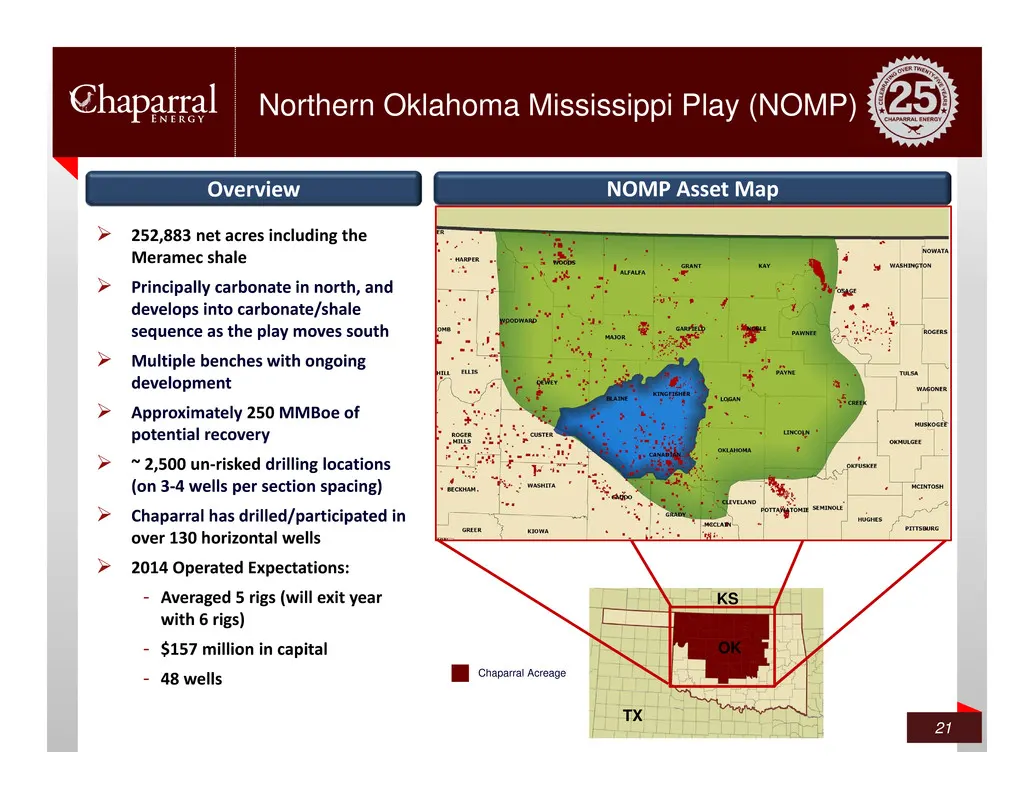
Northern Oklahoma Mississippi Play (NOMP) 21 252,883 net acres including the Meramec shale Principally carbonate in north, and develops into carbonate/shale sequence as the play moves south Multiple benches with ongoing development Approximately 250 MMBoe of potential recovery ~ 2,500 un‐r
Slide 22: NOMP Carbonate Economics
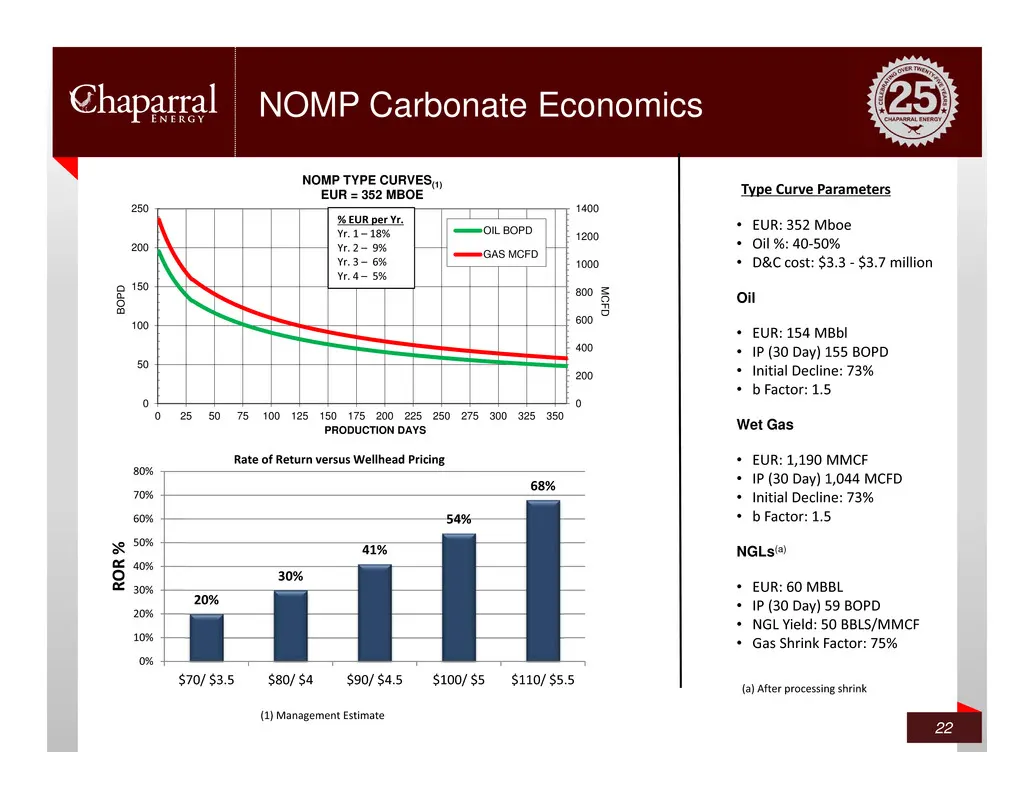
NOMP Carbonate Economics 22 • EUR: 352 Mboe • Oil %: 40‐50% • D&C cost: $3.3 ‐ $3.7 million Oil • EUR: 154 MBbl • IP (30 Day) 155 BOPD • Initial Decline: 73% • b Factor: 1.5 Wet Gas • EUR: 1,190 MMCF • IP (30 Day) 1,044 MCFD • Initial Decline: 73% • b Factor: 1.5 NGLs(a) • EUR: 60 MBBL • IP (30 Day)
Slide 23: NOMP/Meramec Well Performance
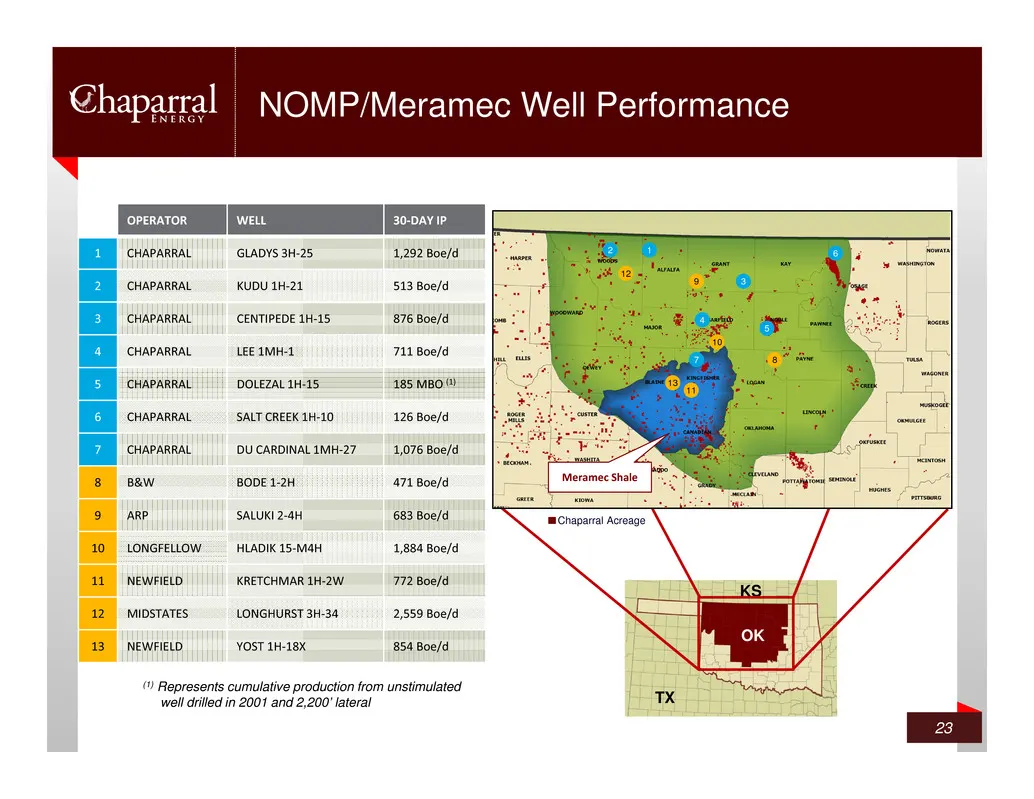
NOMP/Meramec Well Performance 23 OK TX KS 12 3 4 9 8 5 6 10 11 12 13 7 12 3 4 9 8 5 6 10 11 12 13 7 Meramec Shale Chaparral Acreage OPERATOR WELL 30‐DAY IP 1 CHAPARRAL GLADYS 3H‐25 1,292 Boe/d 2 CHAPARRAL KUDU 1H‐21 513 Boe/d 3 CHAPARRAL CENTIPEDE 1H‐15 876 Boe/d 4 CHAPARRAL LEE 1MH‐1 711 Boe/d 5 CH
Slide 24: NOMP 2013 and 2014 YTD Results
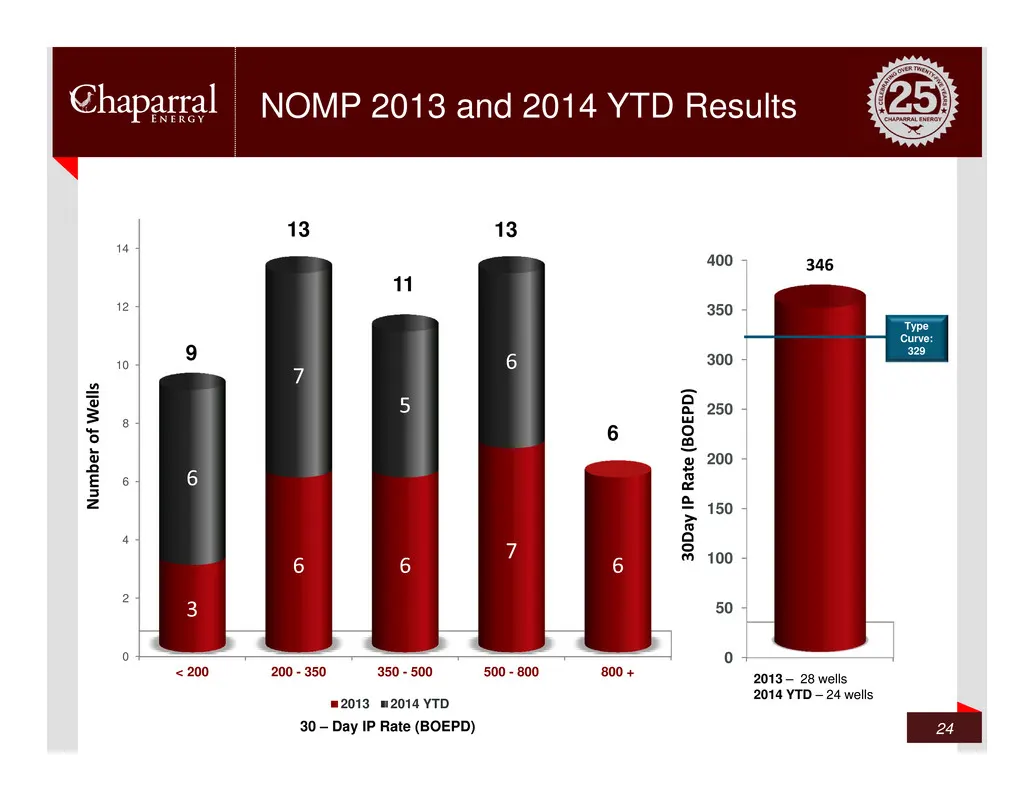
0 50 100 150 200 250 300 350 400 Average - 24 Wells 346 3 0 D a y I P R a t e ( B O E P D ) 0 2 4 6 8 10 12 14 < 200 200 - 350 350 - 500 500 - 800 800 + 3 6 6 7 6 6 7 5 6 0 N u m b e r o f W e l l s 2013 2014 YTD 9 NOMP 2013 and 2014 YTD Results 24 Type Curve: 329 1313 11 6 30 – Day IP Rate (BOEPD)
Slide 25: NOMP Growth
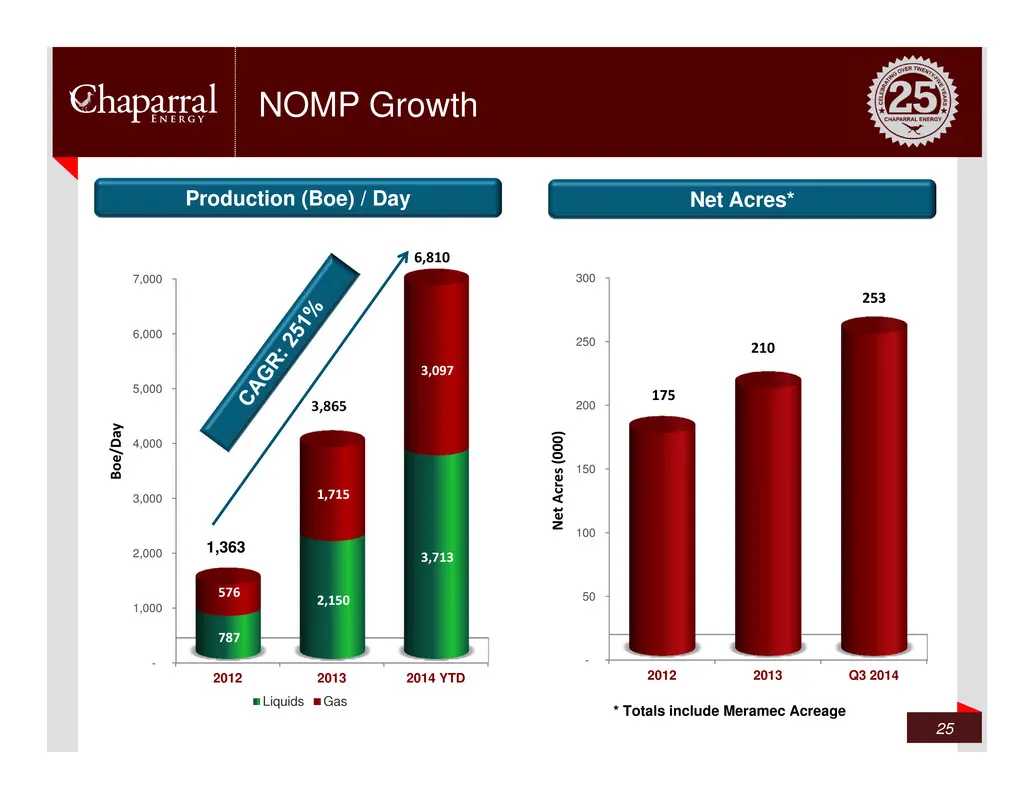
NOMP Growth 25 Production (Boe) / Day Net Acres* - 50 100 150 200 250 300 2012 2013 Q3 2014 175 210 253 N e t A c r e s ( 0 0 0 ) - 1,000 2,000 3,000 4,000 5,000 6,000 7,000 2012 2013 2014 YTD 787 2,150 3,713 576 1,715 3,097 B o e / D a y Liquids Gas 6,810 3,865 1,363 * Totals include Meramec Acreag
Slide 26: Marmaton Resource Potential
Marmaton Resource Potential
Slide 27: Marmaton Play
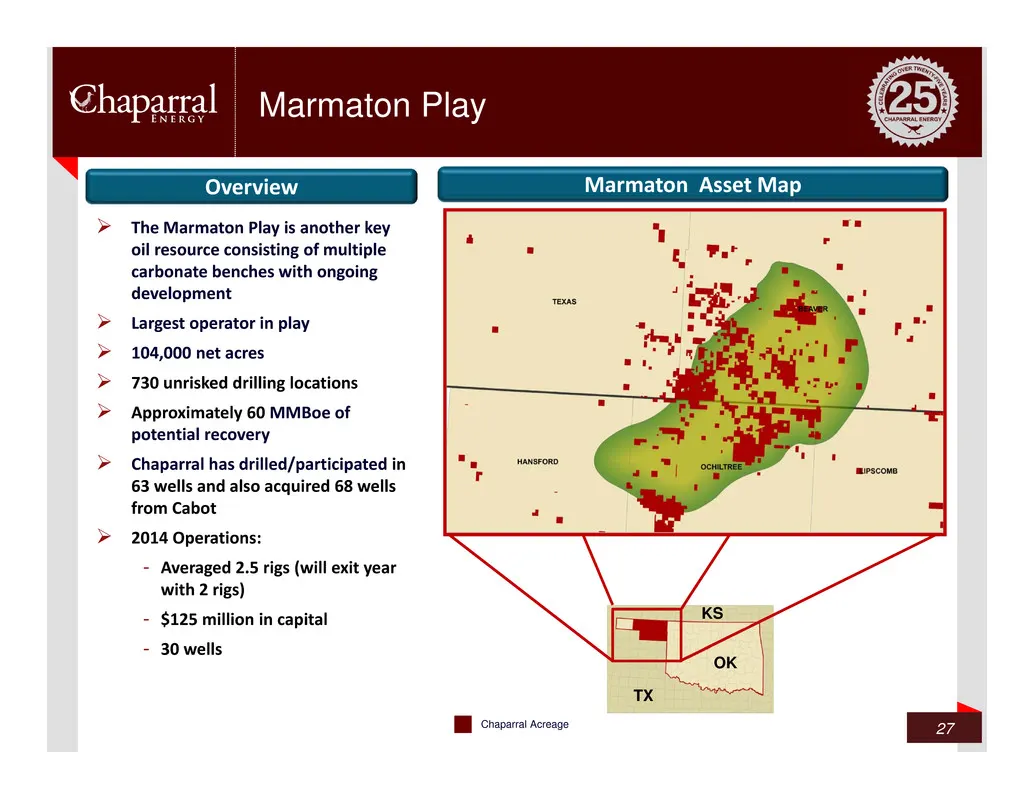
Marmaton Play 27 The Marmaton Play is another key oil resource consisting of multiple carbonate benches with ongoing development Largest operator in play 104,000 net acres 730 unrisked drilling locations Approximately 60 MMBoe of potential recovery Chaparral has drilled/participated in 6
Slide 28: Marmaton Economics
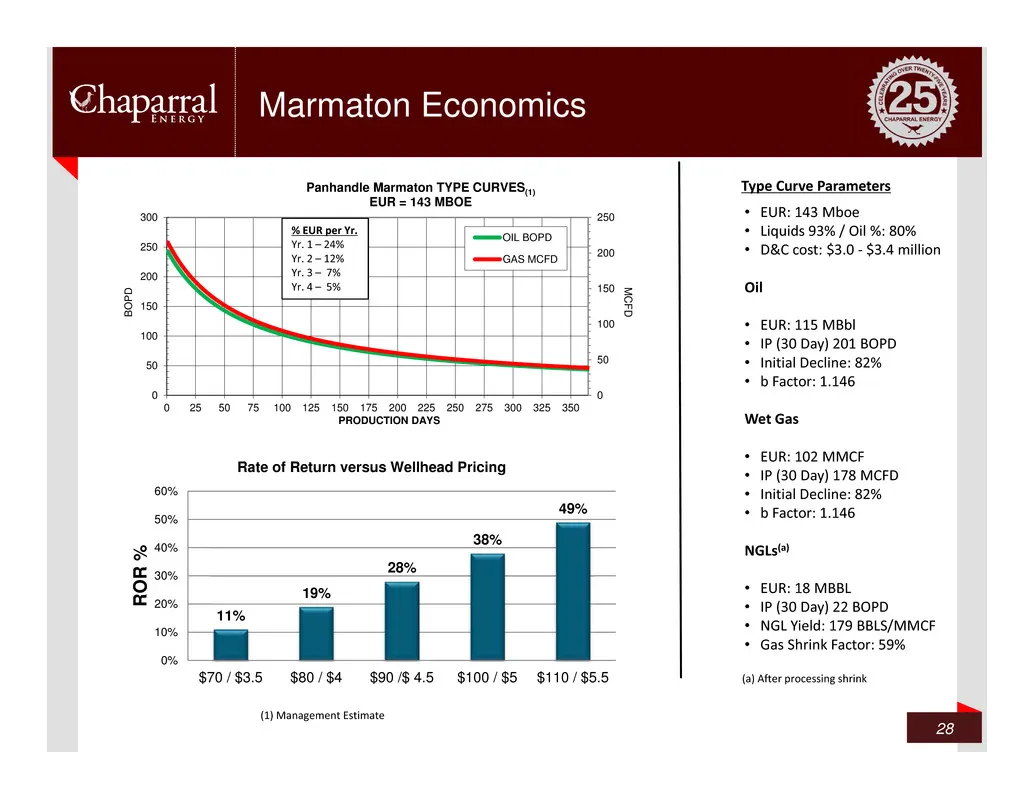
Marmaton Economics 28 Type Curve Parameters • EUR: 143 Mboe • Liquids 93% / Oil %: 80% • D&C cost: $3.0 ‐ $3.4 million Oil • EUR: 115 MBbl • IP (30 Day) 201 BOPD • Initial Decline: 82% • b Factor: 1.146 Wet Gas • EUR: 102 MMCF • IP (30 Day) 178 MCFD • Initial Decline: 82% • b Factor: 1.146 NGLs(a) •
Slide 29: Marmaton Well Performance
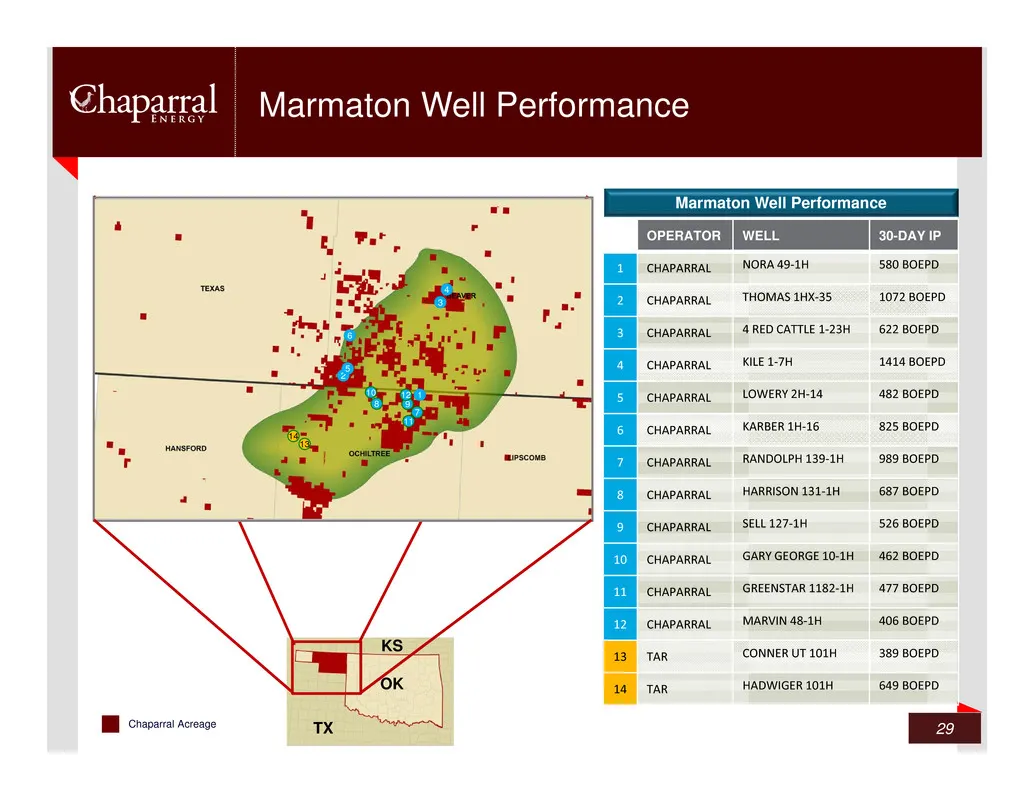
Marmaton Well Performance 29 Marmaton Well Performance Chaparral Acreage OK TX KS 2 3 4 8 7 5 9 10 11 12 1 13 14 6 OPERATOR WELL 30-DAY IP 1 CHAPARRAL NORA 49‐1H 580 BOEPD 2 CHAPARRAL THOMAS 1HX‐35 1072 BOEPD 3 CHAPARRAL 4 RED CATTLE 1‐23H 622 BOEPD 4 CHAPARRAL KILE 1‐7H 1414 BOEPD 5 CHAPARRAL LOWER
Slide 30: tou)
> = a ° tou) o s o fo)
Slide 31: Oswego Play
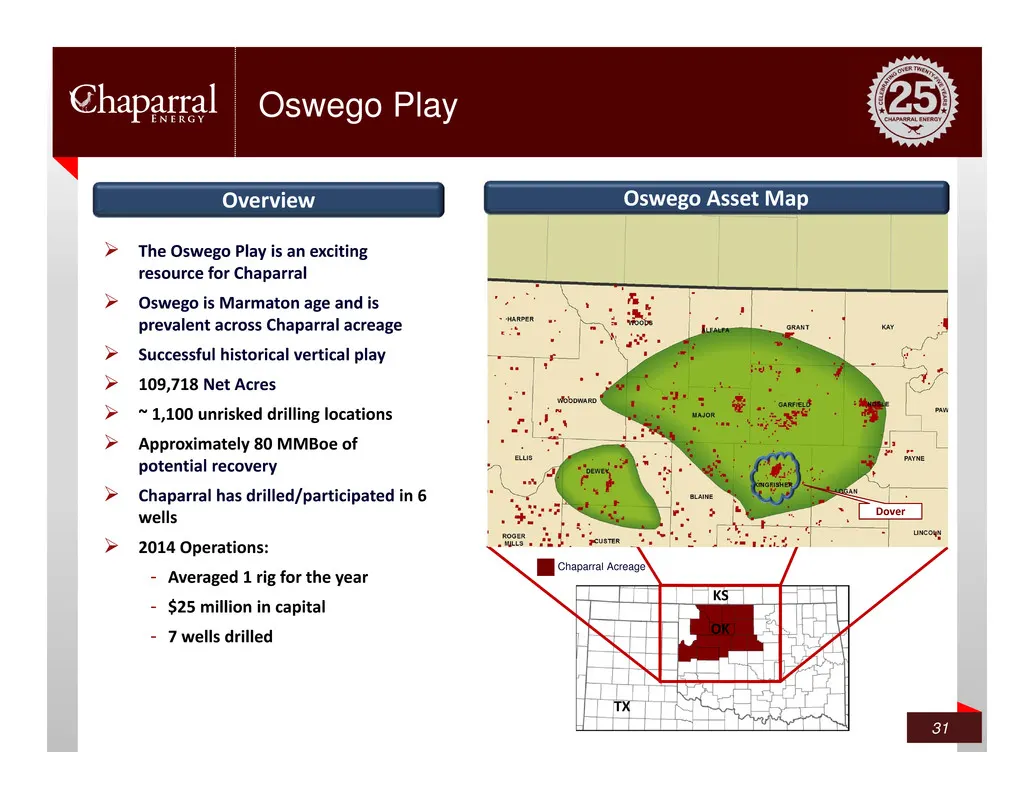
Oswego Play 31 The Oswego Play is an exciting resource for Chaparral Oswego is Marmaton age and is prevalent across Chaparral acreage Successful historical vertical play 109,718 Net Acres ~ 1,100 unrisked drilling locations Approximately 80 MMBoe of potential recovery Chaparral has dri
Slide 32: Oswego (Dover)
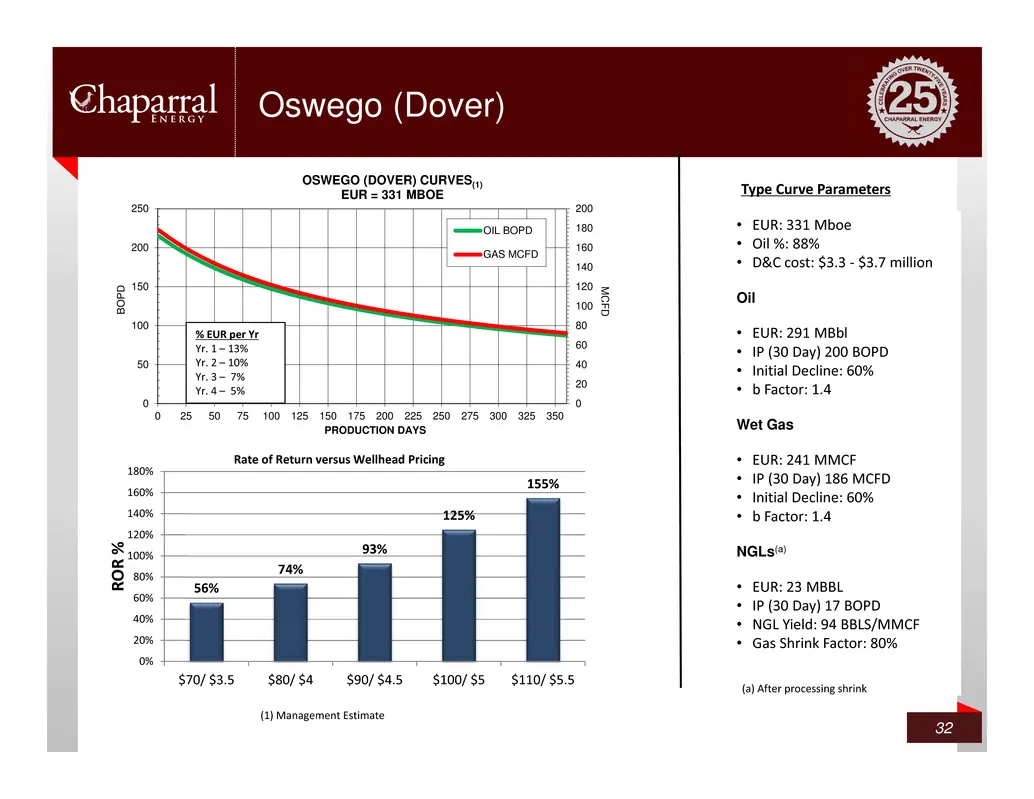
Oswego (Dover) 32 • EUR: 331 Mboe • Oil %: 88% • D&C cost: $3.3 ‐ $3.7 million Oil • EUR: 291 MBbl • IP (30 Day) 200 BOPD • Initial Decline: 60% • b Factor: 1.4 Wet Gas • EUR: 241 MMCF • IP (30 Day) 186 MCFD • Initial Decline: 60% • b Factor: 1.4 NGLs(a) • EUR: 23 MBBL • IP (30 Day) 17 BOPD • NGL Yi
Slide 33: Oswego (Non-Dover)
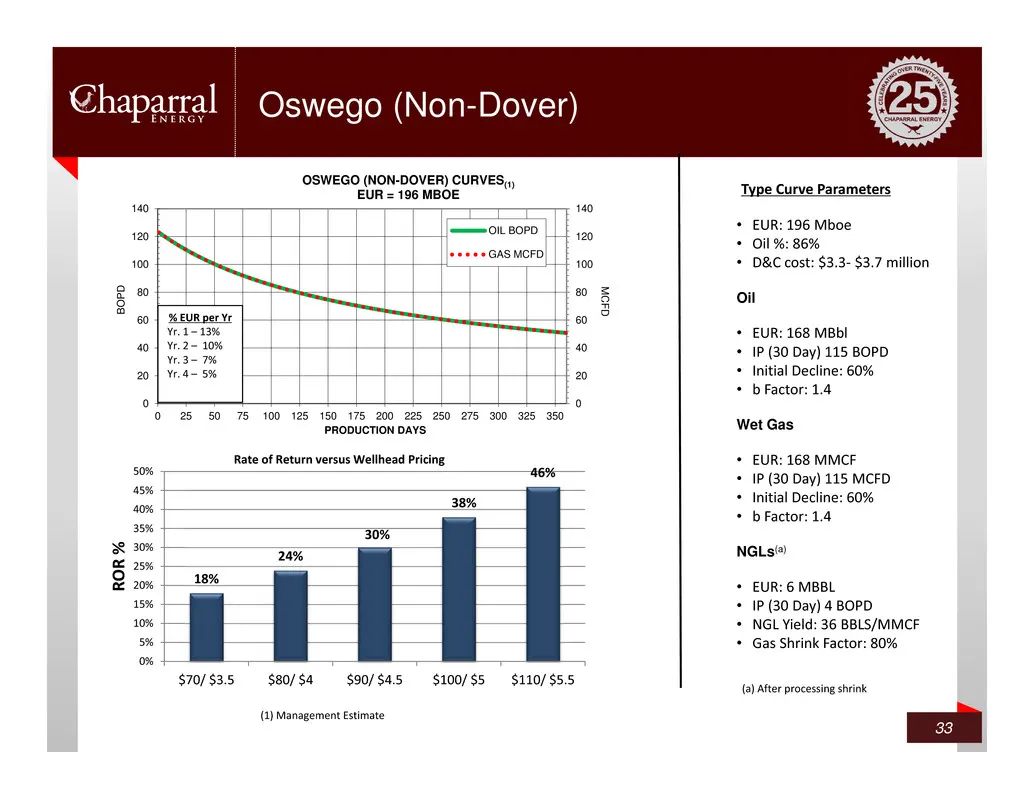
Oswego (Non-Dover) 33 • EUR: 196 Mboe • Oil %: 86% • D&C cost: $3.3‐ $3.7 million Oil • EUR: 168 MBbl • IP (30 Day) 115 BOPD • Initial Decline: 60% • b Factor: 1.4 Wet Gas • EUR: 168 MMCF • IP (30 Day) 115 MCFD • Initial Decline: 60% • b Factor: 1.4 NGLs(a) • EUR: 6 MBBL • IP (30 Day) 4 BOPD • NGL Y
Slide 34: Oswego Well Performance
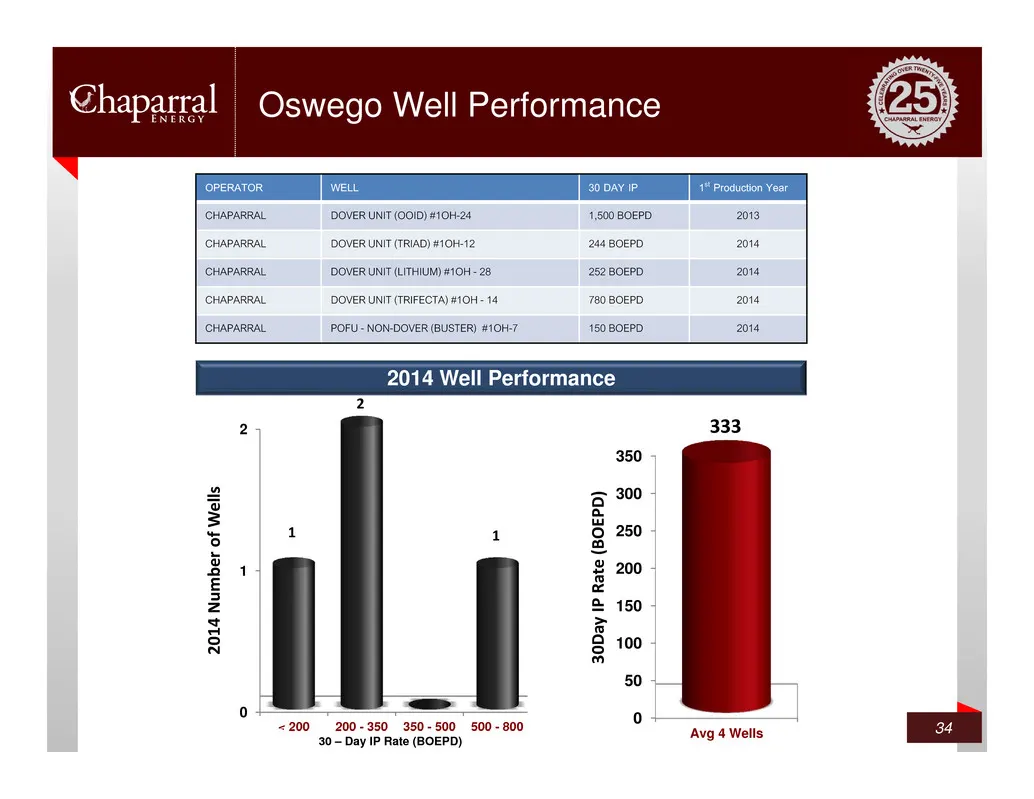
Oswego Well Performance 34 OPERATOR WELL 30 DAY IP 1st Production Year CHAPARRAL DOVER UNIT (OOID) #1OH-24 1,500 BOEPD 2013 CHAPARRAL DOVER UNIT (TRIAD) #1OH-12 244 BOEPD 2014 CHAPARRAL DOVER UNIT (LITHIUM) #1OH - 28 252 BOEPD 2014 CHAPARRAL DOVER UNIT (TRIFECTA) #1OH - 14 780 BOEPD 2014 CHAPARRAL P
Slide 35: Woodford Shale Play
Chaparral Woodford Shale Play
Slide 36: Woodford Shale Play
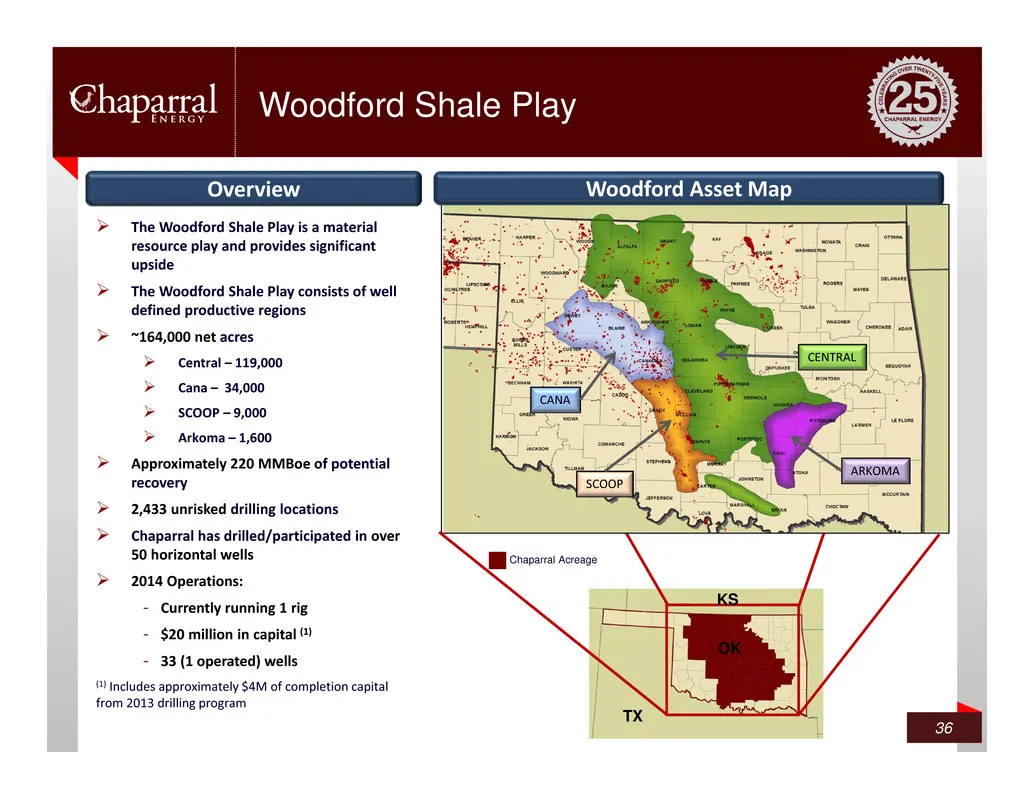
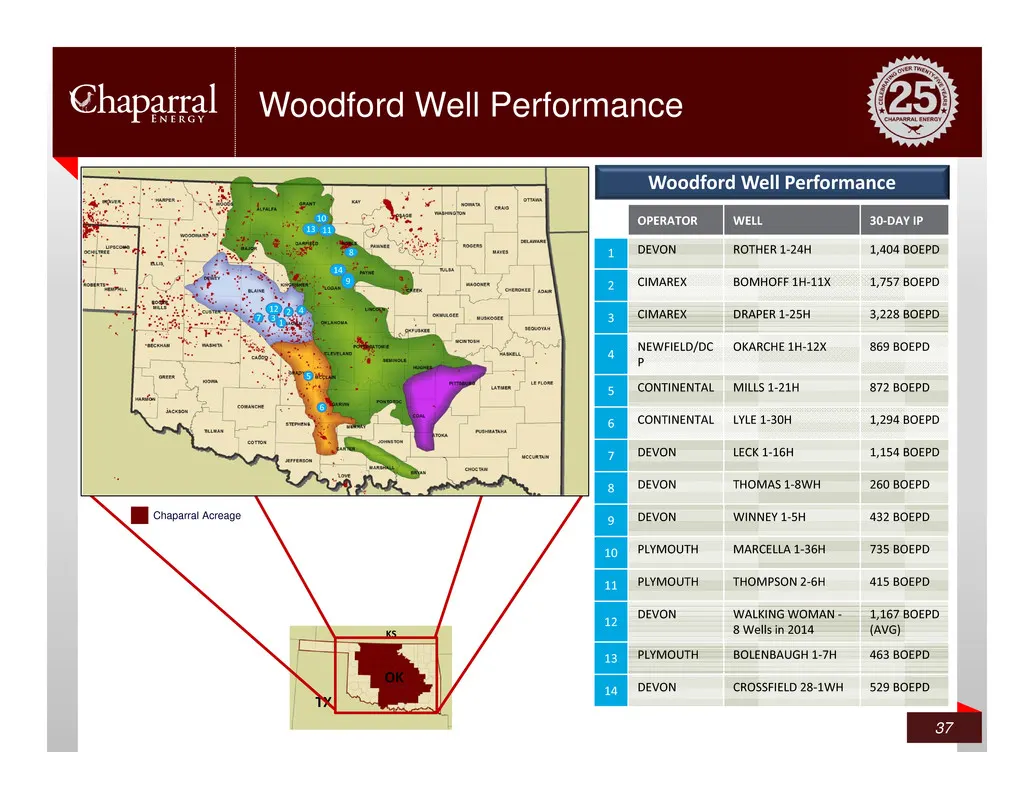
Woodford Shale Play 36 The Woodford Shale Play is a material resource play and provides significant upside The Woodford Shale Play consists of well defined productive regions ~164,000 net acres Central – 119,000 Cana – 34,000 SCOOP – 9,000 Arkoma – 1,600 Approximately 220 MMBoe of po
Slide 37: Woodford Well Performance
Woodford Well Performance 37 OK TX KS Chaparral Acreage Woodford Well Performance CANA SCOOP ARKOMA CENTRAL 1 23 4 5 6 7 8 9 10 11 1 2 3 4 5 6 7 8 9 10 1 12 13 14 OPERATOR WELL 30‐DAY IP 1 DEVON ROTHER 1‐24H 1,404 BOEPD 2 CIMAREX BOMHOFF 1H‐11X 1,757 BOEPD 3 CIMAREX DRAPER 1‐25H 3,228 BOEPD 4 NEWFIE
Slide 38: Central Woodford Economics
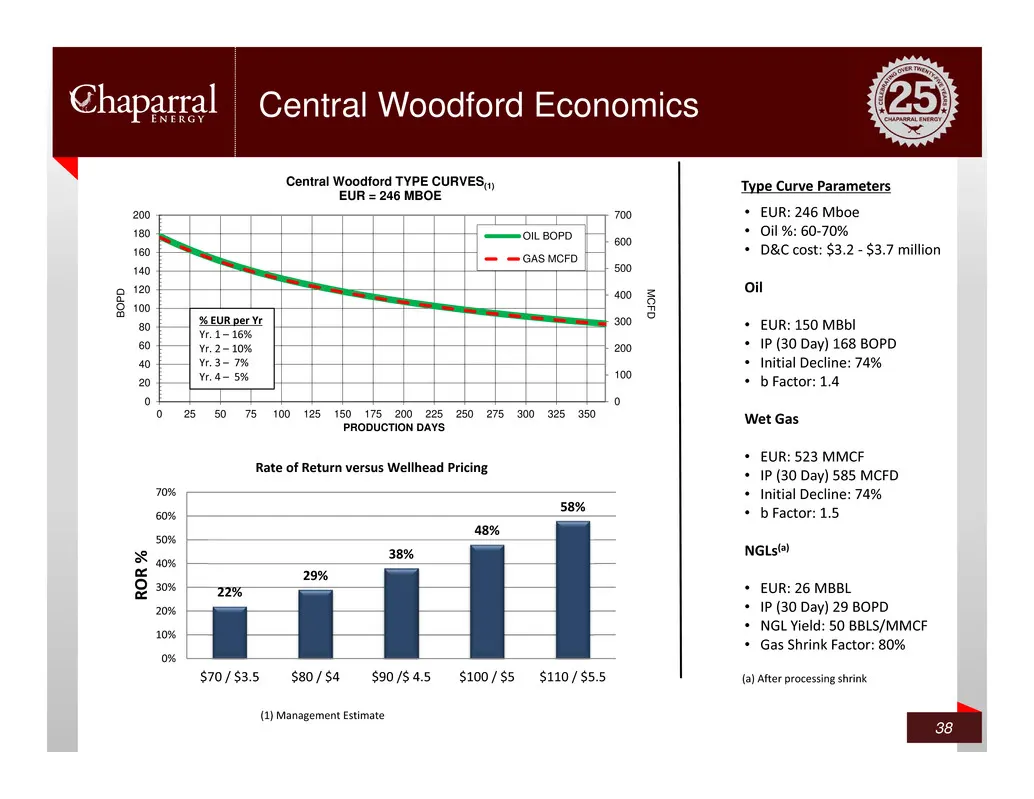
0 100 200 300 400 500 600 700 0 20 40 60 80 100 120 140 160 180 200 0 25 50 75 100 125 150 175 200 225 250 275 300 325 350 B O P D PRODUCTION DAYS Central Woodford TYPE CURVES(1) EUR = 246 MBOE OIL BOPD GAS MCFD M C FD Central Woodford Economics 38 Type Curve Parameters • EUR: 246 Mboe • Oil %: 60‐7
Slide 39: CO2 EOR is a Major Part of Chaparral's Growth Story
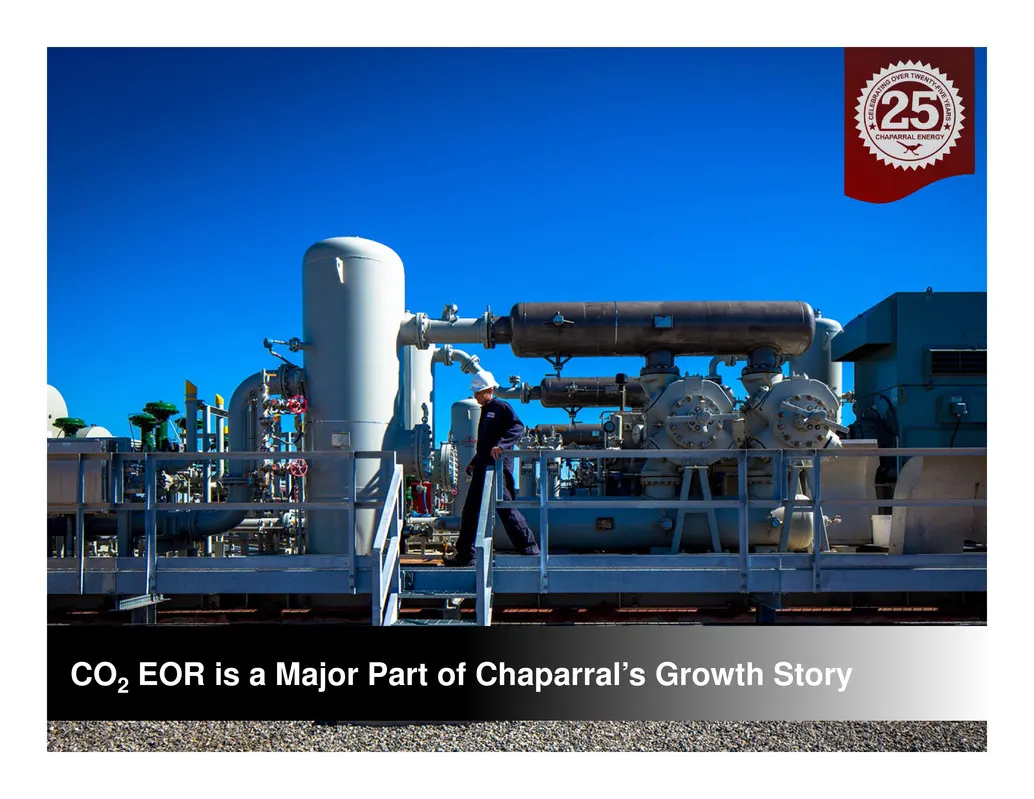
CO2 EOR is a Major Part of Chaparral’s Growth Story
Slide 40: Leader in the CO2 EOR Industry
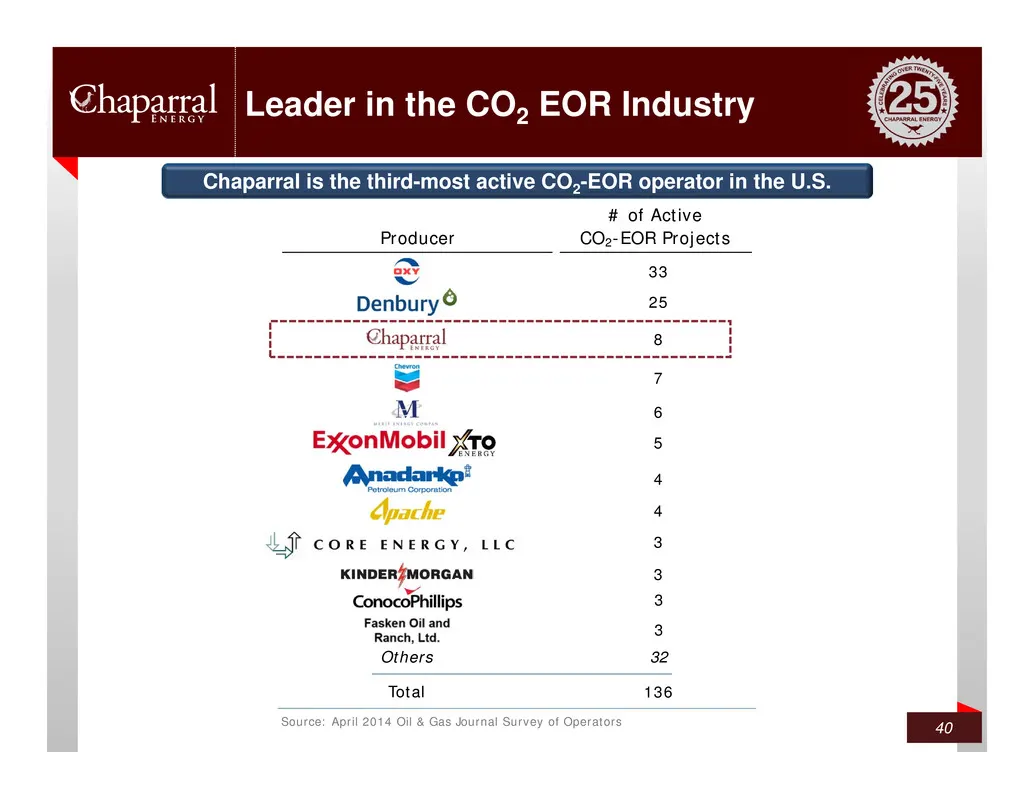
Leader in the CO2 EOR Industry 40 Chaparral is the third-most active CO2-EOR operator in the U.S. Source: April 2014 Oil & Gas Journal Survey of Operators 3 32 # of Active Producer CO2-EOR Projects 33 25 7 6 5 4 4 3 3 Total 136 Others 3 8
Slide 41: CO2 EOR Focused Areas
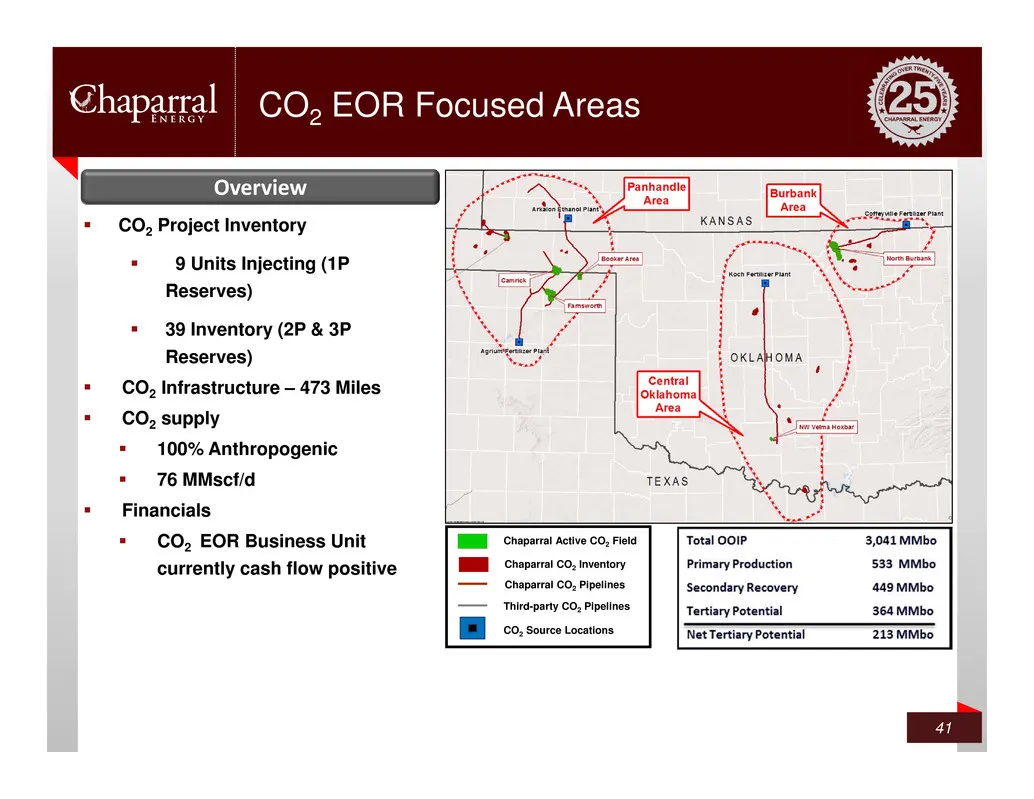
CO2 EOR Focused Areas 41 CO2 Project Inventory 9 Units Injecting (1P Reserves) 39 Inventory (2P & 3P Reserves) CO2 Infrastructure – 473 Miles CO2 supply 100% Anthropogenic 76 MMscf/d Financials CO2 EOR Business Unit currently cash flow positive Overview Chaparral Active CO2 Field C
Slide 42: Proven Track Record of CO2 EOR Performance
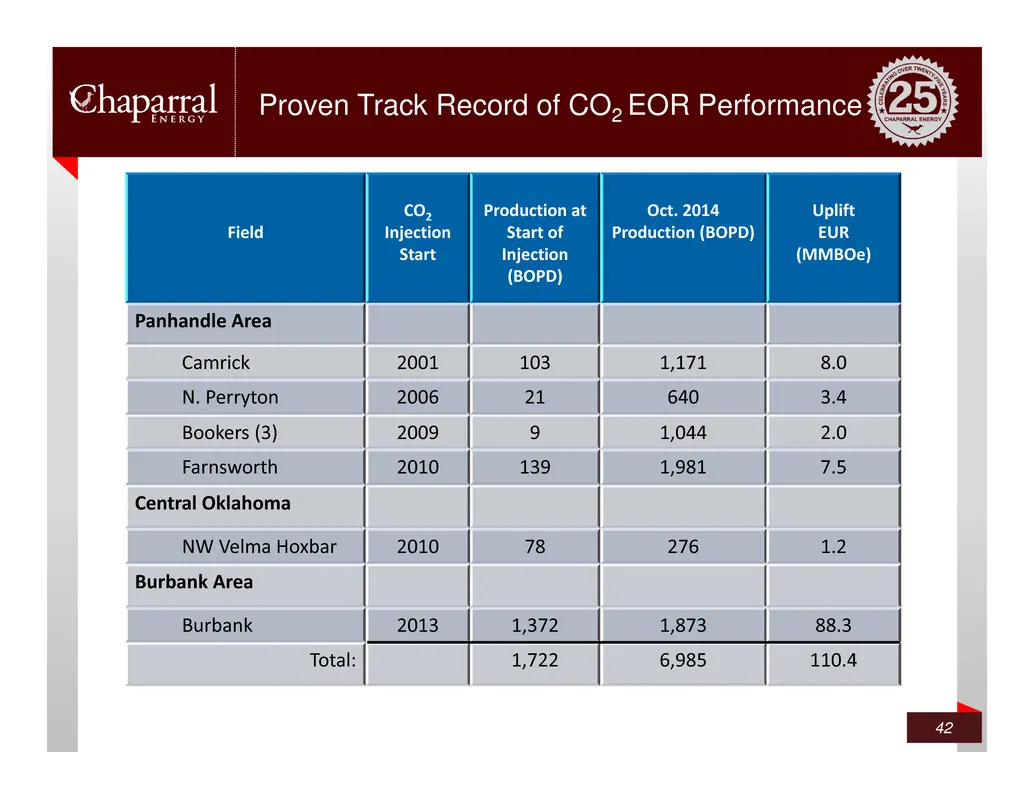
Proven Track Record of CO2 EOR Performance 42 Field CO2 Injection Start Production at Start of Injection (BOPD) Oct. 2014 Production (BOPD) Uplift EUR (MMBOe) Panhandle Area Camrick 2001 103 1,171 8.0 N. Perryton 2006 21 640 3.4 Bookers (3) 2009 9 1,044 2.0 Farnsworth 2010 139 1,981 7.5 Central Okla
Slide 43: Total EOR Uplift Growth
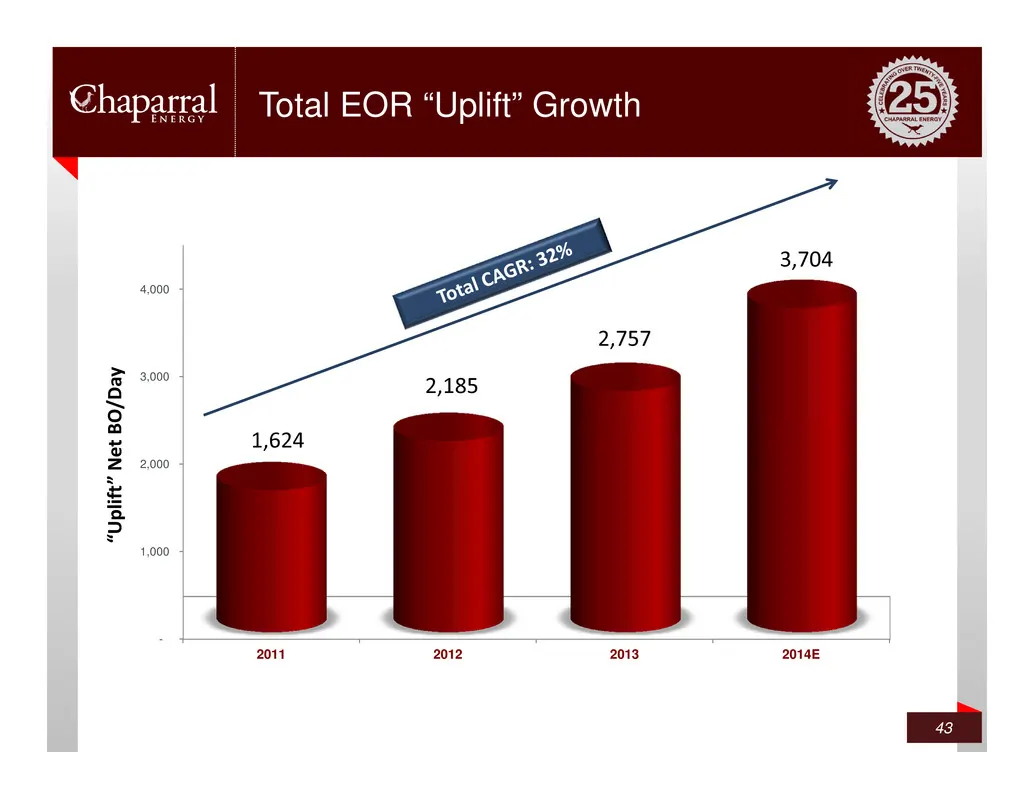
Total EOR “Uplift” Growth 43 - 1,000 2,000 3,000 4,000 2011 2012 2013 2014E 1,624 2,185 2,757 3,704 “ U p l i f t ” N e t B O / D a y
Slide 44: North Burbank CO2 EOR Development
North Burbank CO2 EOR Development
Slide 45: Burbank Area Overview
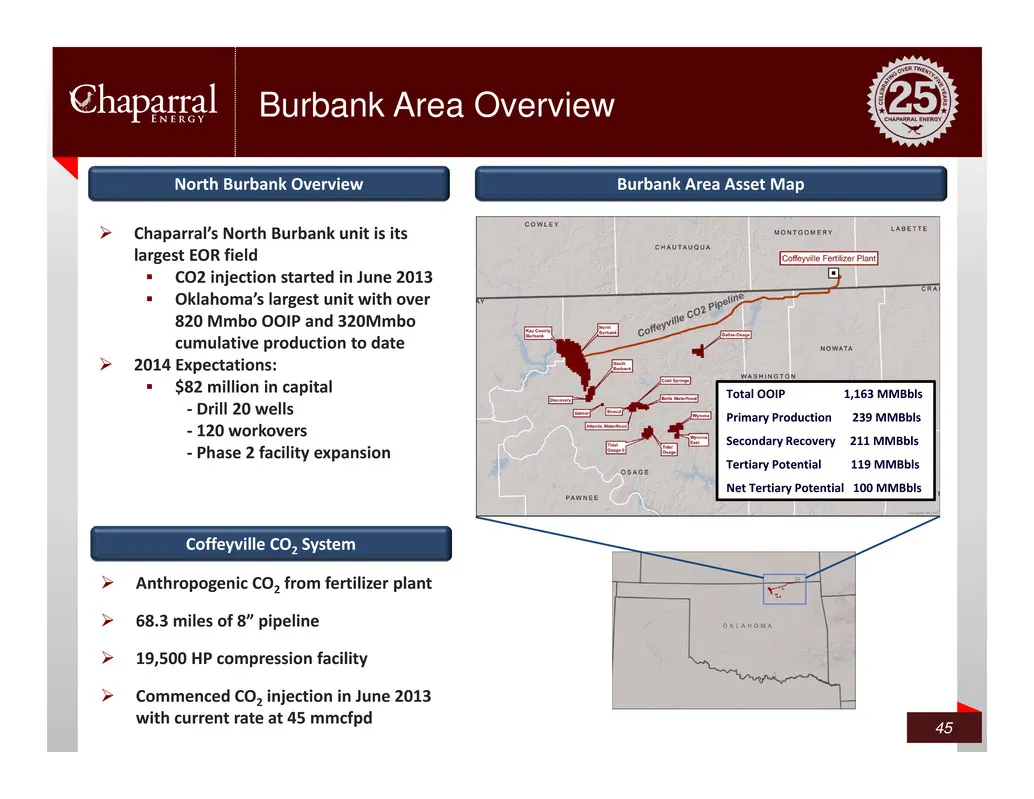
Burbank Area Overview 45 Chaparral’s North Burbank unit is its largest EOR field CO2 injection started in June 2013 Oklahoma’s largest unit with over 820 Mmbo OOIP and 320Mmbo cumulative production to date 2014 Expectations: $82 million in capital ‐ Drill 20 wells ‐ 120 workovers ‐ Phase 2
Slide 46: North Burbank CO2-EOR Flood
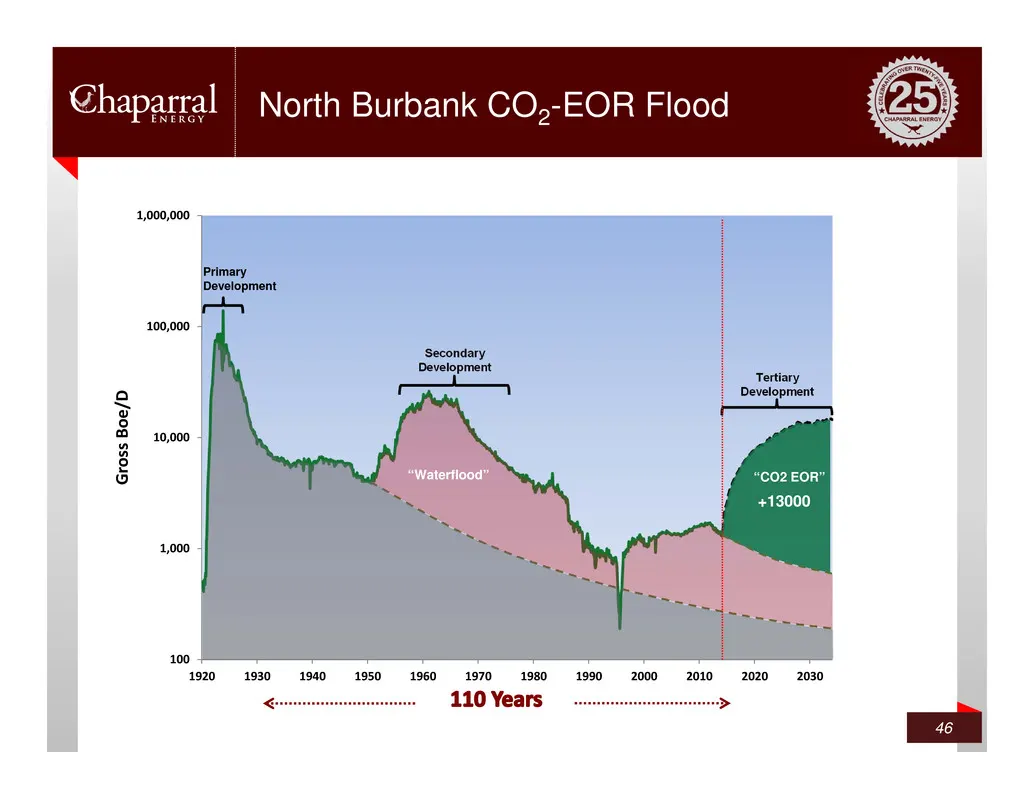
100 1,000 10,000 100,000 1,000,000 100 1,000 10,000 100,000 1,000,000 1920 1930 1940 1950 1960 1970 1980 1990 2000 2010 2020 2030 G r o s s B o e / D Primary Development Secondary Development Tertiary Development North Burbank CO2-EOR Flood 46 +13000 “Waterflood” “CO2 EOR”
Slide 47: North Burbank Unit - Gross Production
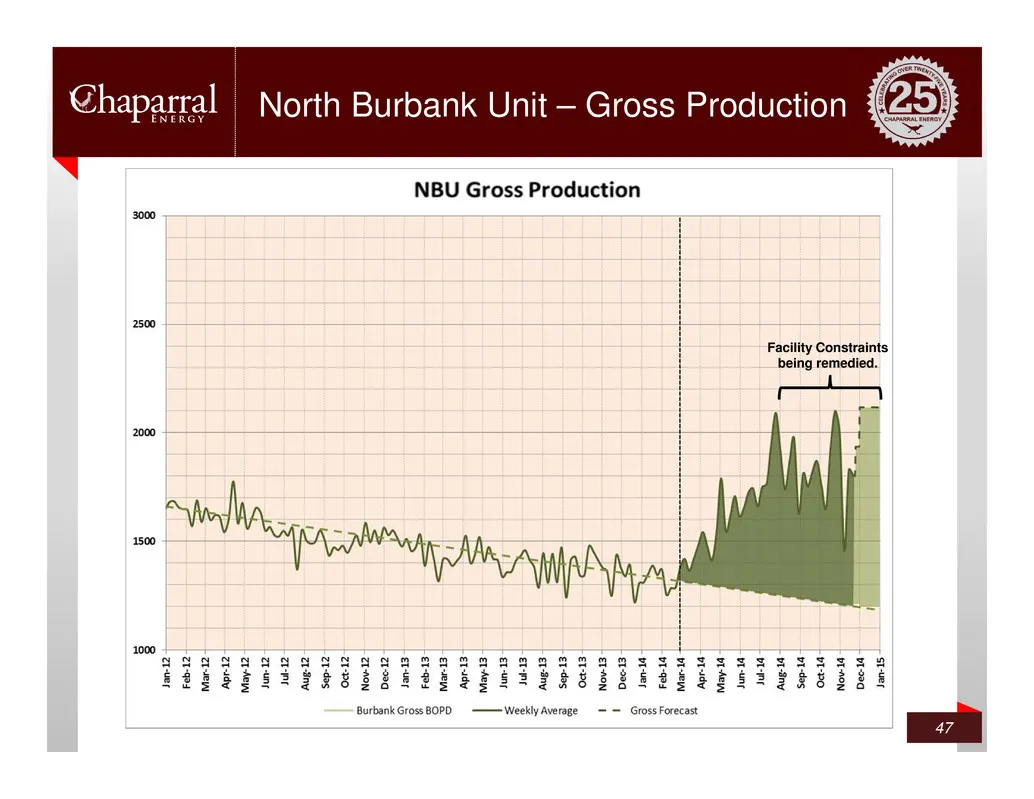
North Burbank Unit – Gross Production 47 Facility Constraints being remedied.

Slide 48: Financial Overview
Financial Overview
Slide 49: Financial Metrics per BOE
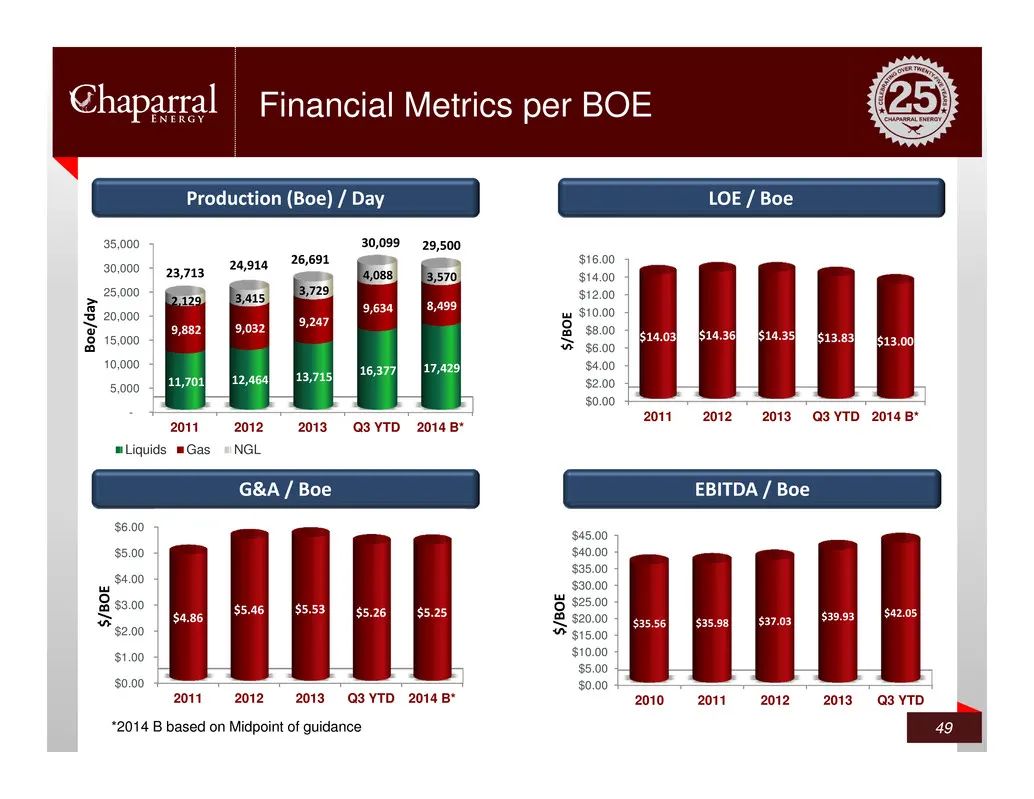
Financial Metrics per BOE 49 Production (Boe) / Day LOE / Boe EBITDA / BoeG&A / Boe - 5,000 10,000 15,000 20,000 25,000 30,000 35,000 2011 2012 2013 Q3 YTD 2014 B* 11,701 12,464 13,715 16,377 17,429 9,882 9,032 9,247 9,634 8,499 2,129 3,415 3,729 4,088 3,570 B o e / d a y Liquids Gas NGL 23,713 24,9
Slide 50: Hedge Portfolio
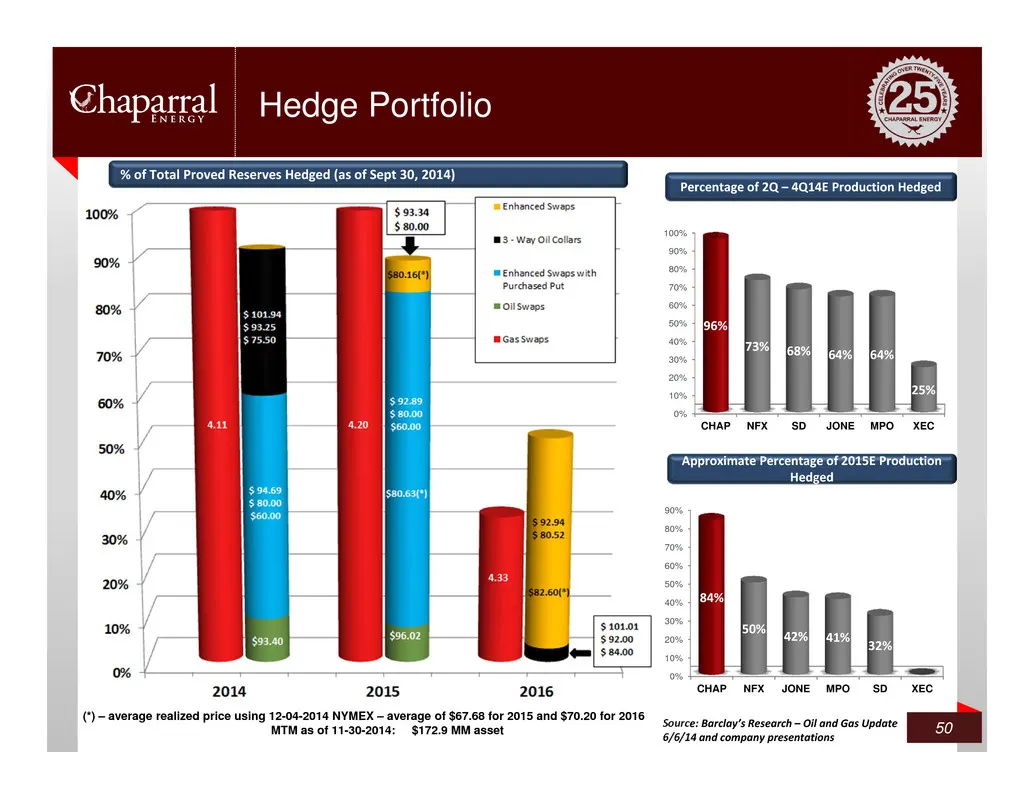
Hedge Portfolio 50 Percentage of 2Q – 4Q14E Production Hedged 0% 10% 20% 30% 40% 50% 60% 70% 80% 90% 100% CHAP NFX SD JONE MPO XEC 96% 73% 68% 64% 64% 25% Approximate Percentage of 2015E Production Hedged 0% 10% 20% 30% 40% 50% 60% 70% 80% 90% CHAP NFX JONE MPO SD XEC 84% 50% 42% 41% 32% Source: Bar
Slide 51: Financial Flexibility to Execute Strategy
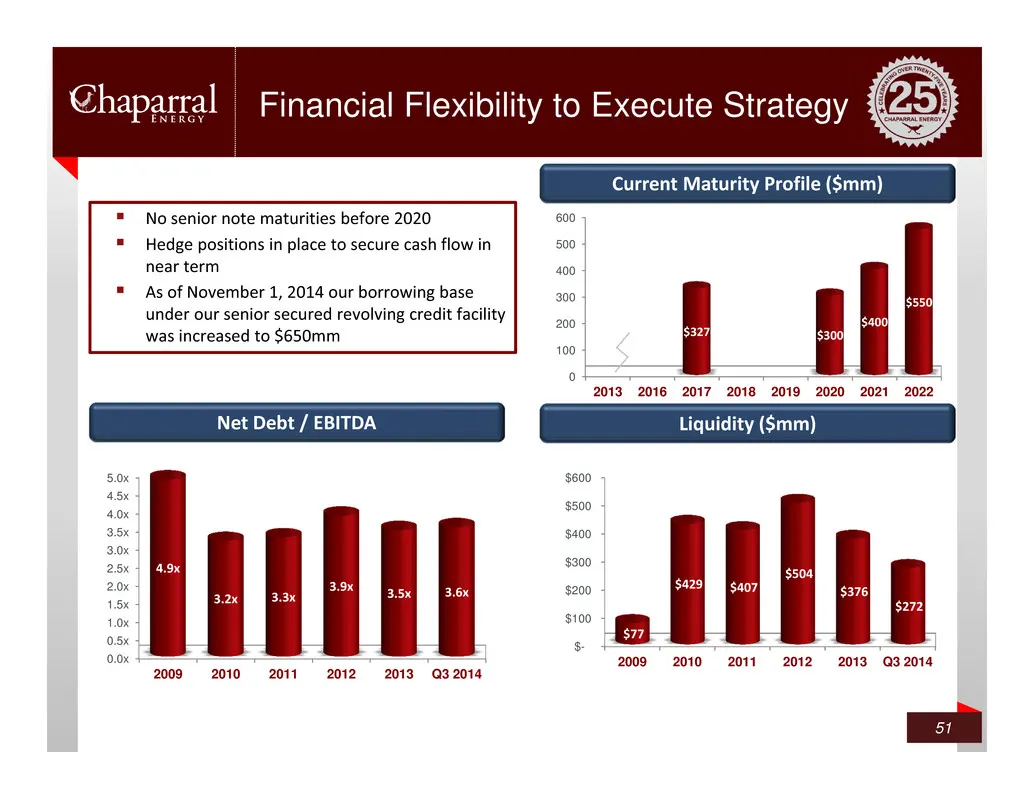
Financial Flexibility to Execute Strategy 51 Net Debt / EBITDA Liquidity ($mm) $325 $300 $400 0 100 200 300 400 500 600 2013 2016 2017 2018 2019 2020 2021 2022 $327 $300 $400 $550 0.0x 0.5x 1.0x 1.5x 2.0x 2.5x 3.0x 3.5x 4.0x 4.5x 5.0x 2009 2010 2011 2012 2013 Q3 2014 4.9x 3.2x 3.3x 3.9x 3.5x 3.6x $-
Slide 52: 2014 Guidance
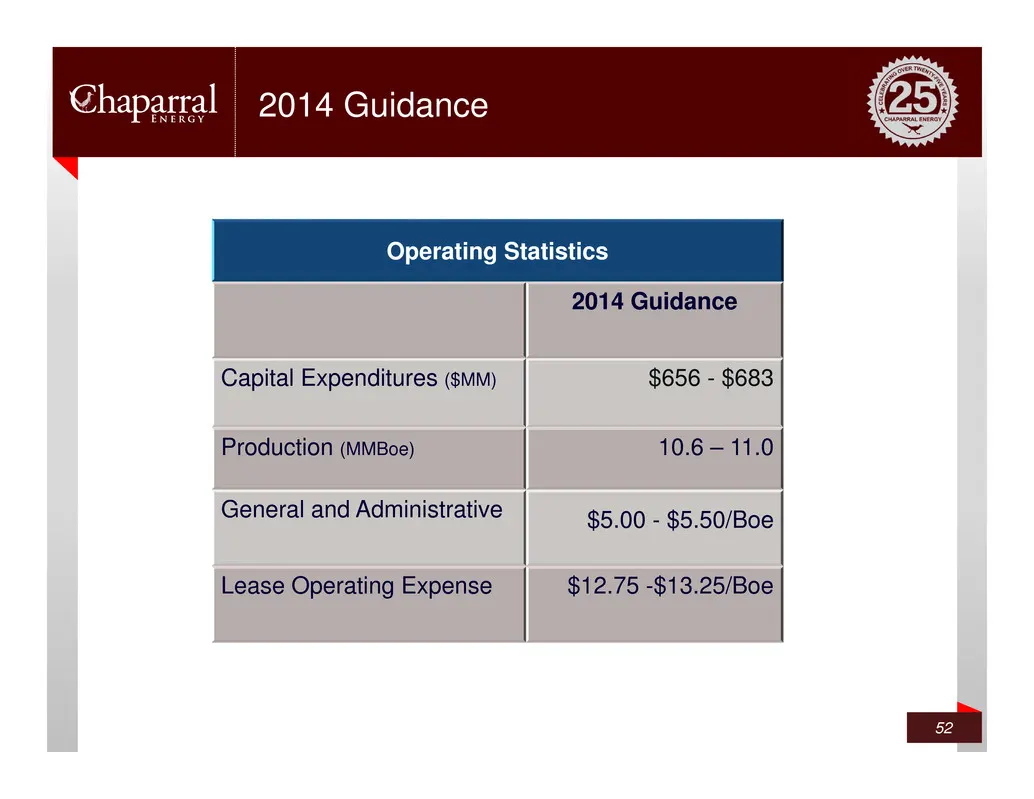
2014 Guidance 52 Operating Statistics 2014 Guidance Capital Expenditures ($MM) $656 - $683 Production (MMBoe) 10.6 – 11.0 General and Administrative $5.00 - $5.50/Boe Lease Operating Expense $12.75 -$13.25/Boe
Slide 53: Thank you
Thank you © 2014 Chaparral Energy
Source: SEC EDGAR · 8-K filed Dec 9, 2014
More decks from Chaparral Energy Inc
 Debt Investor Presentation (August 2020)10 slides · Aug 17, 2020
 Q1 2020 Earnings Presentation26 slides · May 12, 2020
 Investor Presentation (March 2020)30 slides · Mar 12, 2020
 Q3 2019 Earnings Presentation31 slides · Nov 12, 2019
 Q2 2019 Earnings Presentation33 slides · Aug 8, 2019
 Investor Presentation (May 2019)41 slides · May 28, 2019