Altra Industrial Motion — Q4 2015 Earnings Presentation
12 slides from Altra Industrial Motion's earnings presentation, Feb 17, 2016
Slide 1: Fourth Quarter 2015 Results
Fourth Quarter 2015 Results February 17, 2016 10:00 AM ET Dial In Number 877-407-8293 Domestic 201-689-8349 International Webcast at www.altramotion.com Replay Through March 2, 2016 877-660-6853 Domestic 201-612-7415 International Conference ID: #13629944 Webcast Replay at www.altramotion.com
Slide 2: Safe Harbor Statement
Safe Harbor Statement Cautionary Statement Regarding Forward Looking Statements All statements, other than statements of historical fact included in this release are forward-looking statements, as that term is defined in the Private Securities Litigation Reform Act of 1995. These statements include,
Slide 3: Fourth Quarter 2015 Highlights
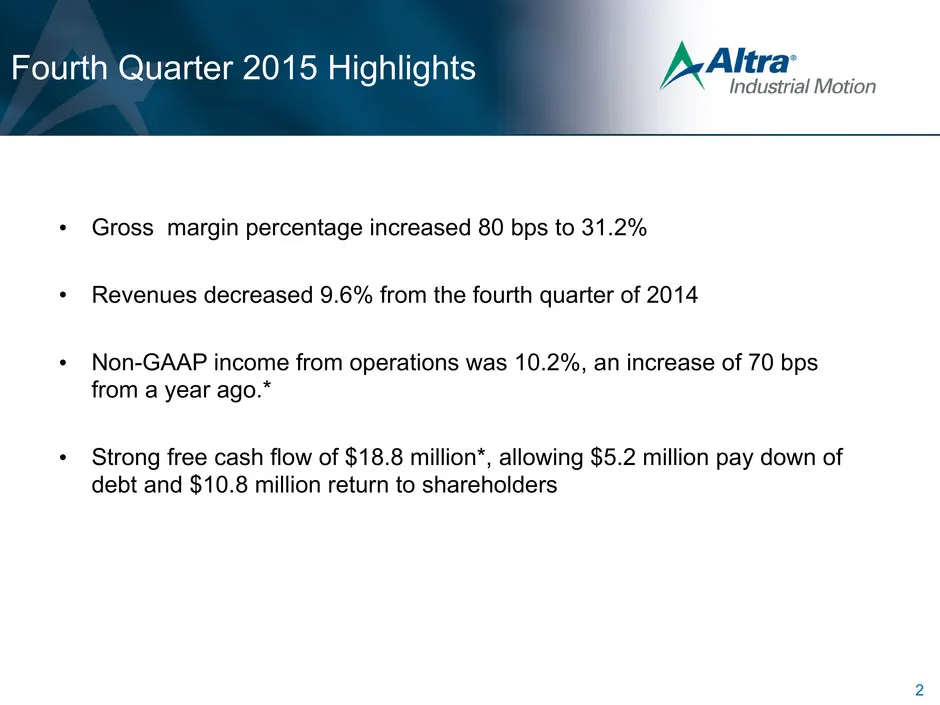
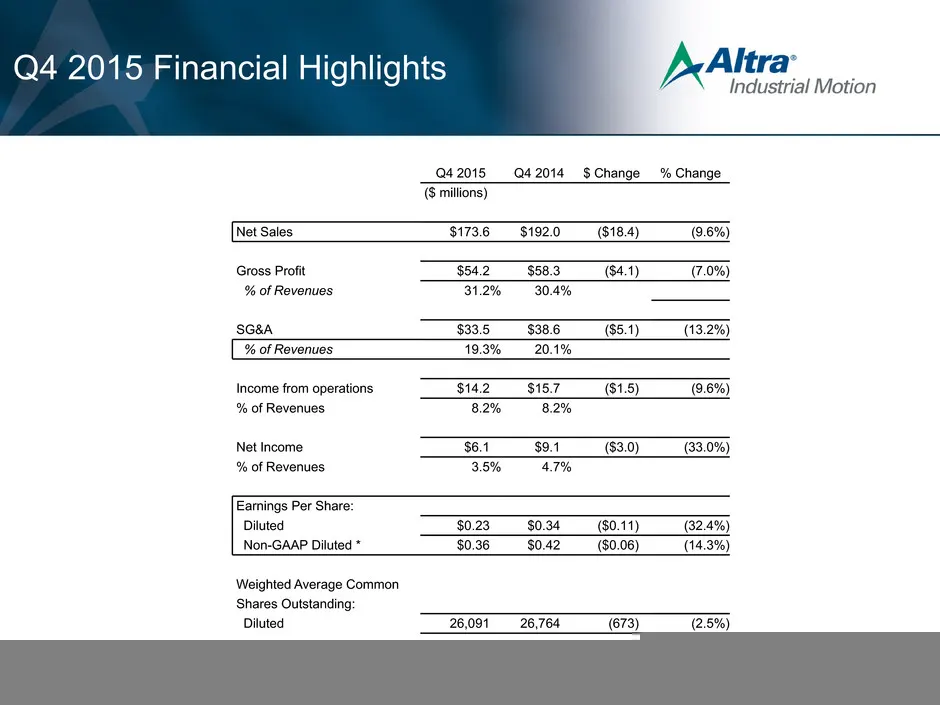
Fourth Quarter 2015 Highlights • Gross margin percentage increased 80 bps to 31.2% • Revenues decreased 9.6% from the fourth quarter of 2014 • Non-GAAP income from operations was 10.2%, an increase of 70 bps from a year ago.* • Strong free cash flow of $18.8 million*, allowing $5.2 million pay down
Slide 4: End Market Review
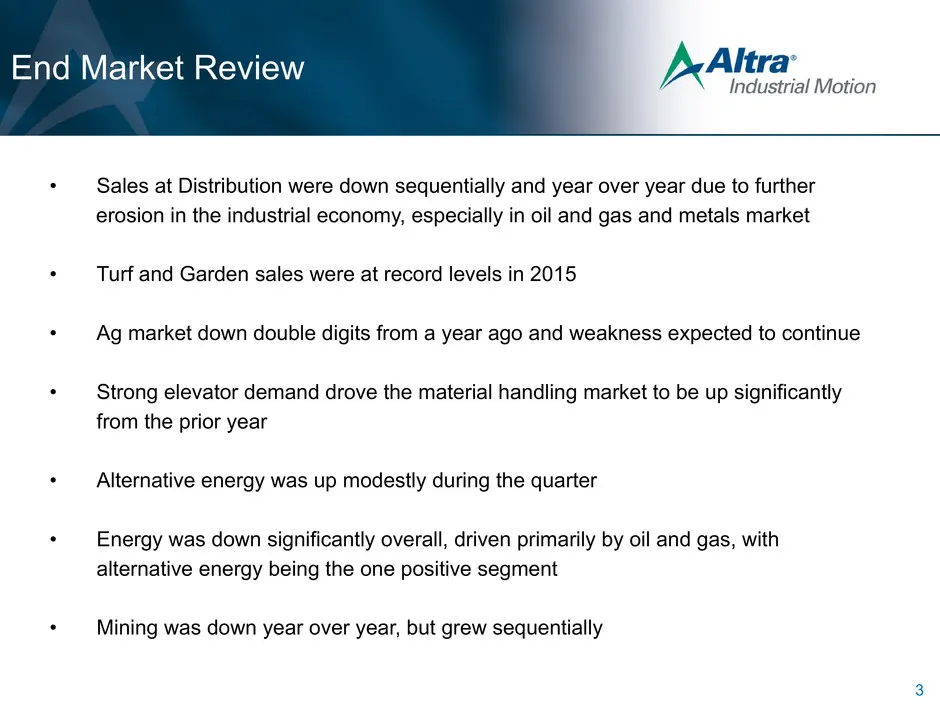
End Market Review • Sales at Distribution were down sequentially and year over year due to further erosion in the industrial economy, especially in oil and gas and metals market • Turf and Garden sales were at record levels in 2015 • Ag market down double digits from a year ago and weakness expected
Slide 5: Q4 2015 Financial Highlights
Q4 2015 Financial Highlights 4 Q4 2015 Q4 2014 $ Change % Change ($ millions) Net Sales $173.6 $192.0 ($18.4) (9.6%) Gross Profit $54.2 $58.3 ($4.1) (7.0%) % of Revenues 31.2% 30.4% SG&A $33.5 $38.6 ($5.1) (13.2%) % of Revenues 19.3% 20.1% Income from operations $14.2 $15.7 ($1.5) (9.6%) % of Revenu
Slide 6: Selected Segment Data
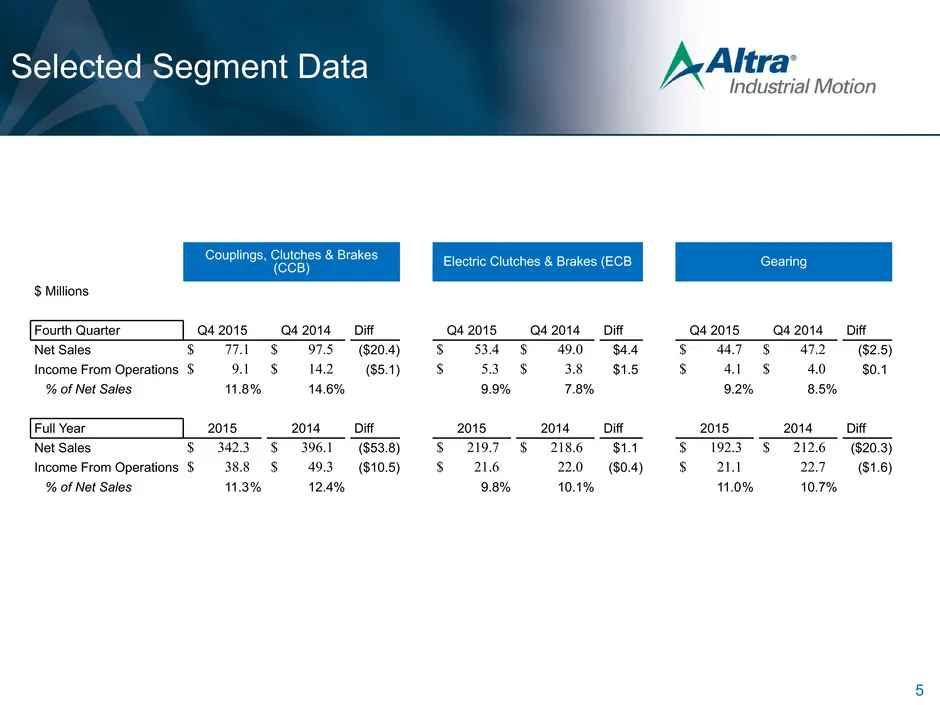
Selected Segment Data 5 Couplings, Clutches & Brakes (CCB) Electric Clutches & Brakes (ECB Gearing $ Millions Fourth Quarter Q4 2015 Q4 2014 Diff Q4 2015 Q4 2014 Diff Q4 2015 Q4 2014 Diff Net Sales $ 77.1 $ 97.5 ($20.4) $ 53.4 $ 49.0 $4.4 $ 44.7 $ 47.2 ($2.5) Income From Operations $ 9.1 $ 14.2 ($5.
Slide 7: Balance Sheet Highlights
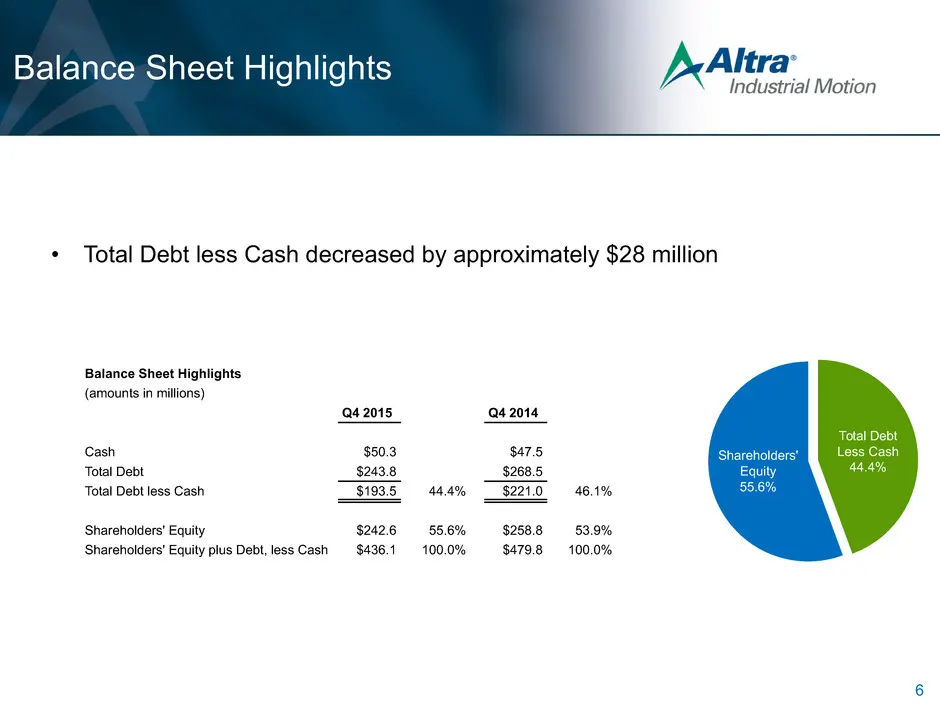
Balance Sheet Highlights • Total Debt less Cash decreased by approximately $28 million 6 Balance Sheet Highlights (amounts in millions) Q4 2015 Q4 2014 Cash $50.3 $47.5 Total Debt $243.8 $268.5 Total Debt less Cash $193.5 44.4% $221.0 46.1% Shareholders' Equity $242.6 55.6% $258.8 53.9% Shareholders
Slide 8: Strong Cash Flow Performance
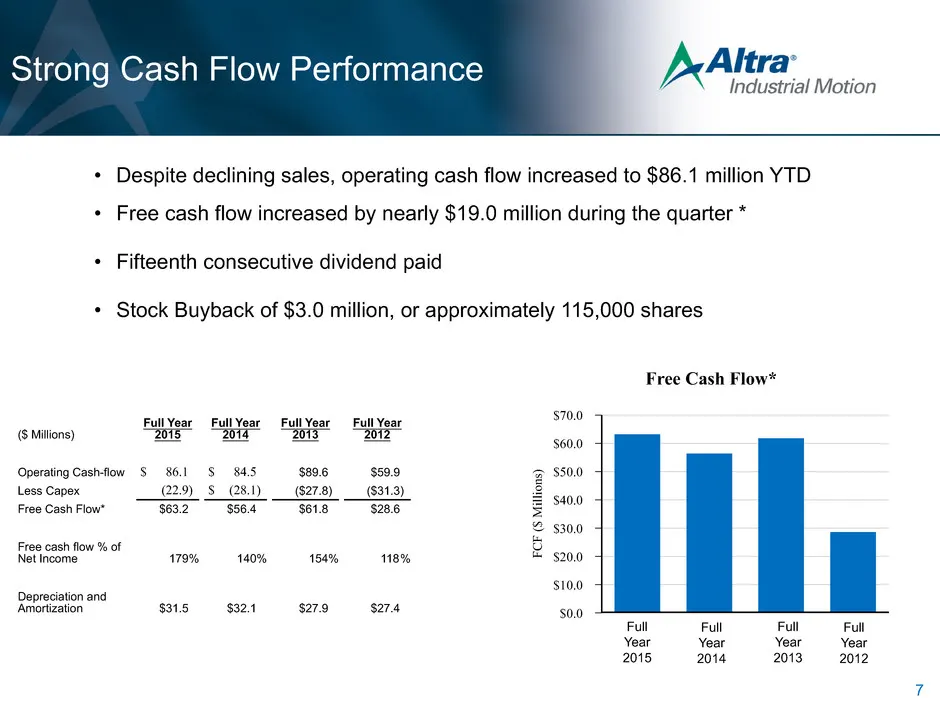
Strong Cash Flow Performance • Despite declining sales, operating cash flow increased to $86.1 million YTD • Free cash flow increased by nearly $19.0 million during the quarter * • Fifteenth consecutive dividend paid • Stock Buyback of $3.0 million, or approximately 115,000 shares 7 ($ Millions) Ful
Slide 9: 2016 Guidance
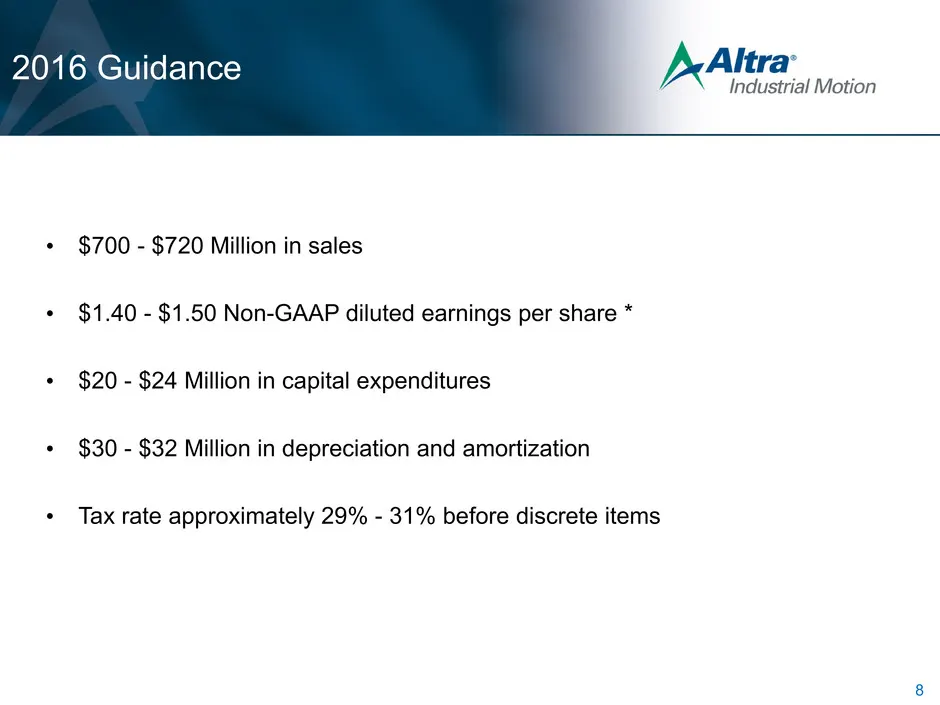
2016 Guidance • $700 - $720 Million in sales • $1.40 - $1.50 Non-GAAP diluted earnings per share * • $20 - $24 Million in capital expenditures • $30 - $32 Million in depreciation and amortization • Tax rate approximately 29% - 31% before discrete items 8
Slide 10: Business Simplification On Track
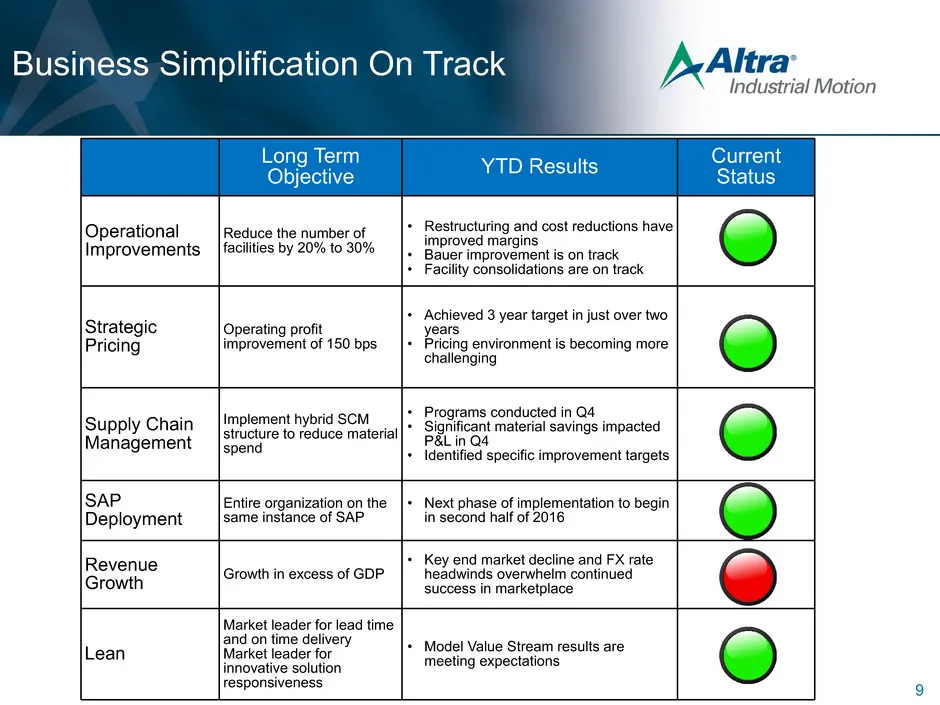
Business Simplification On Track 9 Long Term Objective YTD Results Current Status Operational Improvements Reduce the number of facilities by 20% to 30% • Restructuring and cost reductions have improved margins • Bauer improvement is on track • Facility consolidations are on track Strategic Pricing
Slide 11: Discussion of Non-GAAP Measures
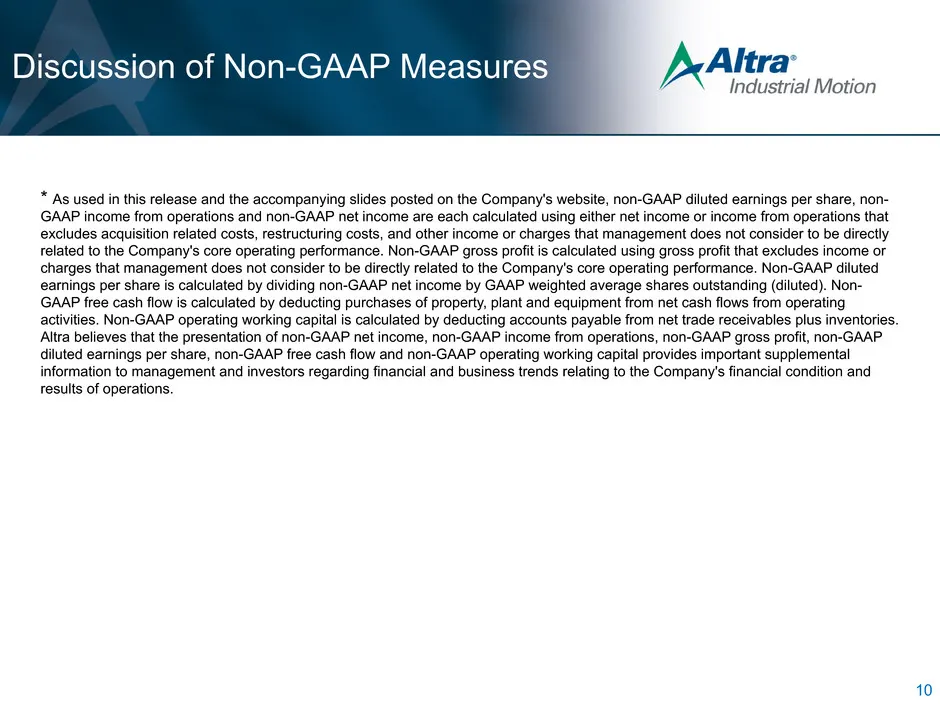
Discussion of Non-GAAP Measures * As used in this release and the accompanying slides posted on the Company's website, non-GAAP diluted earnings per share, non- GAAP income from operations and non-GAAP net income are each calculated using either net income or income from operations that excludes acq
Slide 12: Appendix Non-GAAP Measures
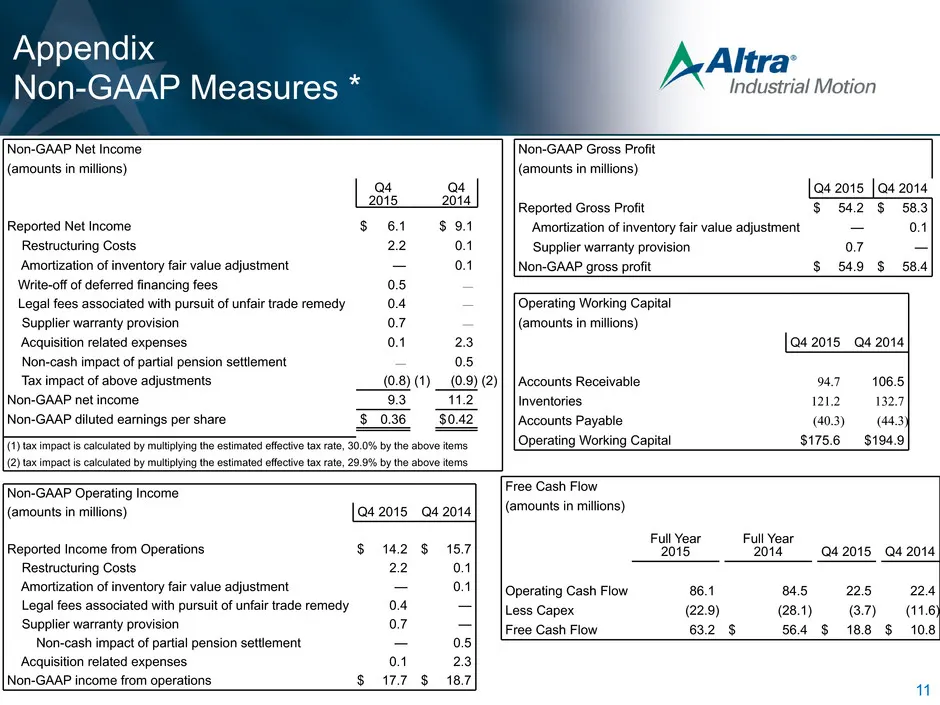
Appendix Non-GAAP Measures * 11 Non-GAAP Net Income (amounts in millions) Q4 2015 Q4 2014 Reported Net Income $ 6.1 $ 9.1 Restructuring Costs 2.2 0.1 Amortization of inventory fair value adjustment — 0.1 Write-off of deferred financing fees 0.5 — Legal fees associated with pursuit of unfair trade re
Source: SEC EDGAR · 8-K filed Feb 17, 2016
More decks from Altra Industrial Motion Corp
 Q2 2022 Earnings Presentation25 slides · Jul 28, 2022
 Q1 2022 Earnings Presentation25 slides · Apr 28, 2022
 Investor Day (March 2022)135 slides · Mar 11, 2022
 Q4 2021 Earnings Presentation17 slides · Feb 16, 2022
 Q3 2021 Earnings Presentation16 slides · Oct 22, 2021
 Q2 2021 Earnings Presentation16 slides · Jul 23, 2021