Cvent — Dragoneer Growth Opportunities Corp. II — SPAC Merger (November 2021)
87 slides from Cvent's SPAC merger presentation, Nov 3, 2021
Slide 1: Investor Roadshow November 2021
Investor Roadshow November 2021
Slide 2: Disclaimers and Other Important Information
Disclaimers and Other Important Information Disclaimer This presentation (this “Presentation”) is provided for informational purposes only and has been prepared to assist interested parties in making their own evaluation with respect to a potential business combination between Papay Topco, Inc. (“Cv
Slide 3: Forward-Looking Statements
Forward-Looking Statements This Presentation contains certain forward-looking statements, including statements regarding the benefits of the Potential Business Combination, the anticipated timing of the Potential Business Combination, the products and services offered by Cvent and the markets in whi
Slide 4: Use of Projections
Use of Projections This Presentation contains projected financial information with respect to Cvent. Such projected financial information constitutes forward-looking information, and is for illustrative purposes only and should not be relied upon as necessarily being indicative of future results. Th
Slide 5: Trademarks
Trademarks This Presentation contains trademarks, service marks, tradenames and copyrights of Cvent, Dragoneer and other companies, which are the property of their respective owners. The use herein does not imply an affiliation with, or endorsement by, the owners of these service marks, trademarks a
Slide 6: Agenda
Agenda 1 Introduction 2 Cvent At A Glance 3 Industry Transforming 4 Massive TAM Expansion 5 How We Win 6 Finance 6
Slide 7: Today's Presenters
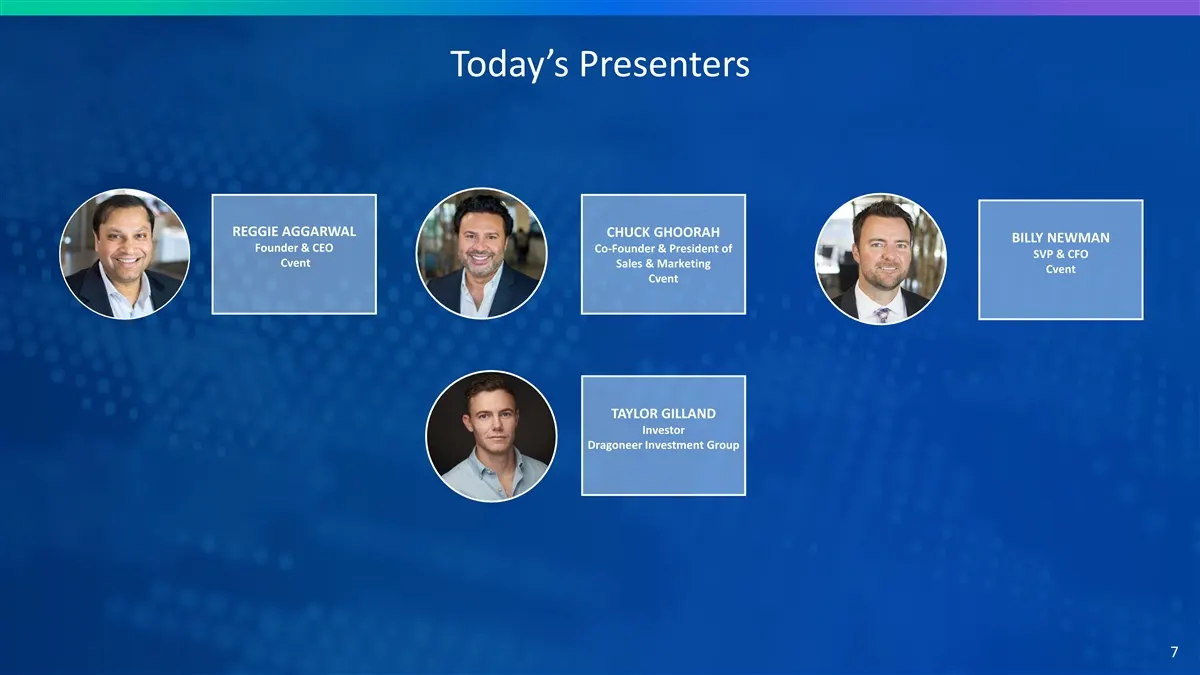
Today’s Presenters REGGIE AGGARWAL CHUCK GHOORAH BILLY NEWMAN Founder & CEO Co-Founder & President of SVP & CFO Cvent Sales & Marketing Cvent Cvent TAYLOR GILLAND Investor Dragoneer Investment Group 7
Slide 8: Dragoneer Investment Group Overview
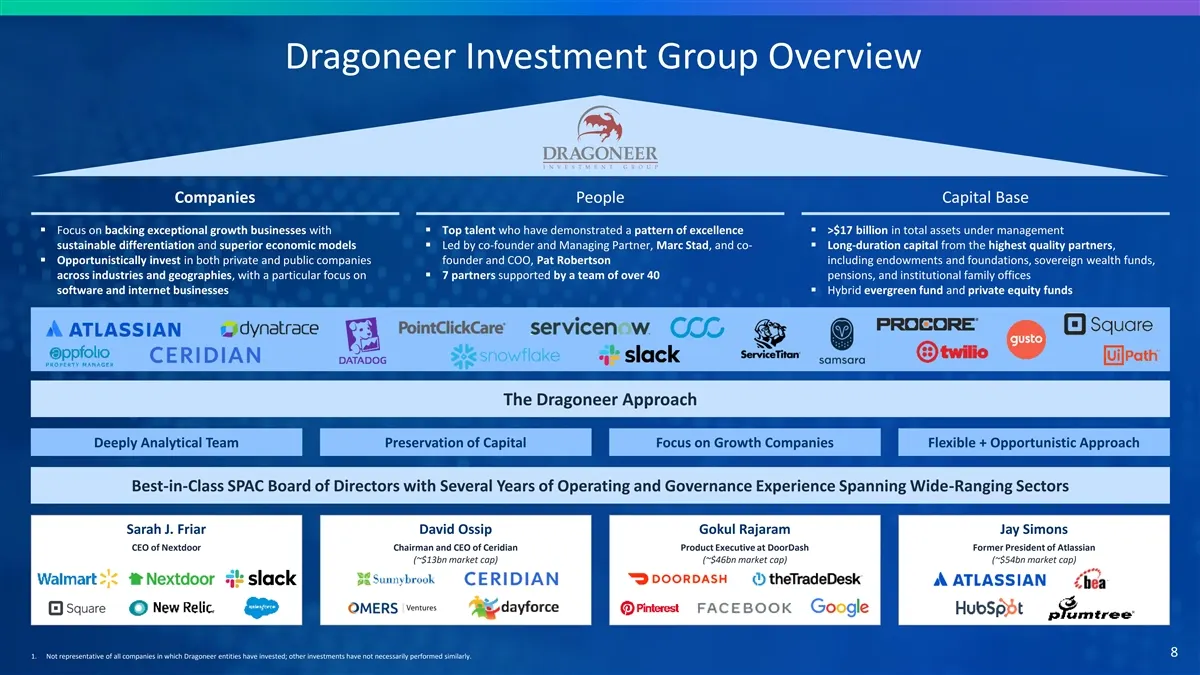
Dragoneer Investment Group Overview Companies People Capital Base ▪ Focus on backing exceptional growth businesses with ▪ Top talent who have demonstrated a pattern of excellence▪ >$17 billion in total assets under management sustainable differentiation and superior economic models▪ Led by co-founde
Slide 9: Cvent and Dragoneer: A Partnership of Excellence
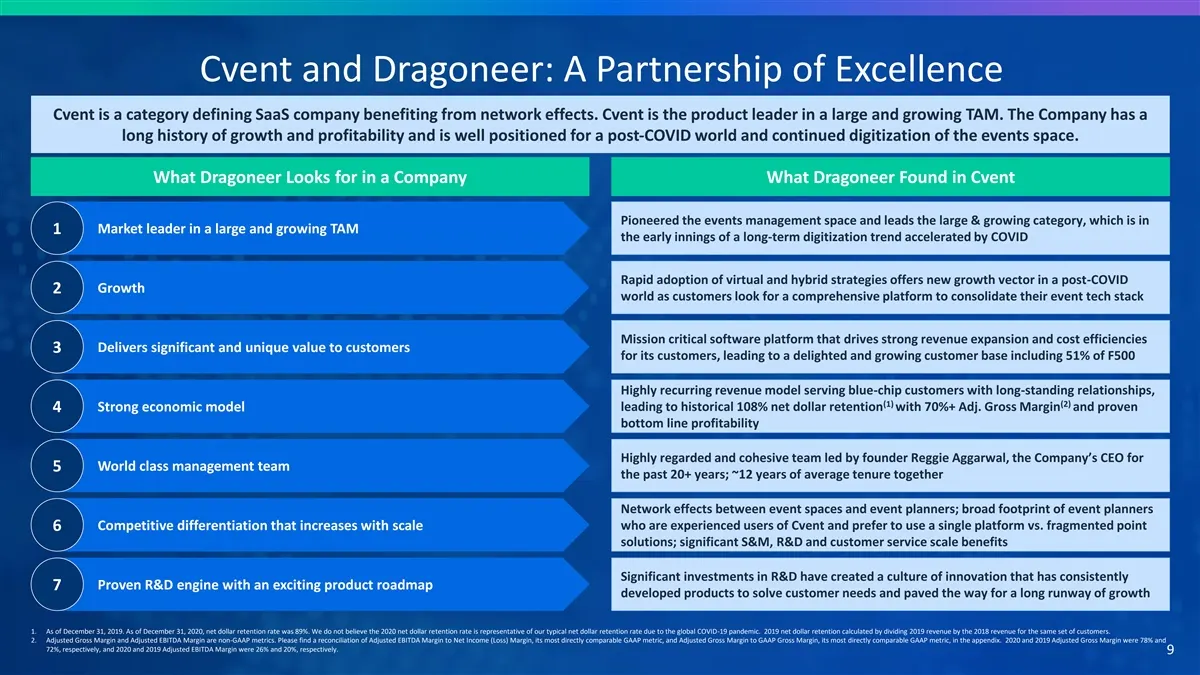
Cvent and Dragoneer: A Partnership of Excellence Cvent is a category defining SaaS company benefiting from network effects. Cvent is the product leader in a large and growing TAM. The Company has a long history of growth and profitability and is well positioned for a post-COVID world and continued d
Slide 10: What Customers Are Saying About Cvent
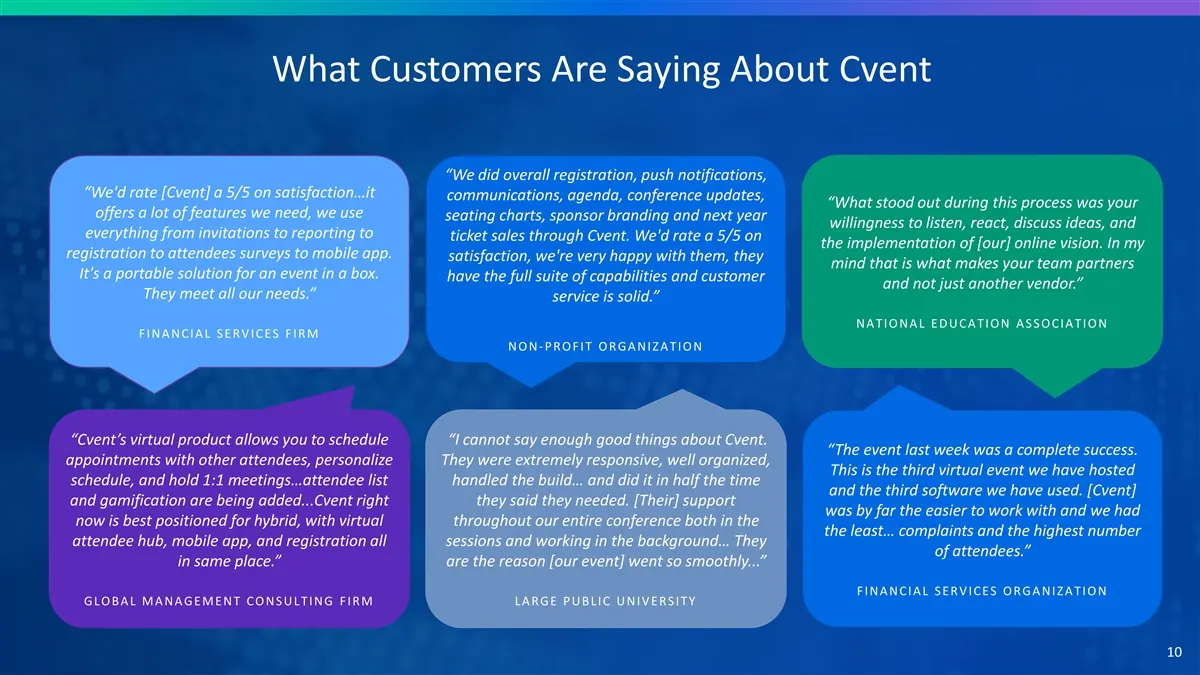
What Customers Are Saying About Cvent “We did overall registration, push notifications, “We'd rate [Cvent] a 5/5 on satisfaction…it communications, agenda, conference updates, “What stood out during this process was your offers a lot of features we need, we use seating charts, sponsor branding and n
Slide 11: Attractive Valuation Represents a Compelling Entry Point
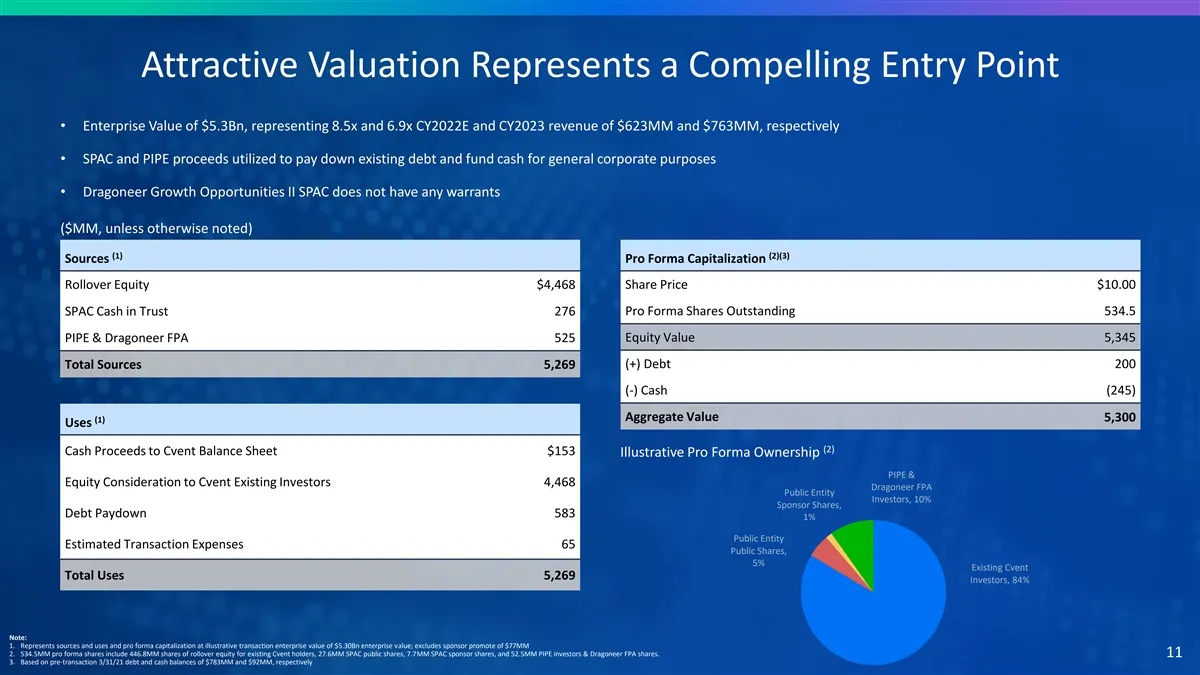
Attractive Valuation Represents a Compelling Entry Point • Enterprise Value of $5.3Bn, representing 8.5x and 6.9x CY2022E and CY2023 revenue of $623MM and $763MM, respectively • SPAC and PIPE proceeds utilized to pay down existing debt and fund cash for general corporate purposes • Dragoneer Growth
Slide 12: Agenda
Agenda 1 Introduction 2 Cvent At A Glance 3 Industry Transforming 4 Massive TAM Expansion 5 How We Win 6 Finance 12
Slide 13: What Does Cvent Do?
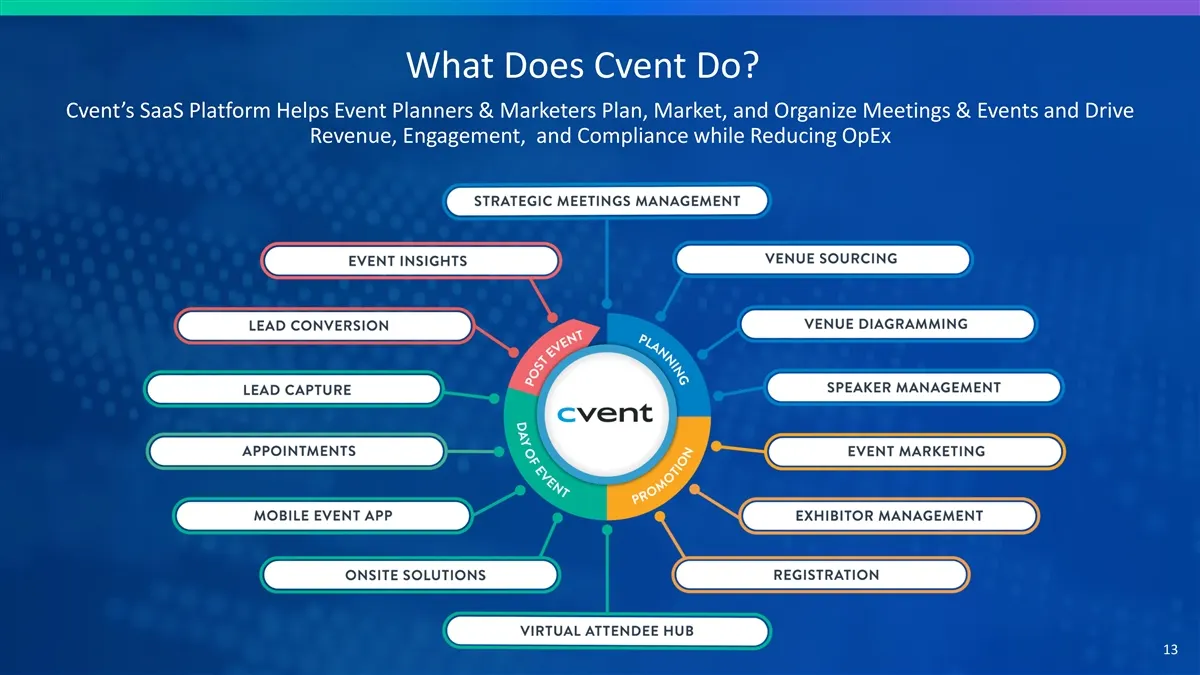
What Does Cvent Do? Cvent’s SaaS Platform Helps Event Planners & Marketers Plan, Market, and Organize Meetings & Events and Drive Revenue, Engagement, and Compliance while Reducing OpEx 13
Slide 14: Going From Public to Private to Public
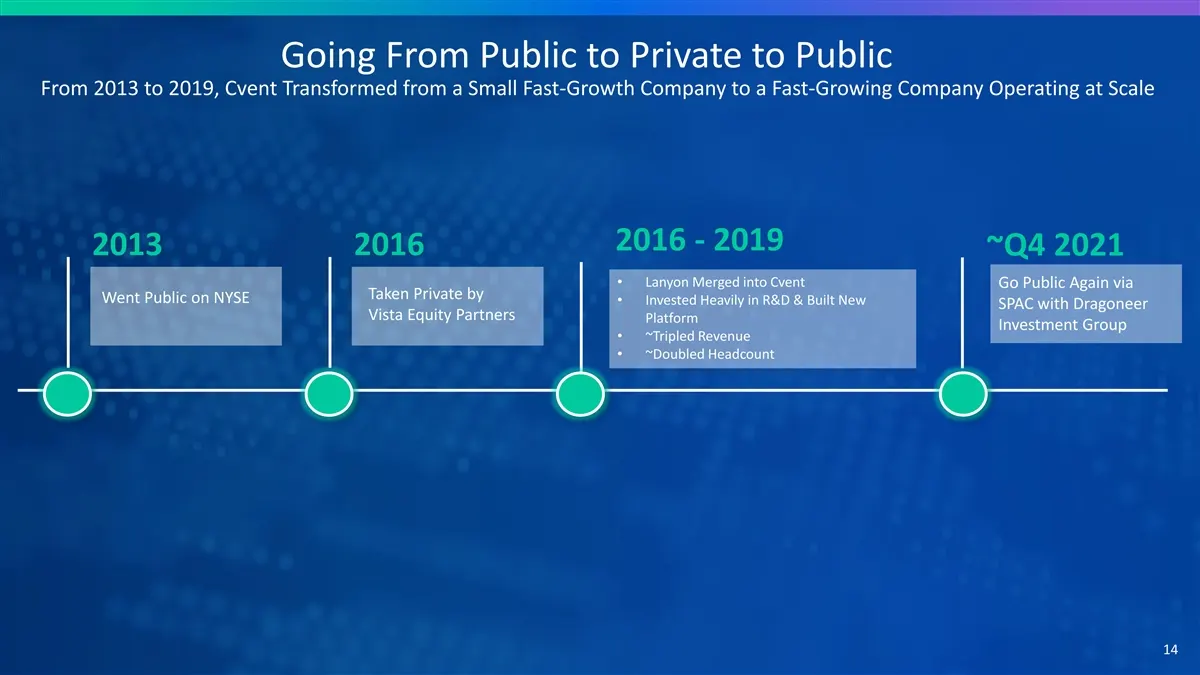
Going From Public to Private to Public From 2013 to 2019, Cvent Transformed from a Small Fast-Growth Company to a Fast-Growing Company Operating at Scale 2016 - 2019 2013 2016 ~Q4 2021 • Lanyon Merged into Cvent Go Public Again via Taken Private by Went Public on NYSE • Invested Heavily in R&D & Bui
Slide 15: Platform Expansion While Private with Vista
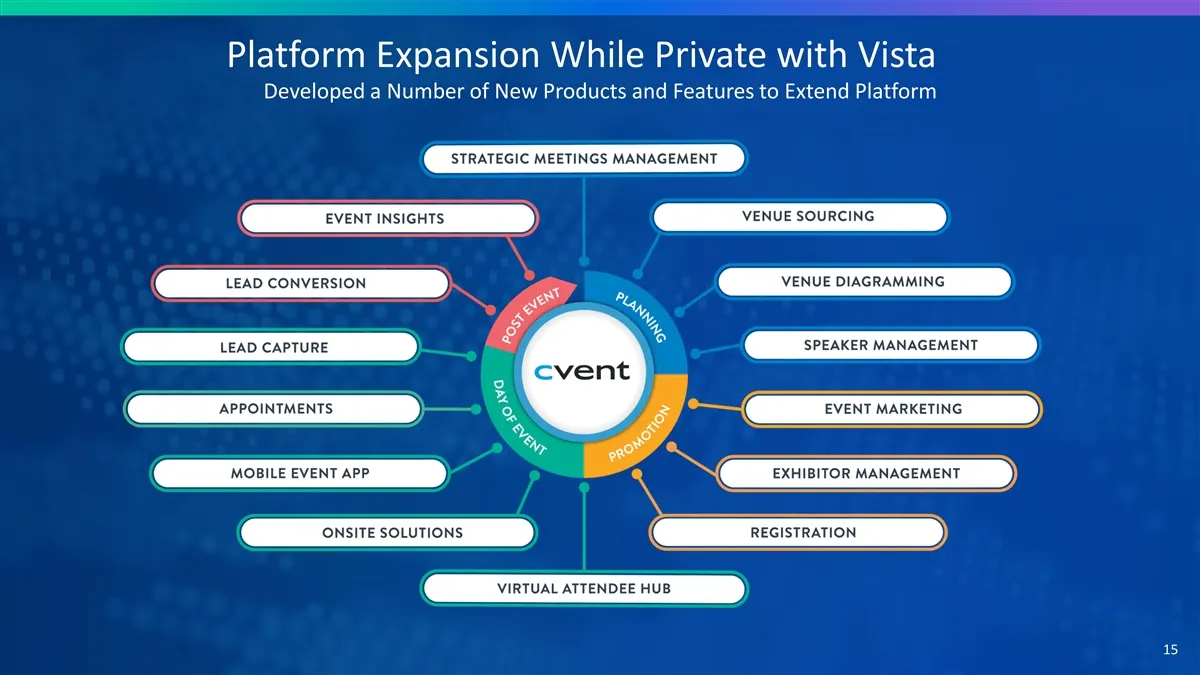
Platform Expansion While Private with Vista Developed a Number of New Products and Features to Extend Platform 15
Slide 16: Platform Expansion While Private with Vista
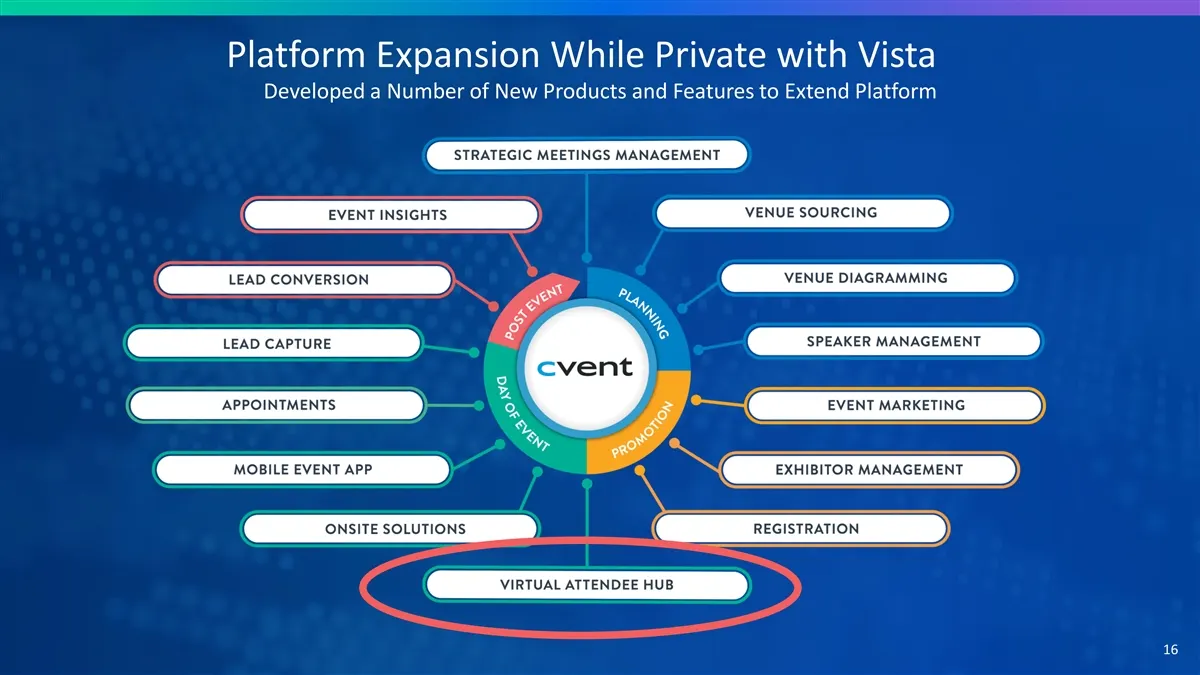
Platform Expansion While Private with Vista Developed a Number of New Products and Features to Extend Platform 16
Slide 17: 2016 Public Company vs. Cvent Pre Pandemic
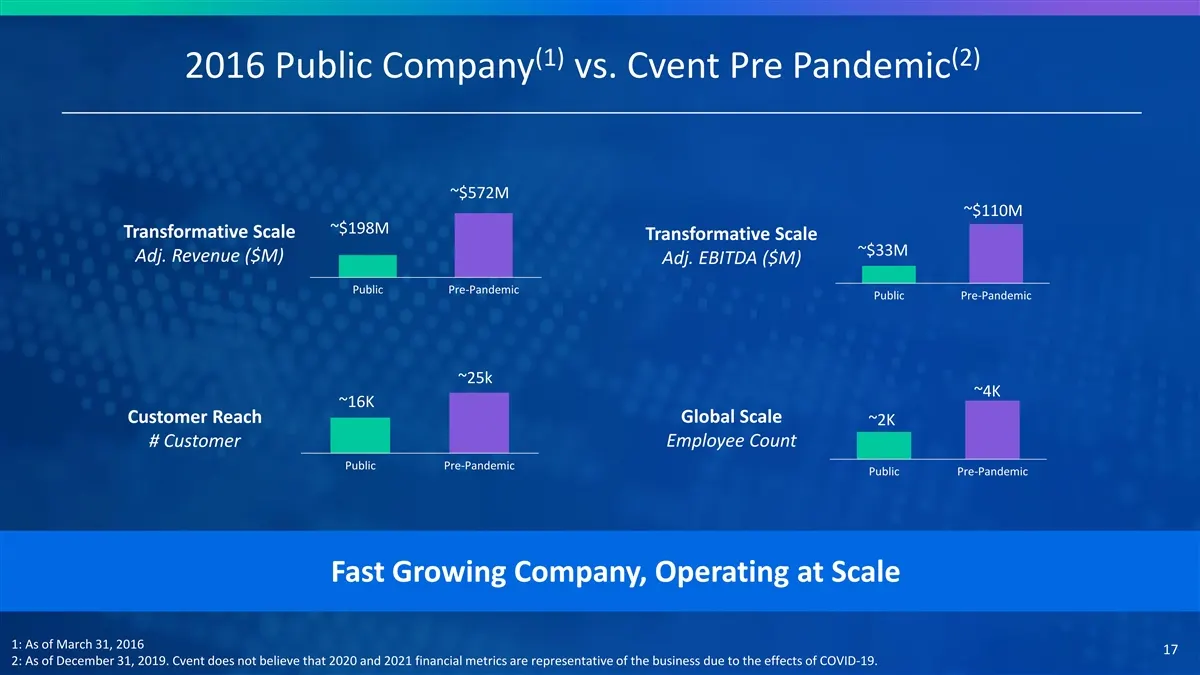
(1) (2) 2016 Public Company vs. Cvent Pre Pandemic ~$572M ~$110M ~$198M Transformative Scale Transformative Scale ~$33M Adj. Revenue ($M) Adj. EBITDA ($M) Public Pre-Pandemic Public Pre-Pandemic ~25k ~4K ~16K Global Scale Customer Reach ~2K Employee Count # Customer Public Pre-Pandemic Public Pre-Pa
Slide 18: Cvent at a Glance
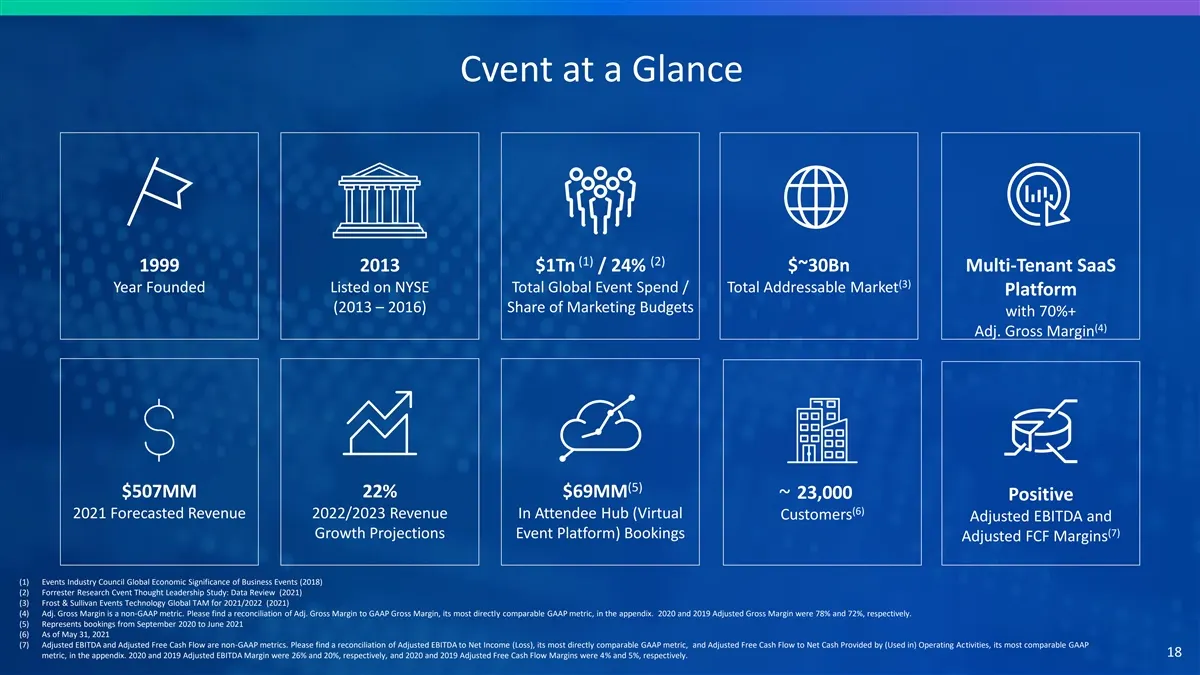
Cvent at a Glance (1) (2) 1999 2013 $1Tn / 24% $~30Bn Multi-Tenant SaaS (3) Year Founded Listed on NYSE Total Global Event Spend / Total Addressable Market Platform (2013 – 2016) Share of Marketing Budgets with 70%+ (4) Adj. Gross Margin (5) $507MM 22% $69MM 23,000 Positive ~ (6) 2021 Forecasted Rev
Slide 19: Cvent Adjusted Revenue Projections
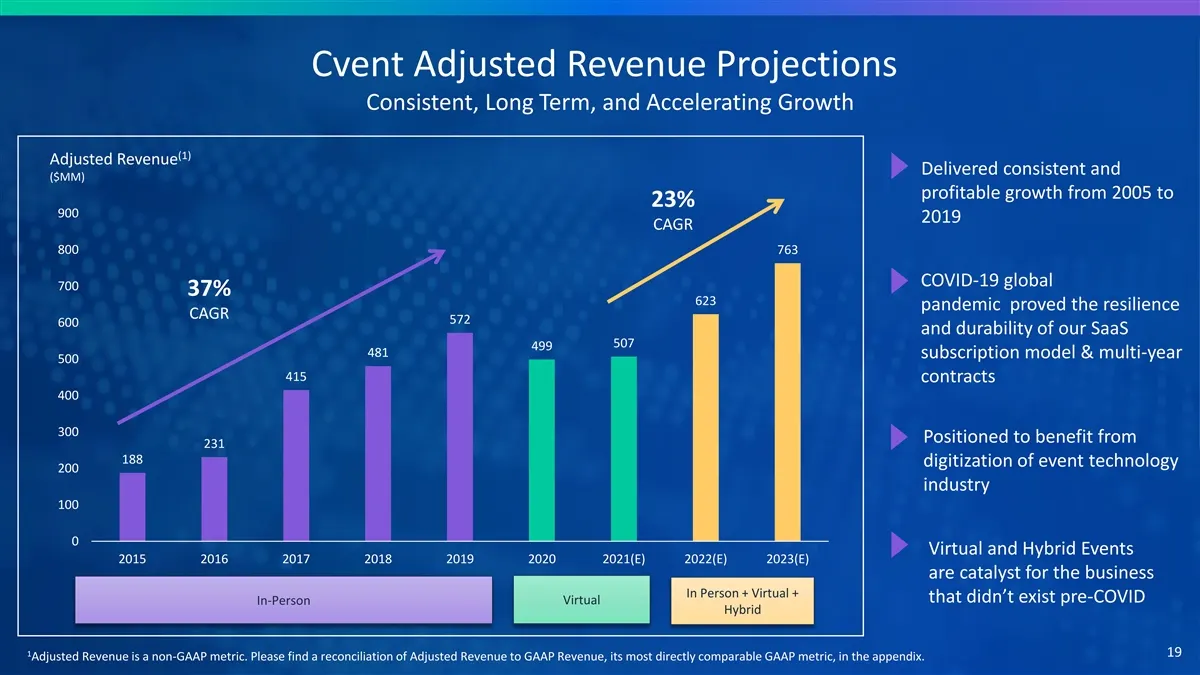
Cvent Adjusted Revenue Projections Consistent, Long Term, and Accelerating Growth (1) Adjusted Revenue Delivered consistent and ($MM) profitable growth from 2005 to 23% 900 2019 CAGR 800 763 COVID-19 global 700 37% 623 pandemic proved the resilience CAGR 572 600 and durability of our SaaS 507 499 48
Slide 20: Investment Thesis
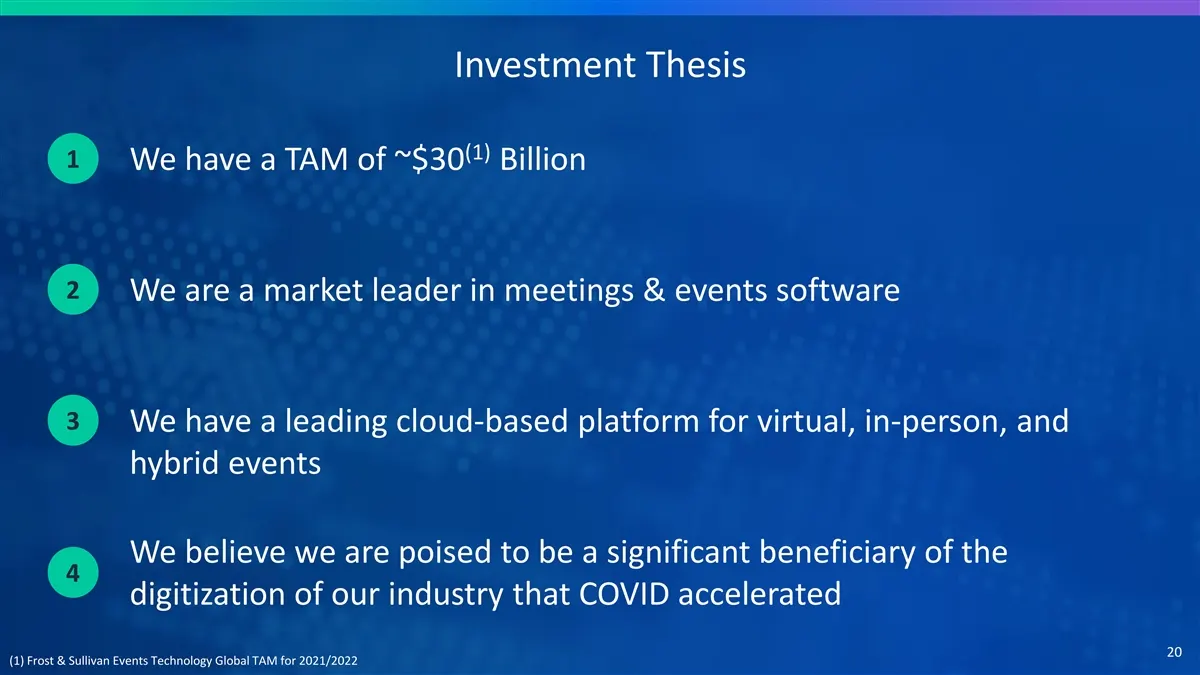
Investment Thesis (1) 1 We have a TAM of ~$30 Billion 2 We are a market leader in meetings & events software 3 We have a leading cloud-based platform for virtual, in-person, and hybrid events We believe we are poised to be a significant beneficiary of the 4 digitization of our industry that COVID ac

Slide 21: $1 Trillion Global Spend On Business Meetings & Events
$1 Trillion Global Spend On (1) BUSINESS MEETINGS & EVENTS (1): Events Industry Council Global Economic Significance of Business Events (2018); includes spending to plan and produce business events, business events-related travel, and other direct spending, such as 21 spending by exhibitors
Slide 22: Meetings and Events: Foundational to Enterprise Spend
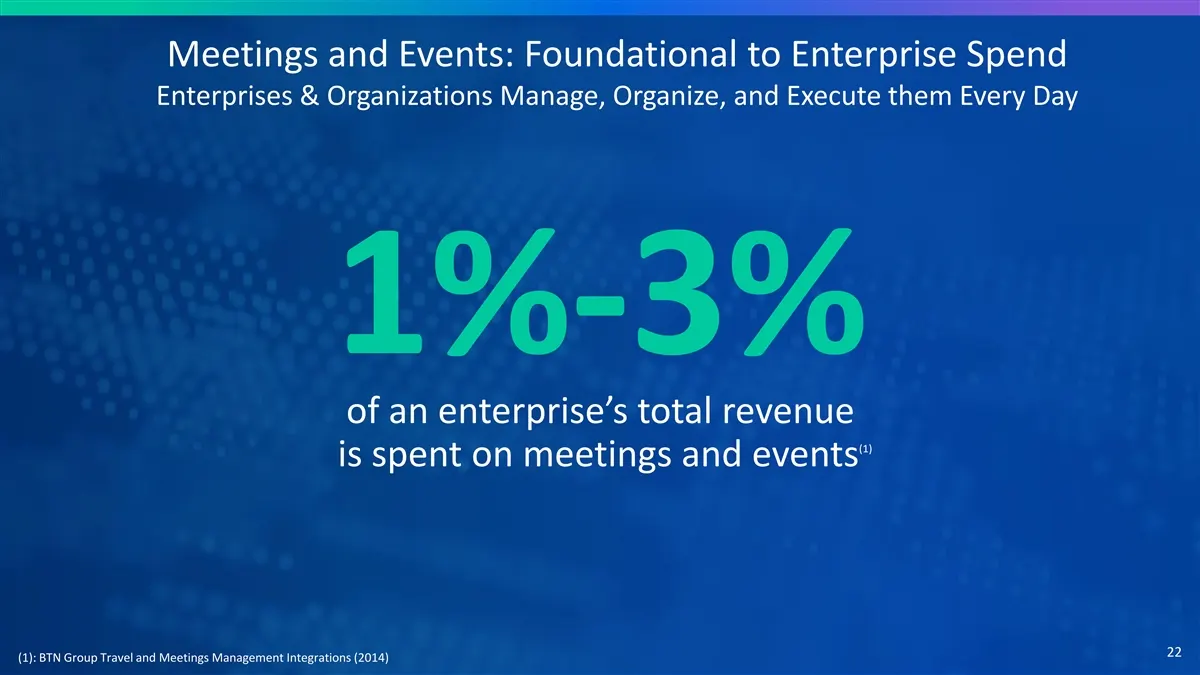
Meetings and Events: Foundational to Enterprise Spend Enterprises & Organizations Manage, Organize, and Execute them Every Day 1%-3% of an enterprise’s total revenue (1) is spent on meetings and events 22 (1): BTN Group Travel and Meetings Management Integrations (2014)
Slide 23: How Much Do Corporations Spend on Meetings?
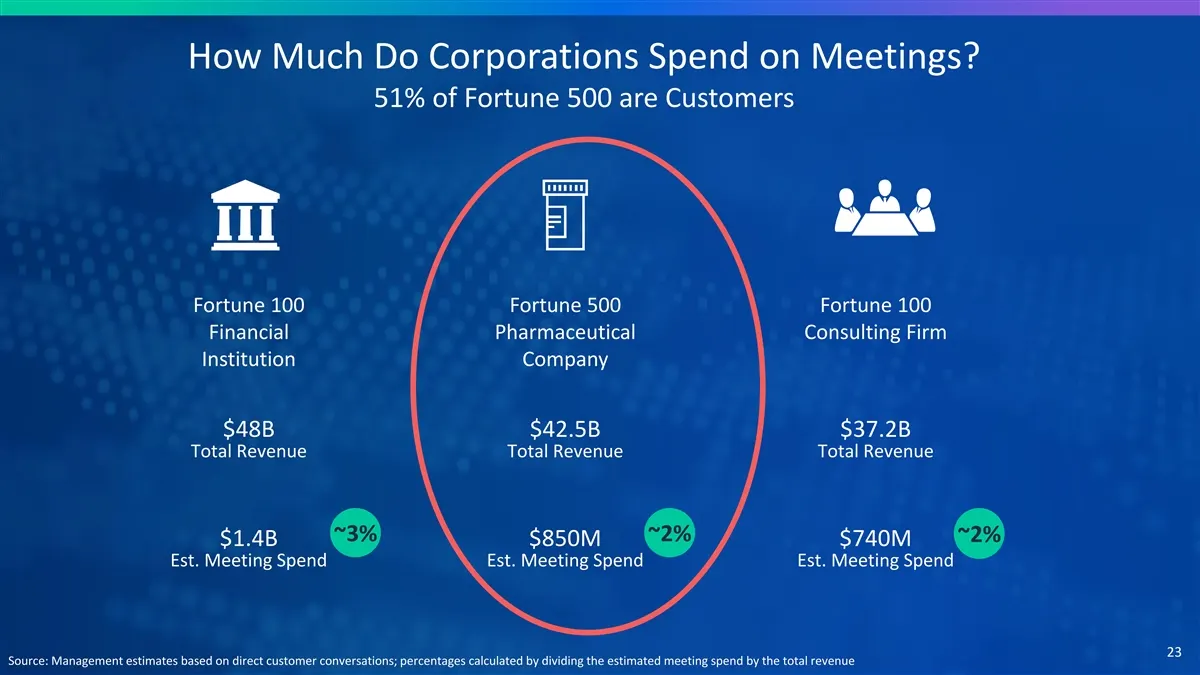
How Much Do Corporations Spend on Meetings? 51% of Fortune 500 are Customers Fortune 100 Fortune 500 Fortune 100 Financial Pharmaceutical Consulting Firm Institution Company $48B $42.5B $37.2B Total Revenue Total Revenue Total Revenue ~3% ~2% ~2% $1.4B $850M $740M Est. Meeting Spend Est. Meeting Spe
Slide 24: Meetings and Events Drive Customer & Prospect Engagement
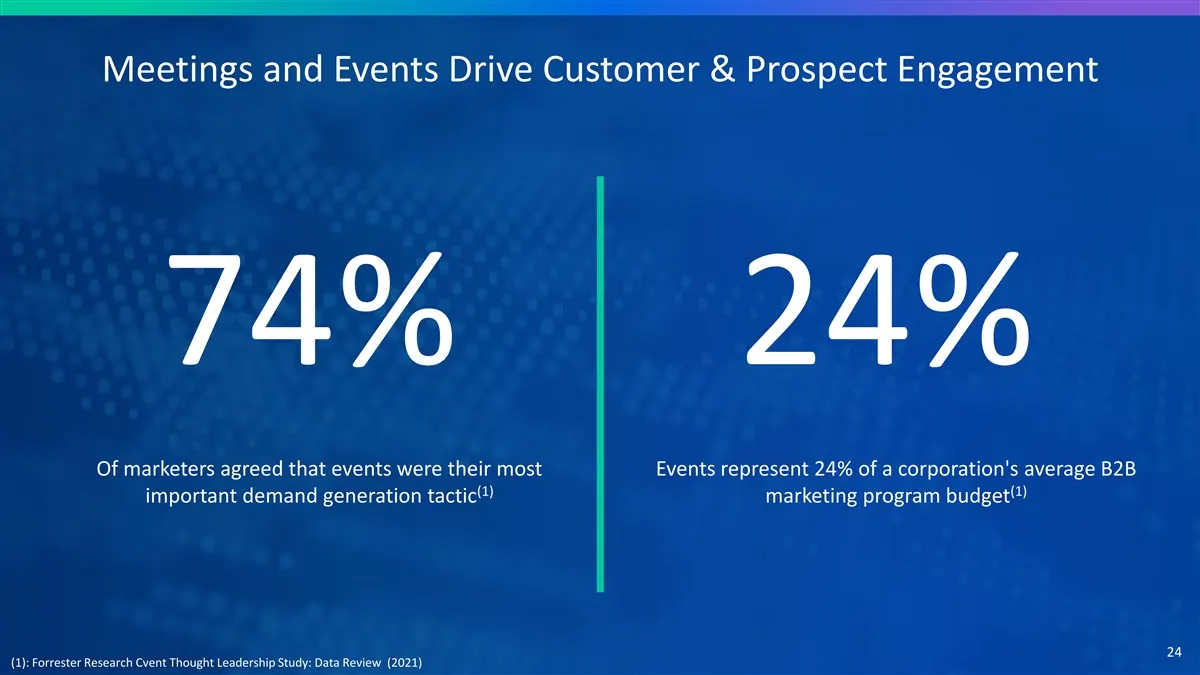
Meetings and Events Drive Customer & Prospect Engagement 74% 24% Of marketers agreed that events were their most Events represent 24% of a corporation's average B2B (1) (1) important demand generation tactic marketing program budget 24 (1): Forrester Research Cvent Thought Leadership Study: Data Rev
Slide 25: Digitizing the Event Industry: Cvent's Virtual Attendee Hub
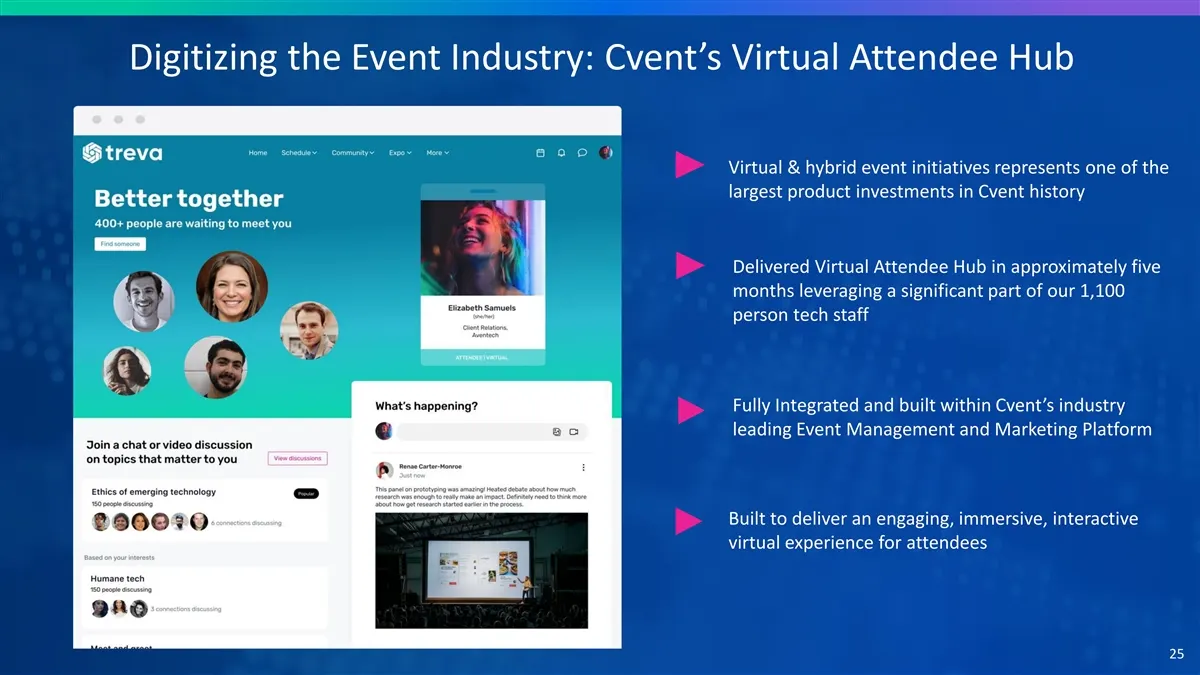
Digitizing the Event Industry: Cvent’s Virtual Attendee Hub Virtual & hybrid event initiatives represents one of the largest product investments in Cvent history Delivered Virtual Attendee Hub in approximately five months leveraging a significant part of our 1,100 person tech staff Fully Integrated
Slide 26: Virtual-Related Bookings
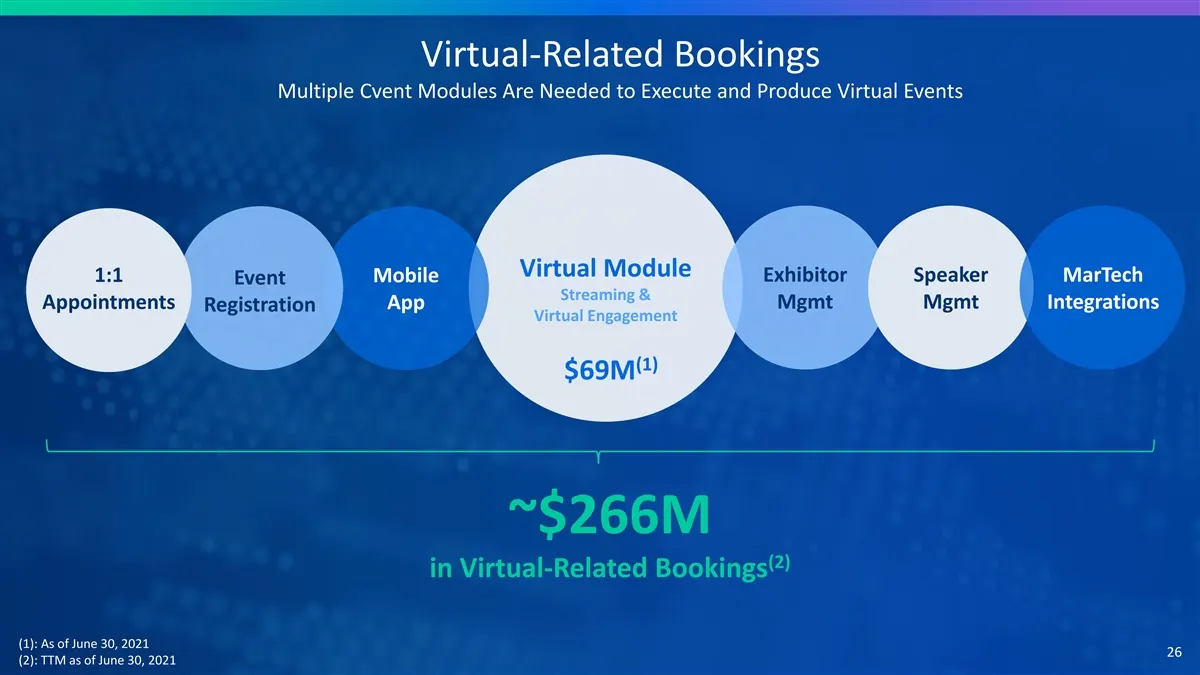
Virtual-Related Bookings Multiple Cvent Modules Are Needed to Execute and Produce Virtual Events Virtual Module Exhibitor Speaker 1:1 Mobile MarTech Event Streaming & Appointments Mgmt Mgmt Integrations App Registration Virtual Engagement (1) $69M ~$266M (2) in Virtual-Related Bookings (1): As of Ju
Slide 27: New Growth Vector: Virtual & Hybrid Events
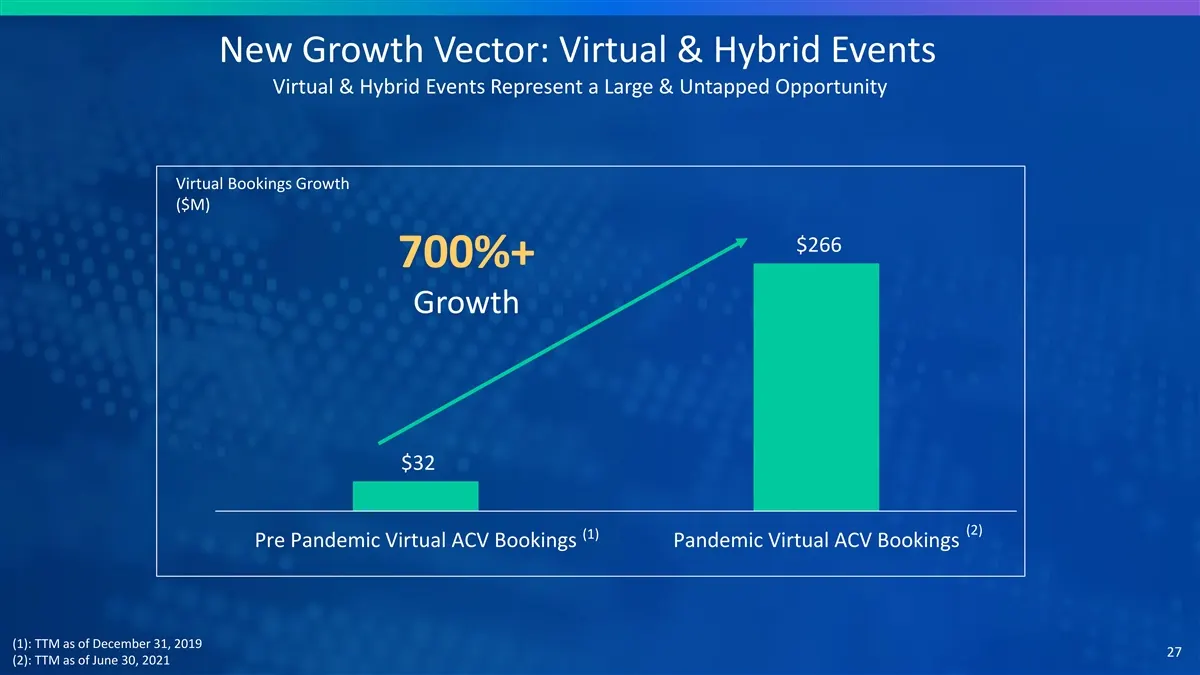
New Growth Vector: Virtual & Hybrid Events Virtual & Hybrid Events Represent a Large & Untapped Opportunity Virtual Bookings Growth ($M) $266 700%+ Growth $32 (2) (1) Pre Pandemic Virtual ACV Bookings Pandemic Virtual ACV Bookings (1): TTM as of December 31, 2019 27 (2): TTM as of June 30, 2021
Slide 28: Event Delivery Models Have Different Advantages
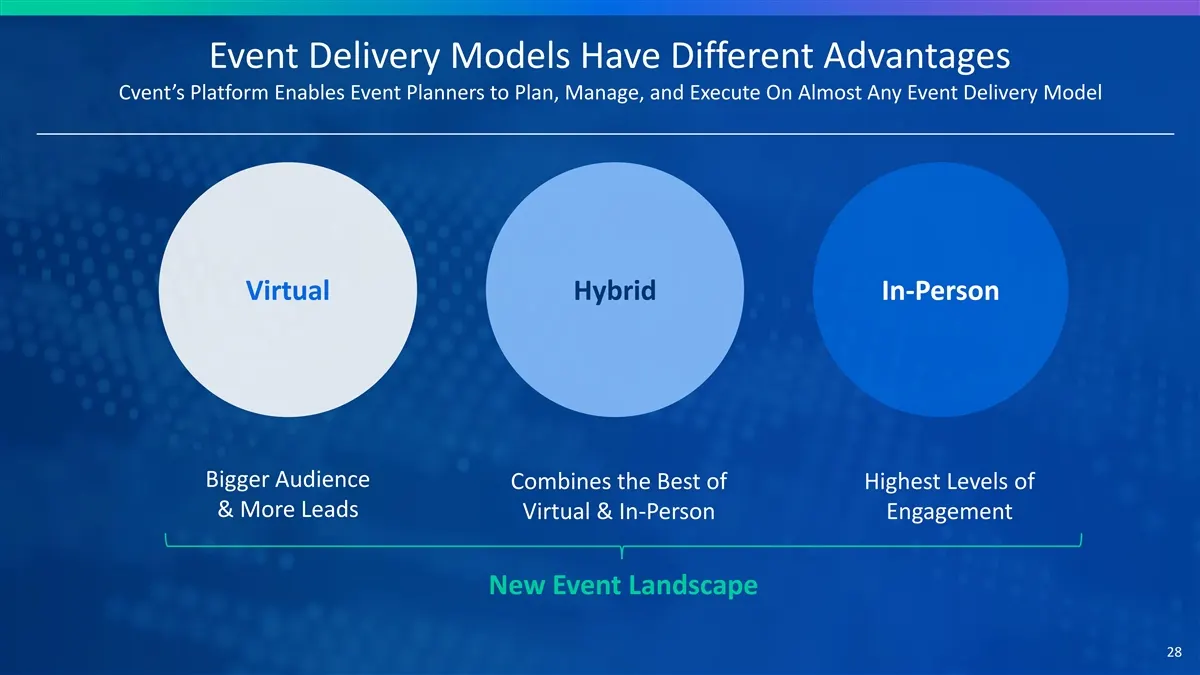
Event Delivery Models Have Different Advantages Cvent’s Platform Enables Event Planners to Plan, Manage, and Execute On Almost Any Event Delivery Model Virtual Hybrid In-Person Bigger Audience Combines the Best of Highest Levels of & More Leads Virtual & In-Person Engagement New Event Landscape 28
Slide 29: Bigger Transformation Is Around the Corner
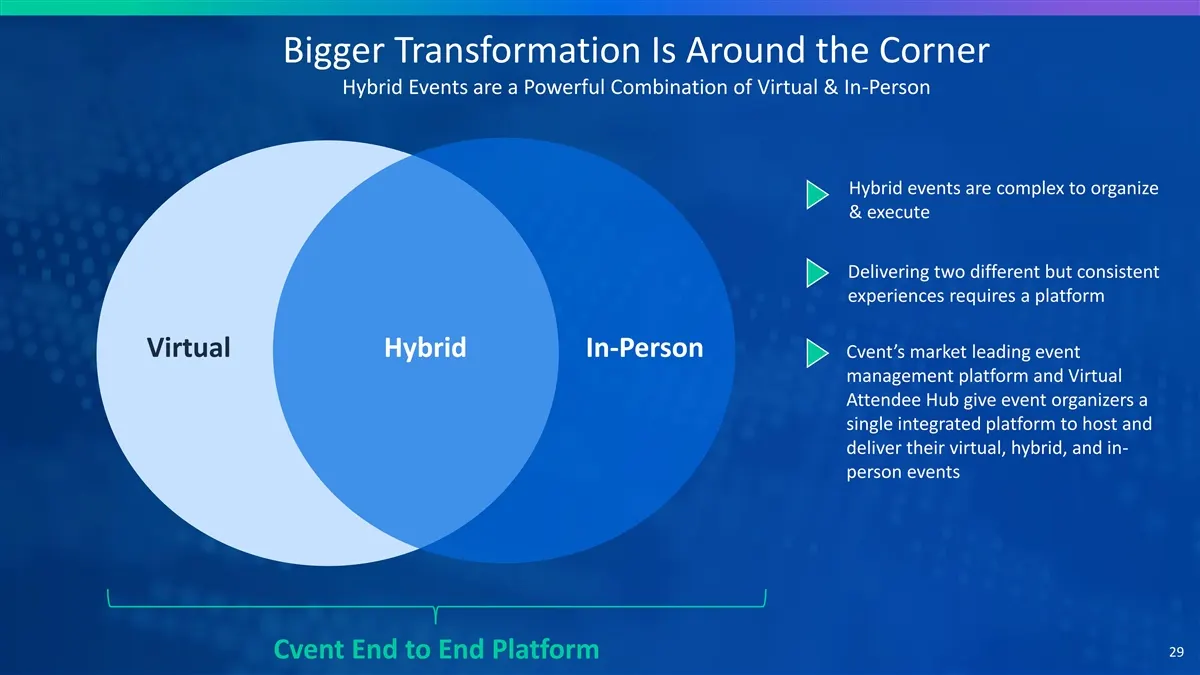
Bigger Transformation Is Around the Corner Hybrid Events are a Powerful Combination of Virtual & In-Person Hybrid events are complex to organize & execute Delivering two different but consistent experiences requires a platform Virtual Hybrid In-Person Cvent’s market leading event management platform
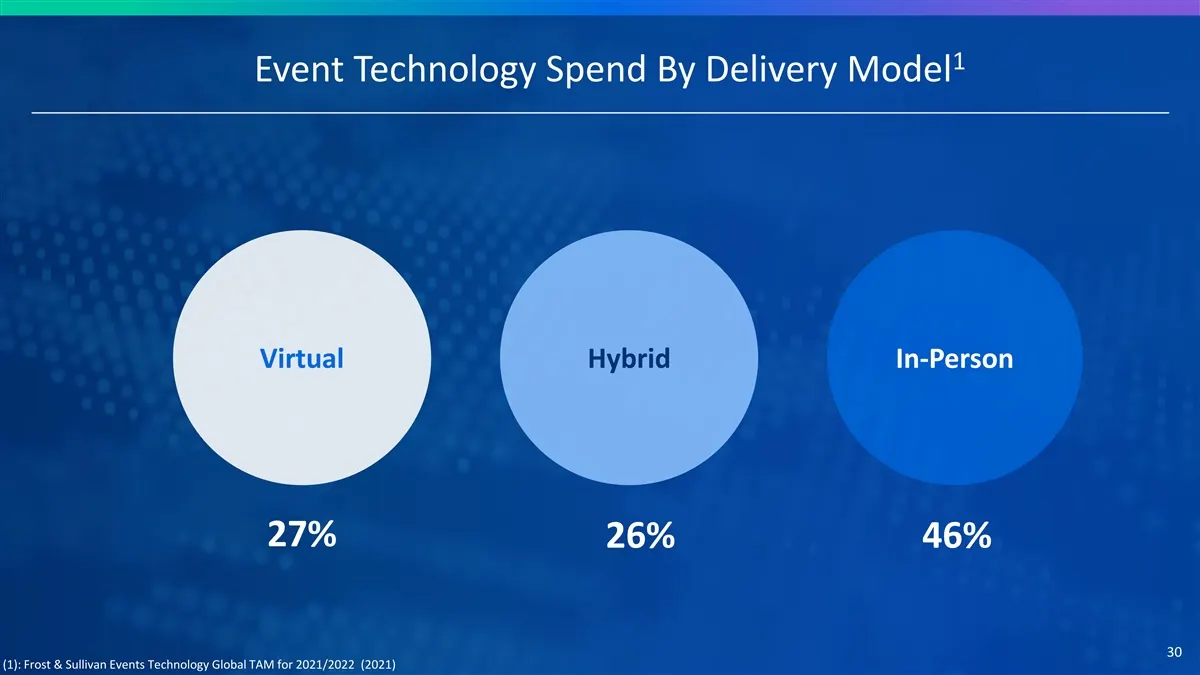
Slide 30: Event Technology Spend By Delivery Model
1 Event Technology Spend By Delivery Model Virtual Hybrid In-Person 27% 26% 46% 30 (1): Frost & Sullivan Events Technology Global TAM for 2021/2022 (2021)
Slide 31: Agenda
Agenda 1 Introduction 2 Cvent At A Glance 3 Industry Transforming 4 Massive TAM Expansion 5 Platform Overview 6 Finance 31
Slide 32: Virtual and Hybrid Trends
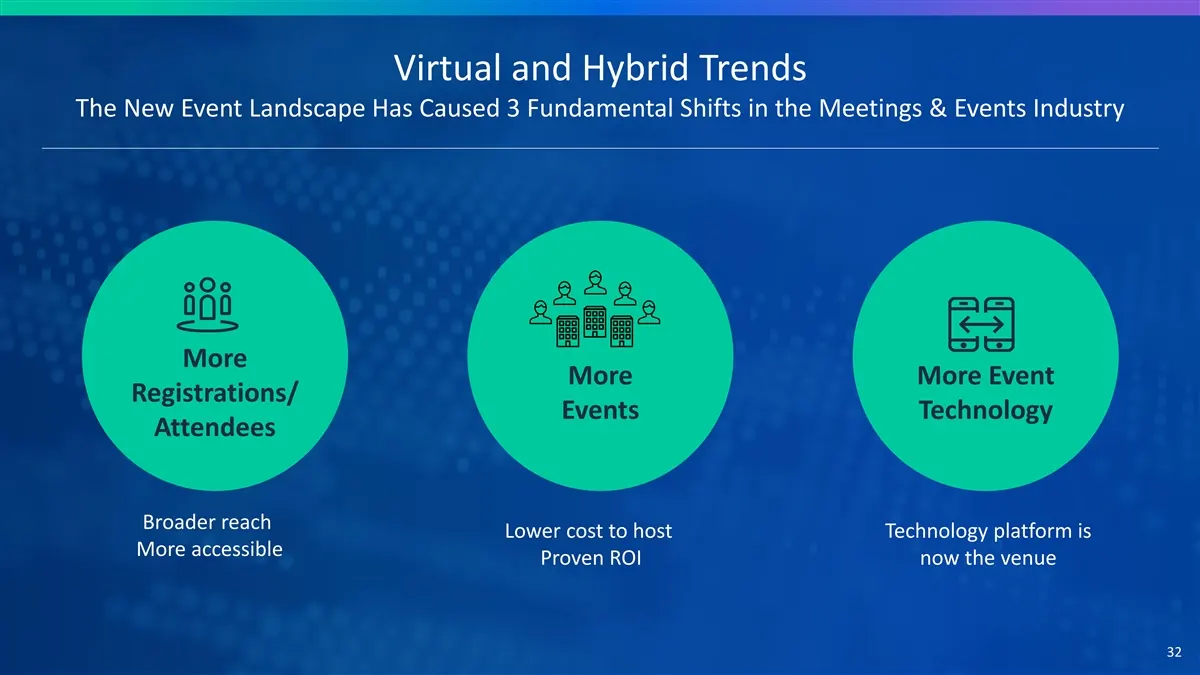
Virtual and Hybrid Trends The New Event Landscape Has Caused 3 Fundamental Shifts in the Meetings & Events Industry More More More Event Registrations/ Events Technology Attendees Broader reach Lower cost to host Technology platform is More accessible Proven ROI now the venue 32
Slide 33: The Digital Transformation of the Event Industry Has Created a Large TAM
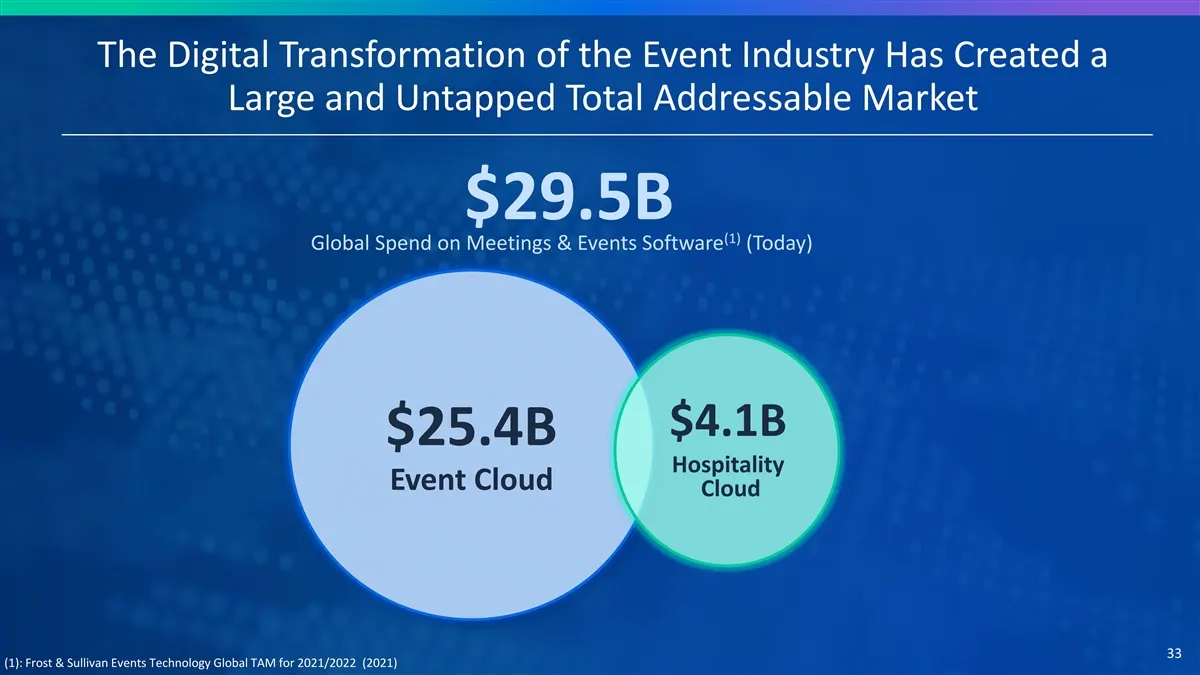
The Digital Transformation of the Event Industry Has Created a Large and Untapped Total Addressable Market $29.5B (1) Global Spend on Meetings & Events Software (Today) $4.1B $25.4B Hospitality Event Cloud Cloud 33 (1): Frost & Sullivan Events Technology Global TAM for 2021/2022 (2021)
Slide 34: Event Cloud TAM by Event Delivery Model
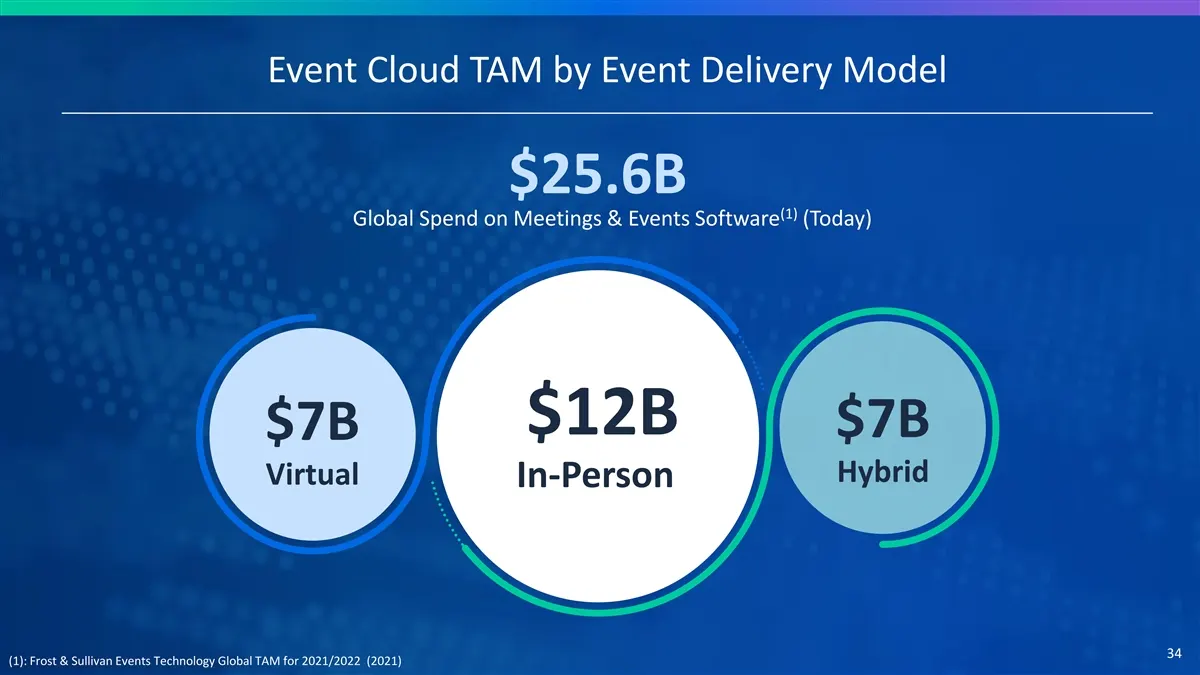
Event Cloud TAM by Event Delivery Model $25.6B (1) Global Spend on Meetings & Events Software (Today) $12B $7B $7B Hybrid Virtual In-Person Total Worldwide Opportunity 34 (1): Frost & Sullivan Events Technology Global TAM for 2021/2022 (2021)
Slide 35: Virtual and Hybrid Trends
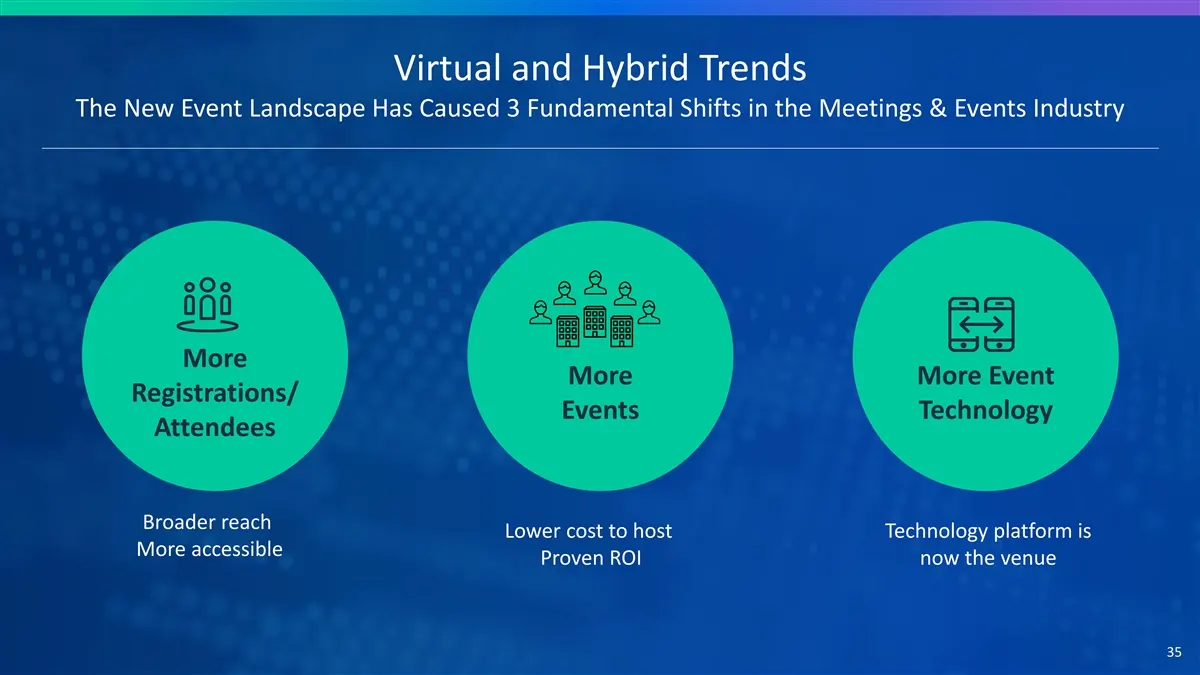
Virtual and Hybrid Trends The New Event Landscape Has Caused 3 Fundamental Shifts in the Meetings & Events Industry More More More Event Registrations/ Events Technology Attendees Broader reach Lower cost to host Technology platform is More accessible Proven ROI now the venue 35
Slide 36: More Event Technology
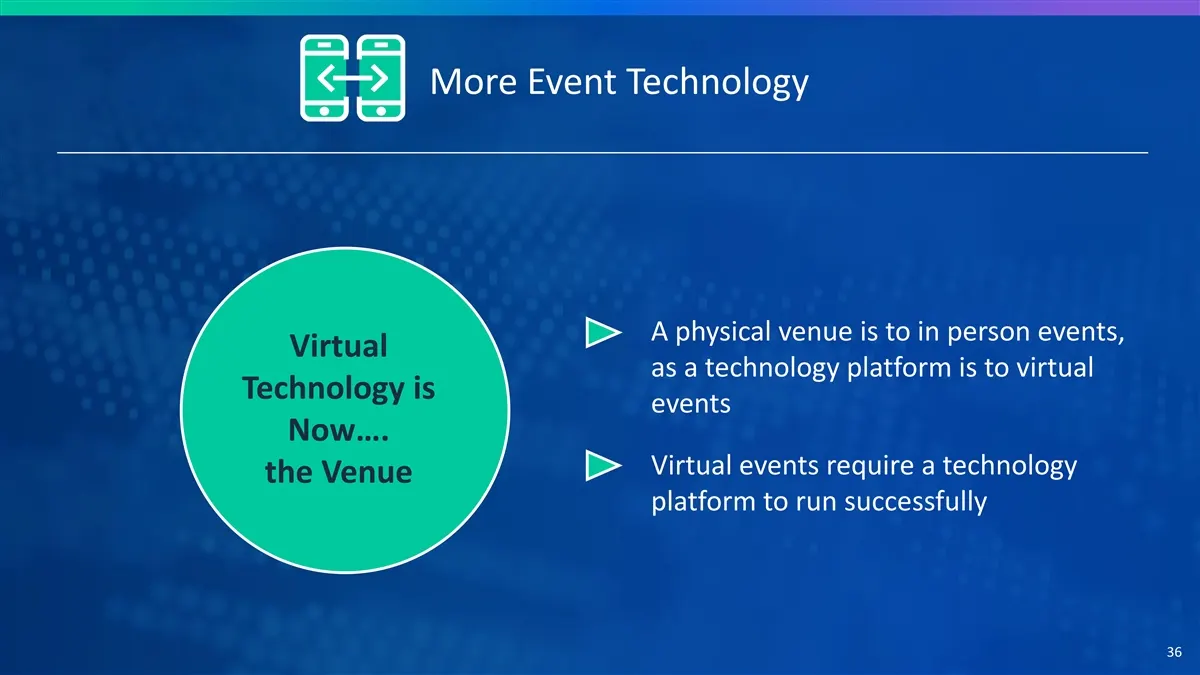
More Event Technology A physical venue is to in person events, Virtual as a technology platform is to virtual Technology is events Now…. Virtual events require a technology the Venue platform to run successfully 36
Slide 37: More Events Case Study: A US Based Association
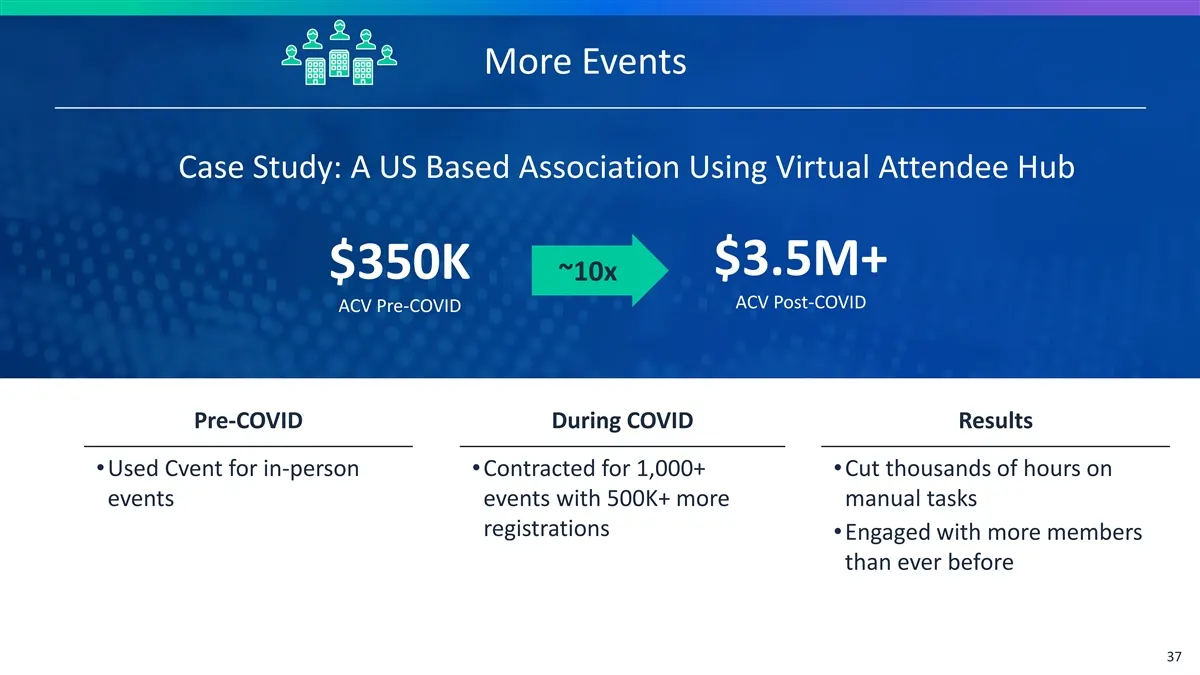
More Events Case Study: A US Based Association Using Virtual Attendee Hub $3.5M+ $350K ~10x ACV Post-COVID ACV Pre-COVID Pre-COVID During COVID Results •Used Cvent for in-person •Contracted for 1,000+ •Cut thousands of hours on events events with 500K+ more manual tasks registrations •Engaged with m
Slide 38: Attendee Hub as a Customer Impact Multiplier
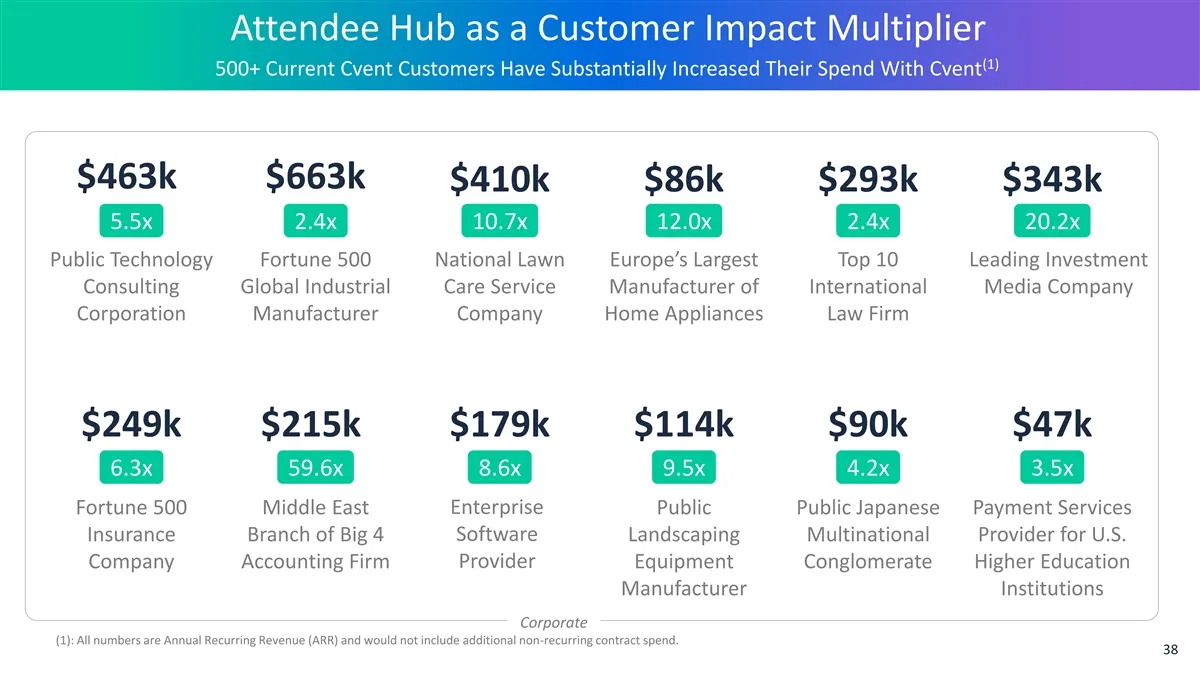
Attendee Hub as a Customer Impact Multiplier (1) 500+ Current Cvent Customers Have Substantially Increased Their Spend With Cvent $463k $663k $410k $86k $293k $343k 5.5x 2.4x 10.7x 12.0x 2.4x 20.2x Public Technology Fortune 500 National Lawn Europe’s Largest Top 10 Leading Investment Consulting Glob
Slide 39: Attendee Hub as a Customer Impact Multiplier
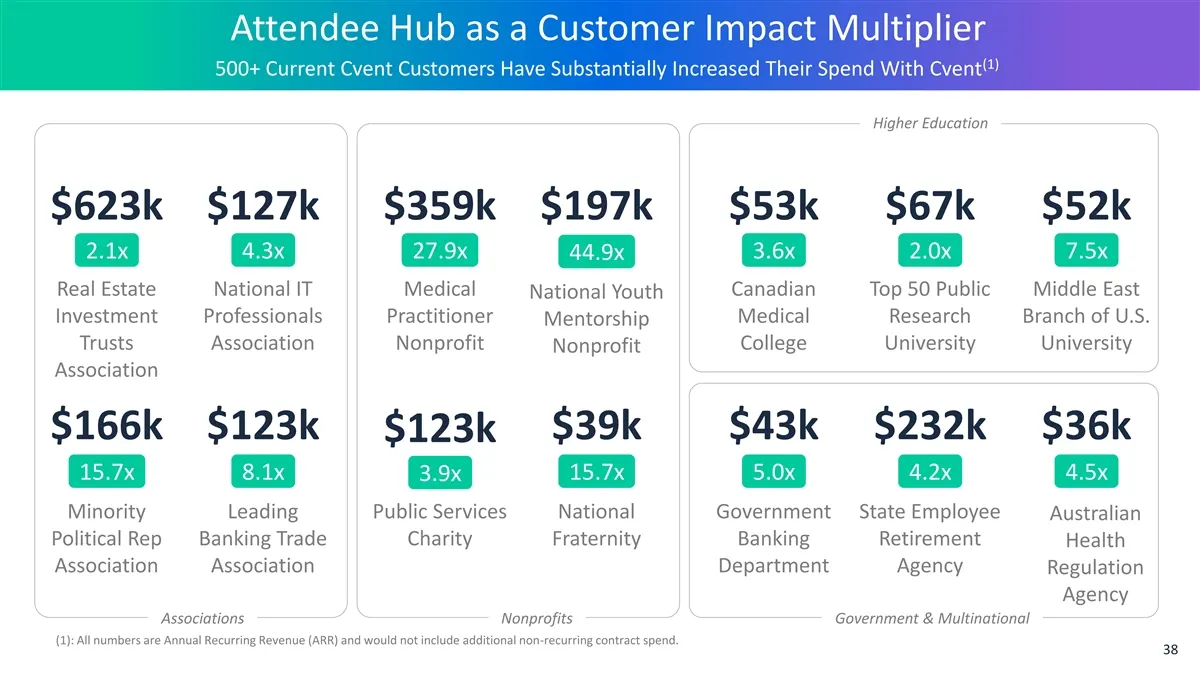
Attendee Hub as a Customer Impact Multiplier (1) 500+ Current Cvent Customers Have Substantially Increased Their Spend With Cvent Higher Education $623k $127k $359k $197k $53k $67k $52k 2.1x 4.3x 27.9x 3.6x 2.0x 7.5x 44.9x Real Estate National IT Medical Canadian Top 50 Public Middle East National Y
Slide 40: Cvent Customer Base: Ripe for Virtual & Hybrid Growth
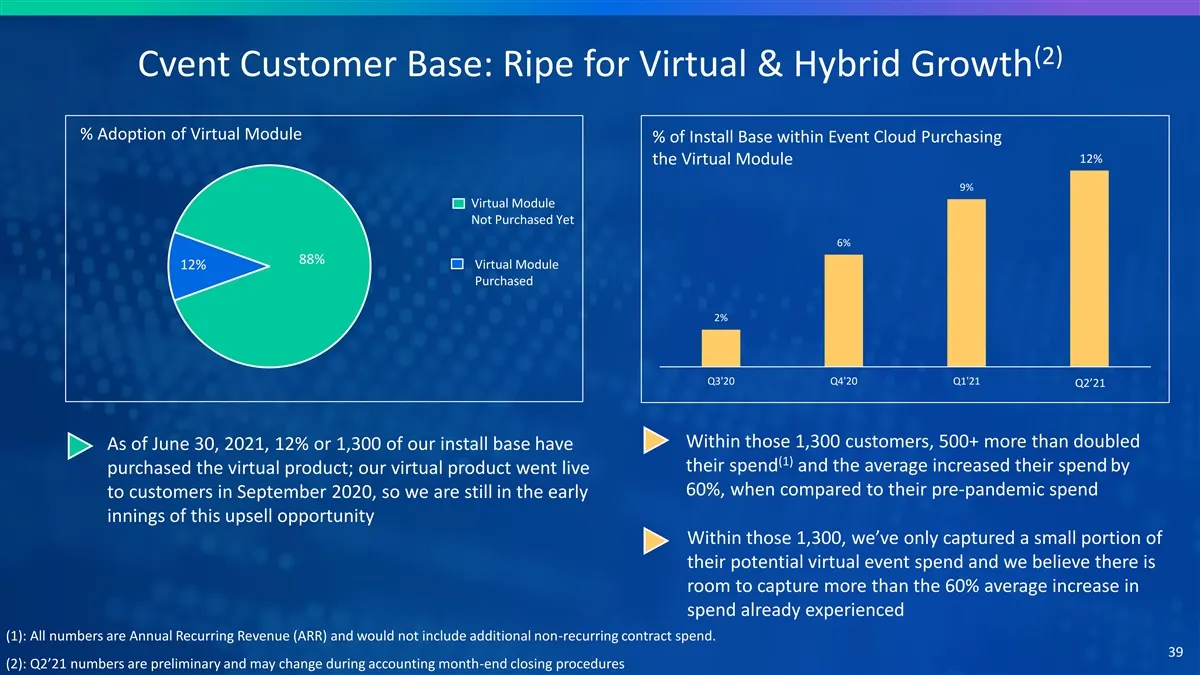
(2) Cvent Customer Base: Ripe for Virtual & Hybrid Growth % Adoption of Virtual Module % of Install Base within Event Cloud Purchasing 12% 11% the Virtual Module 9% Virtual Module Not Purchased Yet 6% 88% Virtual Module 12% Purchased 2% Q3'20 Q4'20 Q1'21 Q2'21 YTD Q2’21 Within those 1,300 customers,
Slide 41: Virtual is Driving New Logo Acquisition
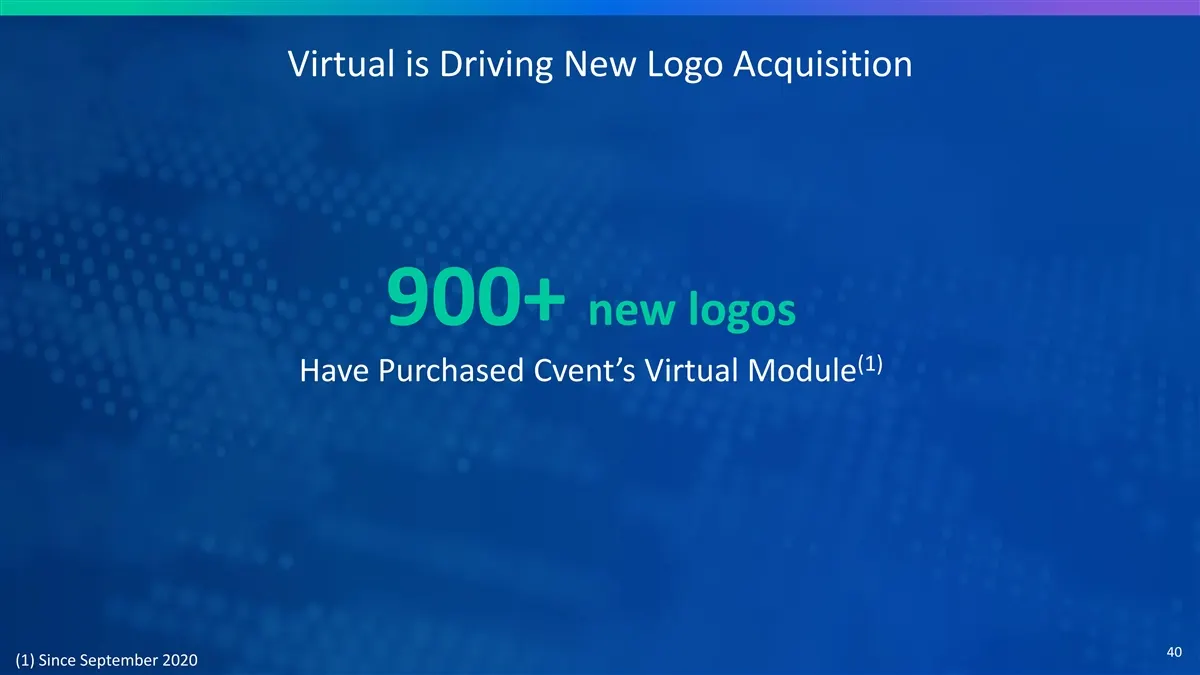
Virtual is Driving New Logo Acquisition 900+ new logos (1) Have Purchased Cvent’s Virtual Module 40 (1) Since September 2020
Slide 42: Large, Under-Penetrated Opportunity Within Existing Install Base
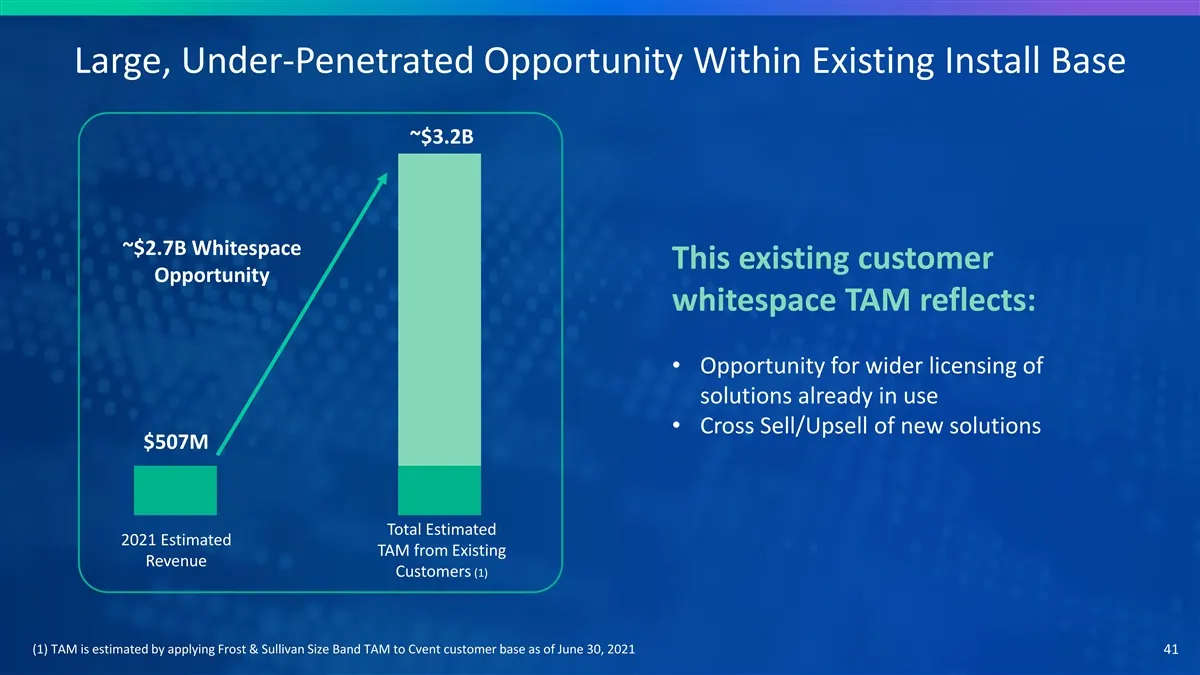
Large, Under-Penetrated Opportunity Within Existing Install Base ~$3.2B ~$2.7B Whitespace This existing customer Opportunity whitespace TAM reflects: • Opportunity for wider licensing of solutions already in use • Cross Sell/Upsell of new solutions $507M Total Estimated 2021 Estimated TAM from Exist
Slide 43: Fundamental Shifts Are a TAM Multiplier
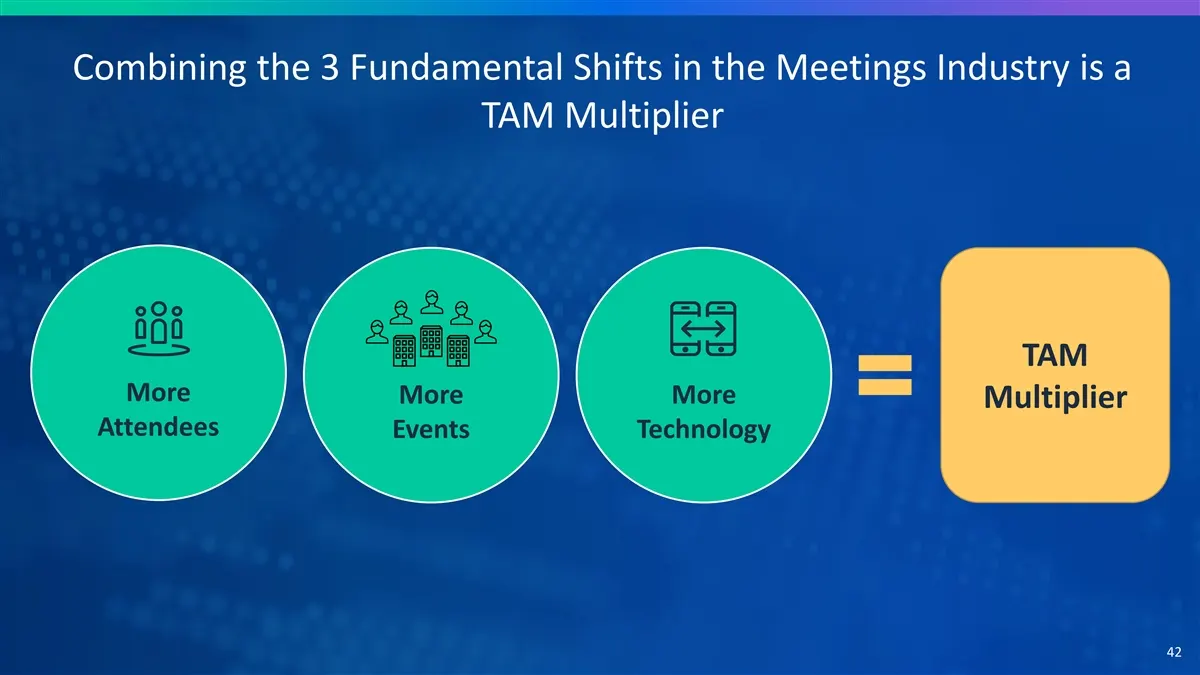
Combining the 3 Fundamental Shifts in the Meetings Industry is a TAM Multiplier TAM More More More Multiplier Attendees Events Technology 42
Slide 44: Agenda
Agenda 1 Introduction 2 Cvent At A Glance 3 Industry Transforming 4 Massive TAM Expansion 5 How We Win 6 Finance 43
Slide 45: Cvent: The Early Years
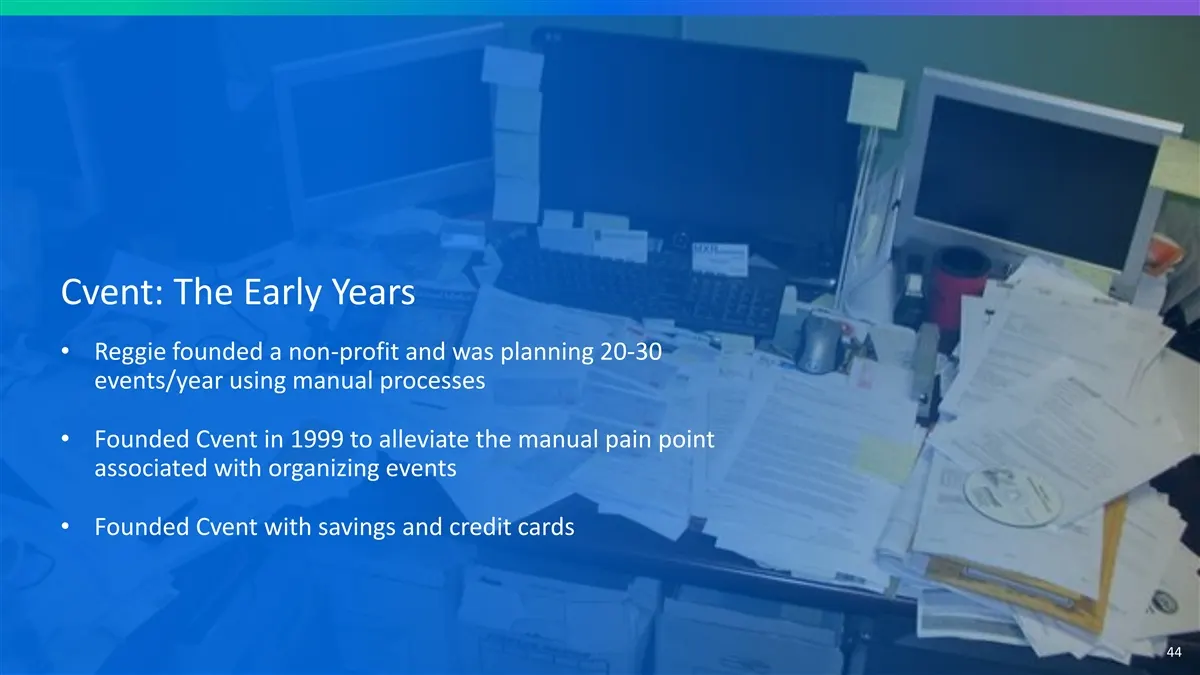
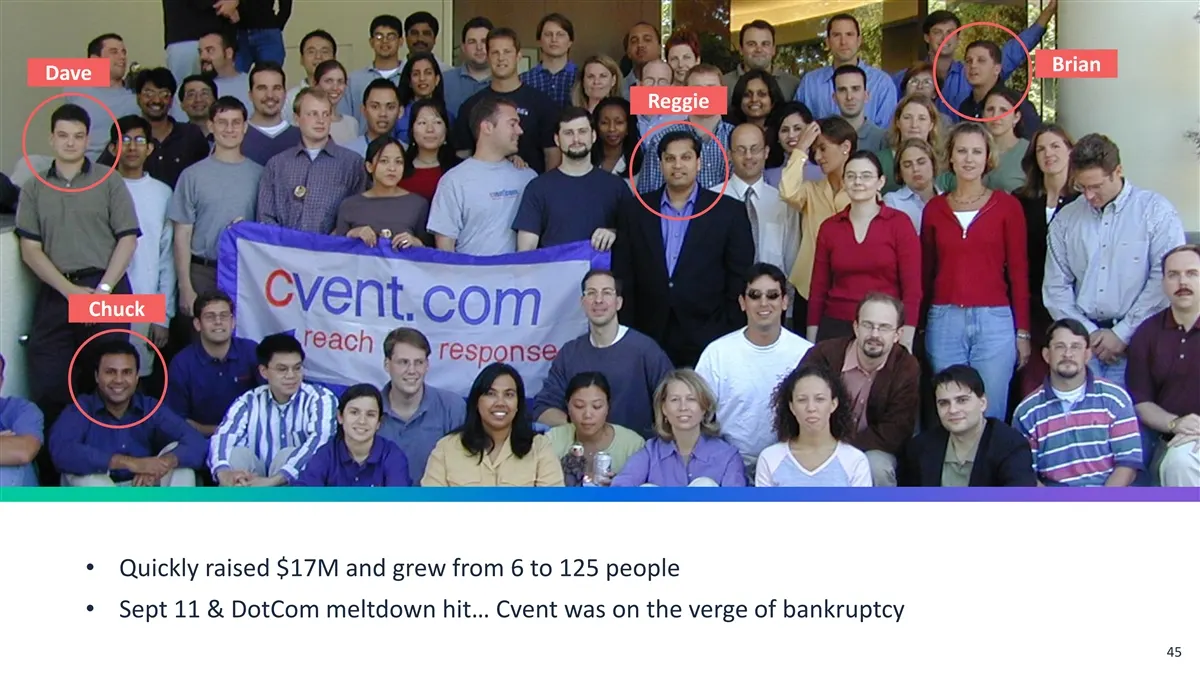
Cvent: The Early Years • Reggie founded a non-profit and was planning 20-30 events/year using manual processes • Founded Cvent in 1999 to alleviate the manual pain point associated with organizing events • Founded Cvent with savings and credit cards 44
Slide 46: Brian Dave Reggie Chuck • Quickly raised $17M and grew from 6 to 125
Brian Dave Reggie Chuck • Quickly raised $17M and grew from 6 to 125 people • Sept 11 & DotCom meltdown hit… Cvent was on the verge of bankruptcy 45
Slide 47: Cvent 2005 – Present
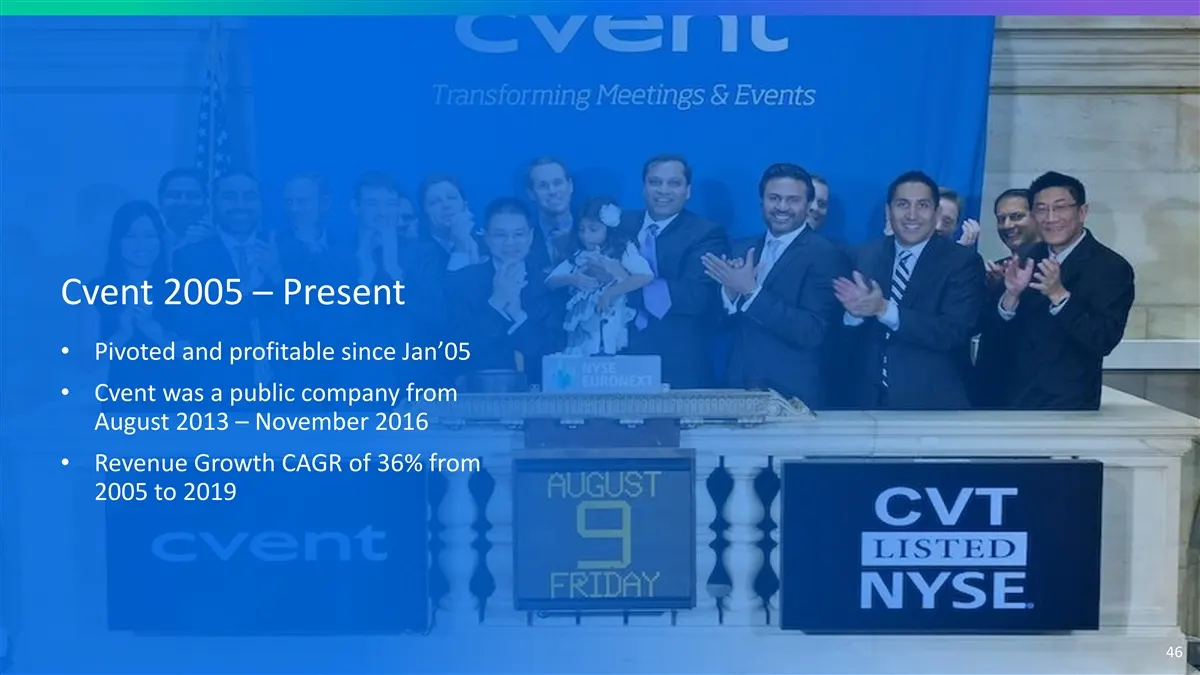
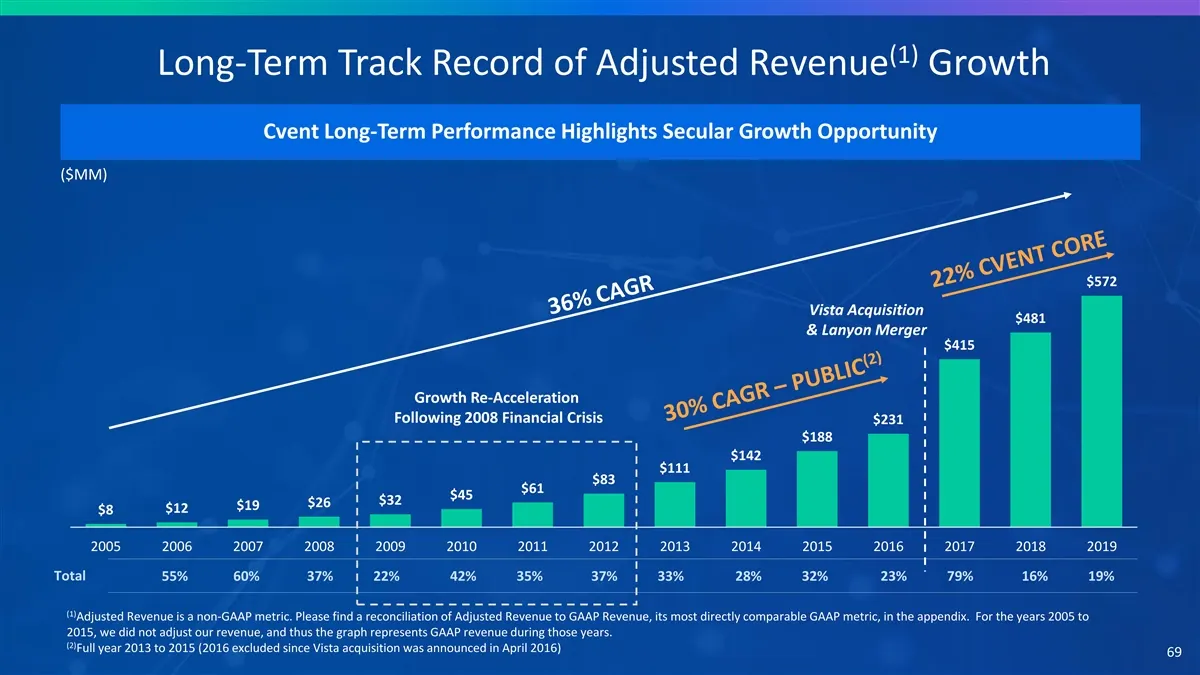
Cvent 2005 – Present • Pivoted and profitable since Jan’05 • Cvent was a public company from August 2013 – November 2016 • Revenue Growth CAGR of 36% from 2005 to 2019 46
Slide 48: India: Cvent's Secret Weapon
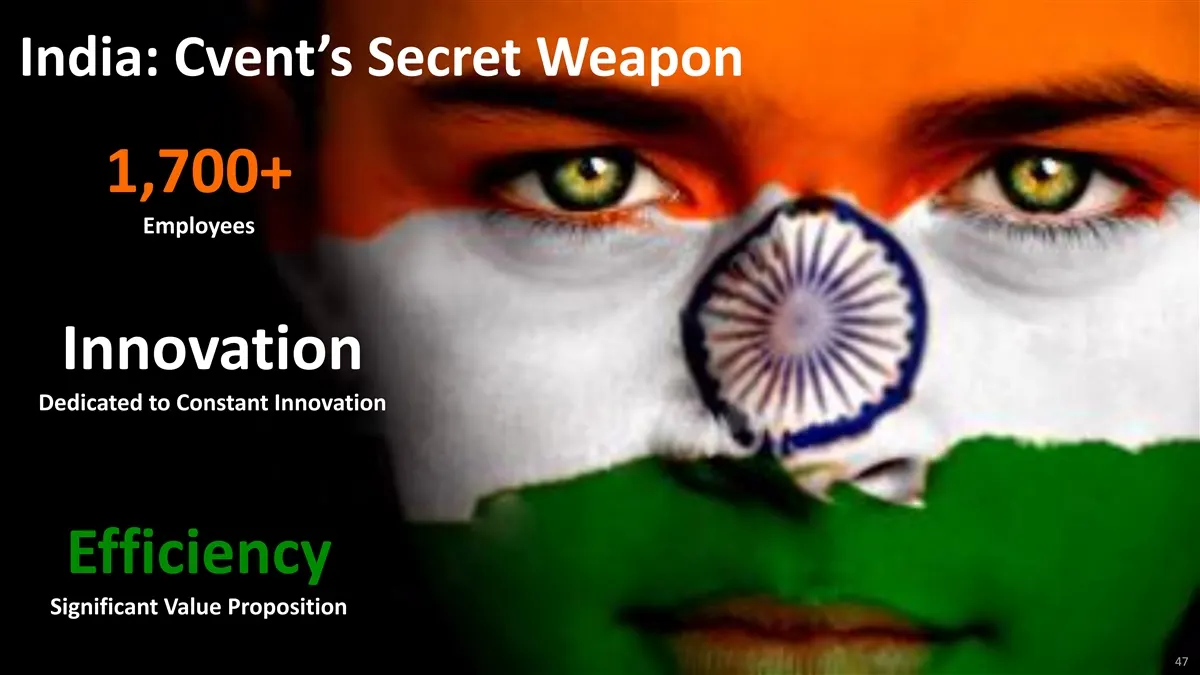
India: Cvent’s Secret Weapon 1,700+ Employees Innovation Dedicated to Constant Innovation Efficiency Significant Value Proposition 58 47 PROPRIETARY & CONFIDENTIAL: Do not distribute
Slide 49: Experienced Founder-Led Team With Track Record of Delivering
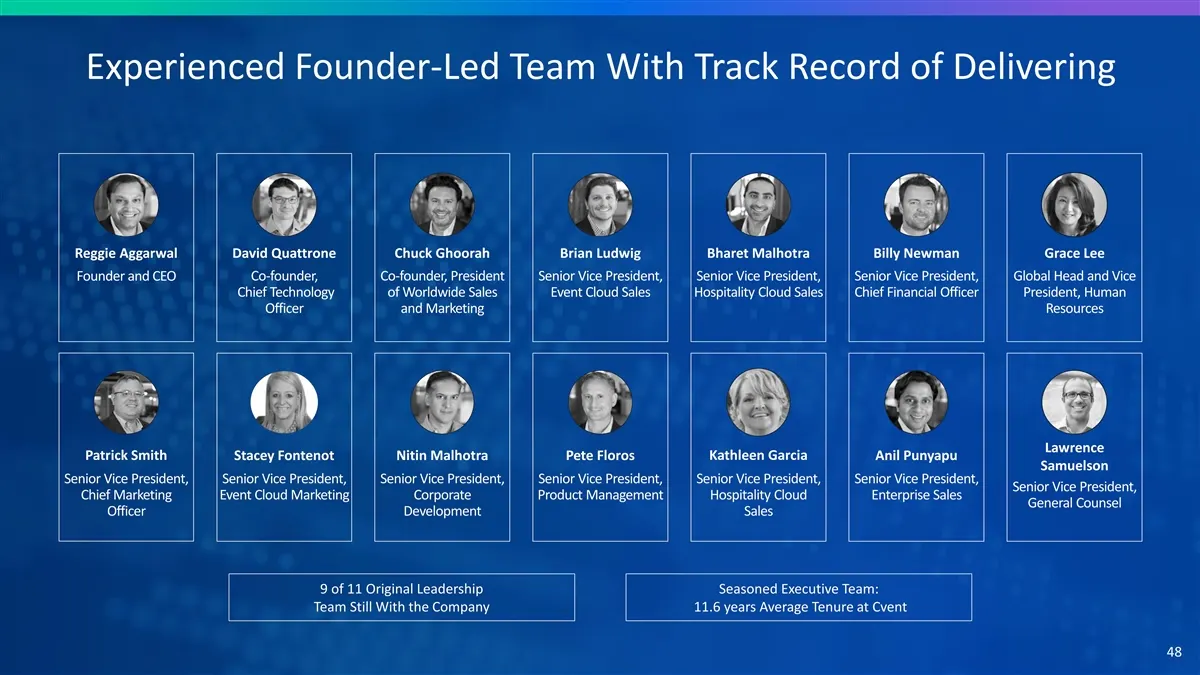
Experienced Founder-Led Team With Track Record of Delivering Reggie Aggarwal David Quattrone Chuck Ghoorah Brian Ludwig Bharet Malhotra Billy Newman Grace Lee Founder and CEO Co-founder, Co-founder, President Senior Vice President, Senior Vice President, Senior Vice President, Global Head and Vice C
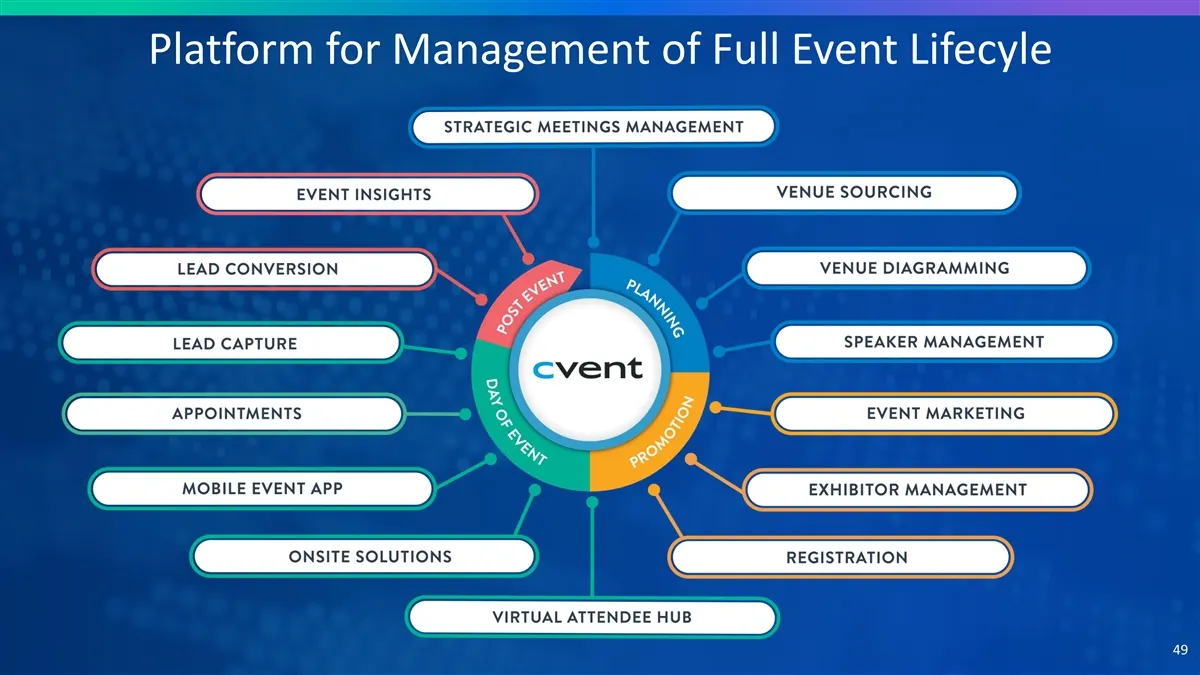
Slide 50: Platform for Management of Full Event Lifecycle
Platform for Management of Full Event Lifecyle 49
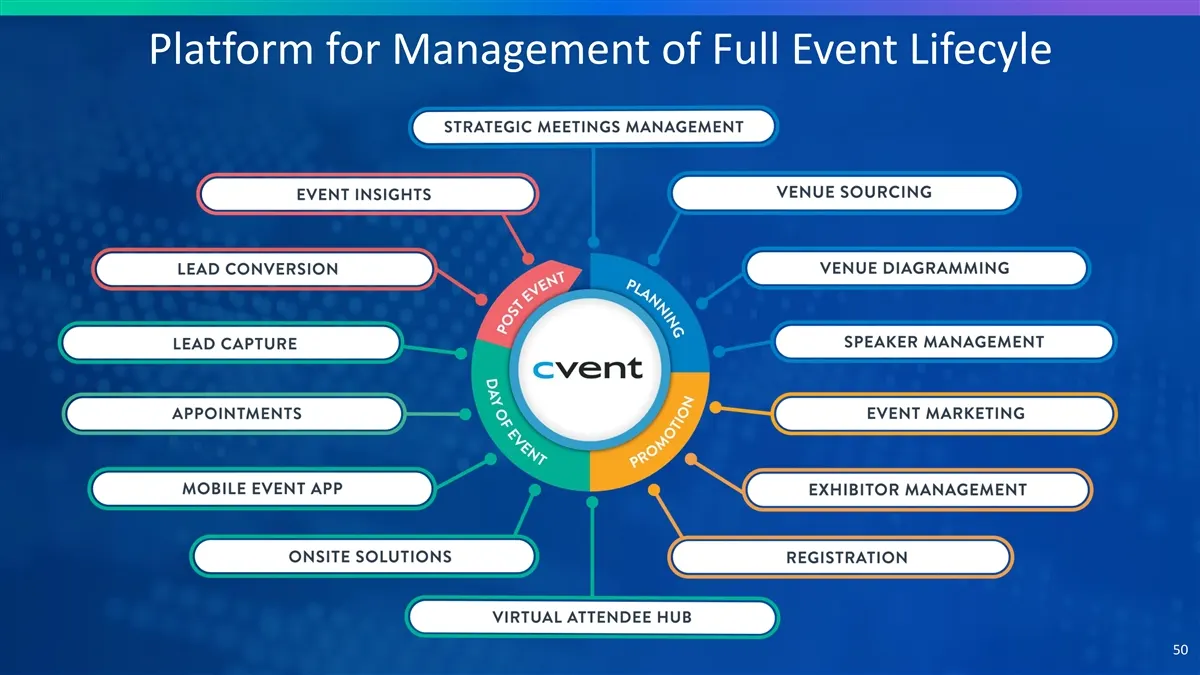
Slide 51: Platform for Management of Full Event Lifecycle
Platform for Management of Full Event Lifecyle 50
Slide 52: Cvent's Next Generation Event Platform
Cvent’s Next Generation Event Platform Registration is a Core Component for both In-Person and Virtual Events • Nearly 200M registrations processed since 1999 CLICK HERE FOR VIDEO • Our platform provides event organizers the flexibility and functionality to manage nearly any type of event scenario 5
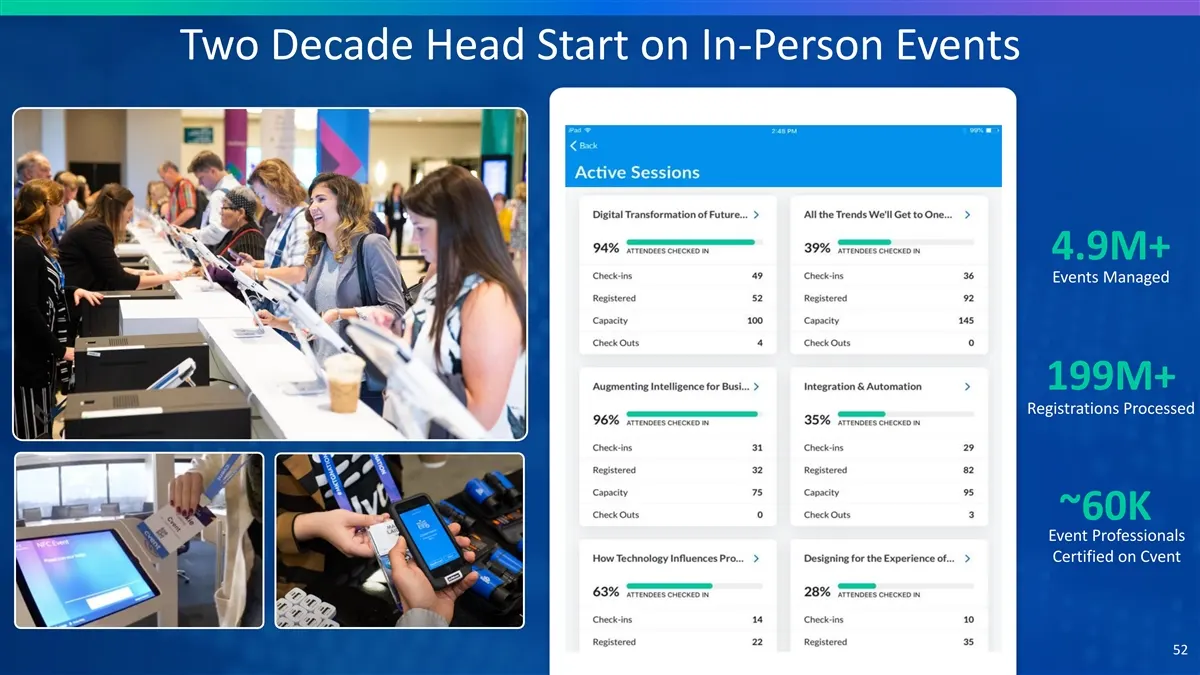
Slide 53: Two Decade Head Start on In-Person Events
Two Decade Head Start on In-Person Events 4.9M+ Events Managed 199M+ Registrations Processed ~60K Event Professionals Certified on Cvent 52
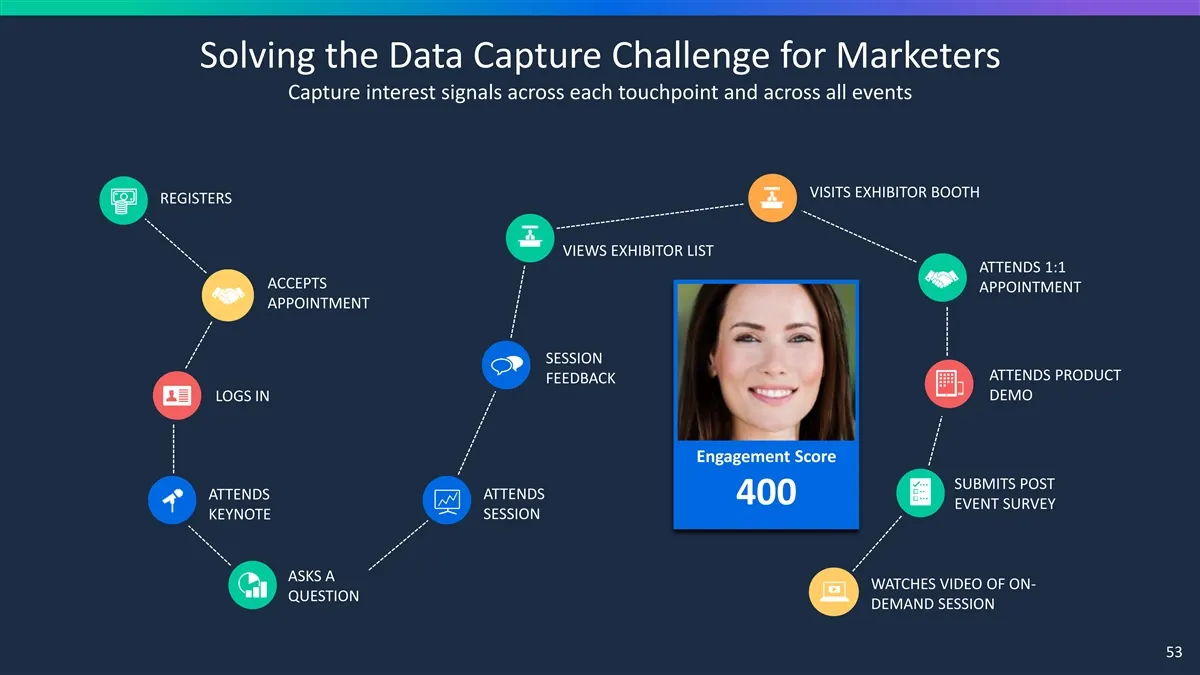
Slide 54: Solving the Data Capture Challenge for Marketers
Solving the Data Capture Challenge for Marketers Capture interest signals across each touchpoint and across all events VISITS EXHIBITOR BOOTH REGISTERS VIEWS EXHIBITOR LIST ATTENDS 1:1 ACCEPTS APPOINTMENT APPOINTMENT SESSION ATTENDS PRODUCT FEEDBACK DEMO LOGS IN E E En n ng g gag ag age e eme me men
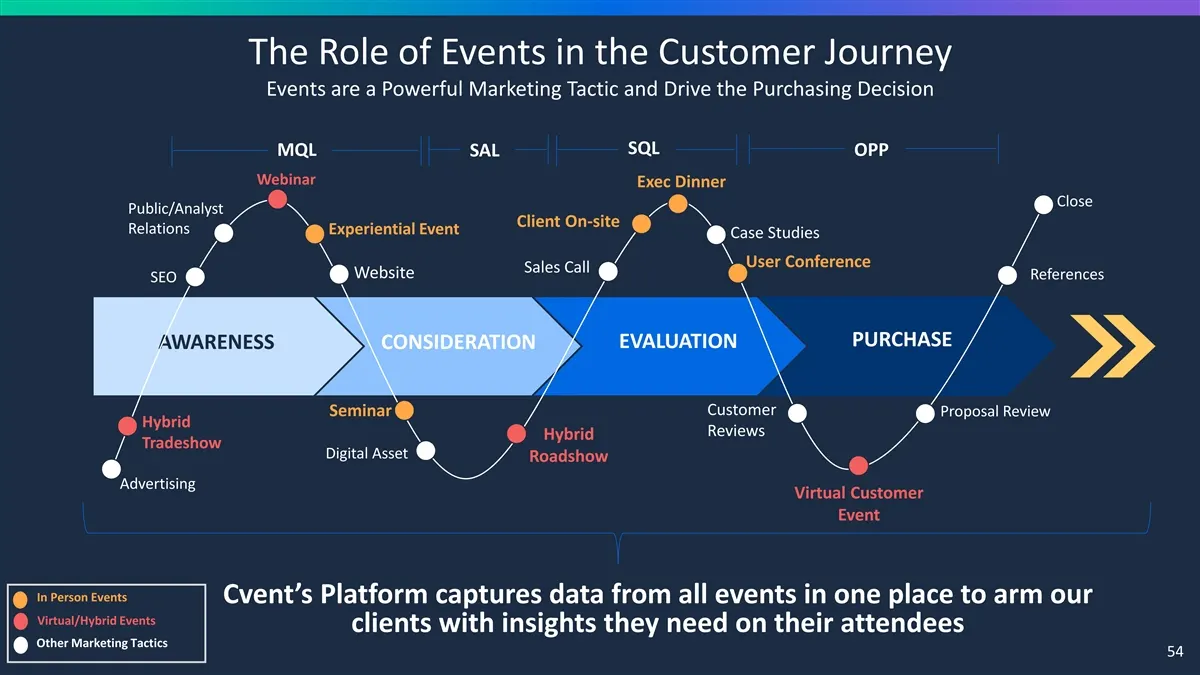
Slide 55: The Role of Events in the Customer Journey
The Role of Events in the Customer Journey Events are a Powerful Marketing Tactic and Drive the Purchasing Decision SQL MQL SAL OPP Webinar Exec Dinner Close Public/Analyst Client On-site Relations Experiential Event Case Studies Product User Conference Sales Call Website References SEO Demos PURCHA
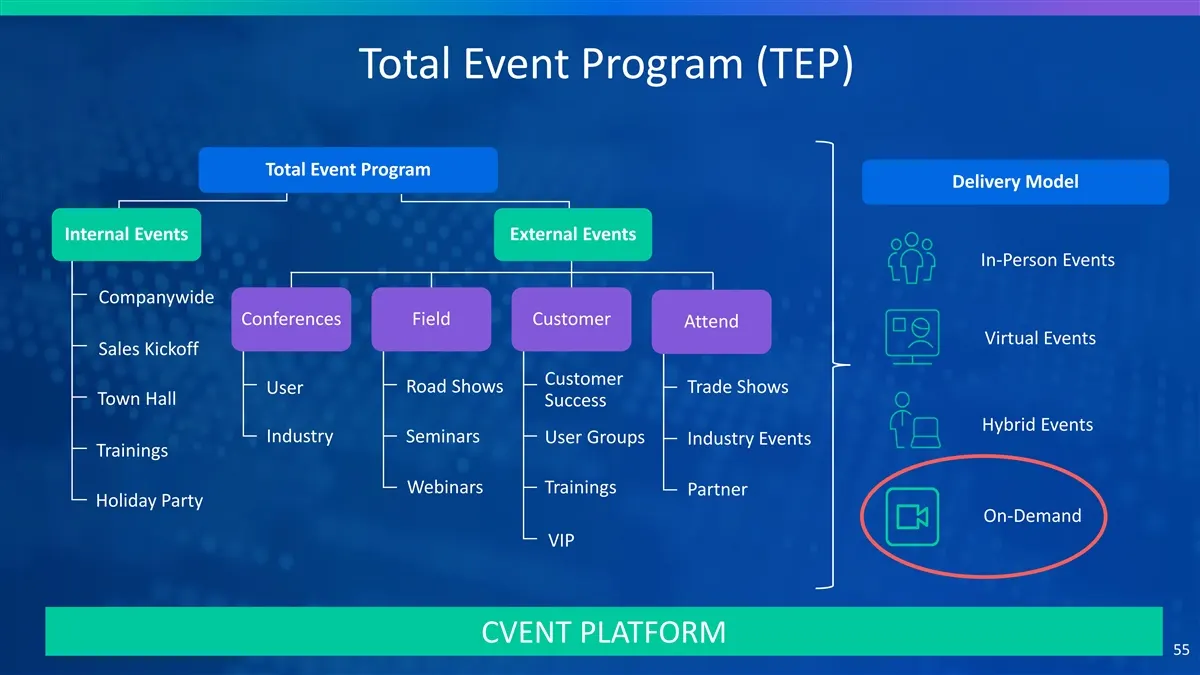
Slide 56: Total Event Program (TEP)
Total Event Program (TEP) Total Event Program Delivery Model Internal Events External Events In-Person Events Companywide Conferences Field Customer Attend Virtual Events Sales Kickoff Customer Road Shows User Trade Shows Town Hall Success Hybrid Events Industry Seminars User Groups Industry Events
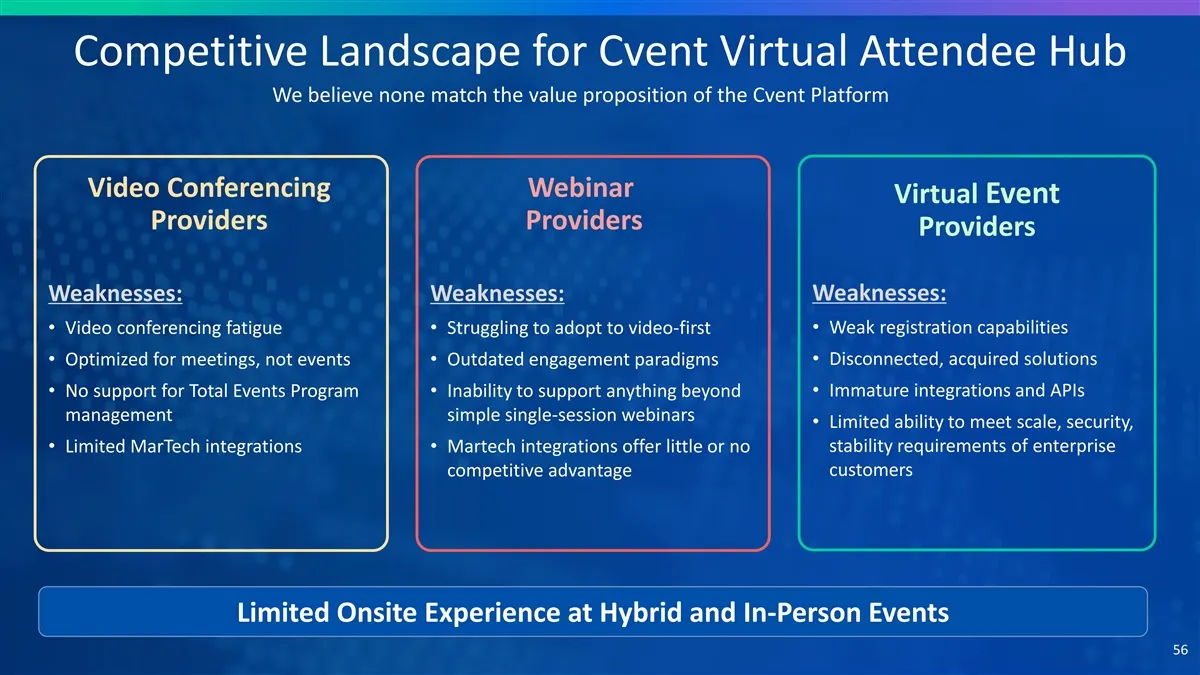
Slide 57: Competitive Landscape for Cvent Virtual Attendee Hub
Competitive Landscape for Cvent Virtual Attendee Hub We believe none match the value proposition of the Cvent Platform Video Conferencing Webinar Virtual Event Providers Providers Providers Weaknesses: Weaknesses: Weaknesses: • Video conferencing fatigue • Struggling to adopt to video-first• Weak re
Slide 58: How We Monetize the Event Cloud
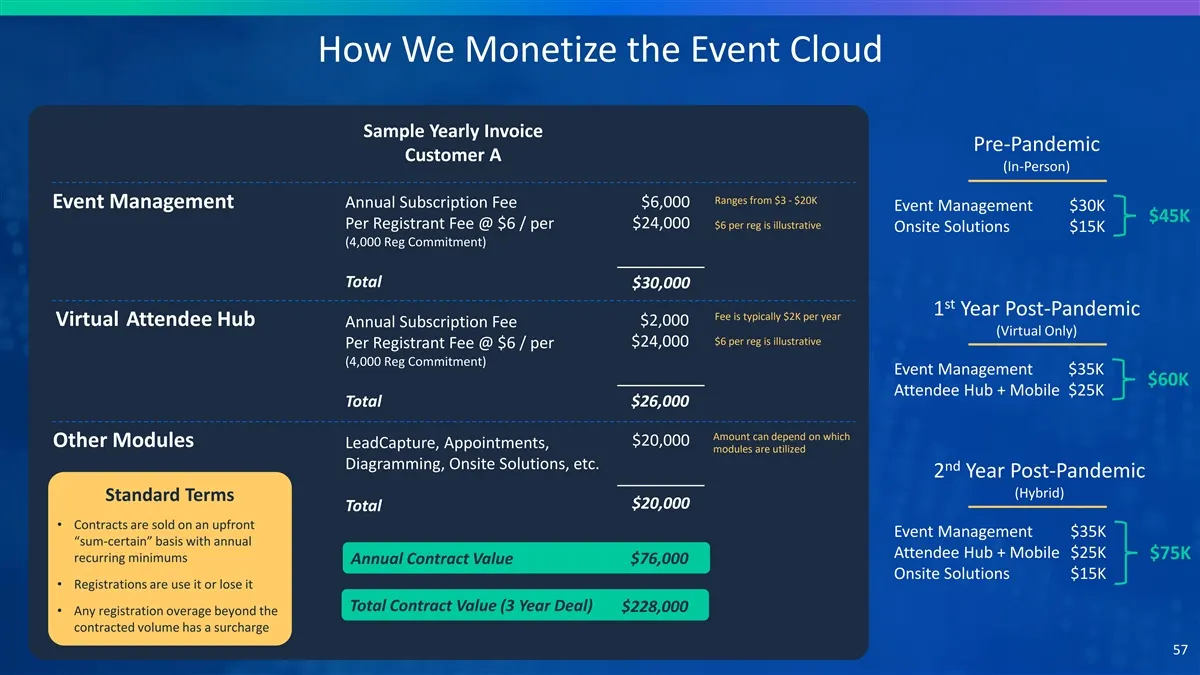
How We Monetize the Event Cloud Sample Yearly Invoice Pre-Pandemic Customer A (In-Person) Ranges from $3 - $20K Annual Subscription Fee $6,000 Event Management Event Management $30K $45K Per Registrant Fee @ $6 / per $24,000 $6 per reg is illustrative Onsite Solutions $15K (4,000 Reg Commitment) Tot
Slide 59: Cvent's Hospitality Cloud is a Differentiator
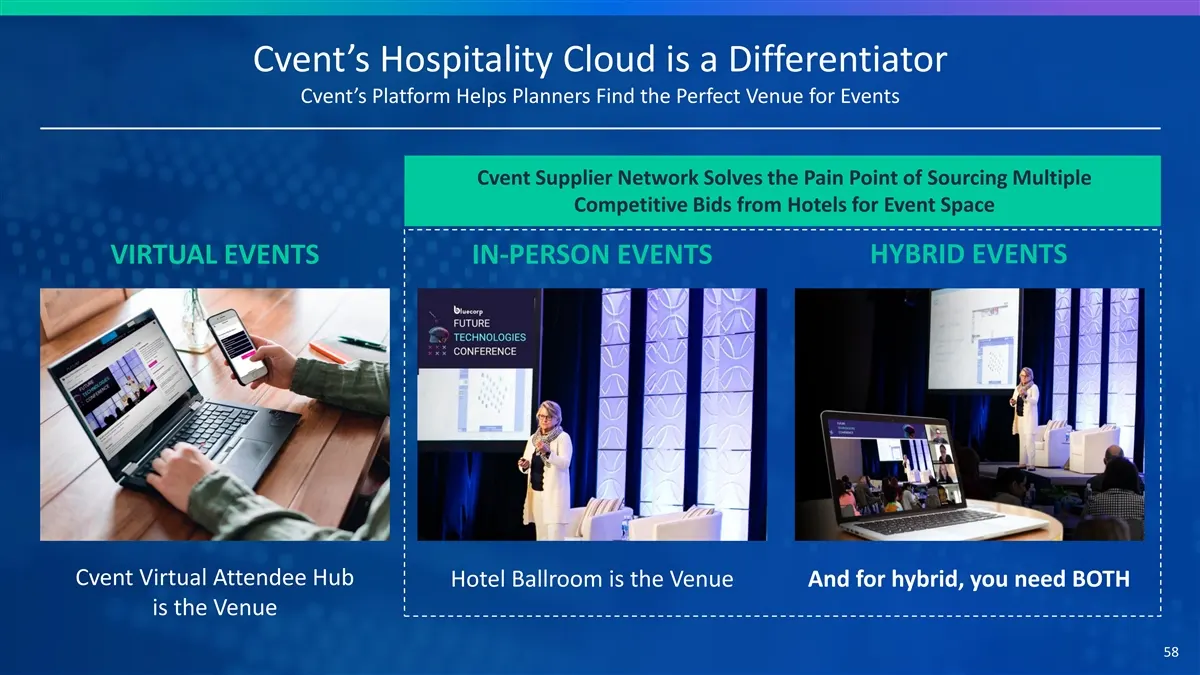
Cvent’s Hospitality Cloud is a Differentiator Cvent’s Platform Helps Planners Find the Perfect Venue for Events Cvent Supplier Network Solves the Pain Point of Sourcing Multiple Competitive Bids from Hotels for Event Space VIRTUAL EVENTS IN-PERSON EVENTS HYBRID EVENTS Cvent Virtual Attendee Hub Hote
Slide 60: Breadth and Depth of Suppliers & Users is a True Market Differentiator
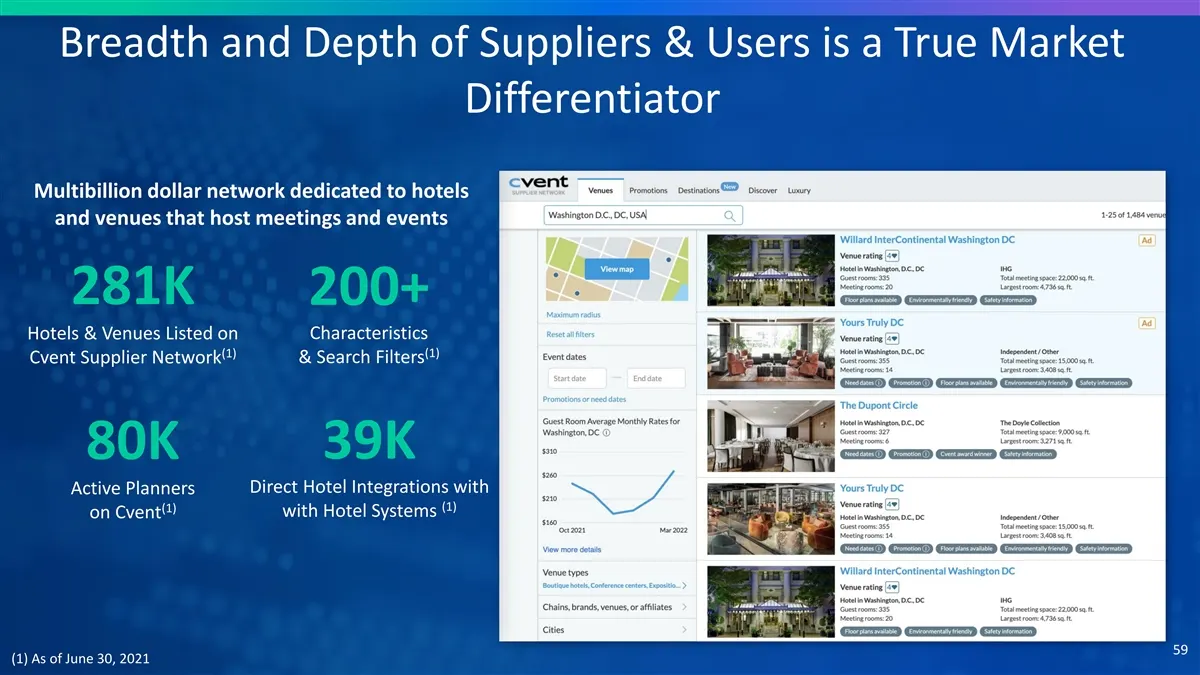
Breadth and Depth of Suppliers & Users is a True Market Differentiator Multibillion dollar network dedicated to hotels and venues that host meetings and events 281K 200+ Characteristics Hotels & Venues Listed on (1) (1) Cvent Supplier Network & Search Filters 80K 39K Direct Hotel Integrations with A
Slide 61: Cvent Hospitality Cloud is Embedded in the Events Space
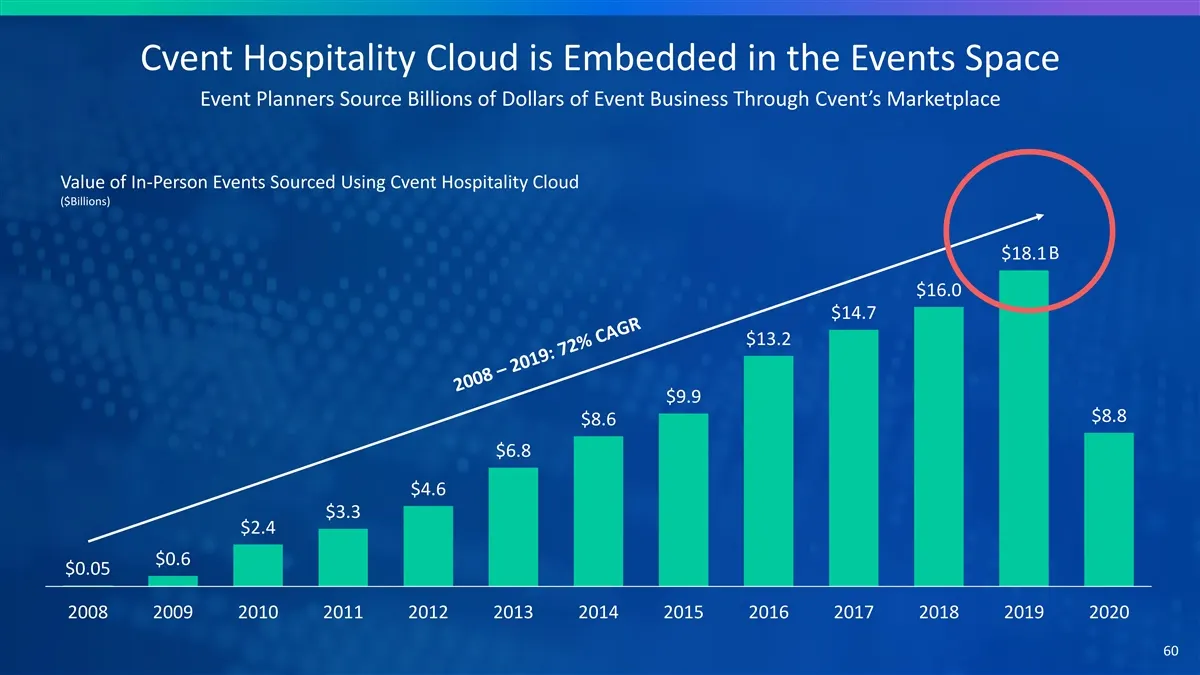
Cvent Hospitality Cloud is Embedded in the Events Space Event Planners Source Billions of Dollars of Event Business Through Cvent’s Marketplace Value of In-Person Events Sourced Using Cvent Hospitality Cloud ($Billions) B $18.1 $16.0 $14.7 $13.2 $9.9 $8.8 $8.6 $6.8 $4.6 $3.3 $2.4 $0.6 $0.05 2008 200
Slide 62: How We Monetize the Hospitality Cloud - Advertising
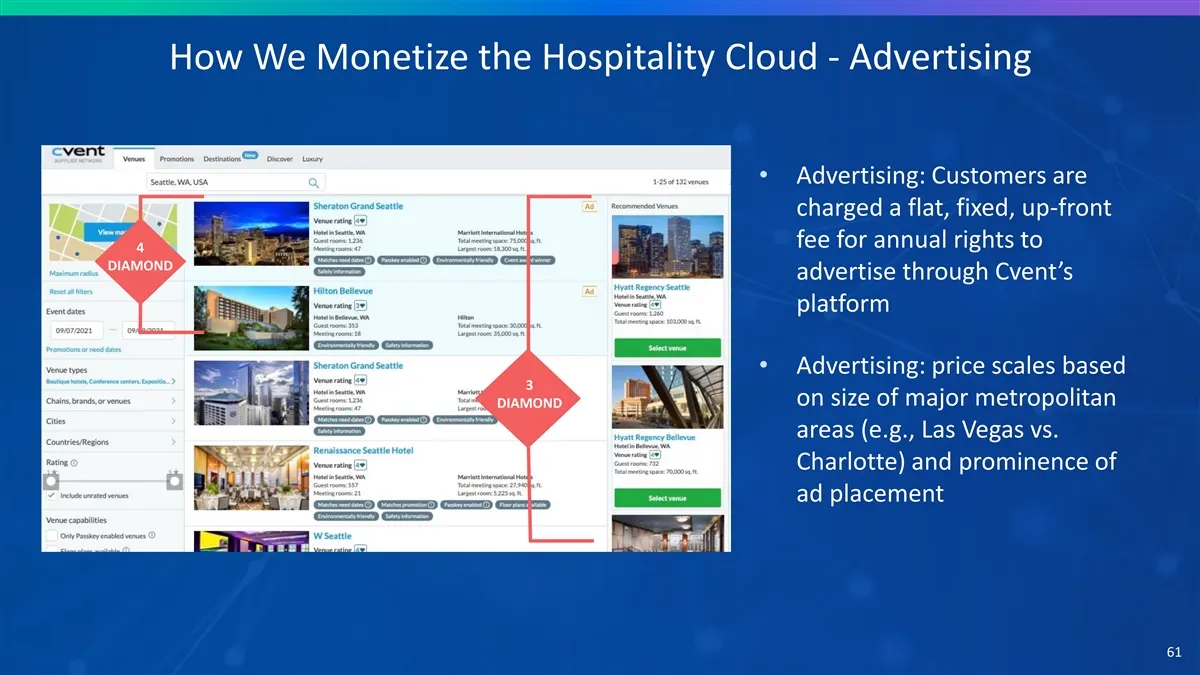
How We Monetize the Hospitality Cloud - Advertising • Advertising: Customers are charged a flat, fixed, up-front fee for annual rights to 4 DIAMOND advertise through Cvent’s platform • Advertising: price scales based 3 on size of major metropolitan DIAMOND areas (e.g., Las Vegas vs. Charlotte) and p
Slide 63: How We Monetize Hospitality Cloud - Software
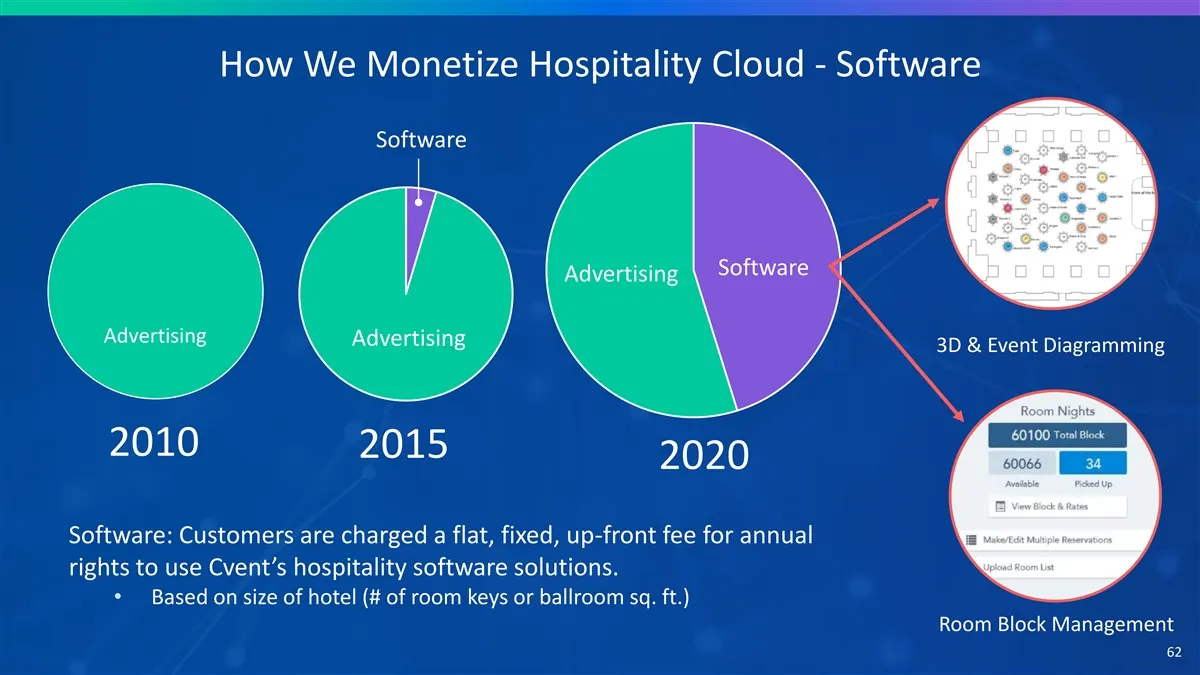
How We Monetize Hospitality Cloud - Software Software Software Advertising Advertising Advertising 3D & Event Diagramming 2010 2015 2020 Software: Customers are charged a flat, fixed, up-front fee for annual rights to use Cvent’s hospitality software solutions. • Based on size of hotel (# of room ke
Slide 64: SaaS Platform with Network Effects
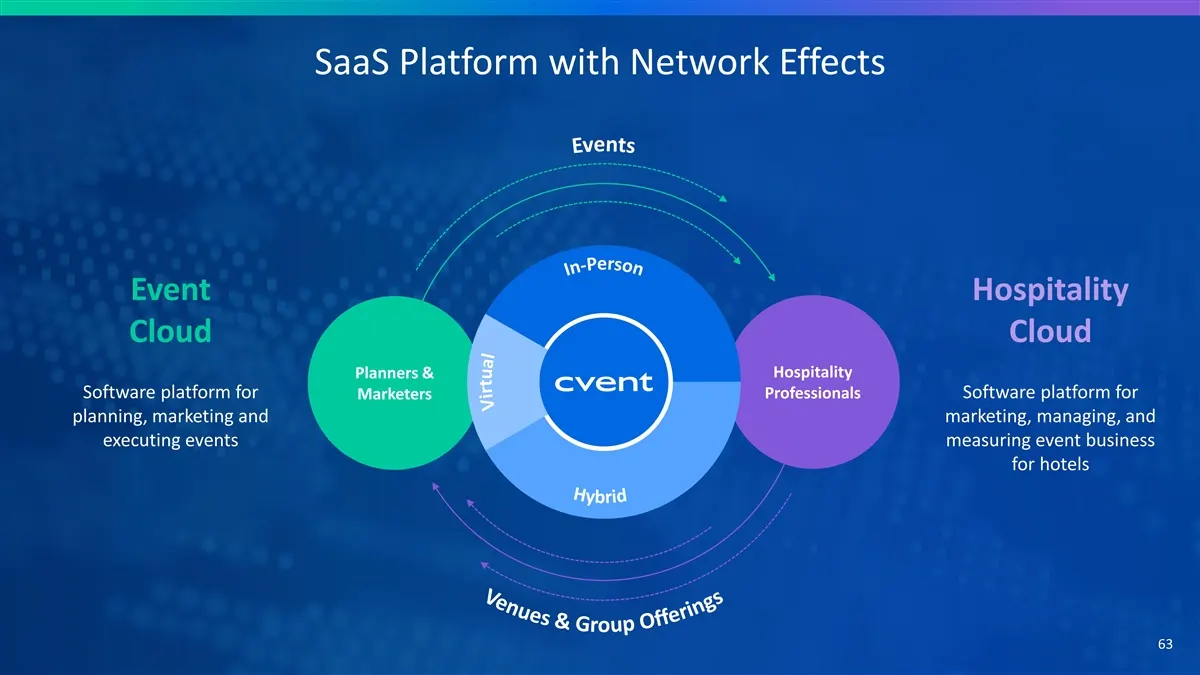
SaaS Platform with Network Effects Event Hospitality Cloud Cloud Hospitality Planners & Software platform for Professionals Software platform for Marketers planning, marketing and marketing, managing, and executing events measuring event business for hotels 63
Slide 65: Agenda
Agenda 1 Introduction 2 Cvent At A Glance 3 Industry Transforming 4 Massive TAM Expansion 5 How We Win 6 Finance 64
Slide 66: Attractive Financial Profile Positions Cvent for Success
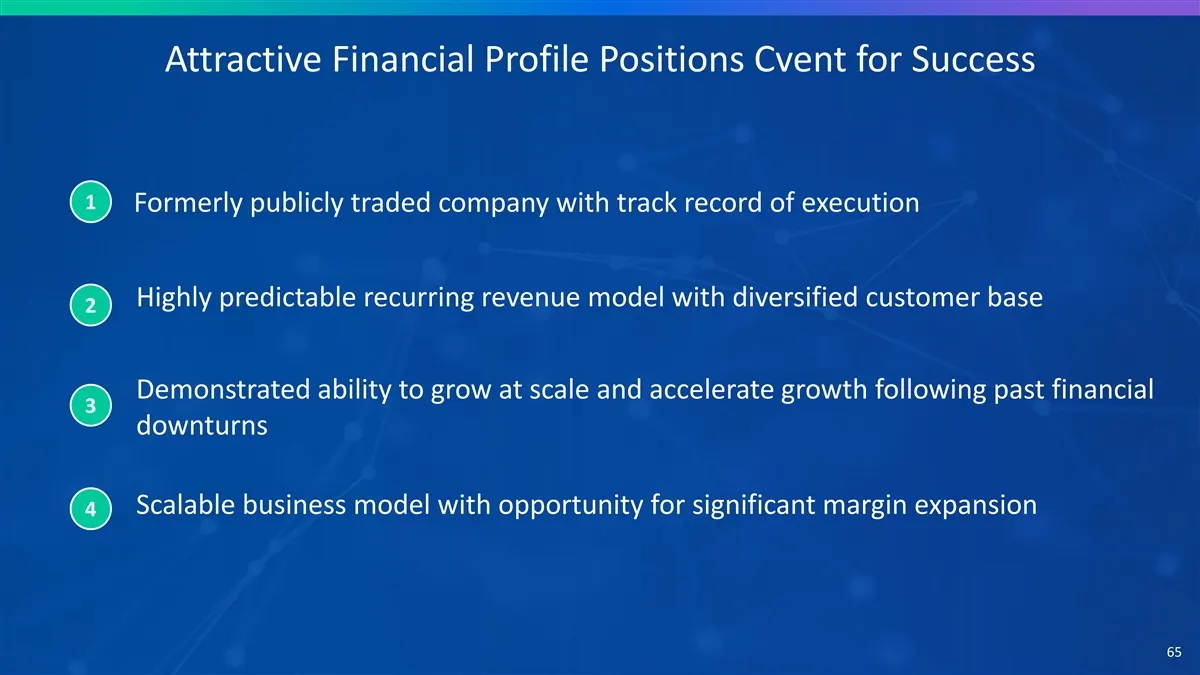
Attractive Financial Profile Positions Cvent for Success 1 Formerly publicly traded company with track record of execution Highly predictable recurring revenue model with diversified customer base 2 Demonstrated ability to grow at scale and accelerate growth following past financial 3 downturns Scal
Slide 67: Highly Predictable Recurring Revenue Model
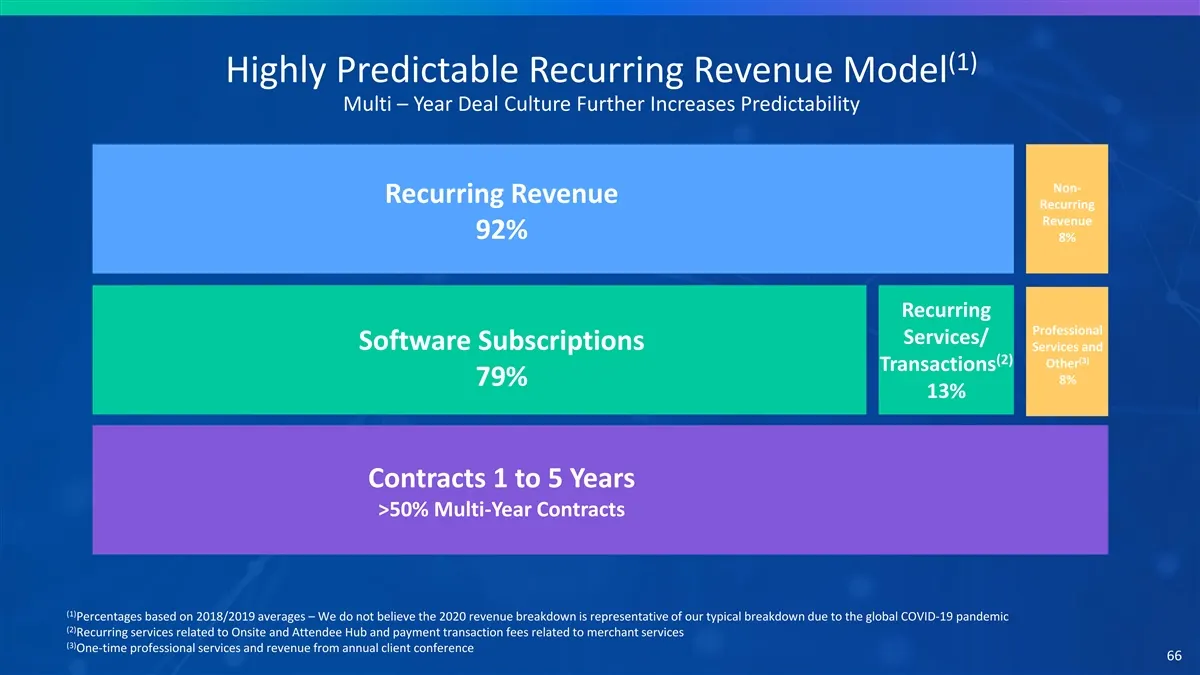
(1) Highly Predictable Recurring Revenue Model Multi – Year Deal Culture Further Increases Predictability Non- Recurring Revenue Recurring Revenue 92% 8% Recurring Professional Services/ Software Subscriptions Services and (3) (2) Other Transactions 8% 79% 13% Contracts 1 to 5 Years >50% Multi-Year
Slide 68: 2021 Q3 and Q4 Revenue Forecast
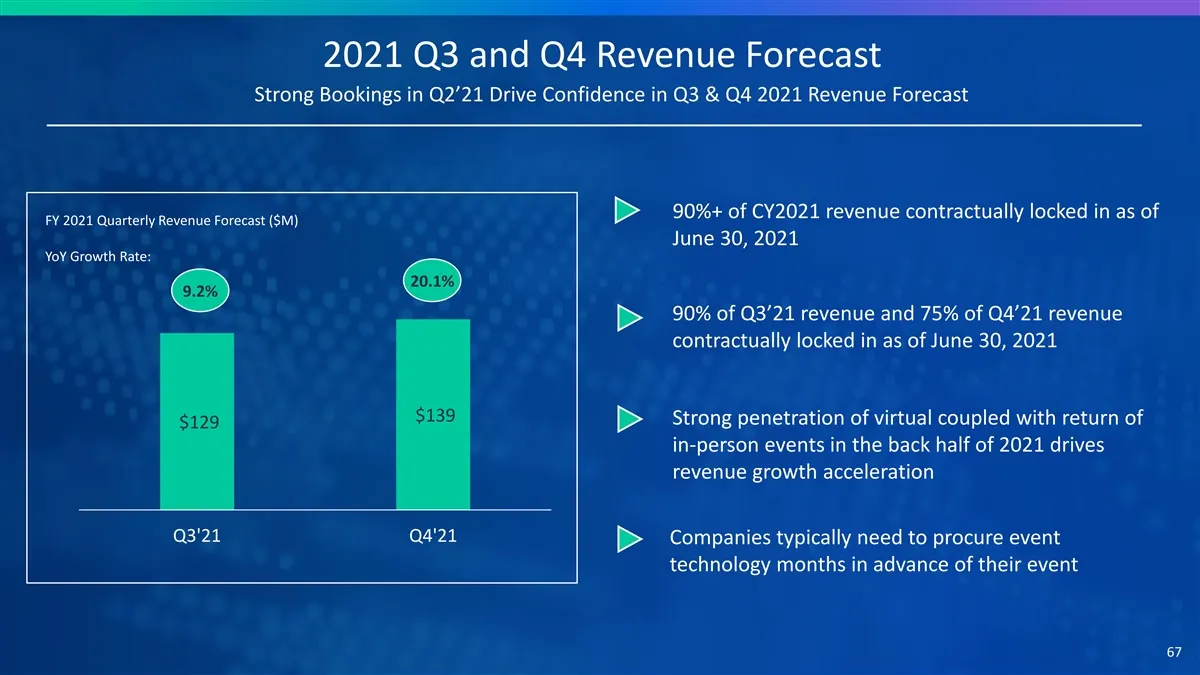
2021 Q3 and Q4 Revenue Forecast Strong Bookings in Q2’21 Drive Confidence in Q3 & Q4 2021 Revenue Forecast 90%+ of CY2021 revenue contractually locked in as of FY 2021 Quarterly Revenue Forecast ($M) June 30, 2021 YoY Growth Rate: 20.1% 9.2% 90% of Q3’21 revenue and 75% of Q4’21 revenue contractuall
Slide 69: Highly Diversified and Engaged Customer Base
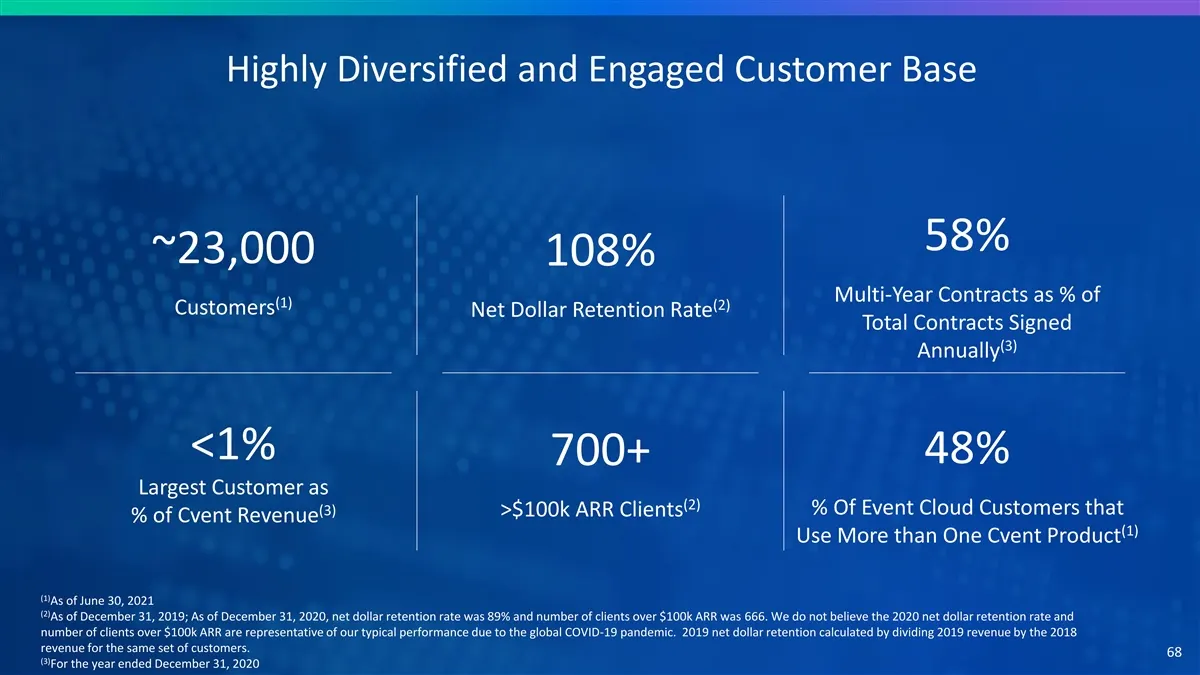
Highly Diversified and Engaged Customer Base 58% ~23,000 108% Multi-Year Contracts as % of (1) (2) Customers Net Dollar Retention Rate Total Contracts Signed (3) Annually <1% 48% 700+ Largest Customer as (2) (3) % Of Event Cloud Customers that >$100k ARR Clients % of Cvent Revenue (1) Use More than
Slide 70: Long-Term Track Record of Adjusted Revenue Growth
(1) Long-Term Track Record of Adjusted Revenue Growth Cvent Long-Term Performance Highlights Secular Growth Opportunity ($MM) $572 Vista Acquisition $481 & Lanyon Merger $415 Growth Re-Acceleration Following 2008 Financial Crisis $231 $188 $142 $111 $83 $61 $45 $32 $26 $19 $12 $8 2005 2006 2007 2008
Slide 71: Bouncing Back from the Pandemic and Accelerating Growth
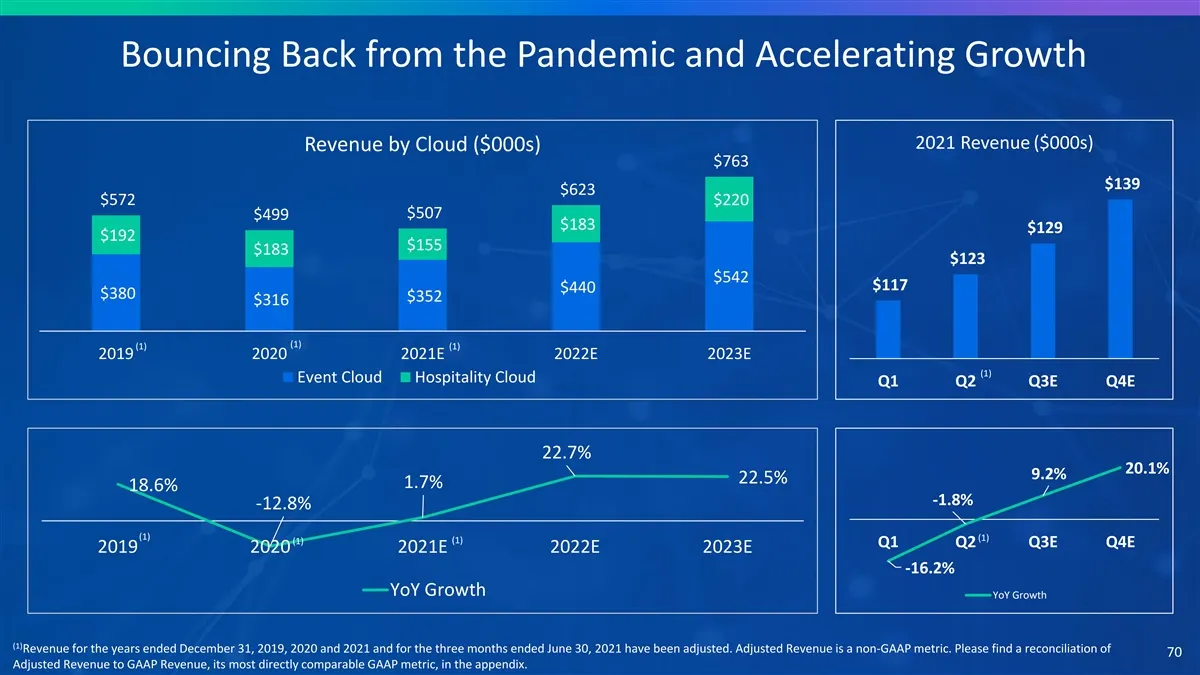
Bouncing Back from the Pandemic and Accelerating Growth 2021 Revenue ($000s) Revenue by Cloud ($000s) $763 $139 $623 $572 $220 $507 $499 $183 $129 $192 $155 $183 $123 $542 $117 $440 $380 $352 $316 (1) (1) (1) 2019 2020 2021E 2022E 2023E (1) Event Cloud Hospitality Cloud Q1 Q2 Q3E Q4E 22.7% 20.1% 9.2
Slide 72: Attractive Financial Model – Balancing Growth with Profitability
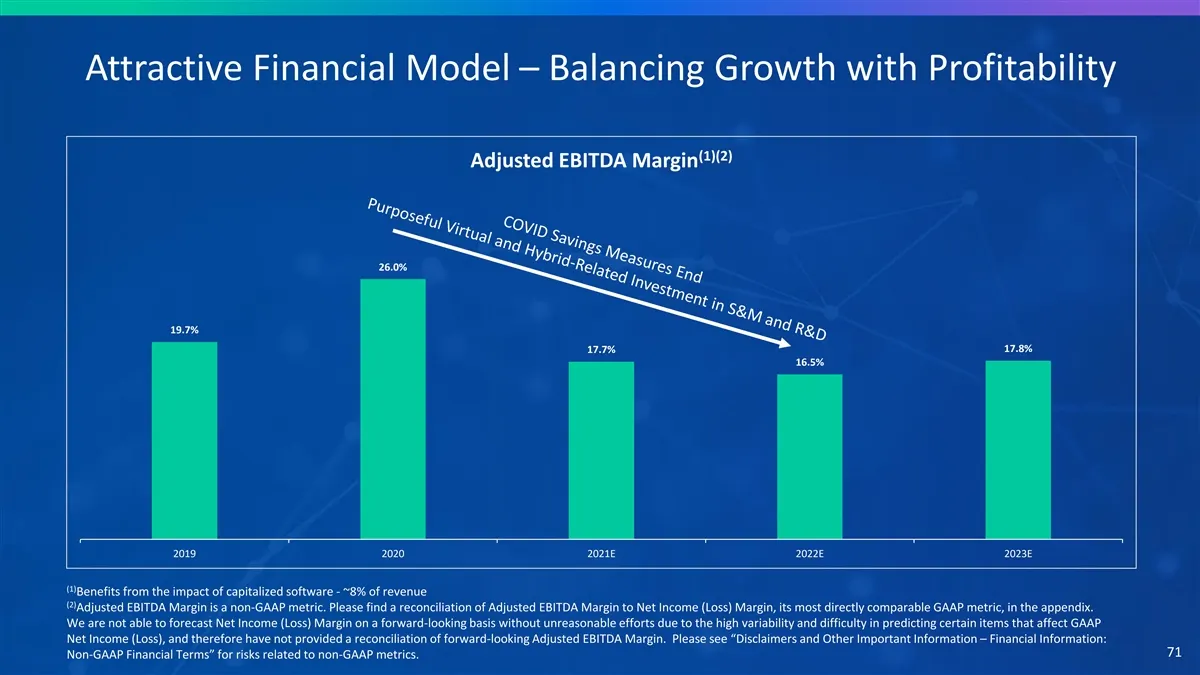
Attractive Financial Model – Balancing Growth with Profitability (1)(2) Adjusted EBITDA Margin 26.0% 19.7% 17.8% 17.7% 16.5% 2019 2020 2021E 2022E 2023E (1) Benefits from the impact of capitalized software - ~8% of revenue (2) Adjusted EBITDA Margin is a non-GAAP metric. Please find a reconciliation
Slide 73: Long-Term Modeling Guidance
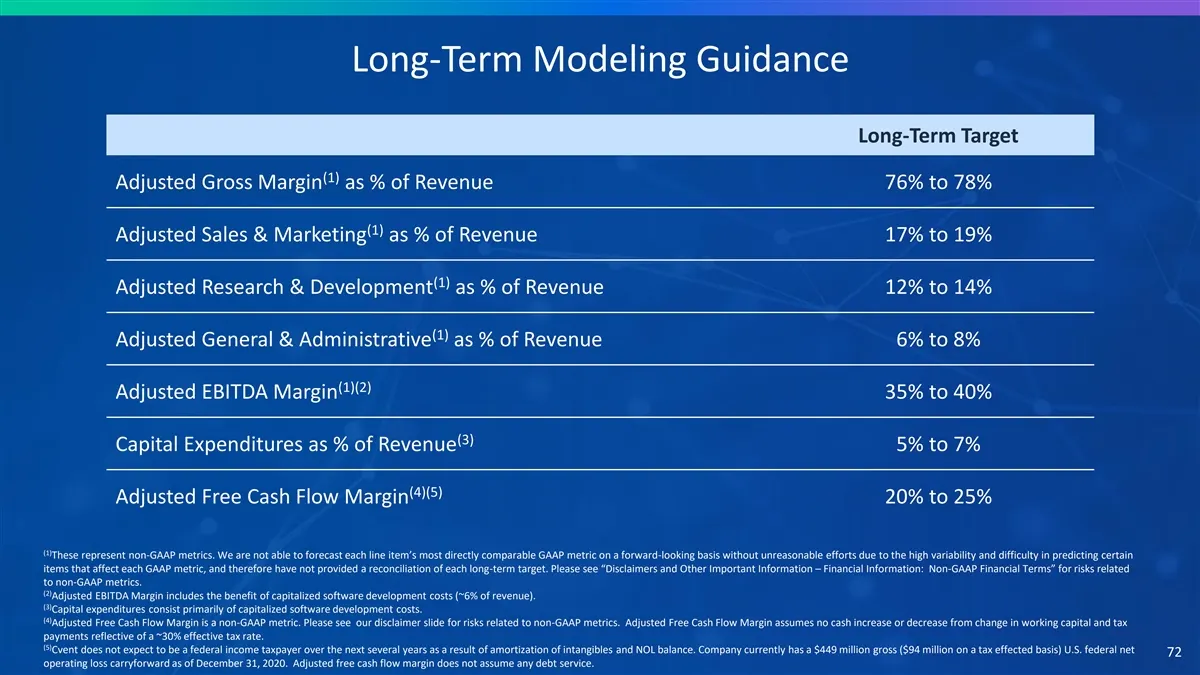
Long-Term Modeling Guidance Long-Term Target (1) Adjusted Gross Margin as % of Revenue 76% to 78% (1) Adjusted Sales & Marketing as % of Revenue 17% to 19% (1) Adjusted Research & Development as % of Revenue 12% to 14% (1) Adjusted General & Administrative as % of Revenue 6% to 8% (1)(2) Adjusted EB
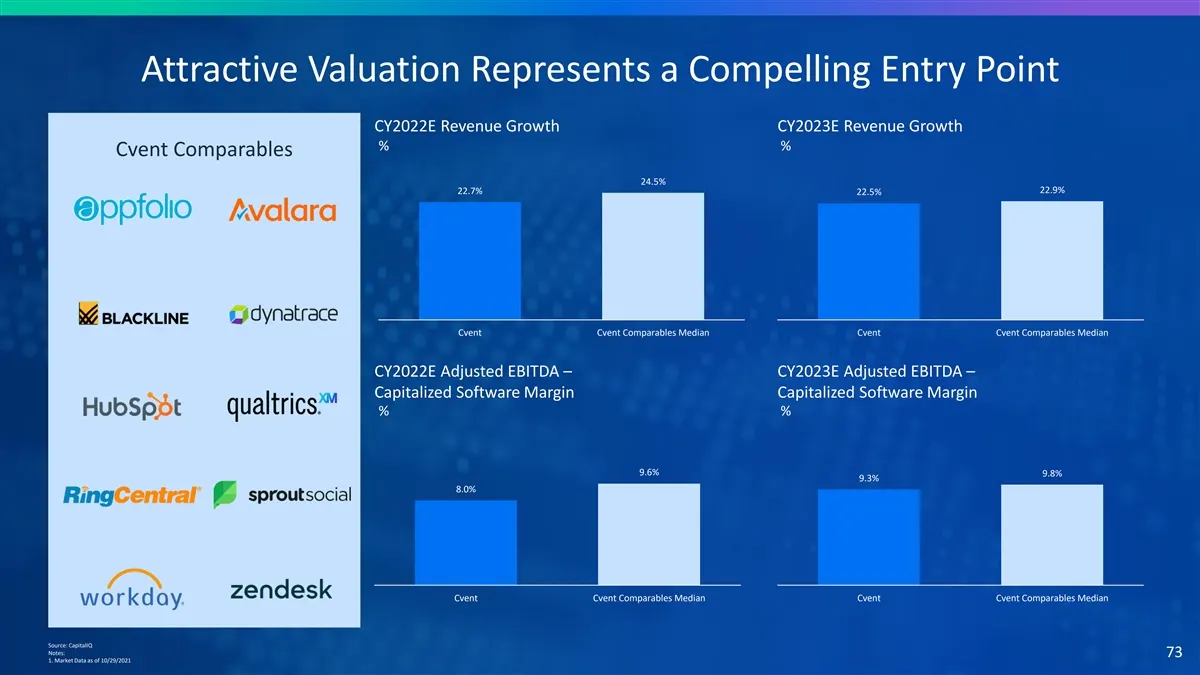
Slide 74: Attractive Valuation: Revenue Growth and Margin vs Comparables
Attractive Valuation Represents a Compelling Entry Point CY2022E Revenue Growth CY2023E Revenue Growth % % Cvent Comparables 24.5% 22.7% 22.9% 22.5% Cvent Cvent Comparables Median Cvent Cvent Comparables Median CY2022E Adjusted EBITDA – CY2023E Adjusted EBITDA – Capitalized Software Margin Capitaliz
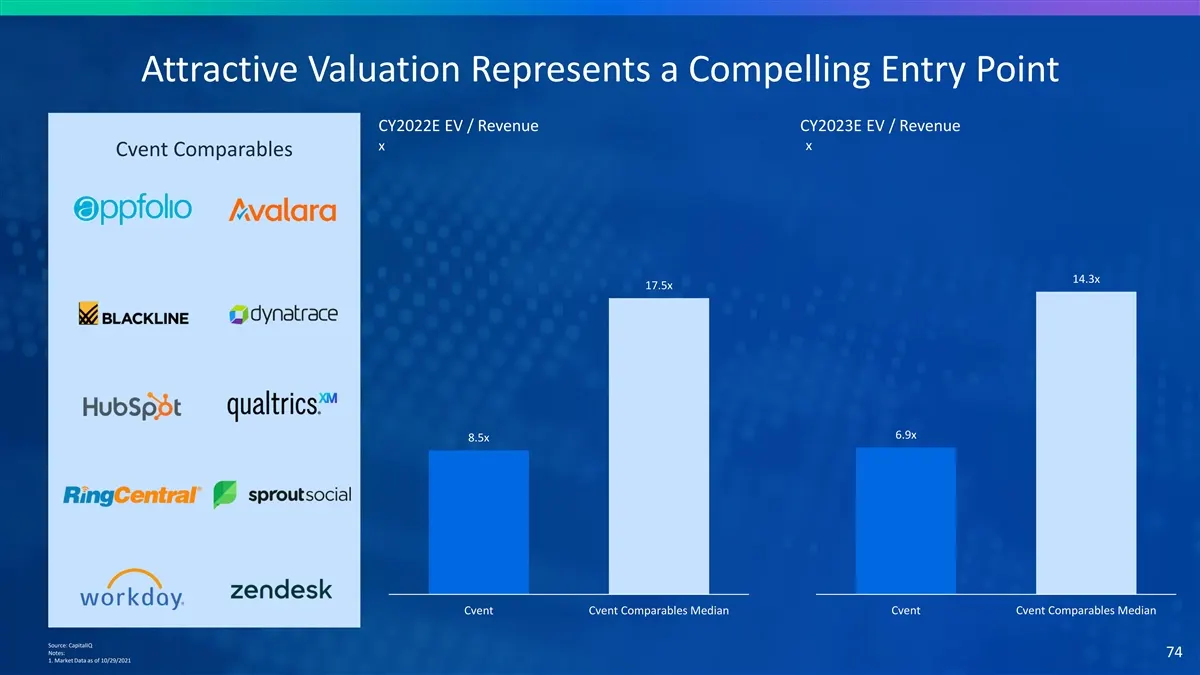
Slide 75: Attractive Valuation: EV / Revenue
Attractive Valuation Represents a Compelling Entry Point CY2022E EV / Revenue CY2023E EV / Revenue x x Cvent Comparables 14.3x 17.5x 6.9x 8.5x Cvent Cvent Comparables Median Cvent Cvent Comparables Median Source: CapitalIQ Notes: 74 1. Market Data as of 10/29/2021
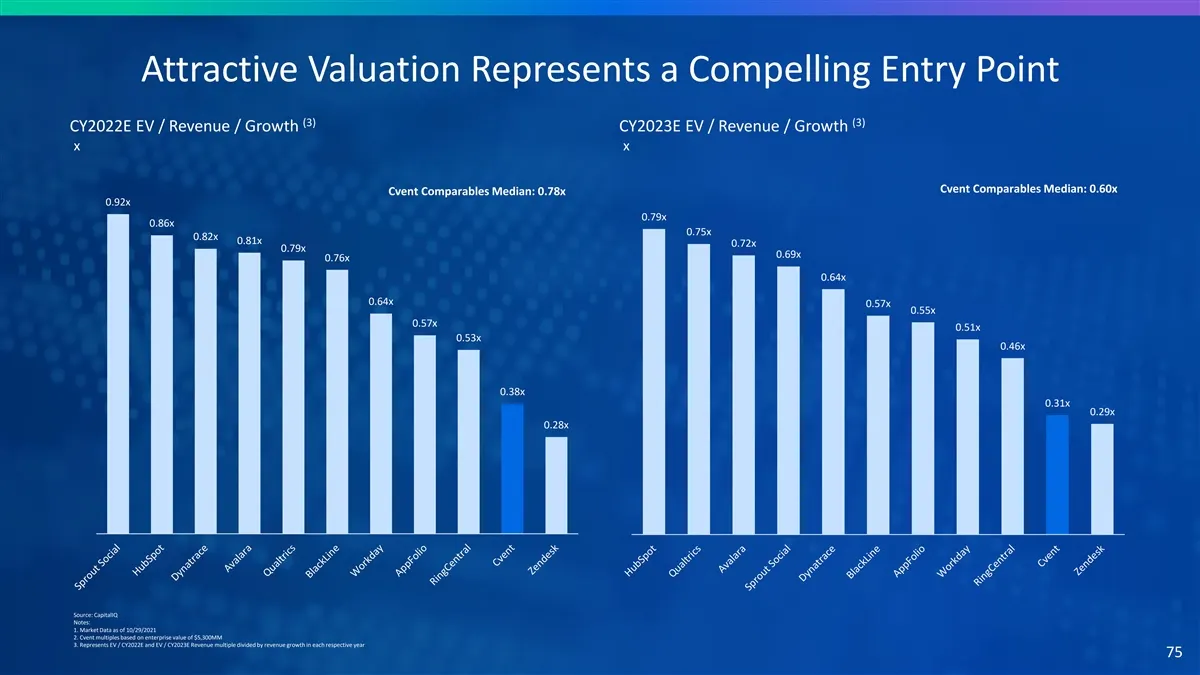
Slide 76: Attractive Valuation: EV / Revenue / Growth
Attractive Valuation Represents a Compelling Entry Point (3) (3) CY2022E EV / Revenue / Growth CY2023E EV / Revenue / Growth x x Cvent Comparables Median: 0.60x Cvent Comparables Median: 0.78x 0.92x 0.79x 0.86x 0.75x 0.82x 0.81x 0.72x 0.79x 0.69x 0.76x 0.64x 0.64x 0.57x 0.55x 0.57x 0.51x 0.53x 0.46x
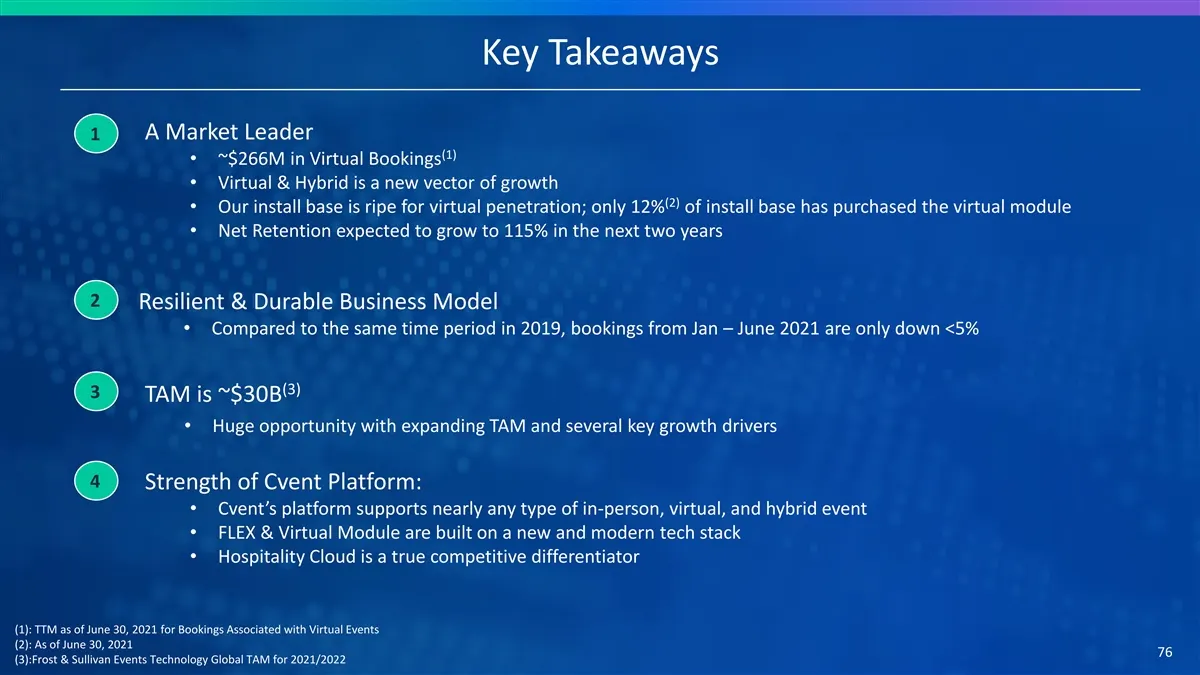
Slide 77: Key Takeaways
Key Takeaways 1 A Market Leader (1) • ~$266M in Virtual Bookings • Virtual & Hybrid is a new vector of growth (2) • Our install base is ripe for virtual penetration; only 12% of install base has purchased the virtual module • Net Retention expected to grow to 115% in the next two years 2 Resilient &

Slide 78: Appendix
Appendix
Slide 79: Adjusted Revenue Reconciliation
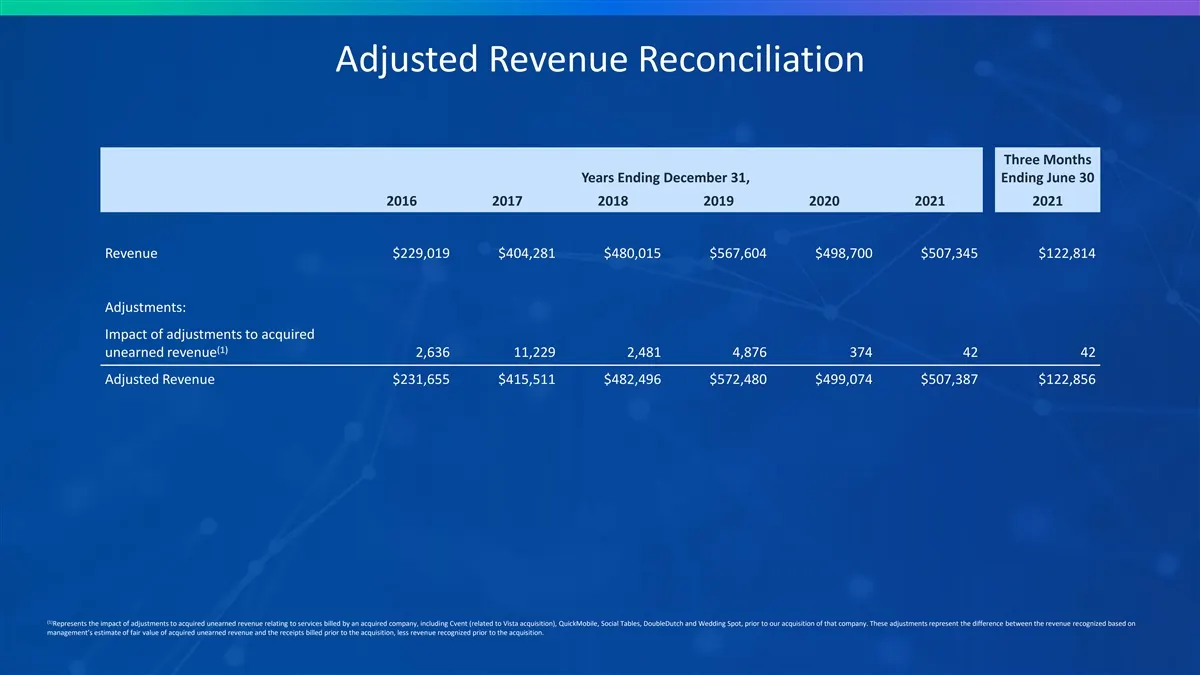
Adjusted Revenue Reconciliation Three Months Years Ending December 31, Ending June 30 2016 2017 2018 2019 2020 2021 2021 Revenue $229,019 $404,281 $480,015 $567,604 $498,700 $507,345 $122,814 Adjustments: Impact of adjustments to acquired (1) unearned revenue 2,636 11,229 2,481 4,876 374 42 42 Adjus
Slide 80: Adjusted Gross Margin Reconciliation
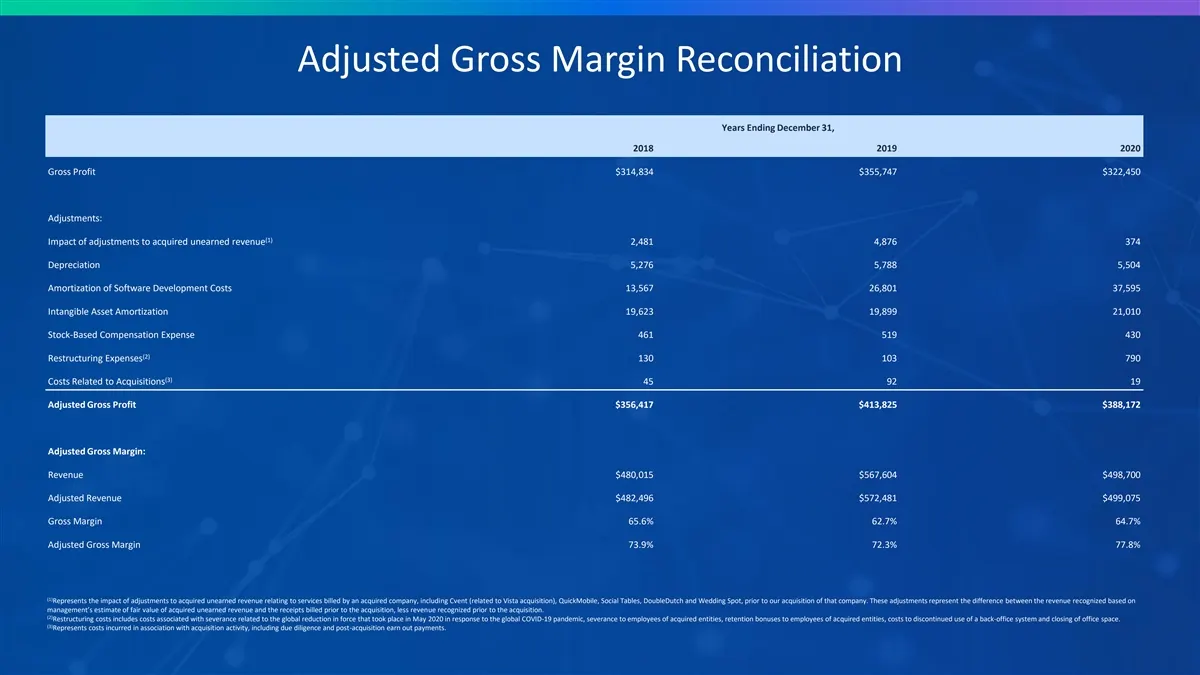
Adjusted Gross Margin Reconciliation Years Ending December 31, 2018 2019 2020 Gross Profit $314,834 $355,747 $322,450 Adjustments: (1) Impact of adjustments to acquired unearned revenue 2,481 4,876 374 Depreciation 5,276 5,788 5,504 Amortization of Software Development Costs 13,567 26,801 37,595 Int
Slide 81: Adjusted EBITDA and Adjusted EBITDA Margin Reconciliation
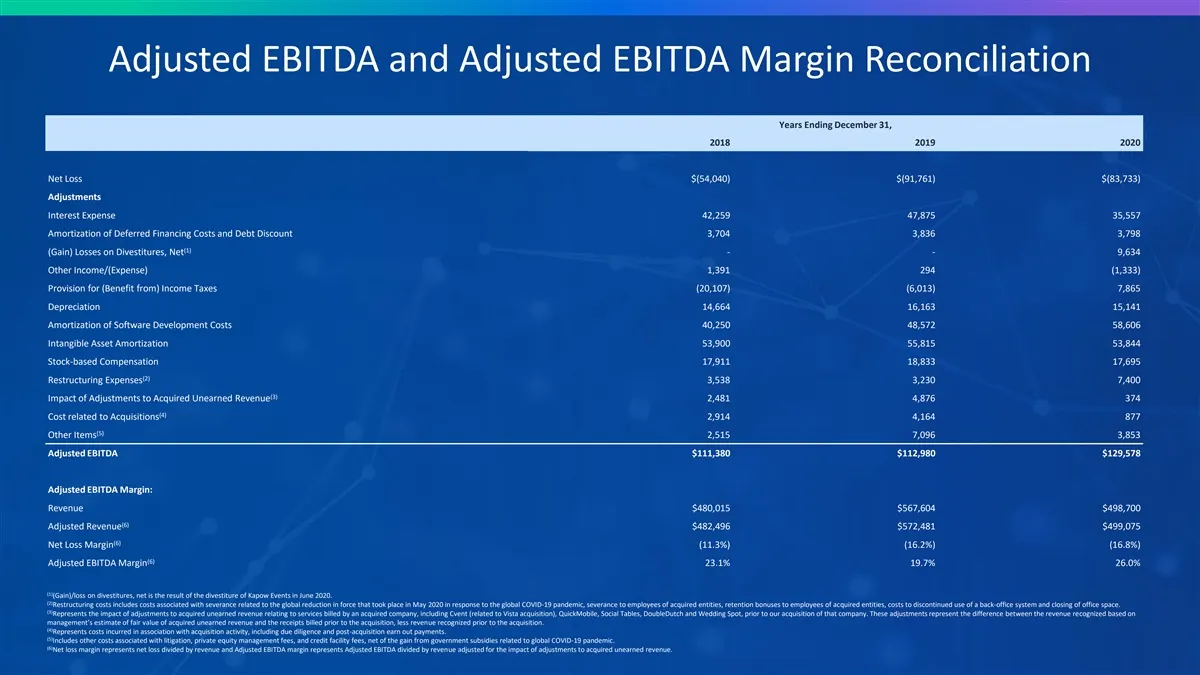
Adjusted EBITDA and Adjusted EBITDA Margin Reconciliation Years Ending December 31, 2018 2019 2020 Net Loss $(54,040) $(91,761) $(83,733) Adjustments Interest Expense 42,259 47,875 35,557 Amortization of Deferred Financing Costs and Debt Discount 3,704 3,836 3,798 (1) (Gain) Losses on Divestitures,
Slide 82: Adjusted Free Cash Flow Reconciliation
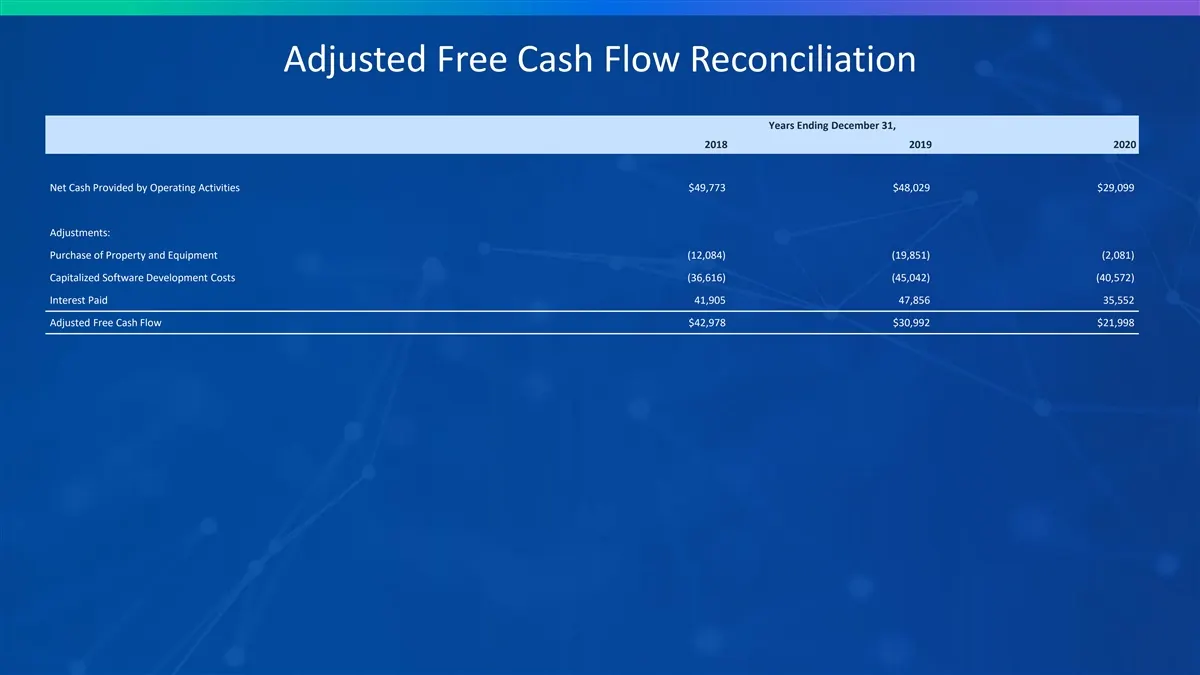
Adjusted Free Cash Flow Reconciliation Years Ending December 31, 2018 2019 2020 Net Cash Provided by Operating Activities $49,773 $48,029 $29,099 Adjustments: Purchase of Property and Equipment (12,084) (19,851) (2,081) Capitalized Software Development Costs (36,616) (45,042) (40,572) Interest Paid
Slide 83: Summary Risk Factors
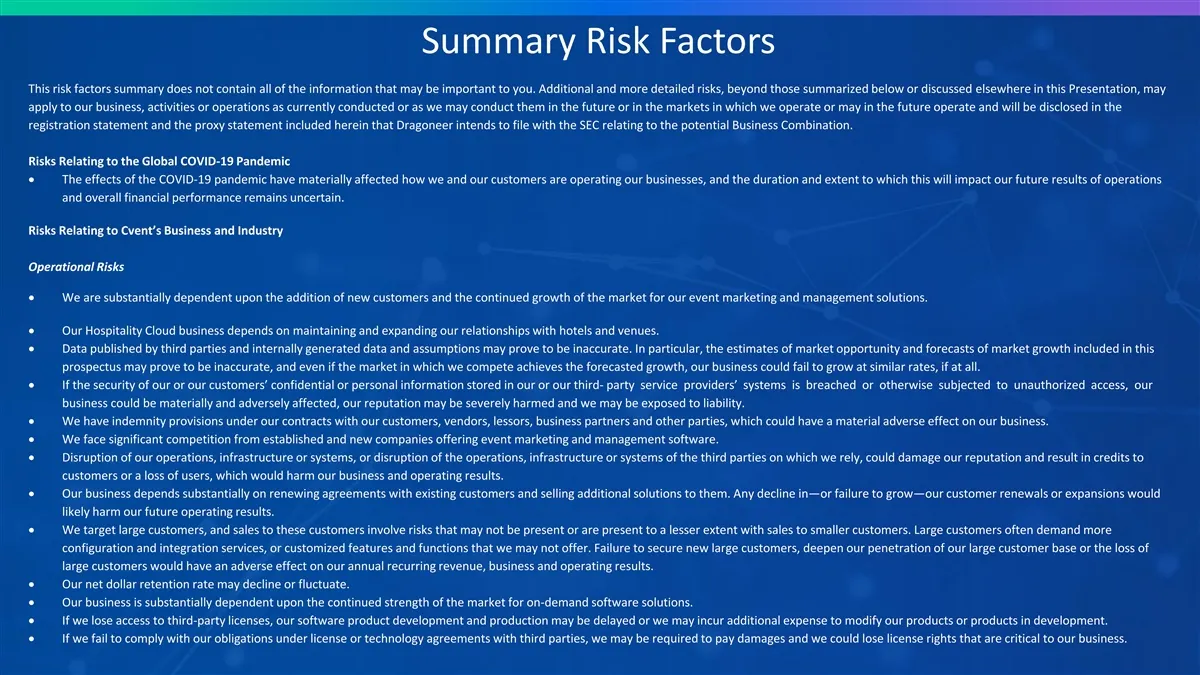
Summary Risk Factors This risk factors summary does not contain all of the information that may be important to you. Additional and more detailed risks, beyond those summarized below or discussed elsewhere in this Presentation, may apply to our business, activities or operations as currently conduct
Slide 84: Summary Risk Factors
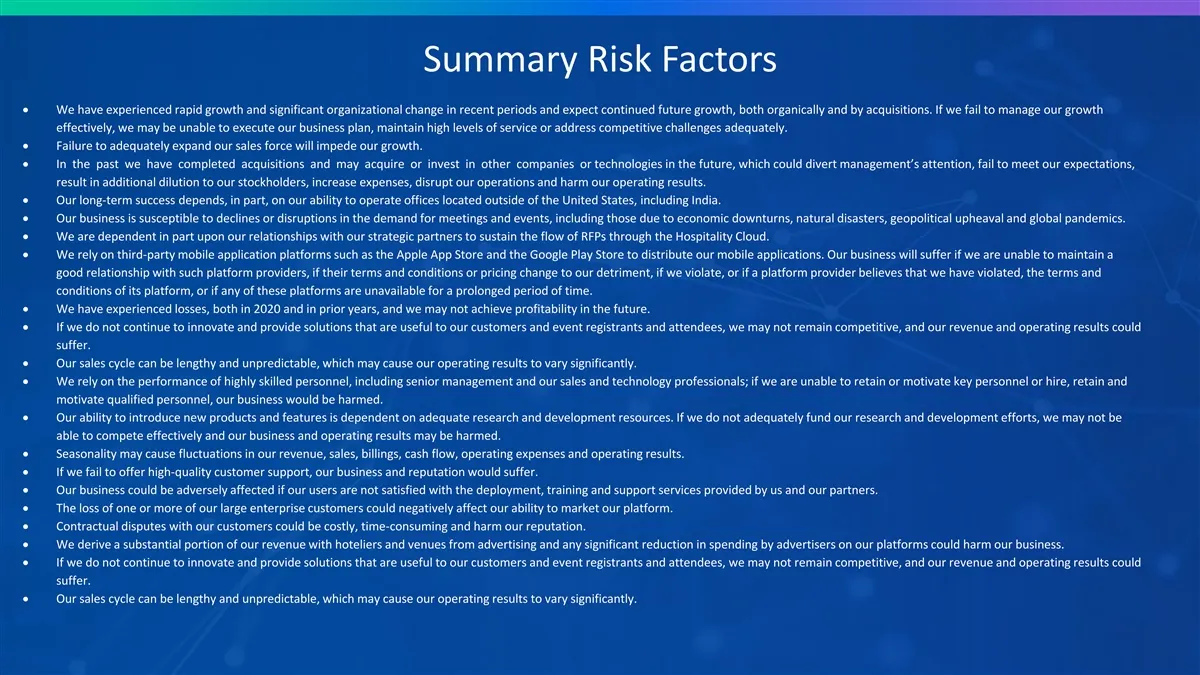
Summary Risk Factors • We have experienced rapid growth and significant organizational change in recent periods and expect continued future growth, both organically and by acquisitions. If we fail to manage our growth effectively, we may be unable to execute our business plan, maintain high levels o
Slide 85: Summary Risk Factors
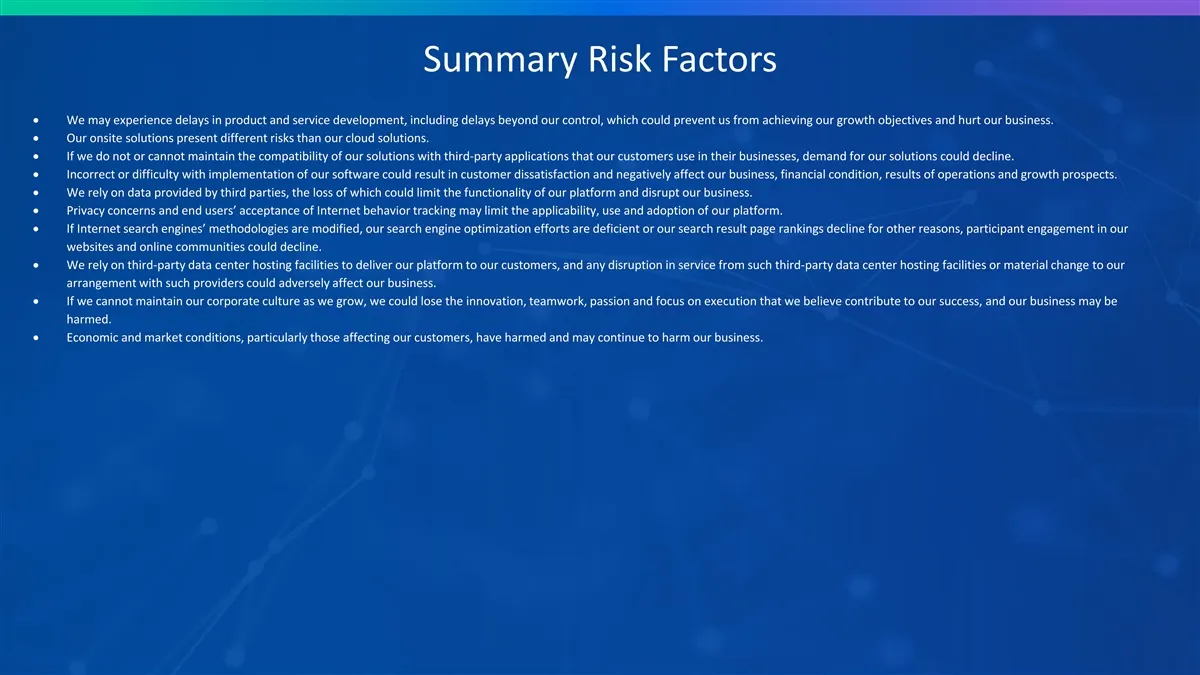
Summary Risk Factors • We may experience delays in product and service development, including delays beyond our control, which could prevent us from achieving our growth objectives and hurt our business. • Our onsite solutions present different risks than our cloud solutions. • If we do not or canno
Slide 86: Summary Risk Factors
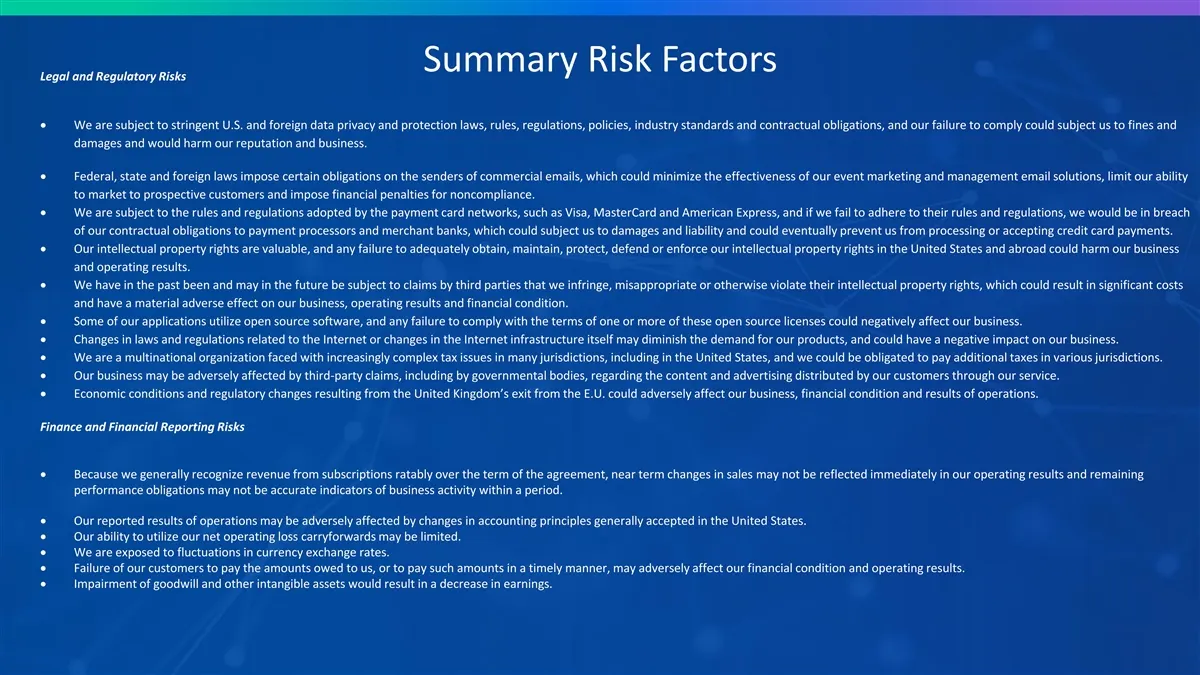
Summary Risk Factors Legal and Regulatory Risks • We are subject to stringent U.S. and foreign data privacy and protection laws, rules, regulations, policies, industry standards and contractual obligations, and our failure to comply could subject us to fines and damages and would harm our reputation
Slide 87: Summary Risk Factors
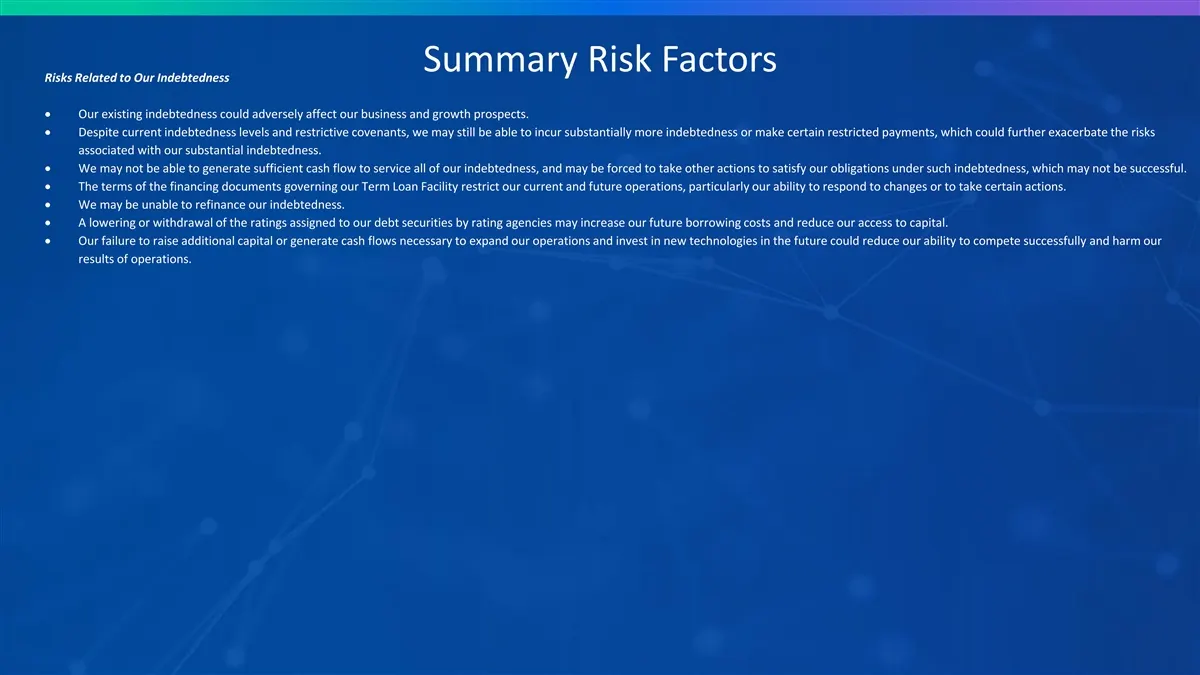
Summary Risk Factors Risks Related to Our Indebtedness • Our existing indebtedness could adversely affect our business and growth prospects. • Despite current indebtedness levels and restrictive covenants, we may still be able to incur substantially more indebtedness or make certain restricted payme
Source: SEC EDGAR · 425 filed Nov 3, 2021
More decks from Cvent Holding Corp
 Investor Presentation (March 2022)54 slides · Mar 7, 2022
 Dragoneer Growth Opportunities Corp. II — SPAC Merger (December 2021)5 slides · Dec 7, 2021
 Dragoneer Growth Opportunities Corp. II — SPAC Merger (December 2021)82 slides · Dec 3, 2021
 Dragoneer Growth Opportunities Corp. II — SPAC Merger (December 2021)11 slides · Dec 2, 2021
 Dragoneer Growth Opportunities Corp. II — Wells Fargo 5th Annual TMT Summit 202137 slides · Nov 30, 2021
 Dragoneer Growth Opportunities Corp. II — SPAC Merger (November 2021)34 slides · Nov 10, 2021