APP Pharmaceuticals — Morgan Stanley Global Healthcare Unplugged Conference (September 2008)
26 slides from APP Pharmaceuticals's conference presentation, Sep 9, 2008
Slide 1: Morgan Stanley Global Healthcare Unplugged Conference
Morgan Stanley Global Healthcare Unplugged Conference Filed by Fresenius Kabi Pharmaceuticals Holding, Inc. pursuant to Rule 425 under the Securities Act of 1933 Subject Company: APP Pharmaceuticals, Inc. Commission File No.: 333-152690 September 9,
Slide 2: Safe Harbor Statement
Safe Harbor Statement This presentation contains forward-looking statements that are subject to various risks and uncertainties. Future results could differ materially from those described in these forward- looking statements due to certain factors, e.g. changes in business, economic and competitive
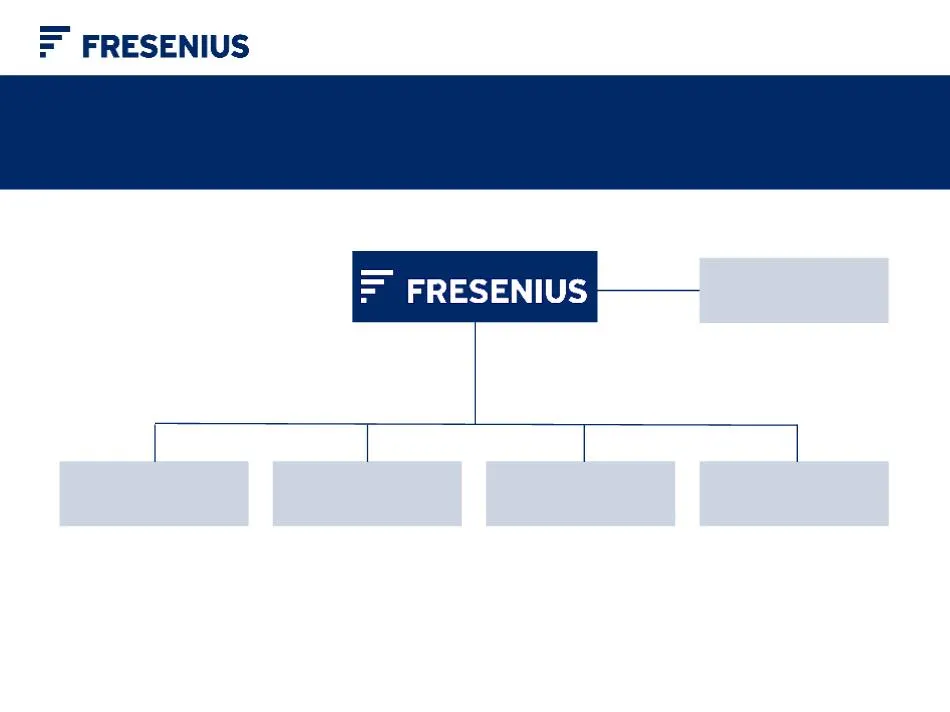
Slide 3: Achieving Profitable Growth in Attractive Health Care Segments
Achieving Profitable Growth in Attractive Health Care Segments Fresenius Biotech Fresenius Helios Hospital Operations Fresenius Vamed Engineering and Services for Health Care Facilities Fresenius Medical Care Dialysis Equipment and Services Fresenius Kabi Infusion and Nutrition Therapies Oncology an
Slide 4: Fresenius Group: Financial Results
Sales EBIT Net income Fresenius Group: Financial Results Growth at constant currency rates Growth at actual currency rates H1/08 € 5,710 m € 781 m € 212 m % % % % % %
Slide 5: Fresenius Group: Double-digit Sales Growth in all Business Segments
Fresenius Medical Care Fresenius Kabi Fresenius Helios Fresenius Vamed Fresenius Group: Double-digit Sales Growth in all Business Segments H1/08 US $ 5,177 m % US $ 818 m 8 % € 1,121 m 14 % € 181 m 14 % € 1,040 m 17 % € 83 m 22 % € 177 m 11 % € 9 m 0 %
Slide 6: Fresenius Kabi: Update H1/08
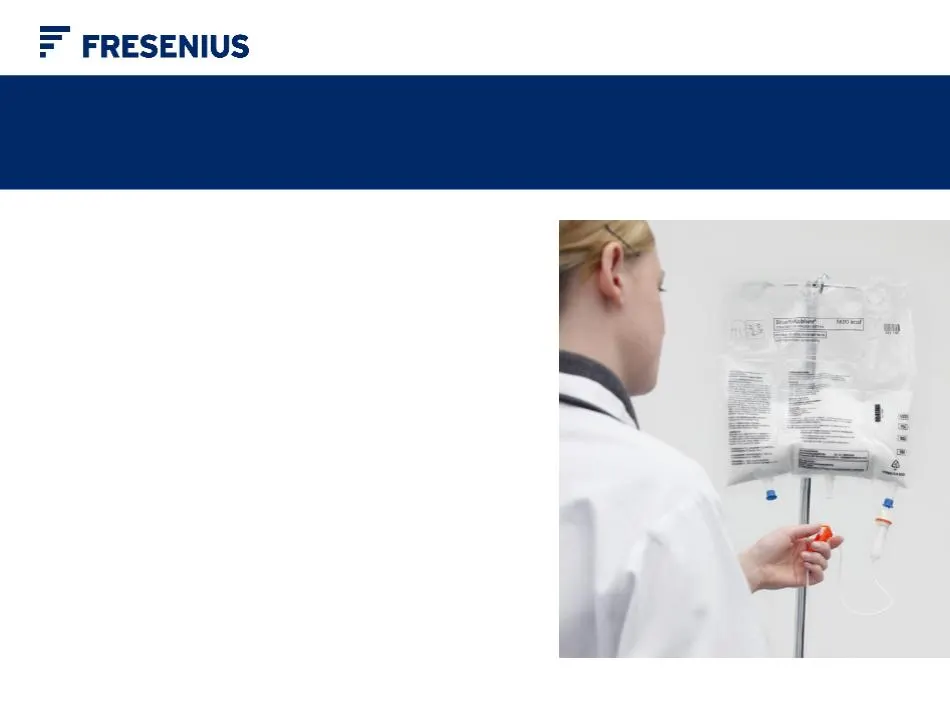
Fresenius Kabi: Update H1/08 - Excellent organic sales growth of 10 % - Performance of 2007 acquisitions fully in line with our expectations - Dabur Pharma: Successful closing of transaction - APP Pharmaceuticals - outstanding opportunity for Fresenius Kabi in the U.S.
Slide 7: APP Pharmaceuticals - Acquisition Highlights
APP Pharmaceuticals - Acquisition Highlights - APP Pharmaceuticals - a leading U.S. I.V. generic drugs company - Dedicated to the highest quality and medical excellence - Successful, well-established company enhancing Fresenius Kabi‘s profitability - Platform for further growth in the U.S. for Frese
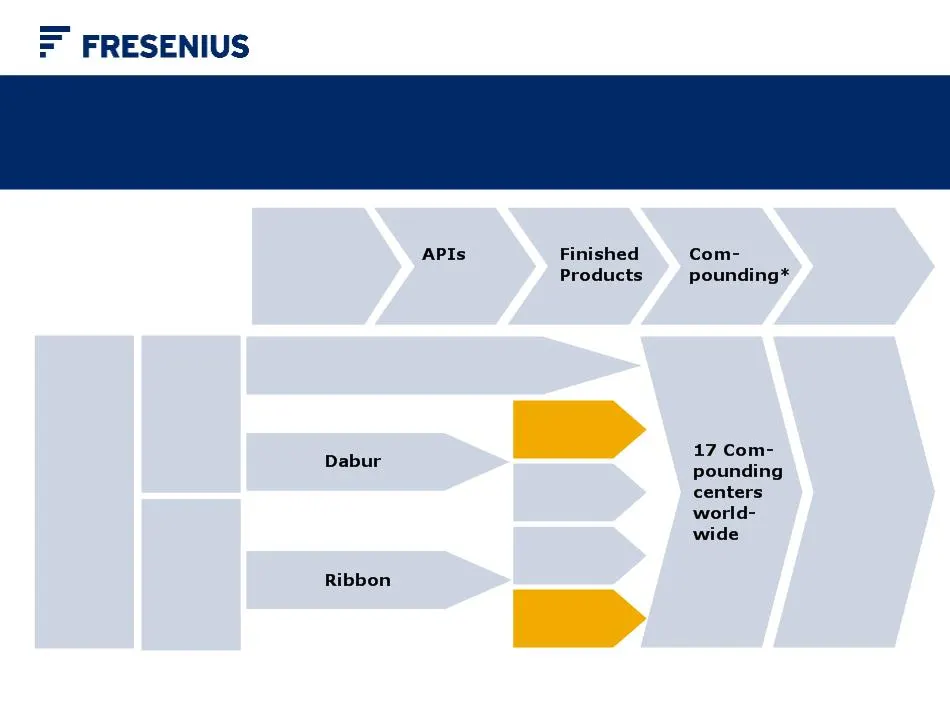
Slide 8: APP Provides an Excellent Strategic Fit to Fresenius Kabi's I.V. Drug Business
APP Provides an Excellent Strategic Fit to Fresenius Kabi‘s I.V. Drug Business * Primarily for oncological products Raw Materials Fresenius Kabi Oncology Other I.V. Drugs Dabur APP Labesfal Adminis- tration Medical Devices, Dis- posables Filaxis APP
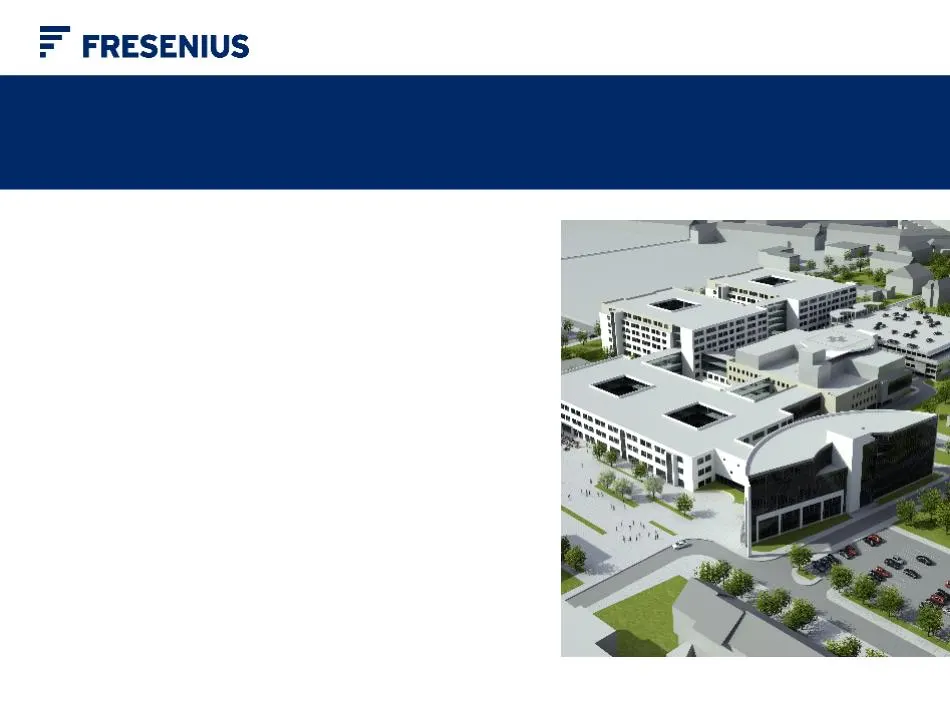
Slide 9: Fresenius Helios: Update H1/08
New Krefeld hospital Fresenius Helios: Update H1/08 - Strong organic revenue growth of %* - 1.8 % EBIT margin progression in established clinics - Smooth integration of Krefeld/Hüls hospitals - ~9 % increase in hospital admissions - Krefeld hospital construction plans finalized; investment of ~ € 18
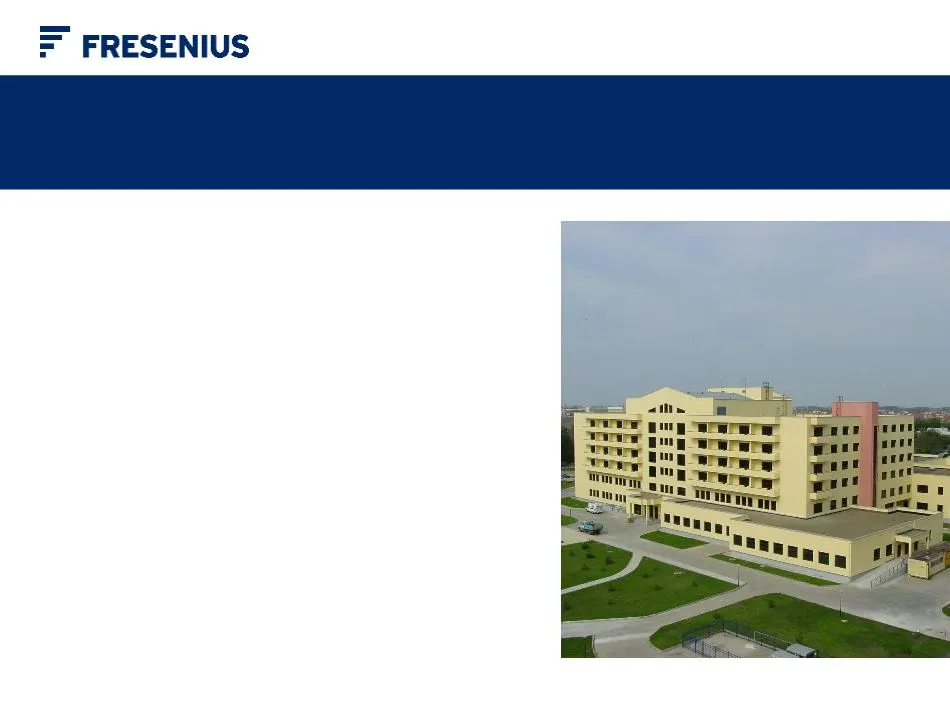
Slide 10: Fresenius Vamed: Update H1/08
Krasnodar hospital (model), Russia Fresenius Vamed: Update H1/08 - H1/08 financial results fully on track to meet 2008 guidance - Strong order intake in H1/08 - € 25 m awarded for the hospital extension in Oberndorf/Austria - € 8 m for medical technical equipment supply for 25 hospitals in Sri Lanka
Slide 11: Fresenius Business Segments: Financial Outlook 2008 Fully Confirmed
Fresenius Business Segments: Financial Outlook 2008 Fully Confirmed Fresenius Medical Care Sales > US$ 10.4 bn Net income US$ 805 - 825 m Fresenius Kabi Sales growth (cc) 12 - - 15 % EBIT margin ~16.5 % Fresenius Helios Sales > € 2,050 m EBIT € 160 - 170 m Fresenius Vamed Sales growth 5 - - 10 % EBI
Slide 12: Fresenius Group: Outlook 2008 Fully Confirmed
Fresenius Group: Outlook 2008 Fully Confirmed Revenue growth in constant currency 8 - 10 % Net income growth in constant currency - - 15 % Guidance Capex ~ € 750 m
Slide 13: Attachments
Attachments
Slide 14: Fresenius Group: Profit and Loss Statement
actual constant rates rates Fresenius Group: Profit and Loss Statement €m Q2/08 H1/08 H1/08 YoY Remarks Sales 2,912 5,710 2 % 9 % Organic growth: 6 % EBIT 404 781 0 % 8 % Margin: 13.7 % Interest result -83 - -167 10 % 2 % Positive currency impact, lower average rates Taxes -111 - -214 0 % - -8 % Tax
Slide 15: Fresenius Group: Cash Flow
Fresenius Group: Cash Flow Q2/08 H1/08 YoY Remarks €m Cash flow 324 624 7 % Strong earnings growth Change in working capital -121 - -143 -- Operating Cash flow 203 481 -13 % Margin: 8.4 % Capex (net) -171 -332 -13 % On track for full-year guidance Cash flow 32 149 -42 % (bf. acquisitions and dividen
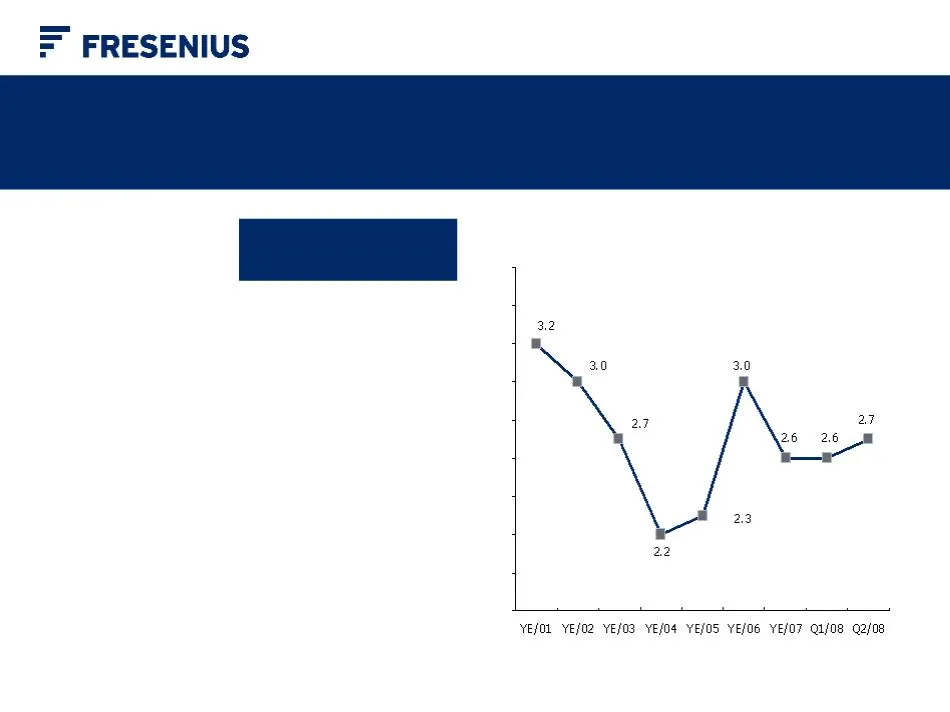
Slide 16: Fresenius Group: Debt and Interest Ratios
June 30, Dec 31, 2008 2007 Fresenius Group: Debt and Interest Ratios Net debt/EBITDA 3.6 3.0 2.8 2.6 2.4 2.2 2.0 1.8 3.4 3.2 Debt (€m) 5,805 5,699 Net debt (€m) 5,464 5,338 Net debt/EBITDA 2.7 2.6 EBITDA/Interest 6.0 5.5
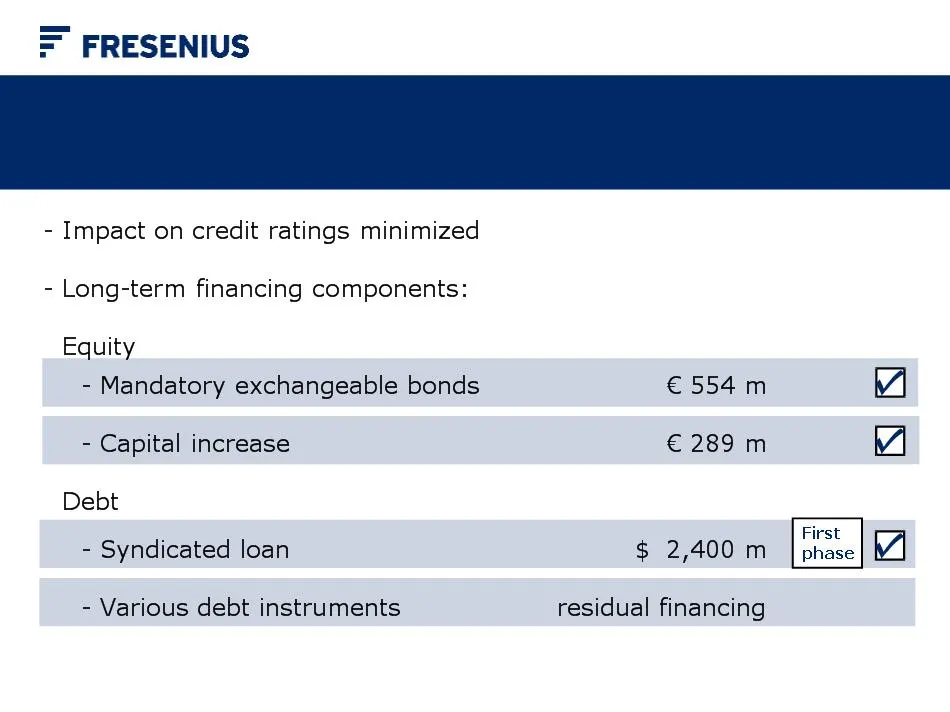
Slide 17: APP Acquisition Financing: Execution Fully on Track
APP Acquisition Financing: Execution Fully on Track
Slide 18: Fresenius Kabi: Organic Sales Growth of 10 %
H1/08 H1/07 Change Organic Growth Fresenius Kabi: Organic Sales Growth of 10 % €m Germany 0 % 2 % Europe ex Germany 16 % 7 % Asia-Pacific 24 % 27 % Latin America 84 66 27 % 9 % RoW 108 101 7 % 11 % Total sales 1,121 986 14 % 10 %
Slide 19: Fresenius Kabi: Strong Sales Growth in H1/2008
Organic H1/08 H1/07 Growth Fresenius Kabi: Strong Sales Growth in H1/2008 €m Sales 1,121 10 % By Product Segment: Infusion Therapy 529 6 % Clinical Nutrition 13 % Transfusion Technology 19 %
Slide 20: Fresenius Kabi: Strong EBIT Growth
H1/08 H1/07 Growth Fresenius Kabi: Strong EBIT Growth €m Total EBIT % Margin 16.1 % 16.1 % By Region: Europe 162 145 12 % Margin 21.6 % 21.5 % International 50 20 % Margin 16.1 % 16.0 % Corporate and Corporate R&D -41 -36 -14 %
Slide 21: Fresenius Helios: Outstanding Sales Growth
H1/08 H1/07 Growth Fresenius Helios: Outstanding Sales Growth €m Total sales 1,040 890 17 % - established clinic portfolio 945 890 5 % * - acquisitions (consolidation < 1 yr) 95 0 * growth rate on a like for like basis
Slide 22: Fresenius Helios: Excellent Earnings Development
H1/08 H1/07 Growth Fresenius Helios: Excellent Earnings Development €m Total EBIT 83 68 22 % Margin 8.0 % 7.6 % - established clinic portfolio 89 68 Margin 9.4 % 7.6 % - acquisitions (consolidation < 1 yr) -6 0
Slide 23: Fresenius Helios: Performance Indicators
H1/08 H1/07 Change Fresenius Helios: Performance Indicators * Clinics in Germany ** Dec 31, 2007 No. of hospitals** 60 60 - Acute clinics 40 40 - Postacute care clinics 20 20 No. of beds** 17,460 17,192 2 % - Acute clinics 13,699 13,333 3 % - Postacute care clinics 3,761 3,859 -3 % Admissions* - Acu
Slide 24: Fresenius Vamed: Strong Sales Development
H1/08 H1/07 Change Fresenius Vamed: Strong Sales Development €m Total sales 177 160 11 % By Division: Project business 99 87 14 % Service business 78 73 7 % * project business only ** Dec 31, 2007 Order intake * 170 84 102 % Order backlog * 573 510 12 % **
Slide 25: Fresenius Vamed: EBIT Development According to Plan
H1/08 H1/07 Change Fresenius Vamed: EBIT Development According to Plan €m Total EBIT 9 9 0 % Margin 5.1 % 5.6 % Net income 9 8 13 %
Slide 26: Financial Calendar
Financial Calendar 4.11.2008 Report on 1 st -3 rd quarters Contact Birgit Grund SVP Investor Relations Fresenius SE Telephone: +49 6172 608-2485 e-mail: [email protected] For further information and current news: http://www.fresenius.com
Source: SEC EDGAR · 425 filed Sep 9, 2008