United Financial Bancorp — IPO Roadshow (September 2014)
28 slides from United Financial Bancorp's IPO roadshow presentation, Sep 17, 2014
Slide 1: Subordinated Notes Offering September 2014
Issuer Free Writing Prospectus Dated September 17, 2014 Filed Pursuant to Rule 433 Registration Statement No. 333-198466 Subordinated Notes Offering September 2014 NASDAQ Global Select Market: UBNK United Financial Bancorp, Inc. has filed a registration statement (including a base prospectus) and a
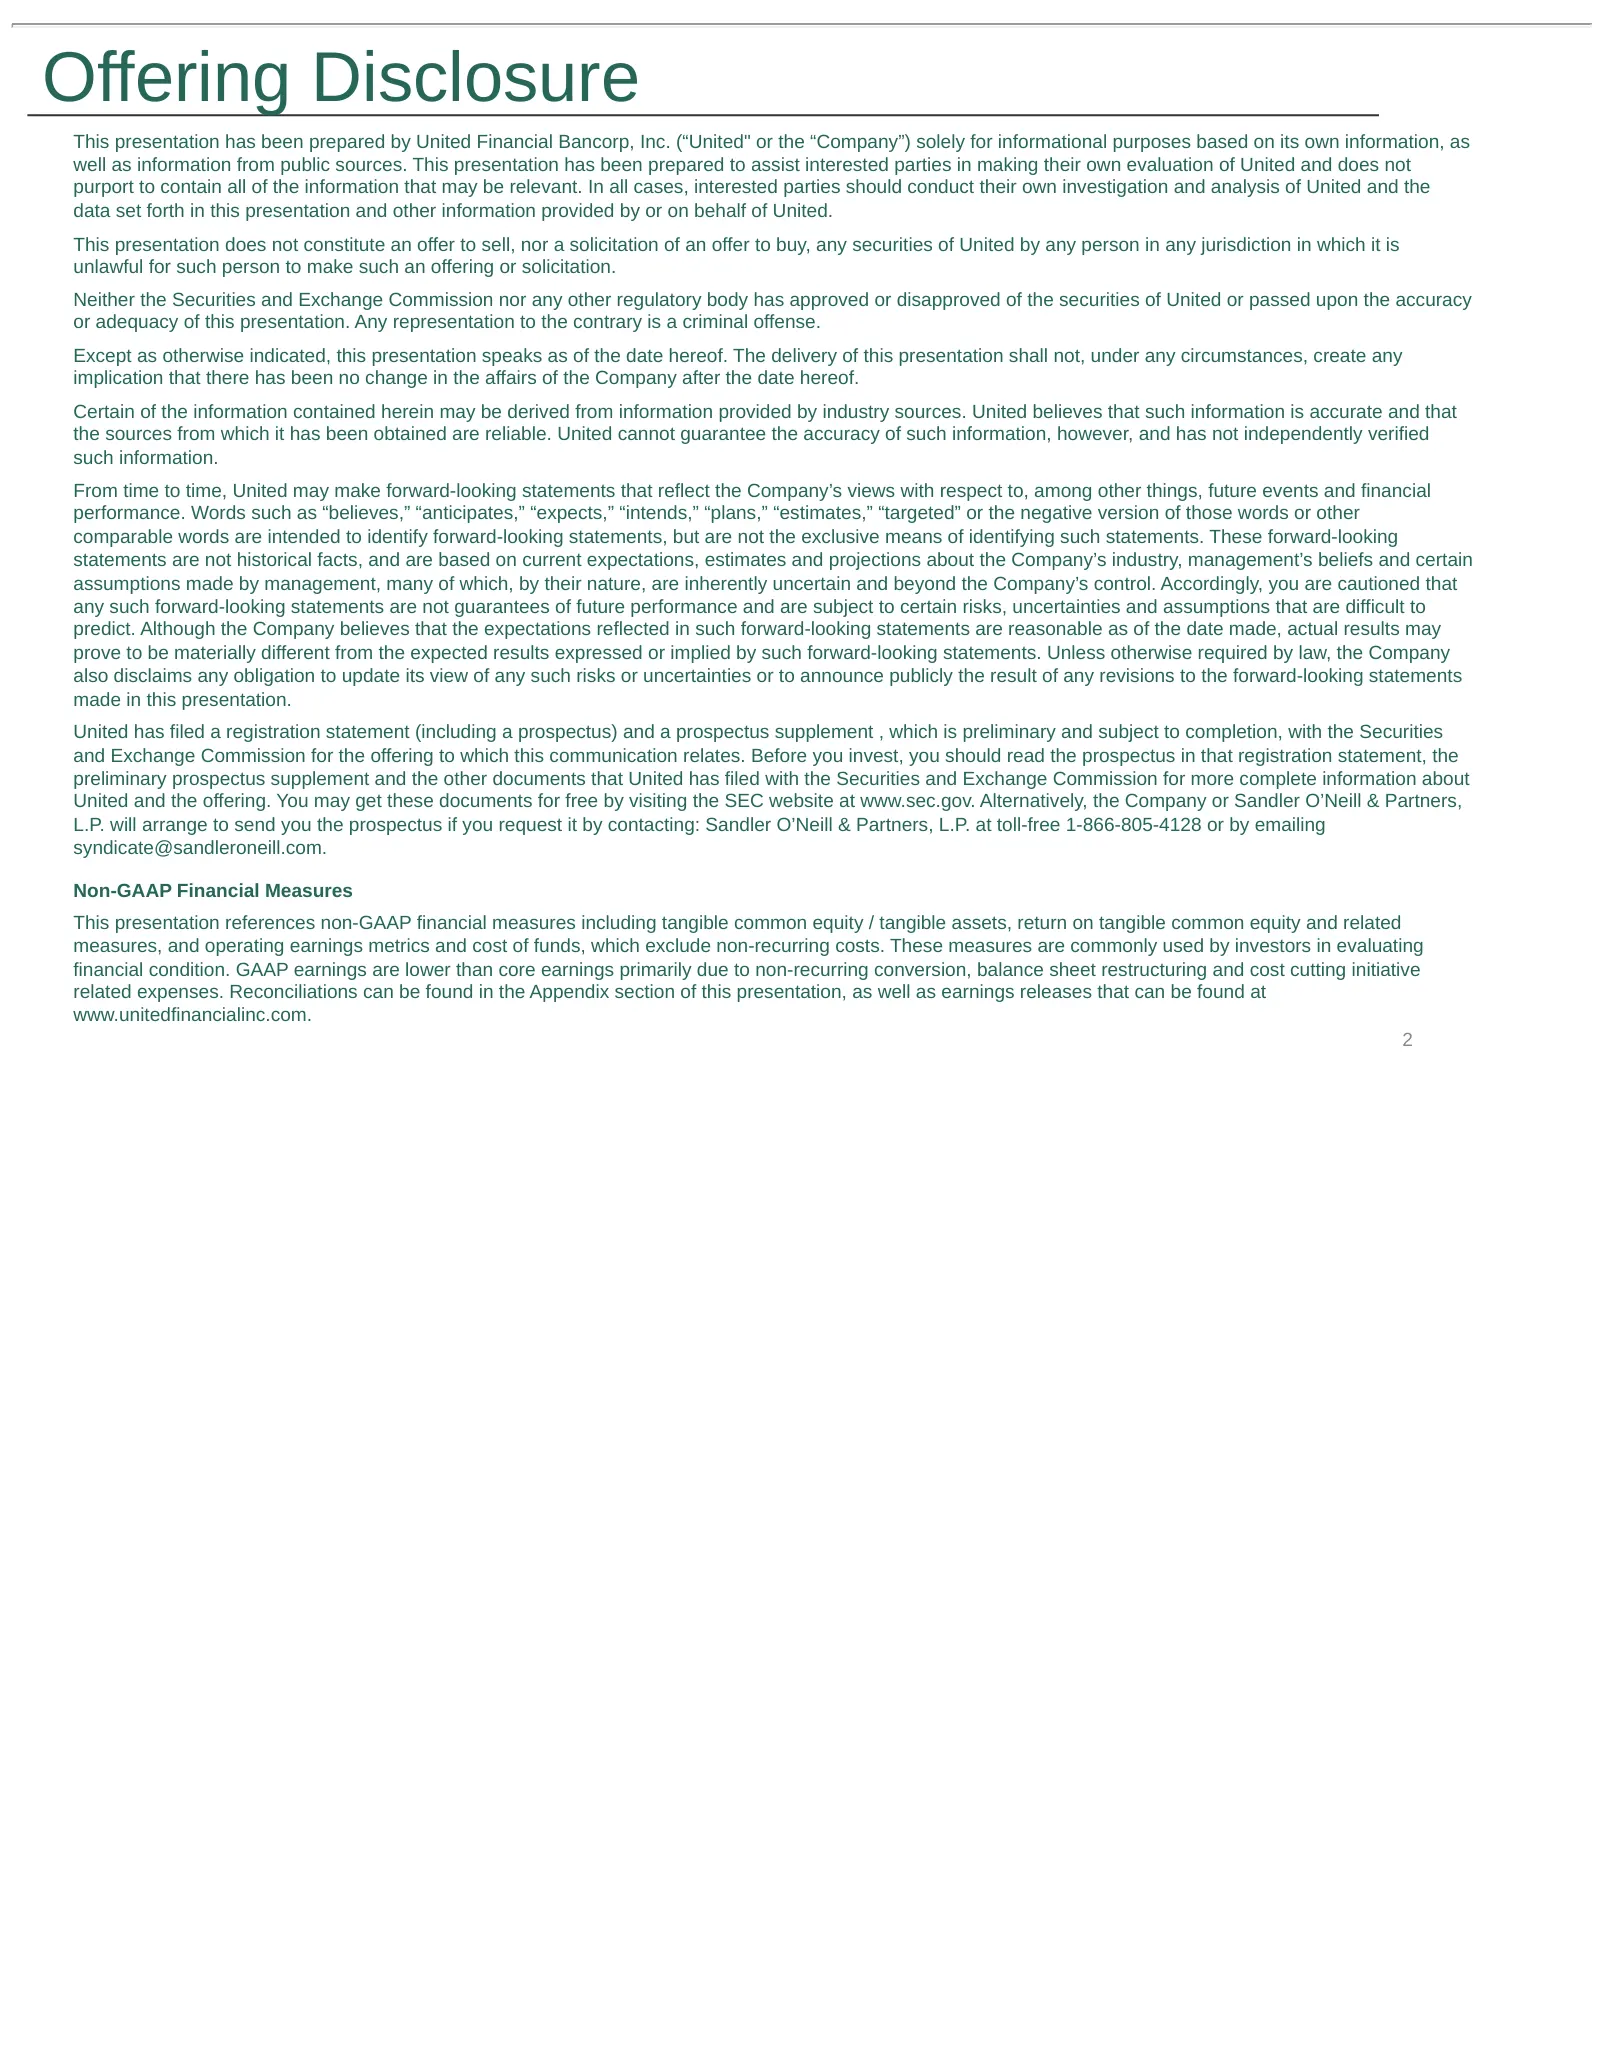
Slide 2: Offering Disclosure
Offering Disclosure This presentation has been prepared by United Financial Bancorp, Inc. (“United" or the “Company”) solely for informational purposes based on its own information, as well as information from public sources. This presentation has been prepared to assist interested parties in making
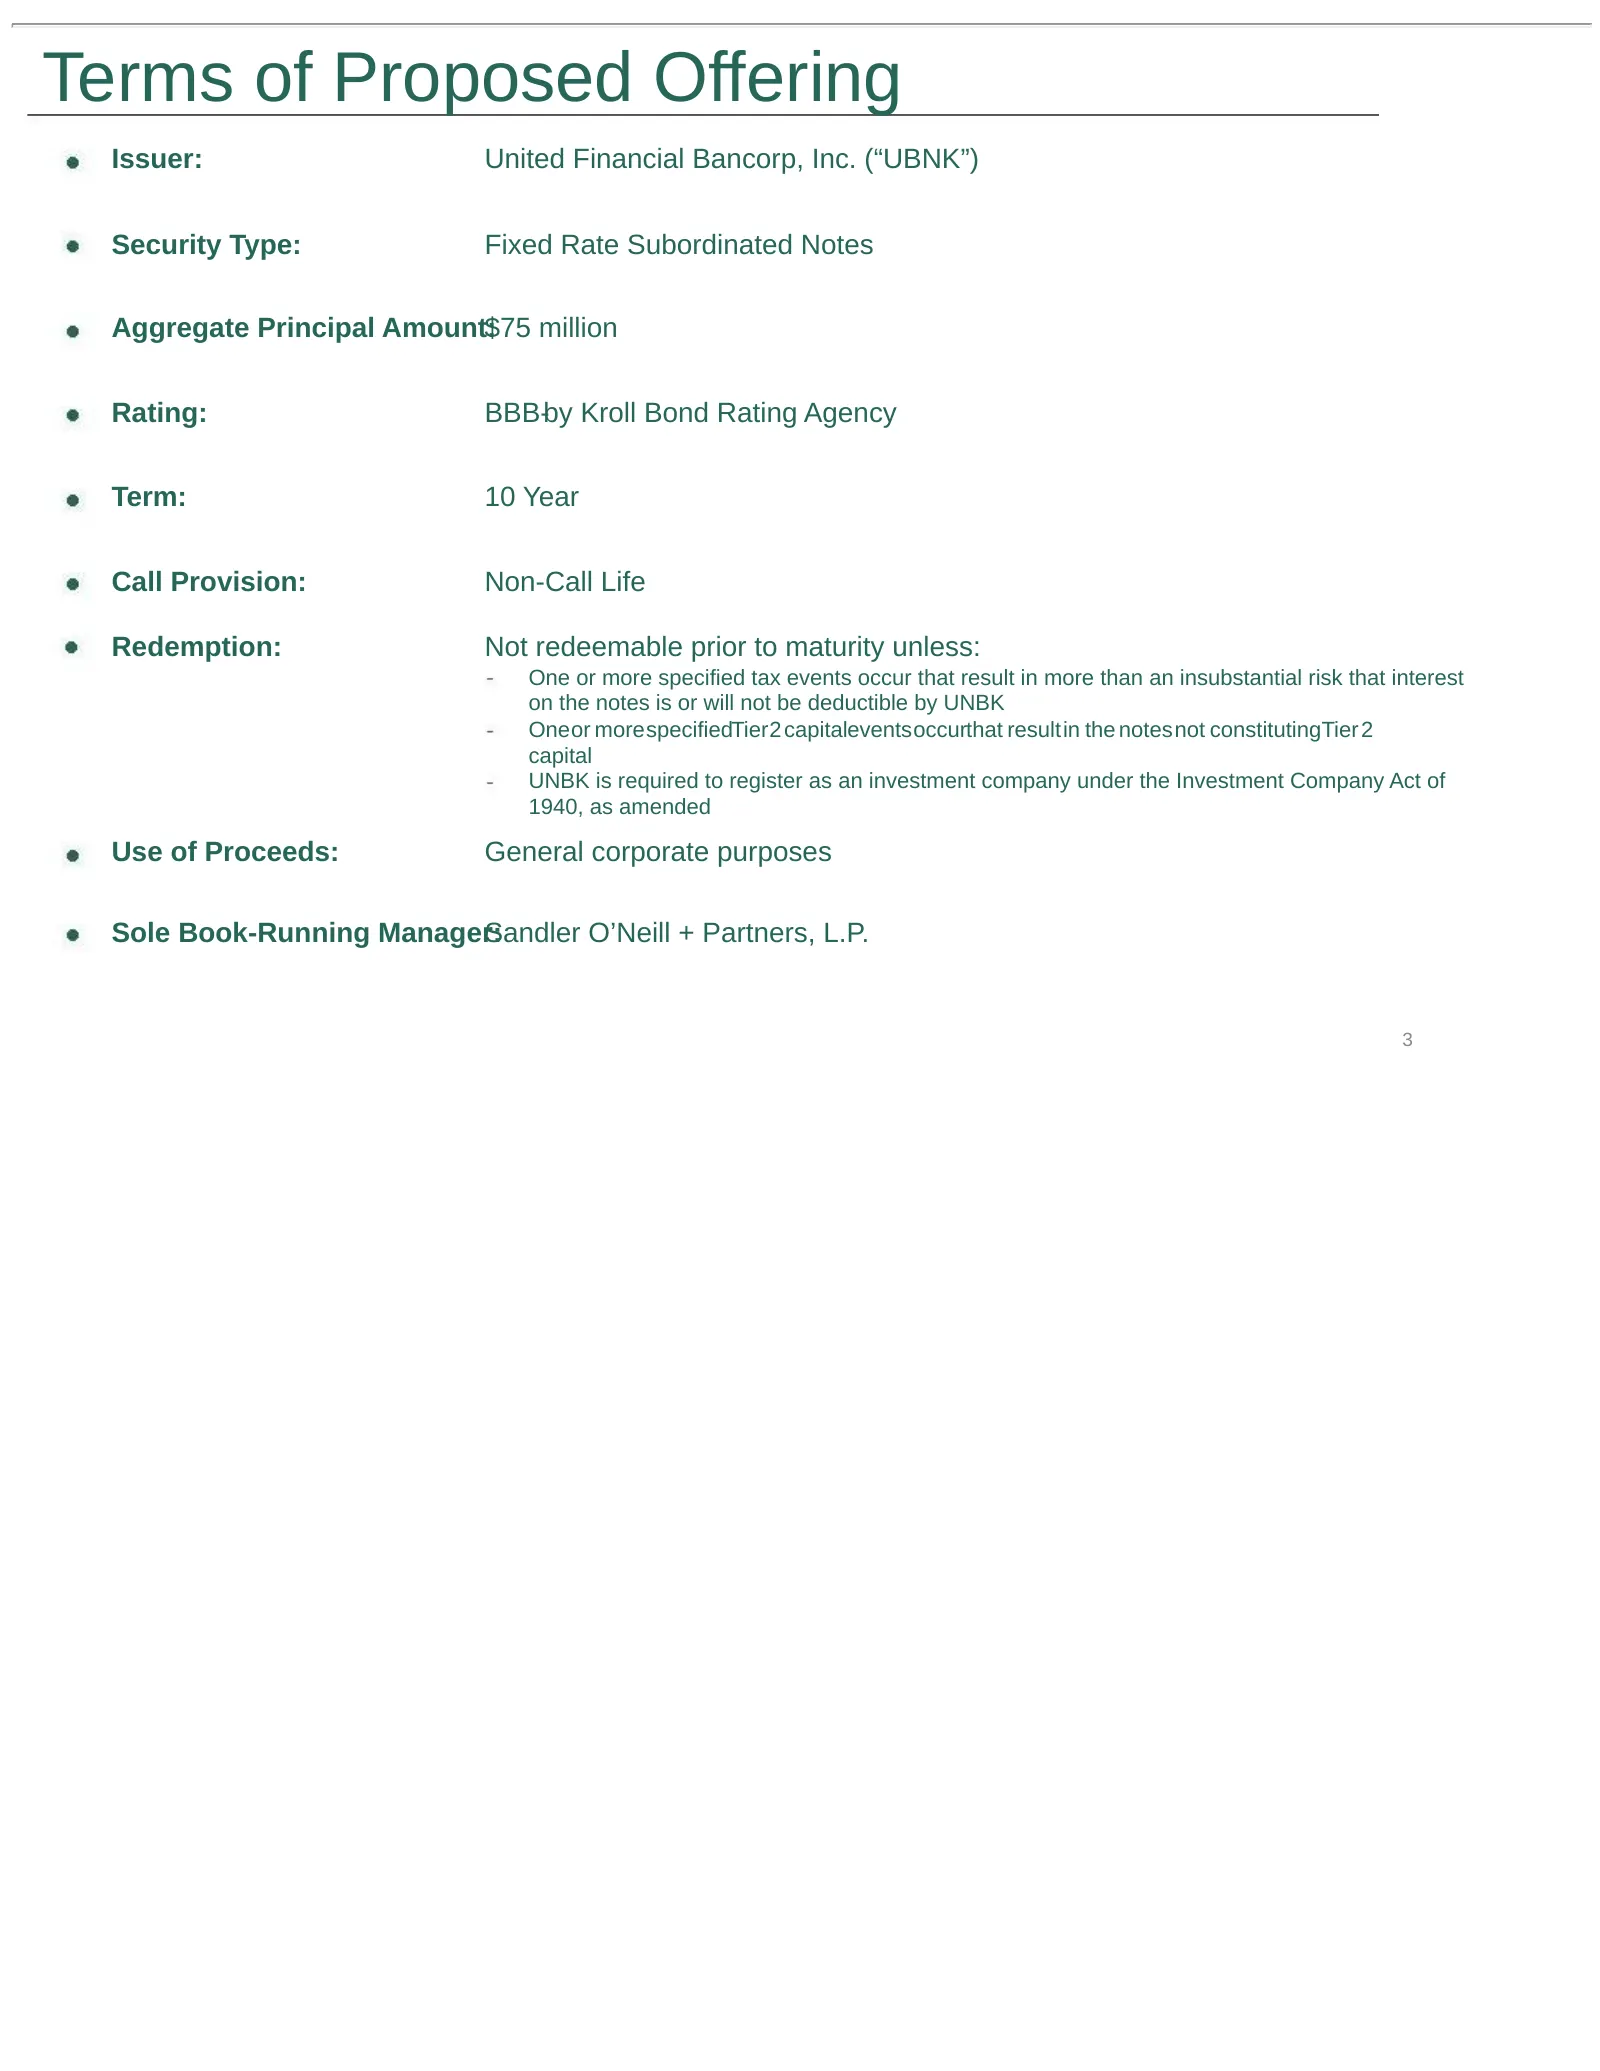
Slide 3: Terms of Proposed Offering
Terms of Proposed Offering Issuer: United Financial Bancorp, Inc. (“UBNK”) Security Type: Fixed Rate Subordinated Notes Aggregate Principal Amount:$75 million Rating: BBB-by Kroll Bond Rating Agency Term: 10 Year Call Provision: Non-Call Life Redemption: Not redeemable prior to maturity unless: One
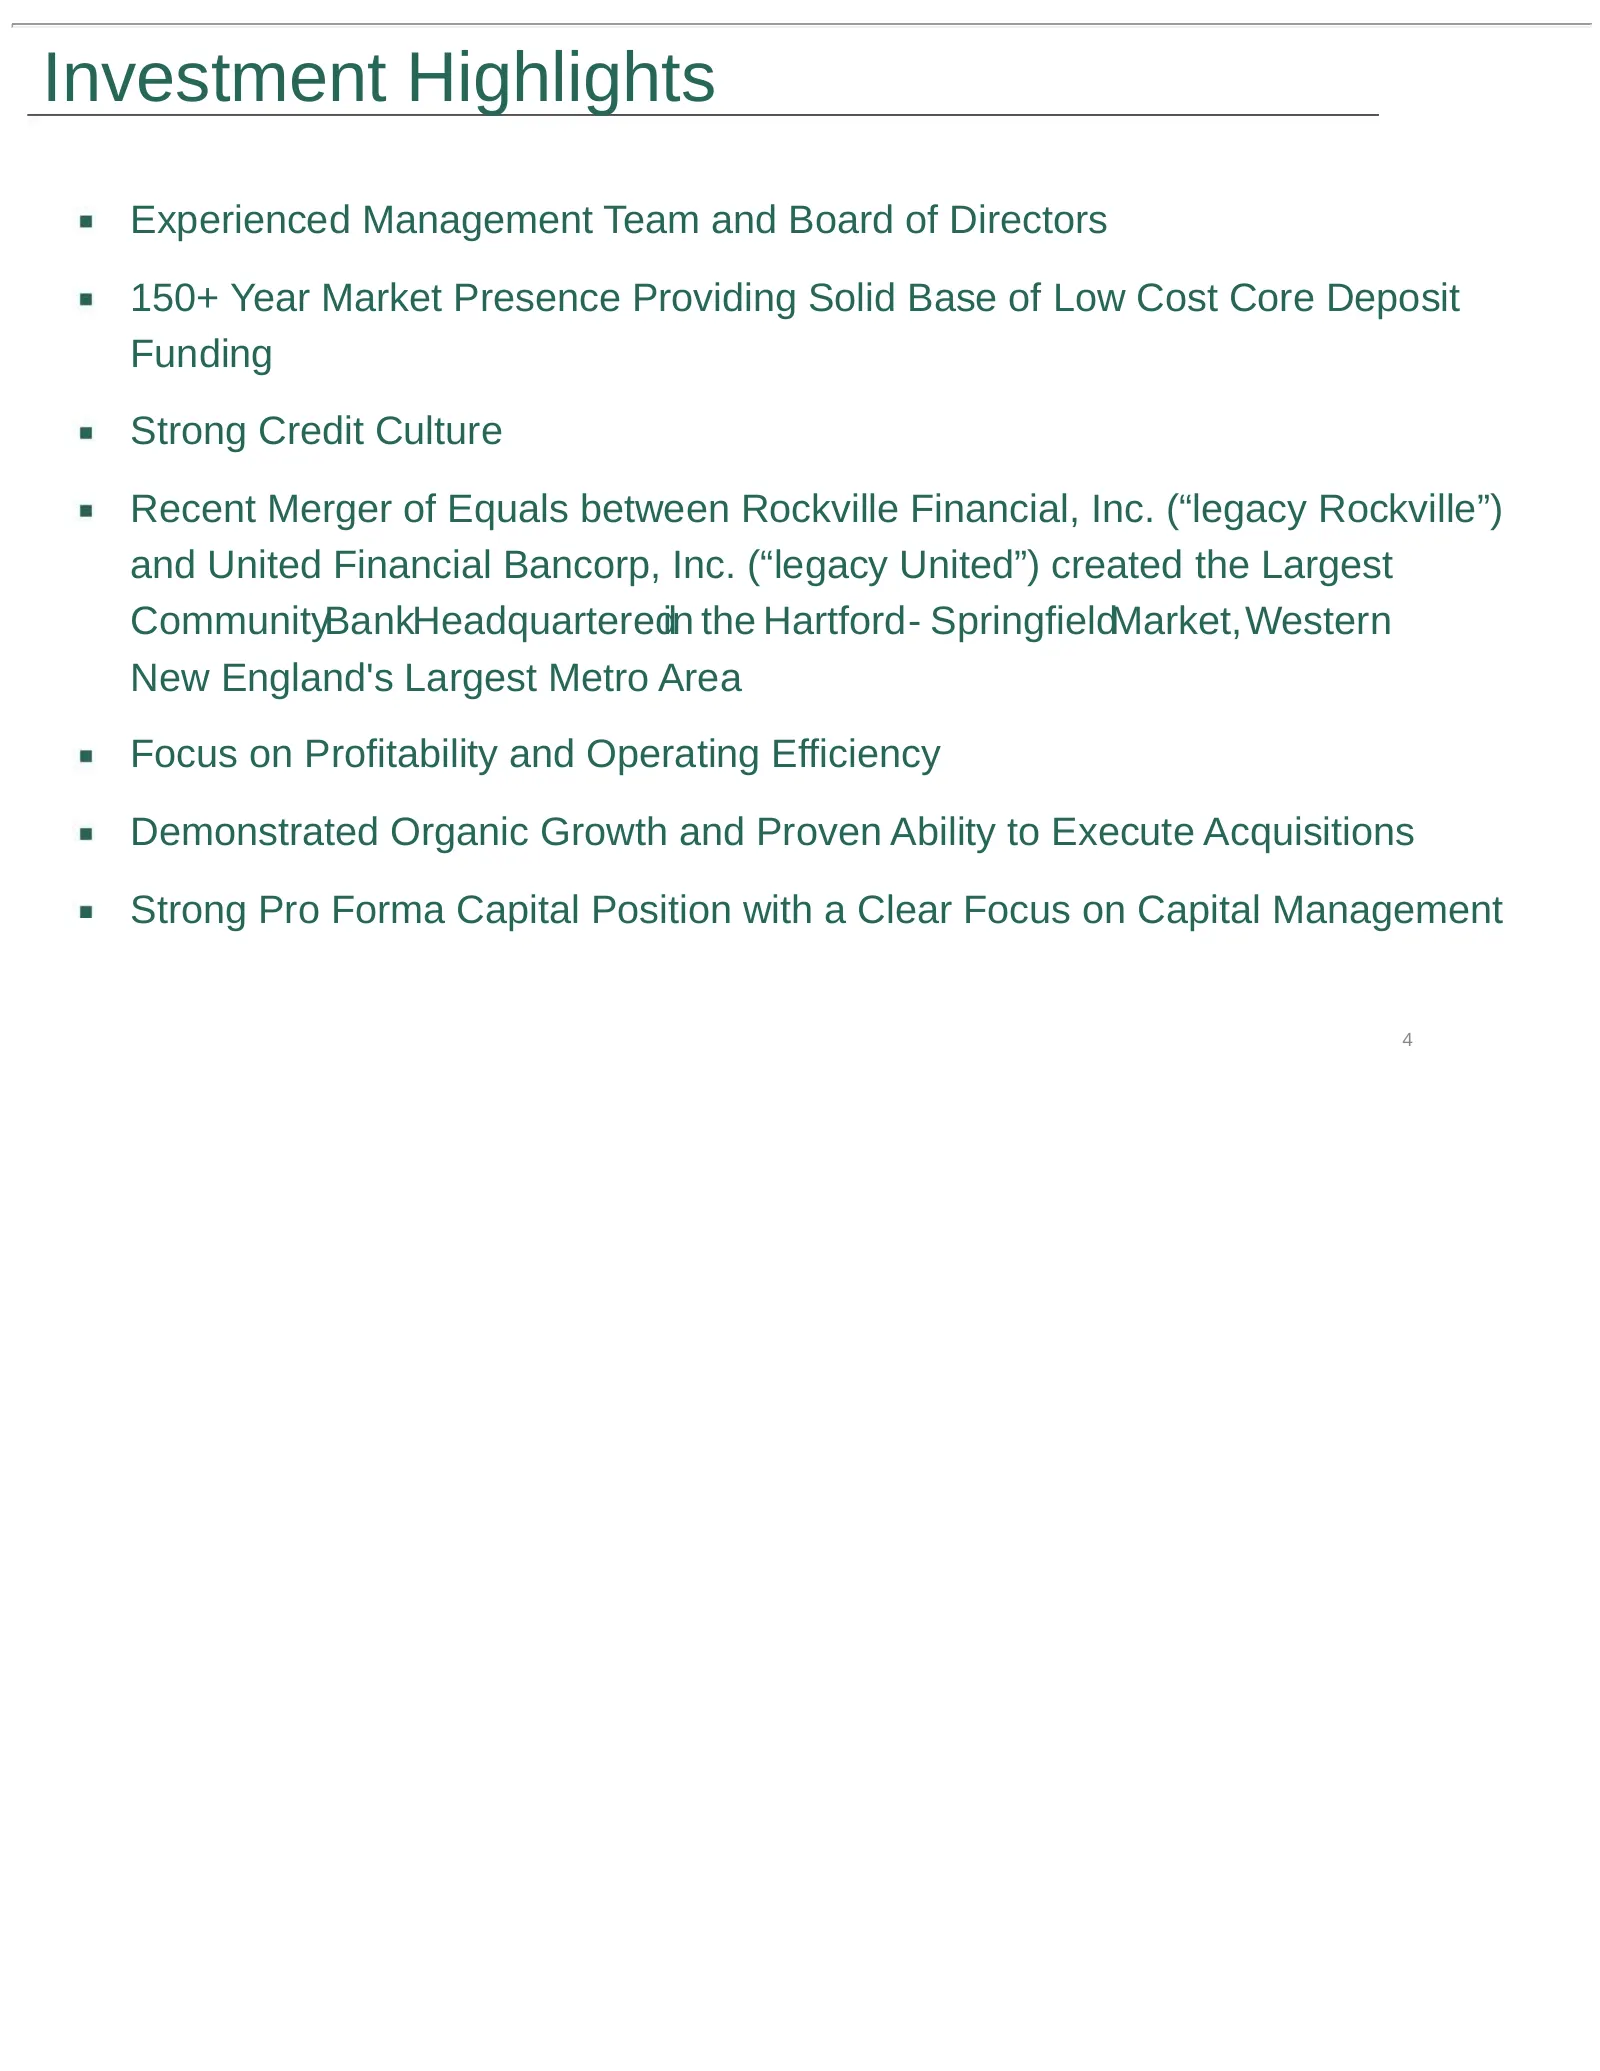
Slide 4: Investment Highlights
Investment Highlights Experienced Management Team and Board of Directors 150+ Year Market Presence Providing Solid Base of Low Cost Core Deposit Funding Strong Credit Culture Recent Merger of Equals between Rockville Financial, Inc. (“legacy Rockville”) and United Financial Bancorp, Inc. (“legacy Un
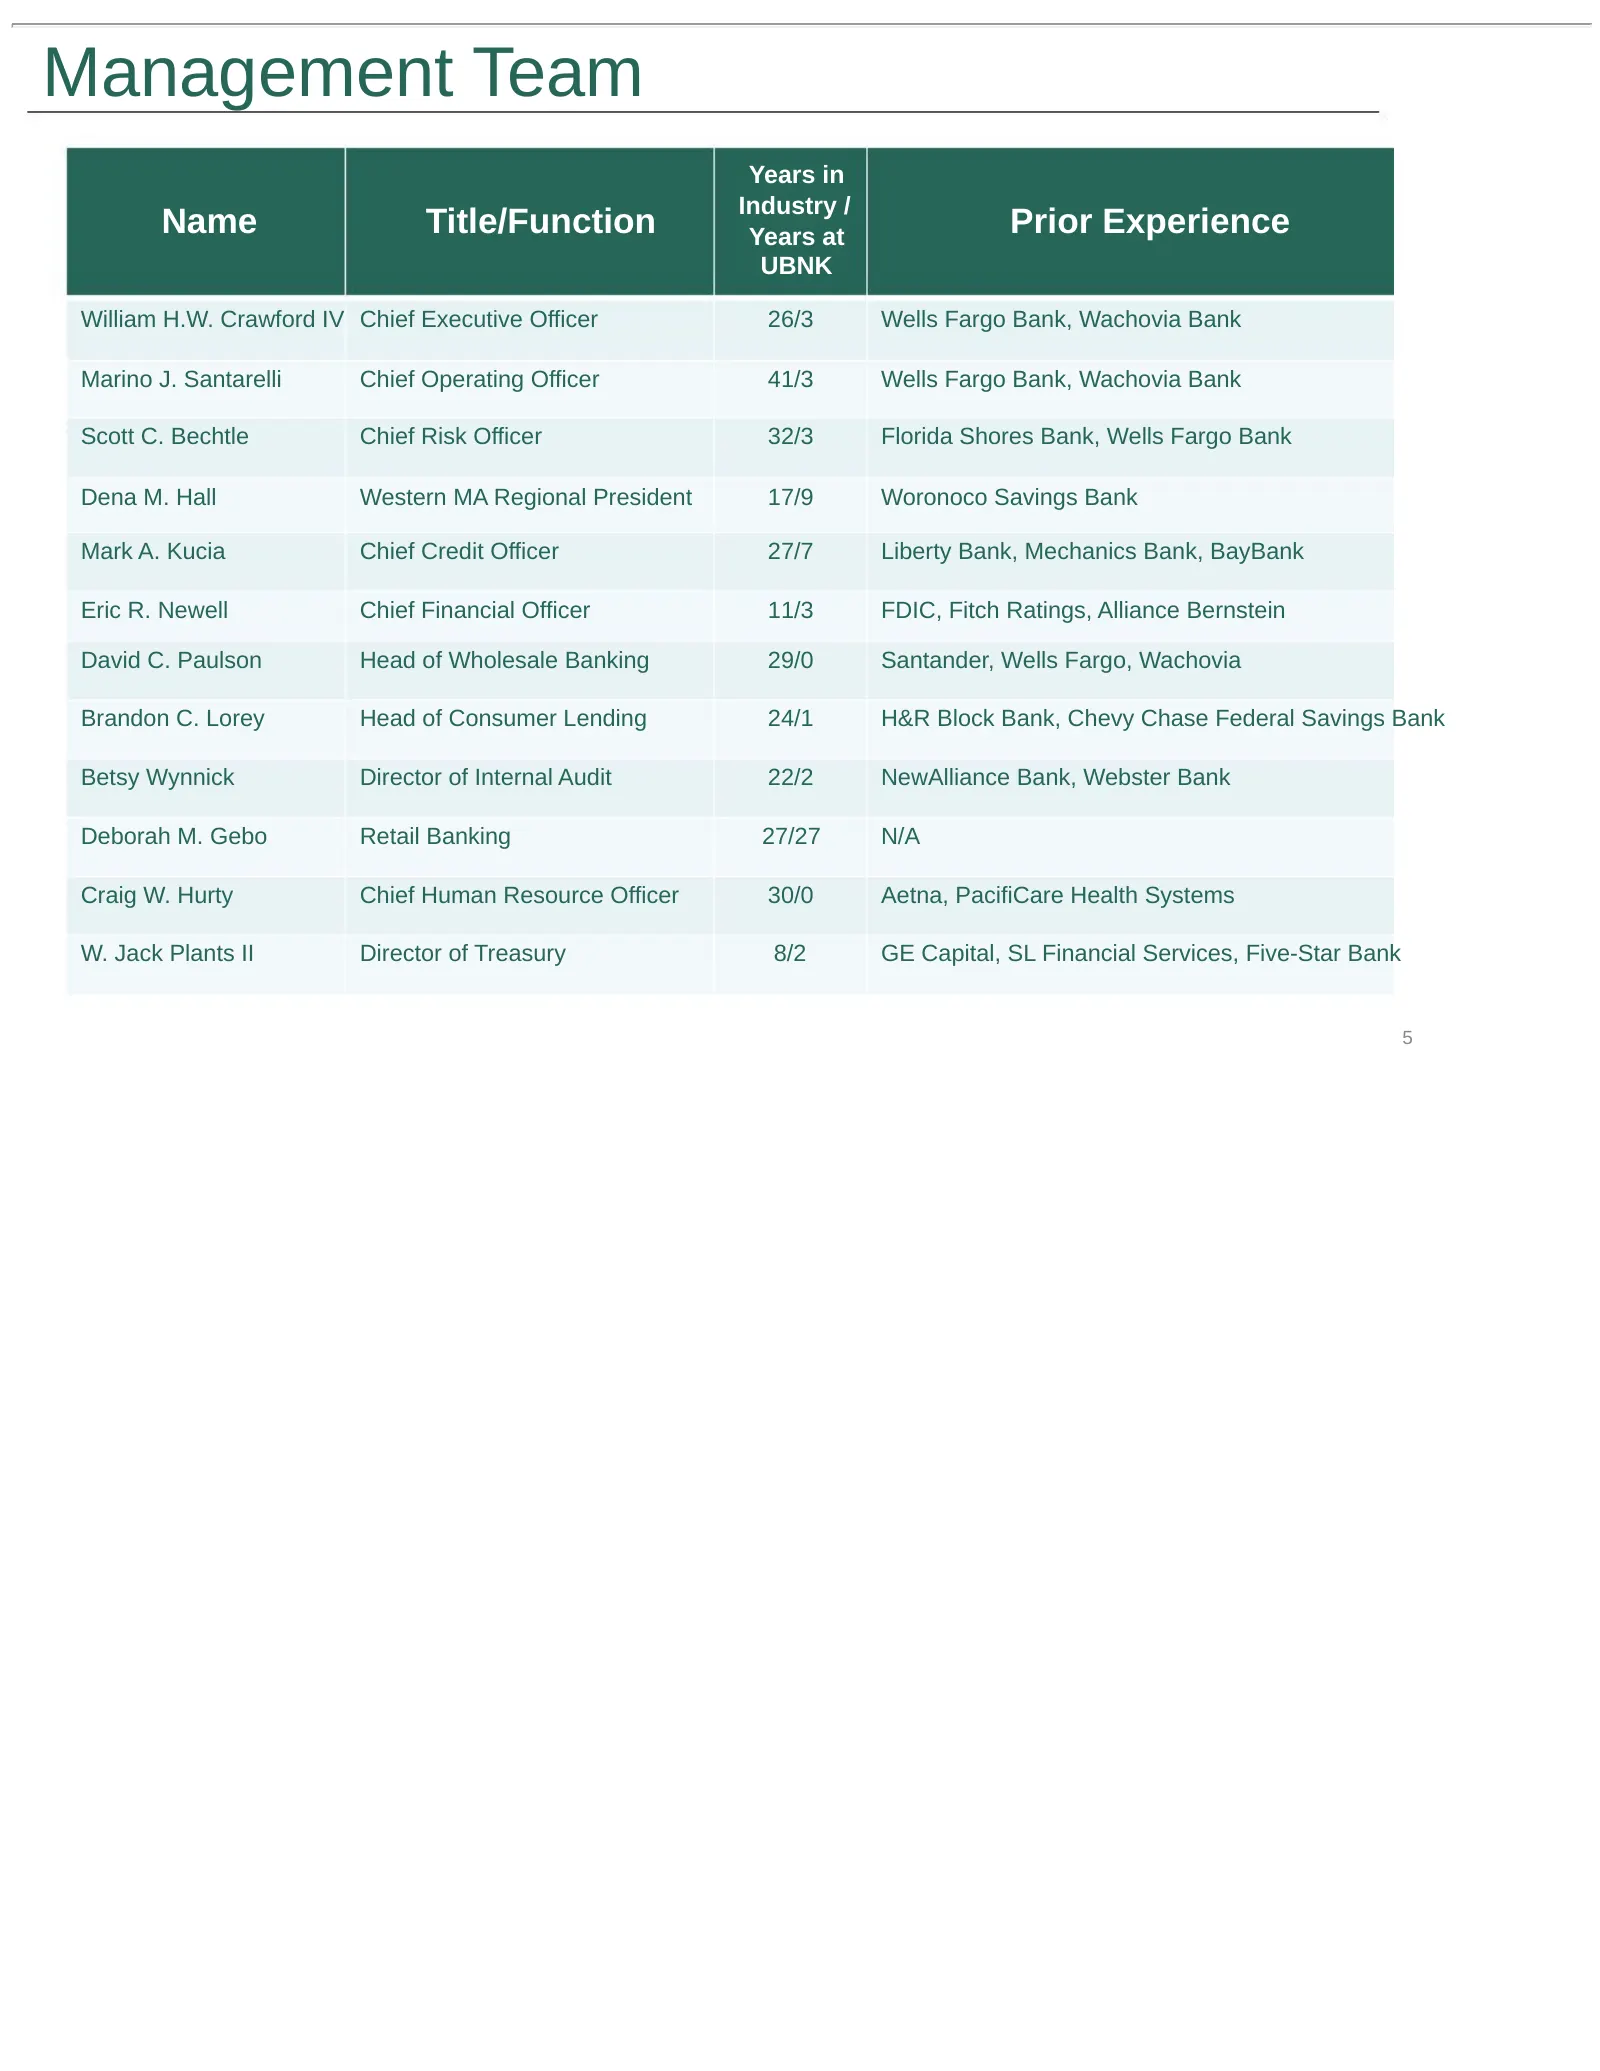
Slide 5: Management Team
Management Team Years in Industry / Name Title/Function Years at Prior Experience UBNK William H.W. Crawford IV Chief Executive Officer 26/3 Wells Fargo Bank, Wachovia Bank Marino J. Santarelli Chief Operating Officer 41/3 Wells Fargo Bank, Wachovia Bank Scott C. Bechtle Chief Risk Officer 32/3 Flor
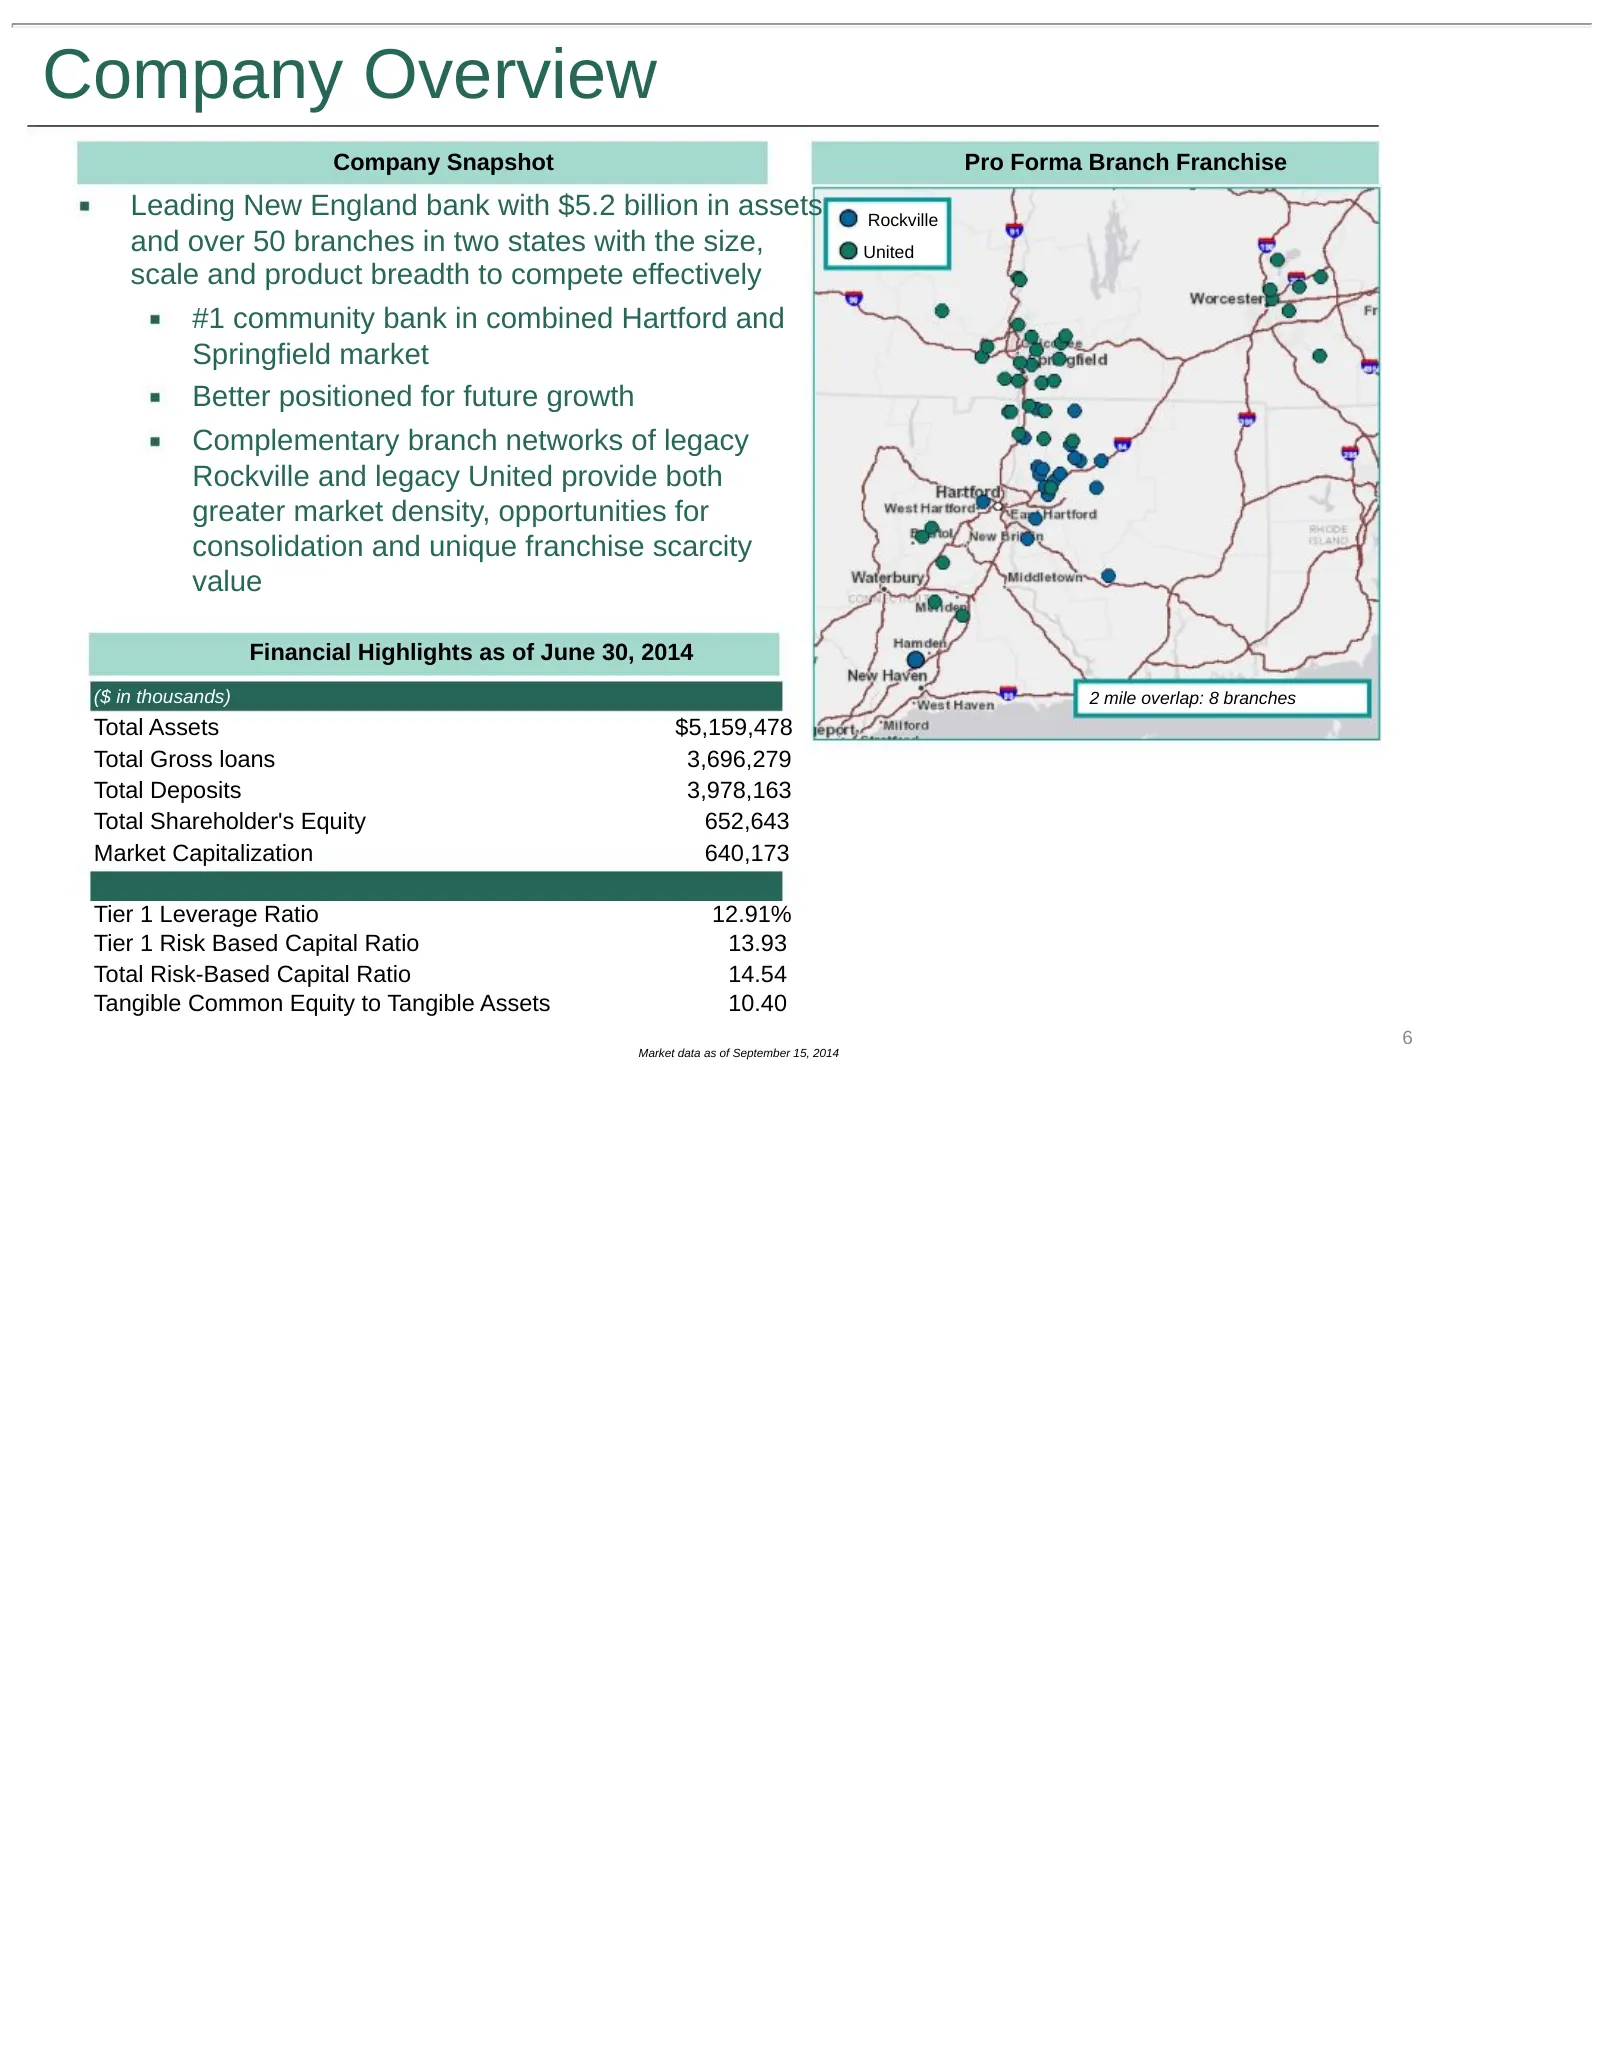
Slide 6: Company Overview
Company Overview Company Snapshot Pro Forma Branch Franchise Leading New England bank with $5.2 billion in assets Rockville and over 50 branches in two states with the size, United scale and product breadth to compete effectively #1 community bank in combined Hartford and Springfield market Better p
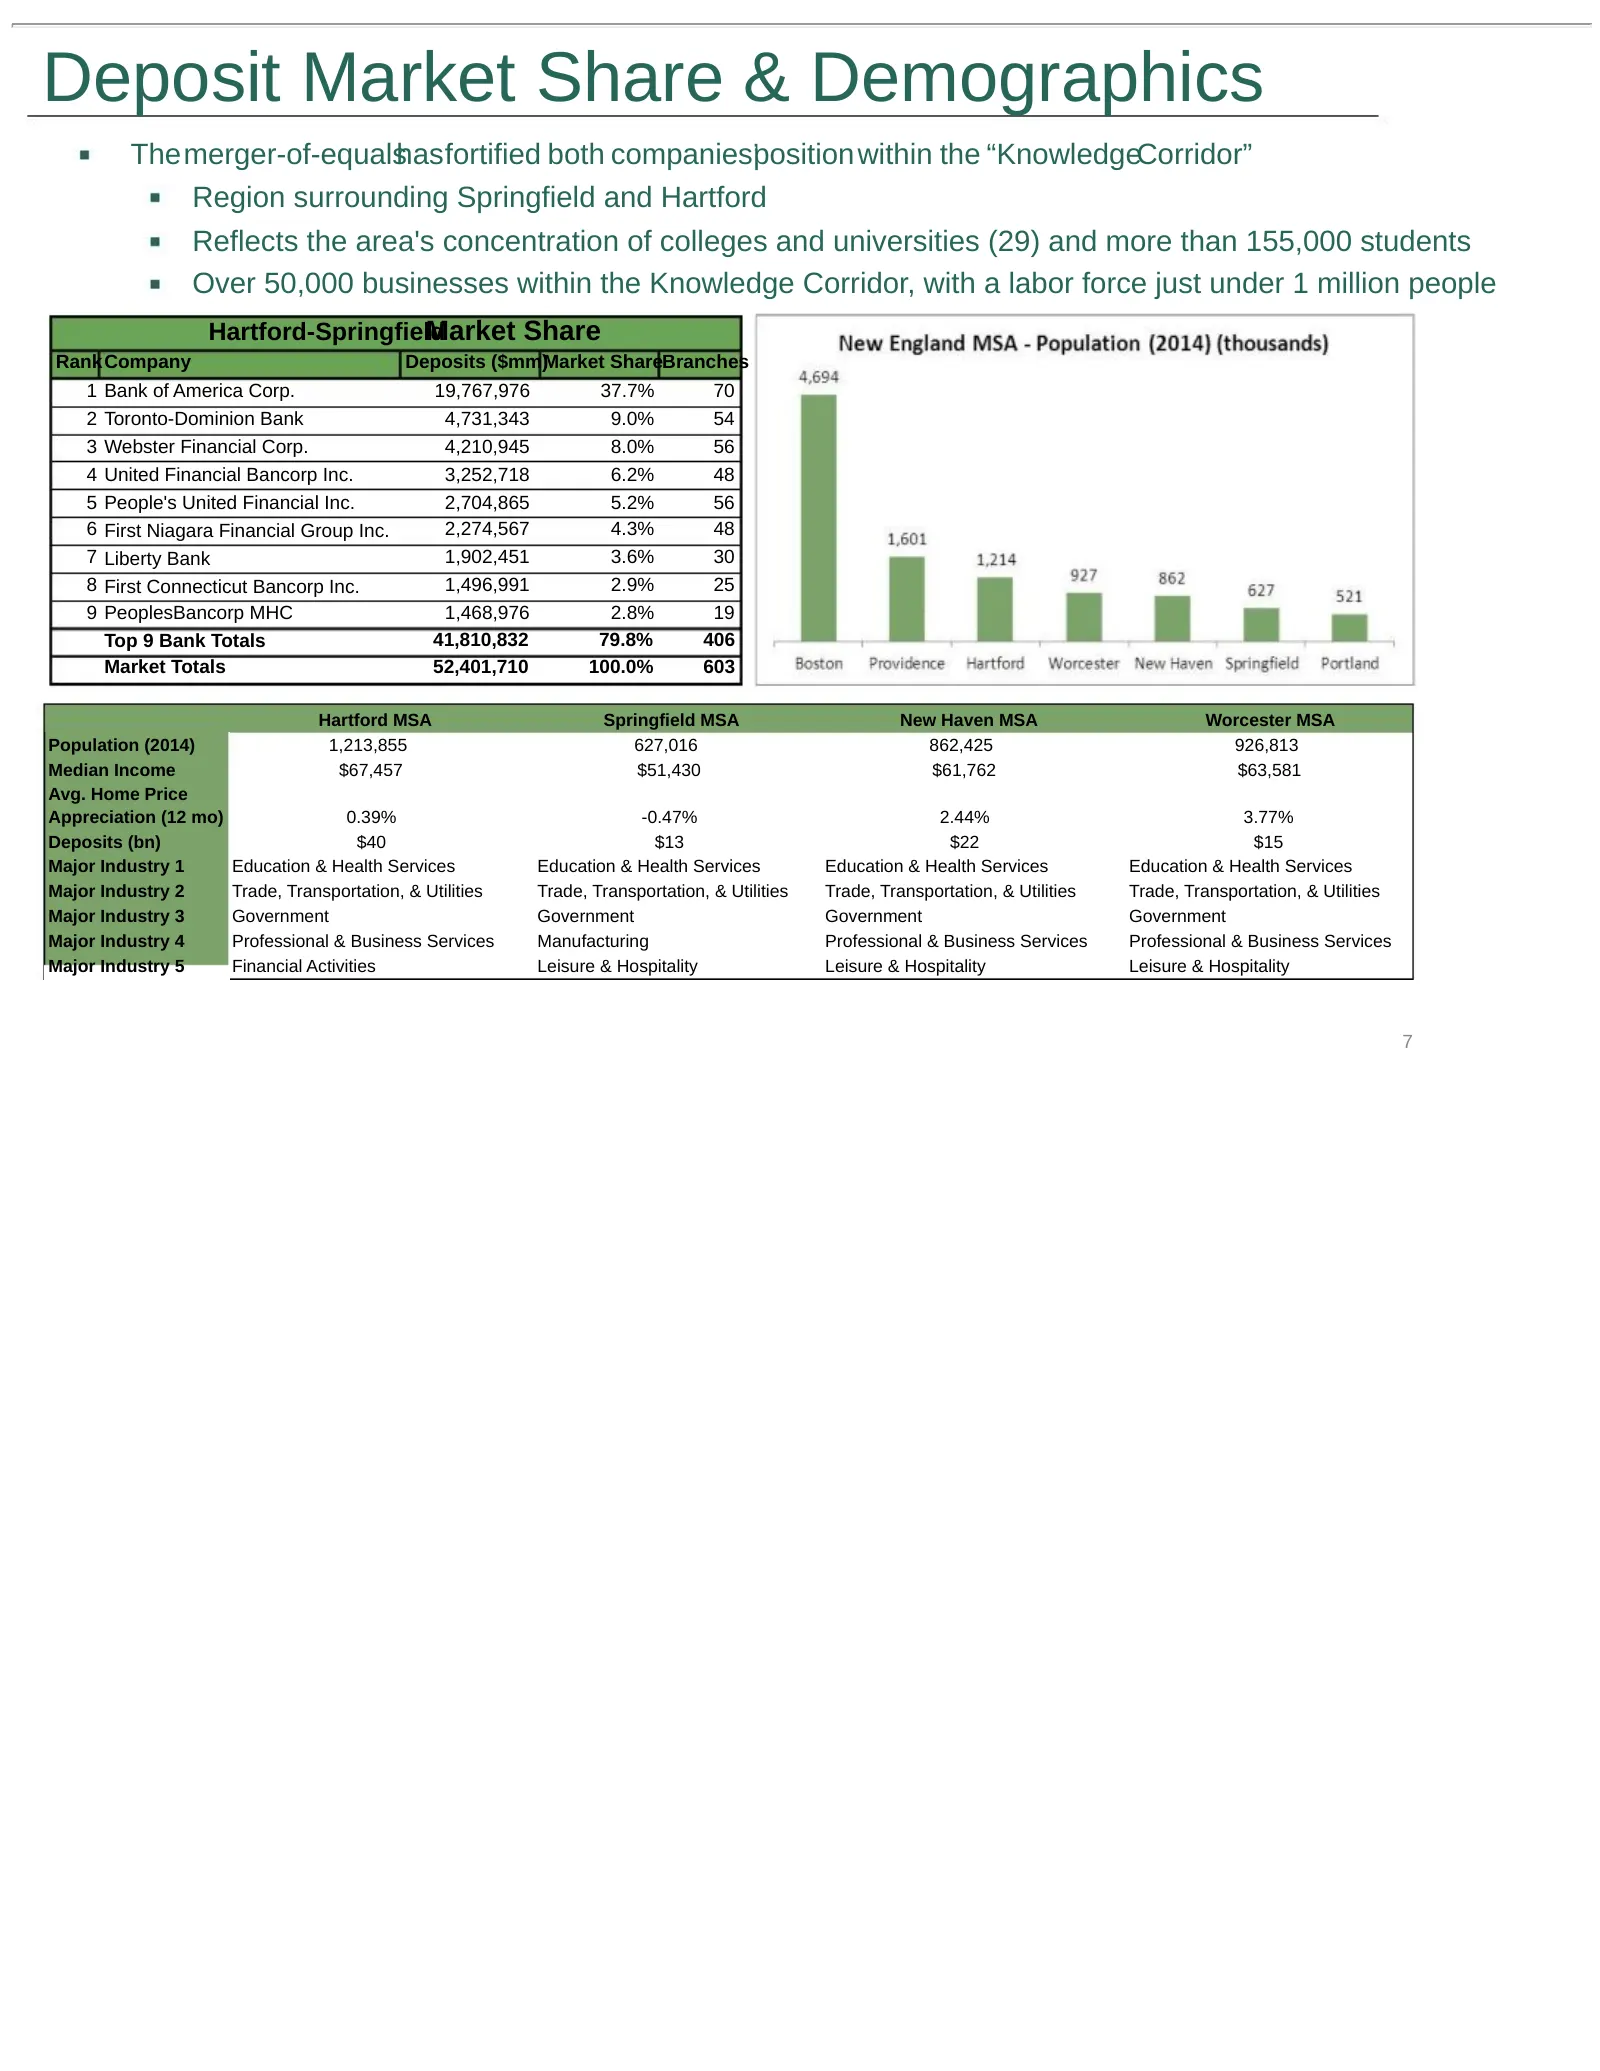
Slide 7: Deposit Market Share & Demographics
Deposit Market Share & Demographics Themerger-of-equalshasfortified both companies’position within the “KnowledgeCorridor” Region surrounding Springfield and Hartford Reflects the area's concentration of colleges and universities (29) and more than 155,000 students Over 50,000 businesses within the
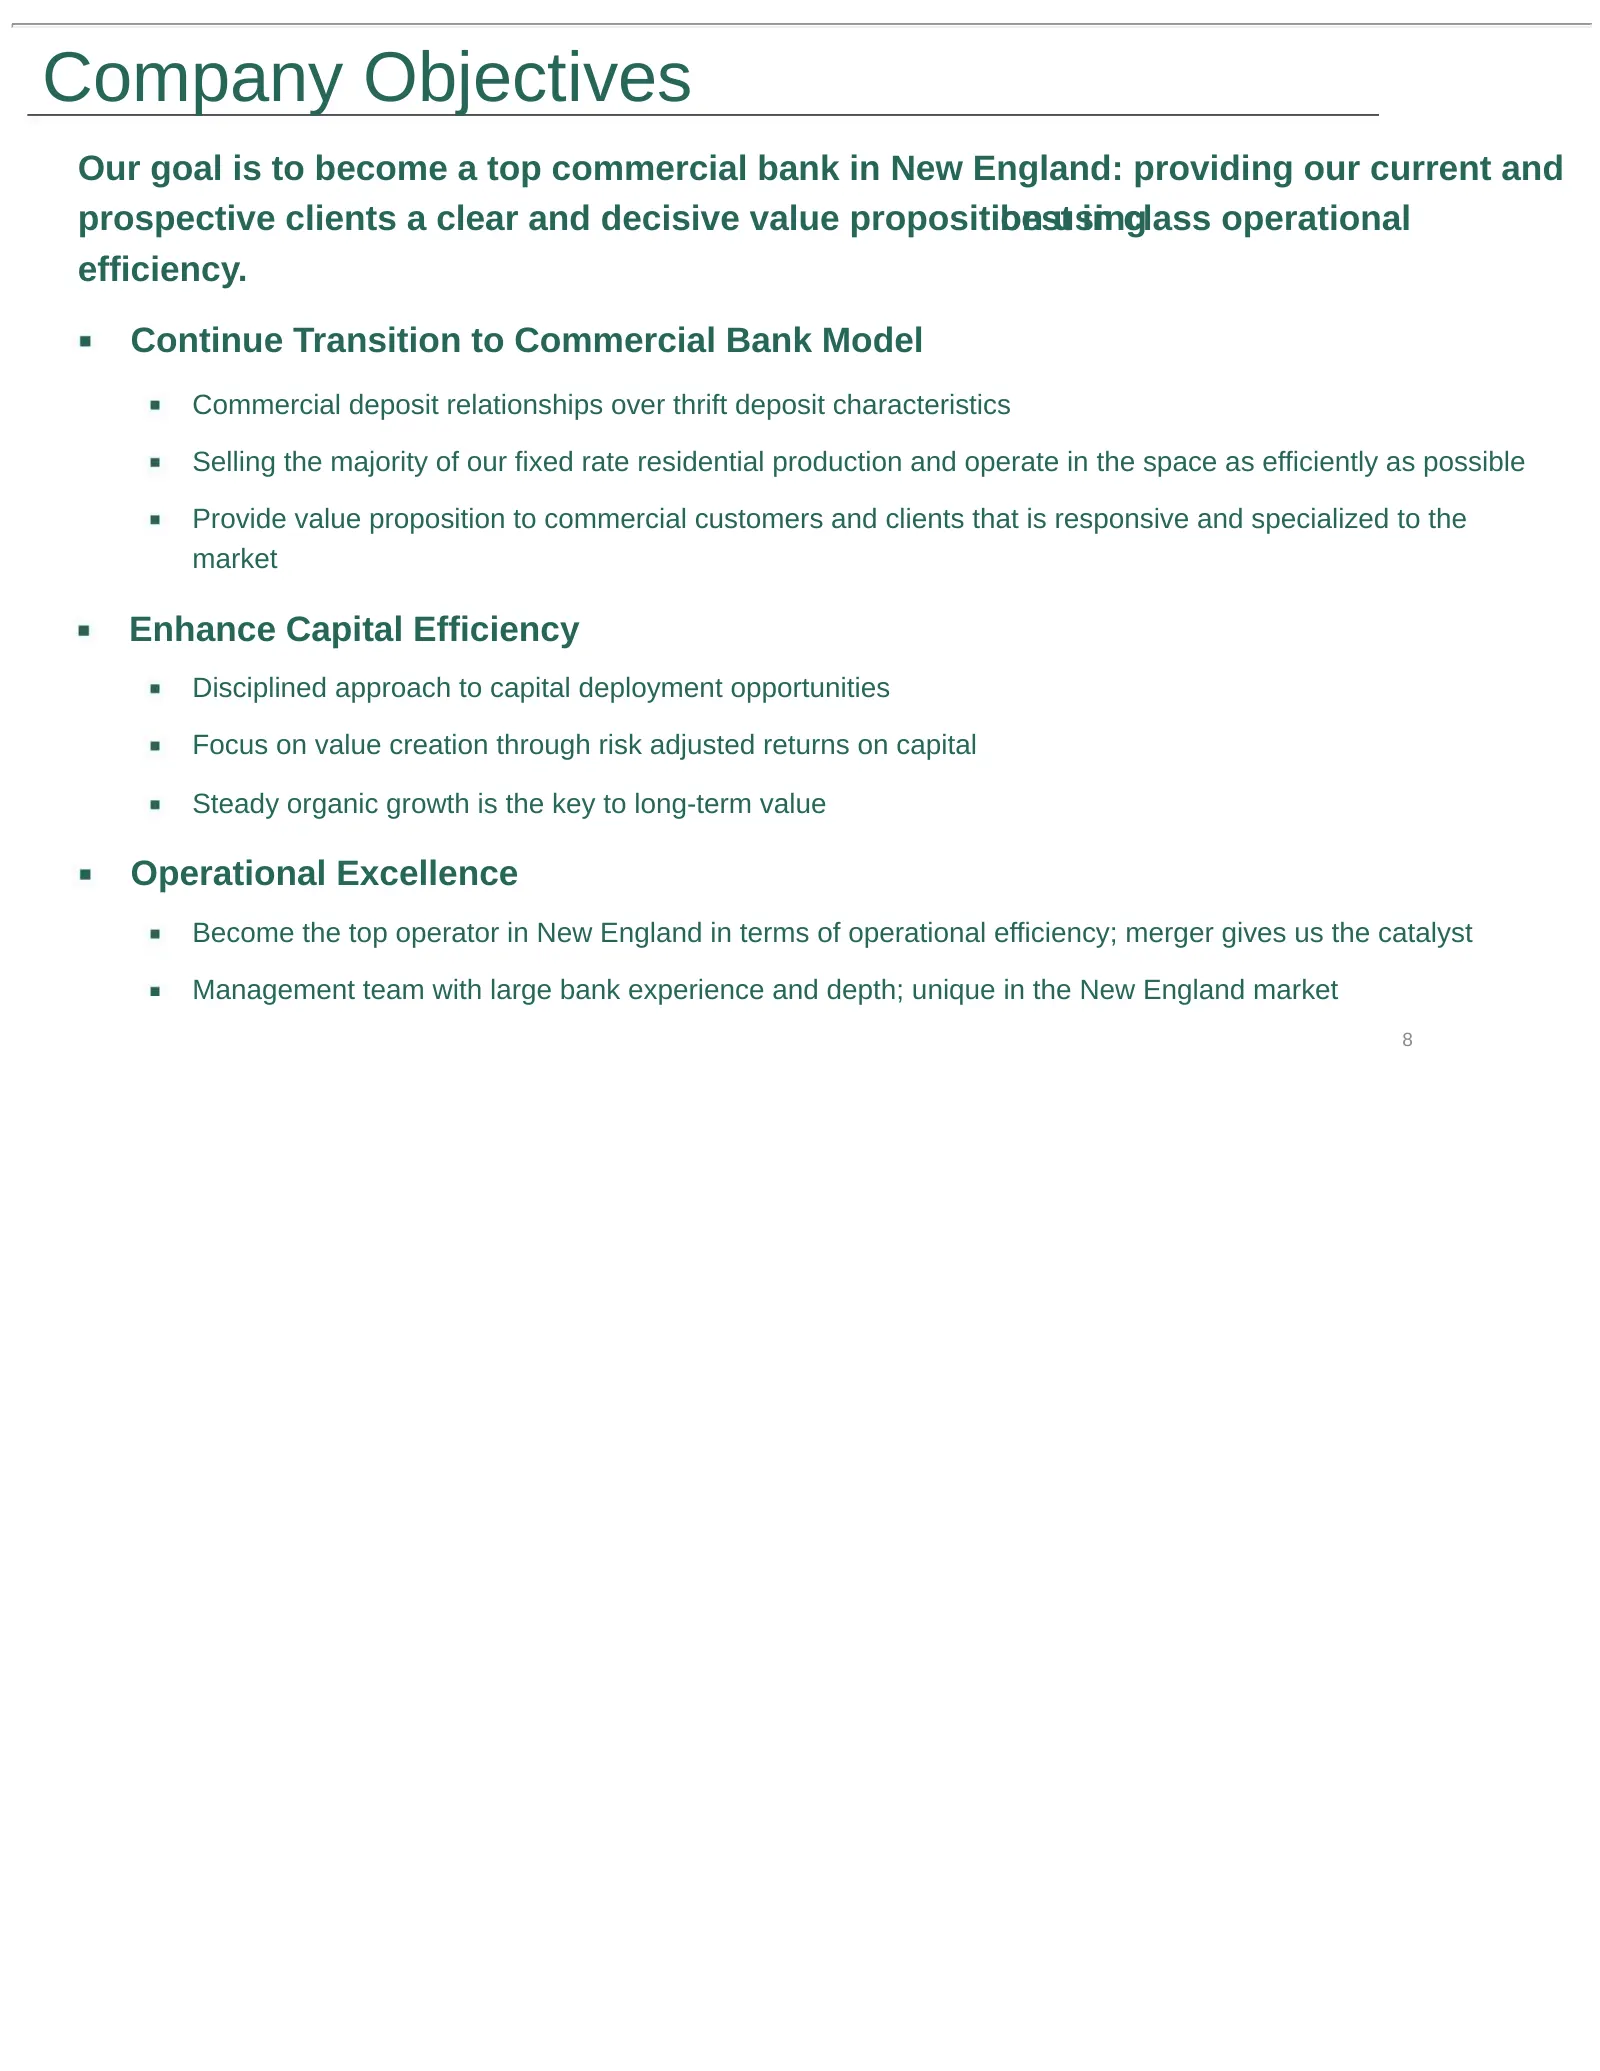
Slide 8: Company Objectives
Company Objectives Our goal is to become a top commercial bank in New England: providing our current and prospective clients a clear and decisive value proposition best using in class operational efficiency. Continue Transition to Commercial Bank Model Commercial deposit relationships over thrift de
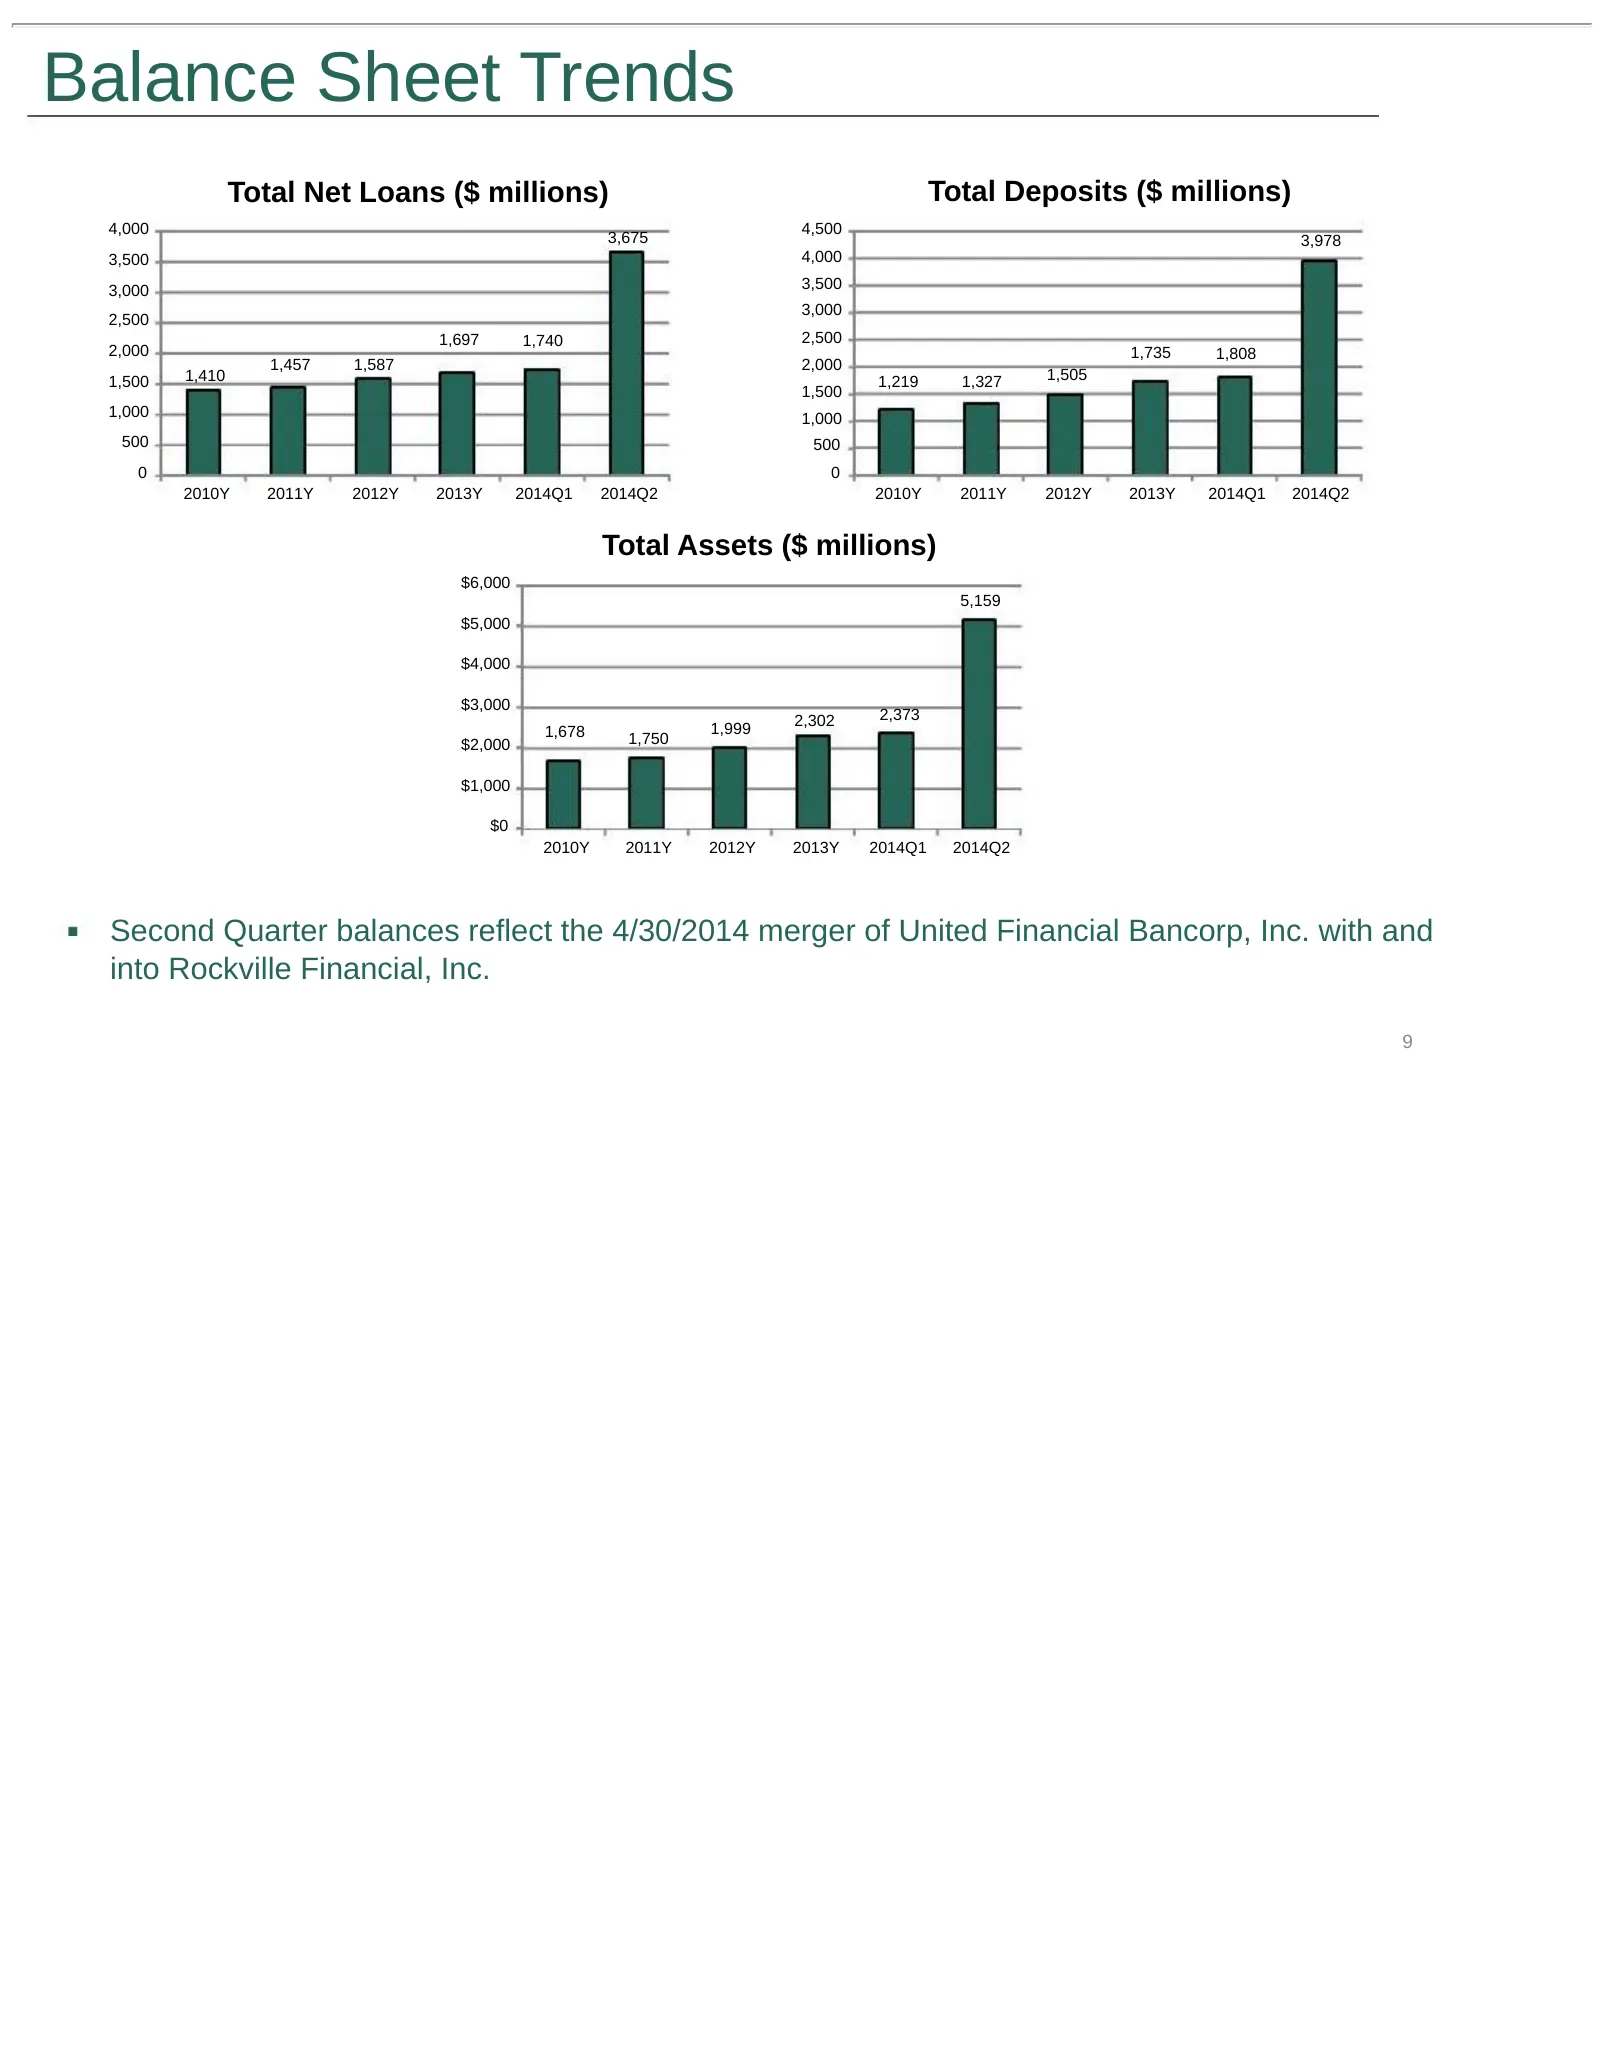
Slide 9: Balance Sheet Trends
Balance Sheet Trends Total Net Loans ($ millions) Total Deposits ($ millions) 4,000 4,500 3,675 3,978 3,500 4,000 3,000 3,500 3,000 2,500 1,697 1,740 2,500 2,000 1,735 1,808 1,457 1,587 2,000 1,500 1,410 1,219 1,327 1,505 1,500 1,000 1,000 500 500 0 0 2010Y 2011Y 2012Y 2013Y 2014Q1 2014Q2 2010Y 2011
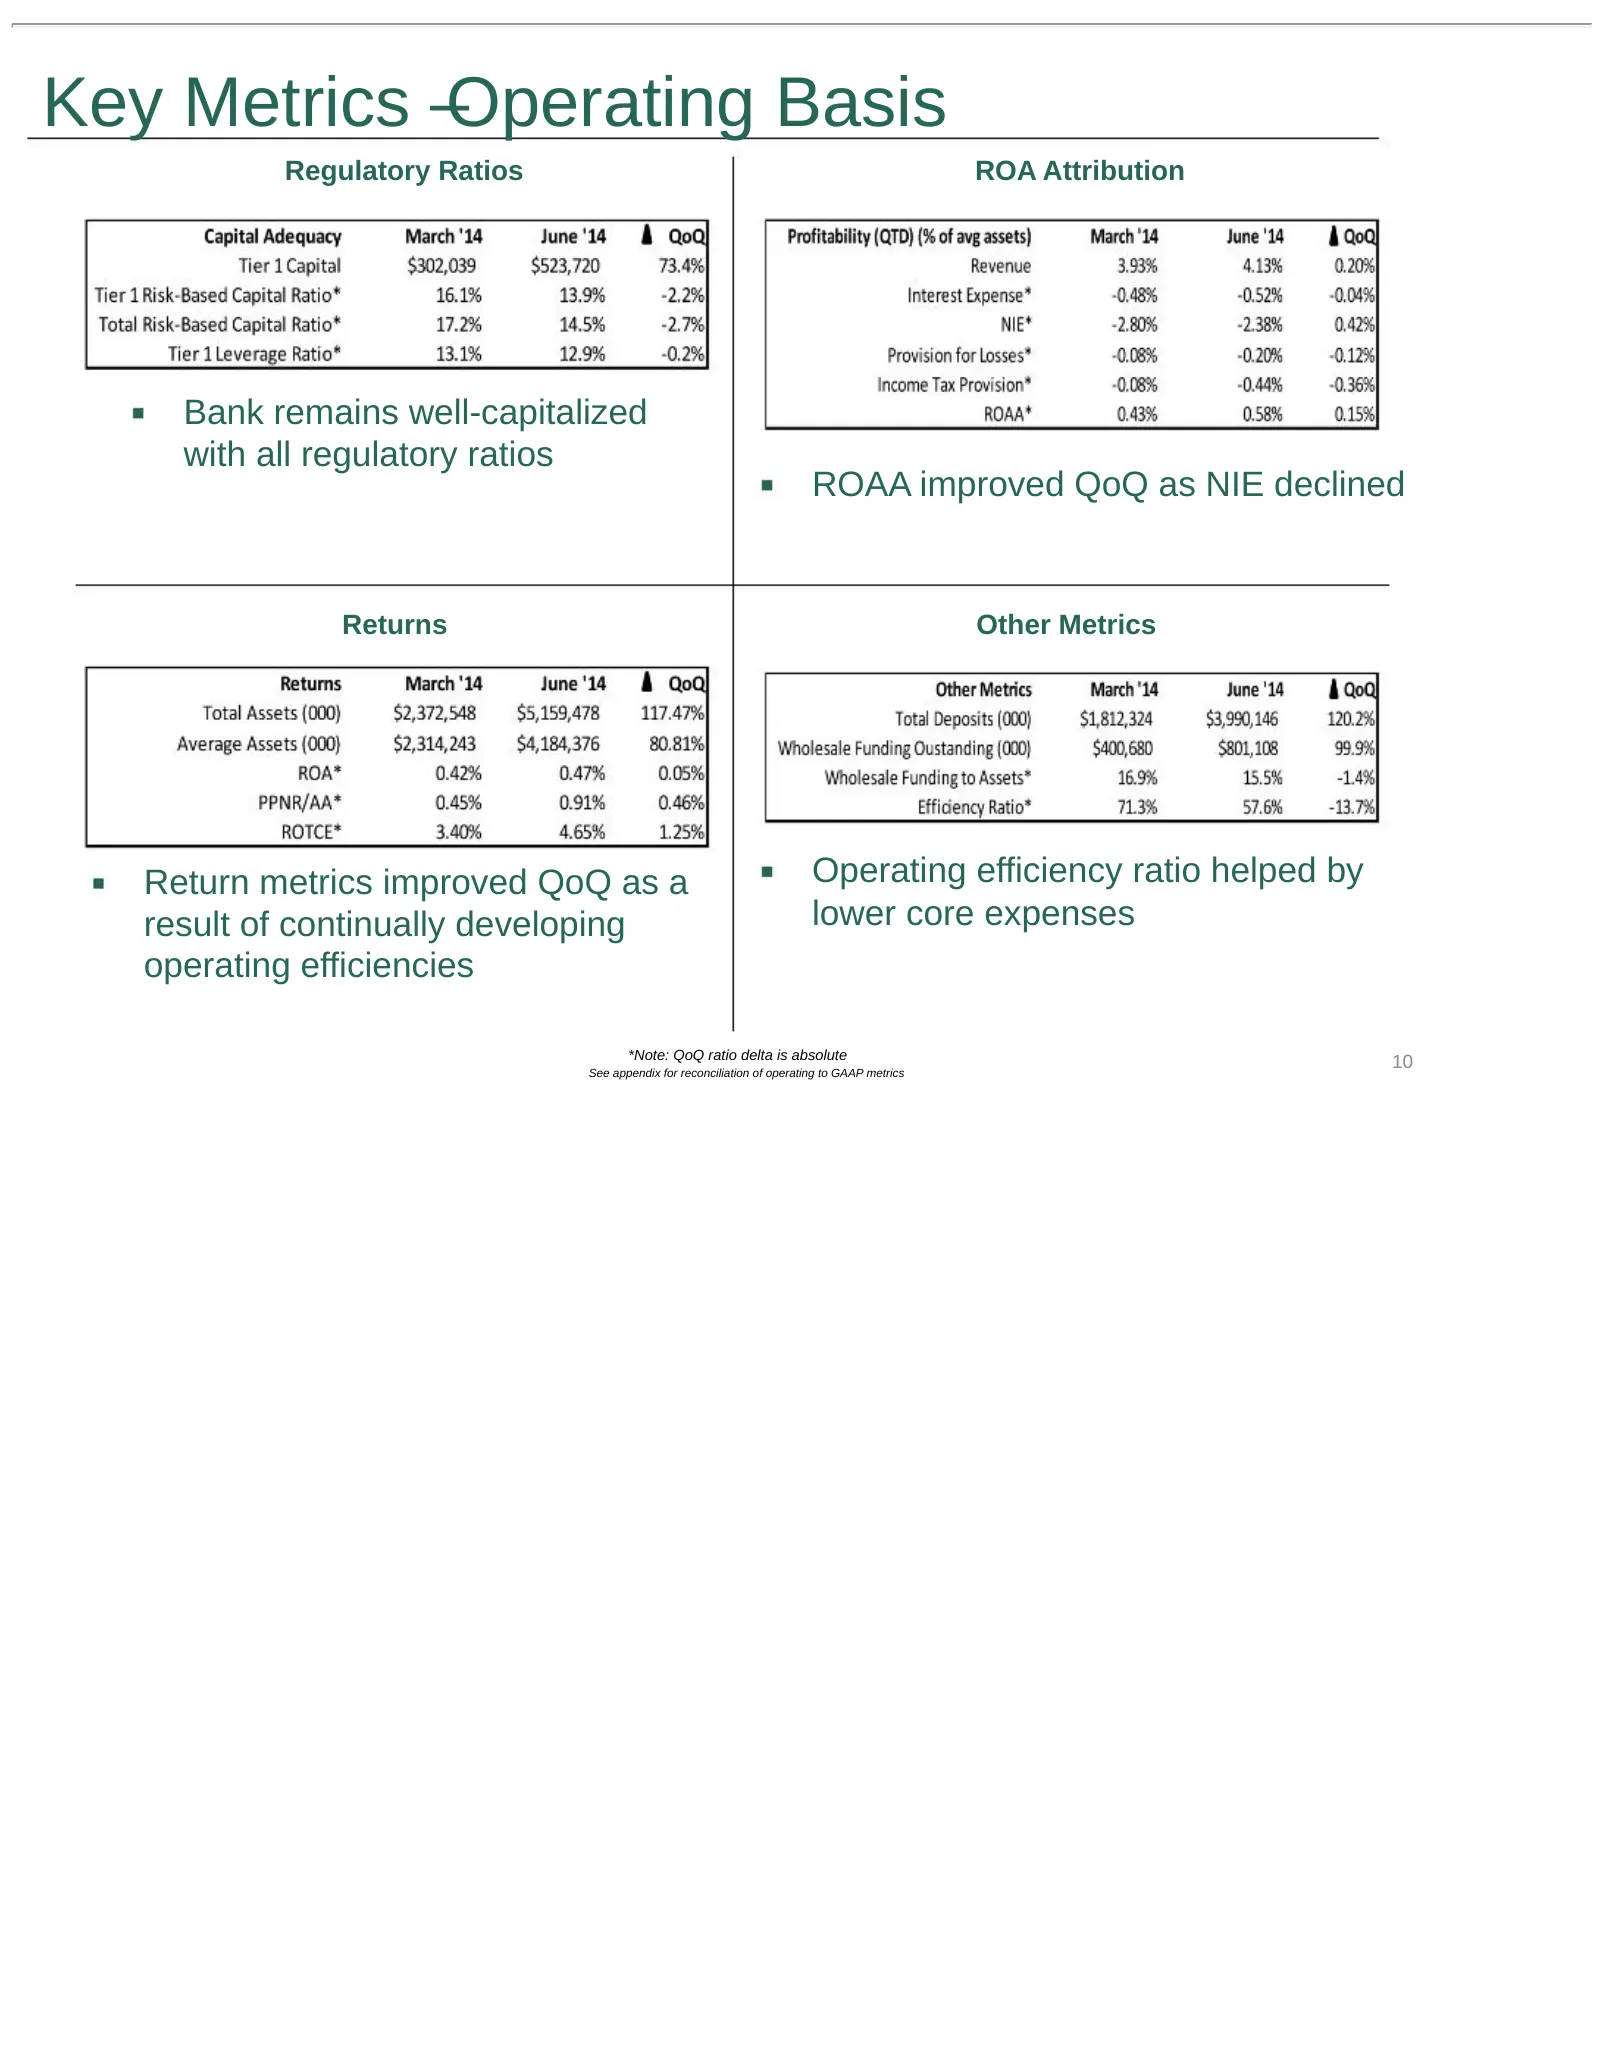
Slide 10: Key Metrics –Operating Basis
Key Metrics –Operating Basis Regulatory Ratios ROA Attribution Bank remains well-capitalized with all regulatory ratios ROAA improved QoQ as NIE declined Returns Other Metrics Return metrics improved QoQ as a Operating efficiency ratio helped by result of continually developing lower core expenses o
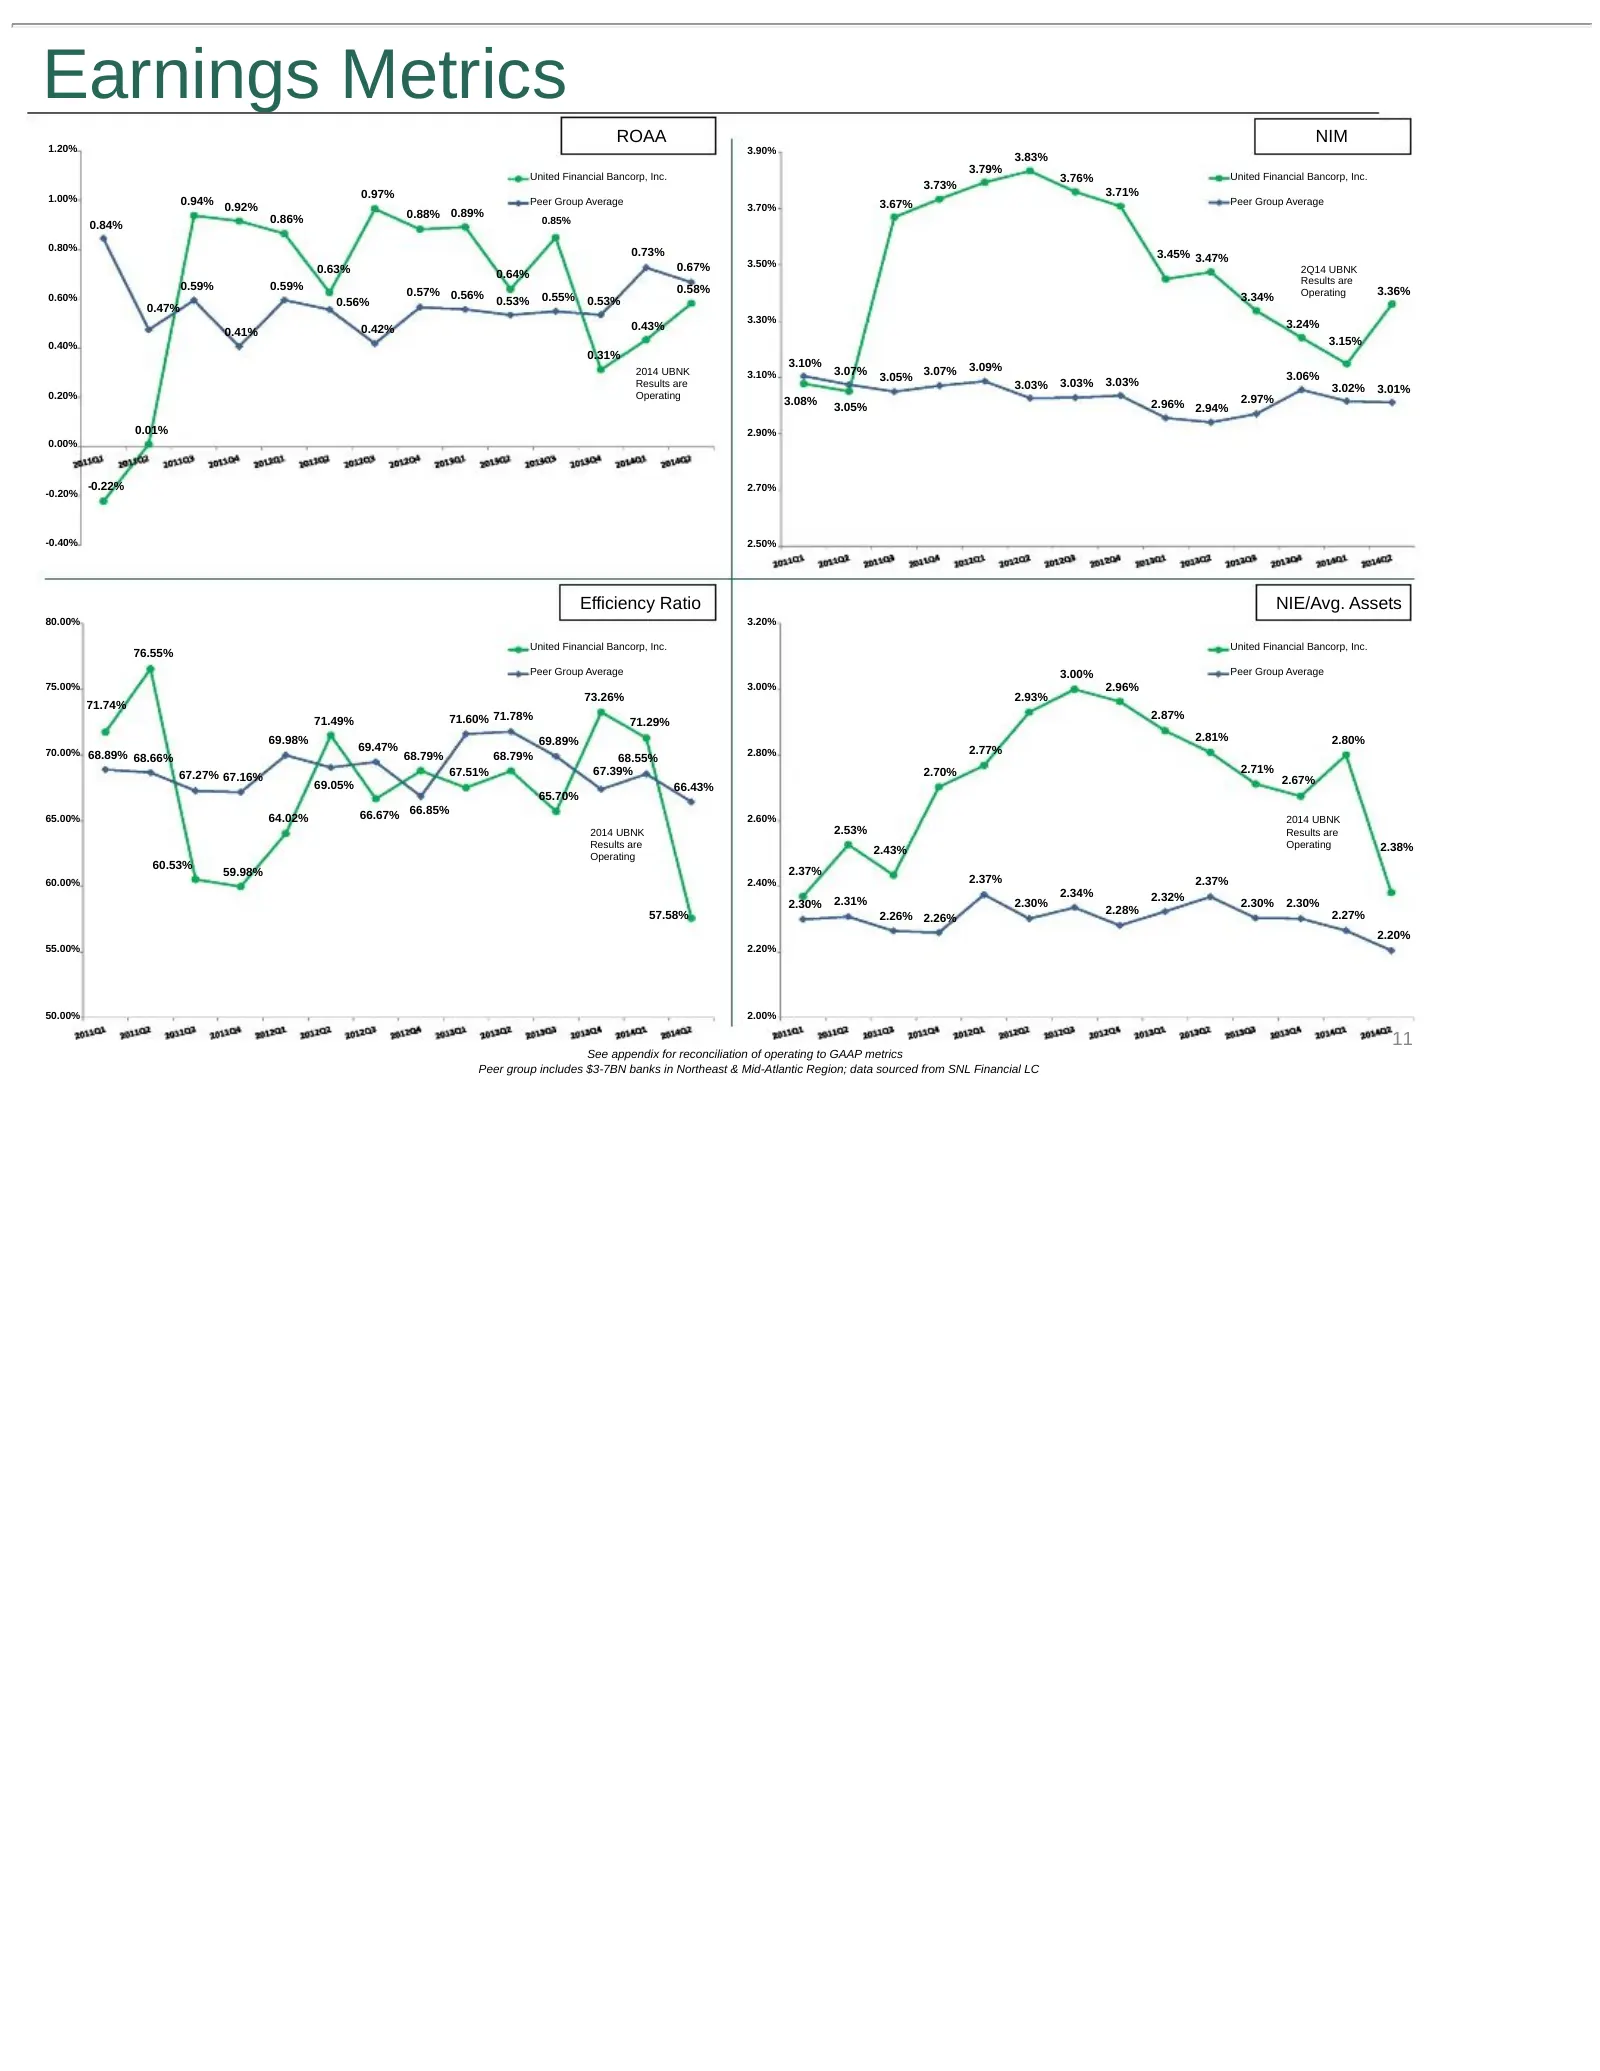
Slide 11: Earnings Metrics
Earnings Metrics ROAA NIM 1.20% 3.90% 3.83% 3.79% United Financial Bancorp, Inc. 3.76% United Financial Bancorp, Inc. 3.73% 0.97% 3.71% 1.00% 0.94% 0.92% Peer Group Average Peer Group Average 3.70% 3.67% 0.86% 0.88% 0.89% 0.85% 0.84% 0.80% 0.73% 3.45% 3.47% 0.67% 3.50% 0.63% 0.64% 2Q14 UBNK Results
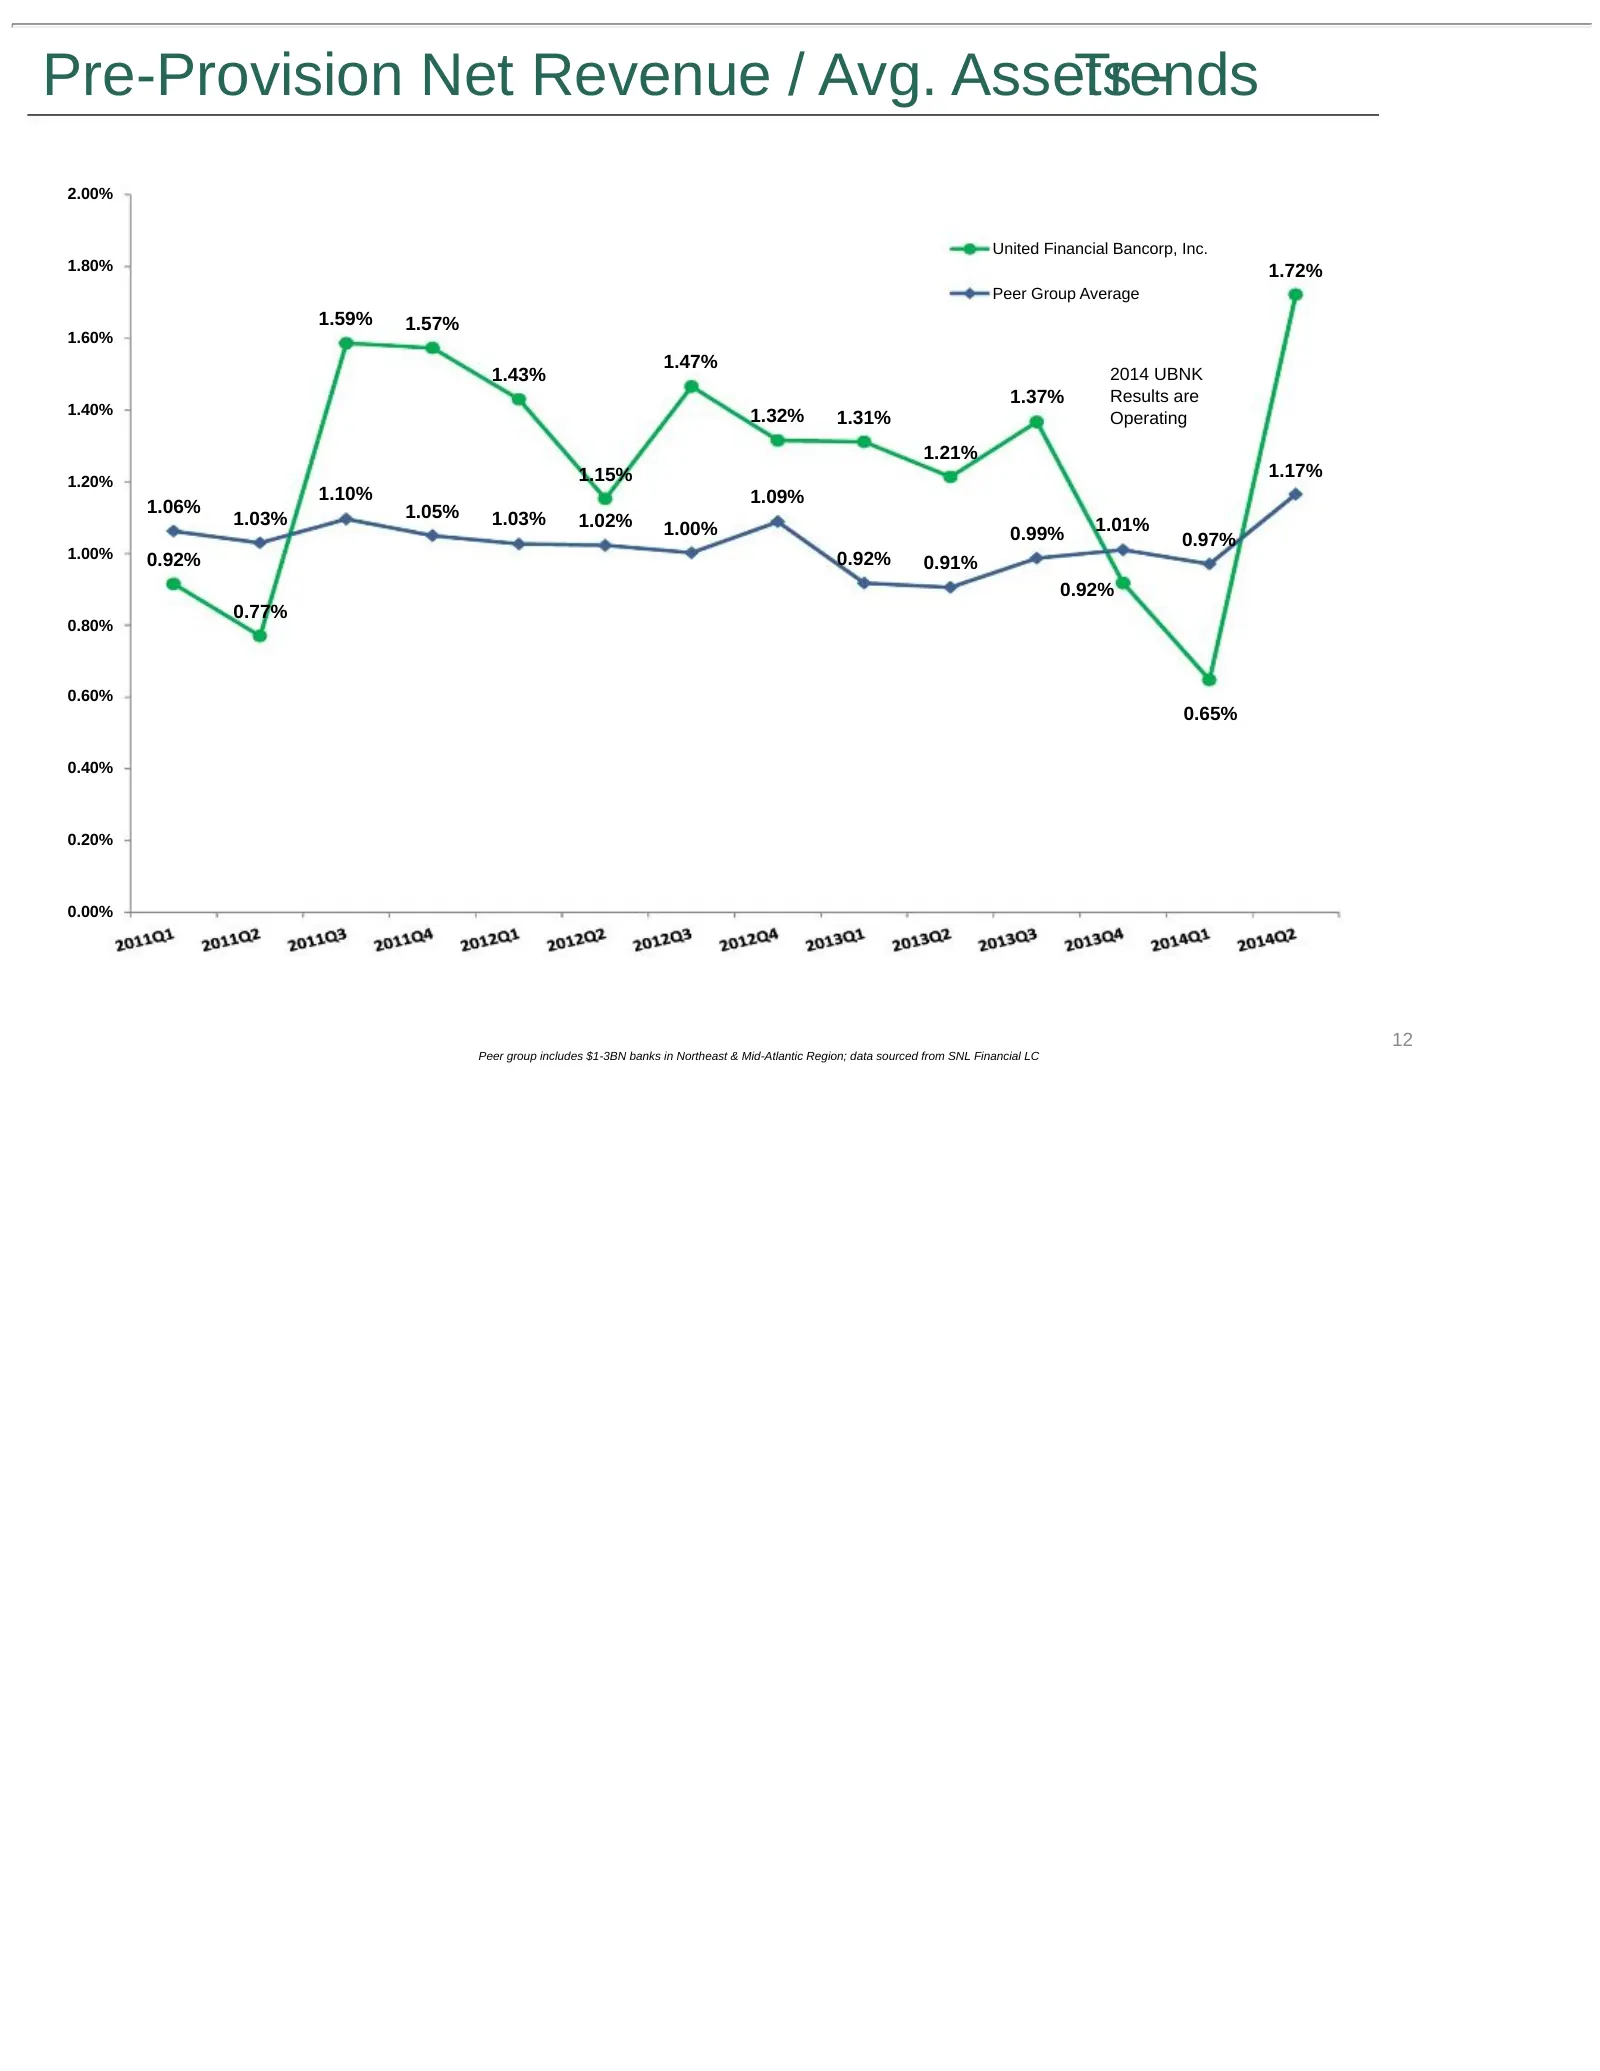
Slide 12: Pre-Provision Net Revenue / Avg. Assets Trends
Pre-Provision Net Revenue / Avg. Assets Trends - 2.00% United Financial Bancorp, Inc. 1.80% 1.72% Peer Group Average 1.59% 1.57% 1.60% 1.47% 1.43% 2014 UBNK 1.37% Results are 1.40% 1.32% 1.31% Operating 1.21% 1.15% 1.17% 1.20% 1.10% 1.09% 1.06% 1.05% 1.03% 1.03% 1.02% 1.01% 1.00% 0.99% 0.97% 1.00% 0
Slide 13: Merger Financial Recap
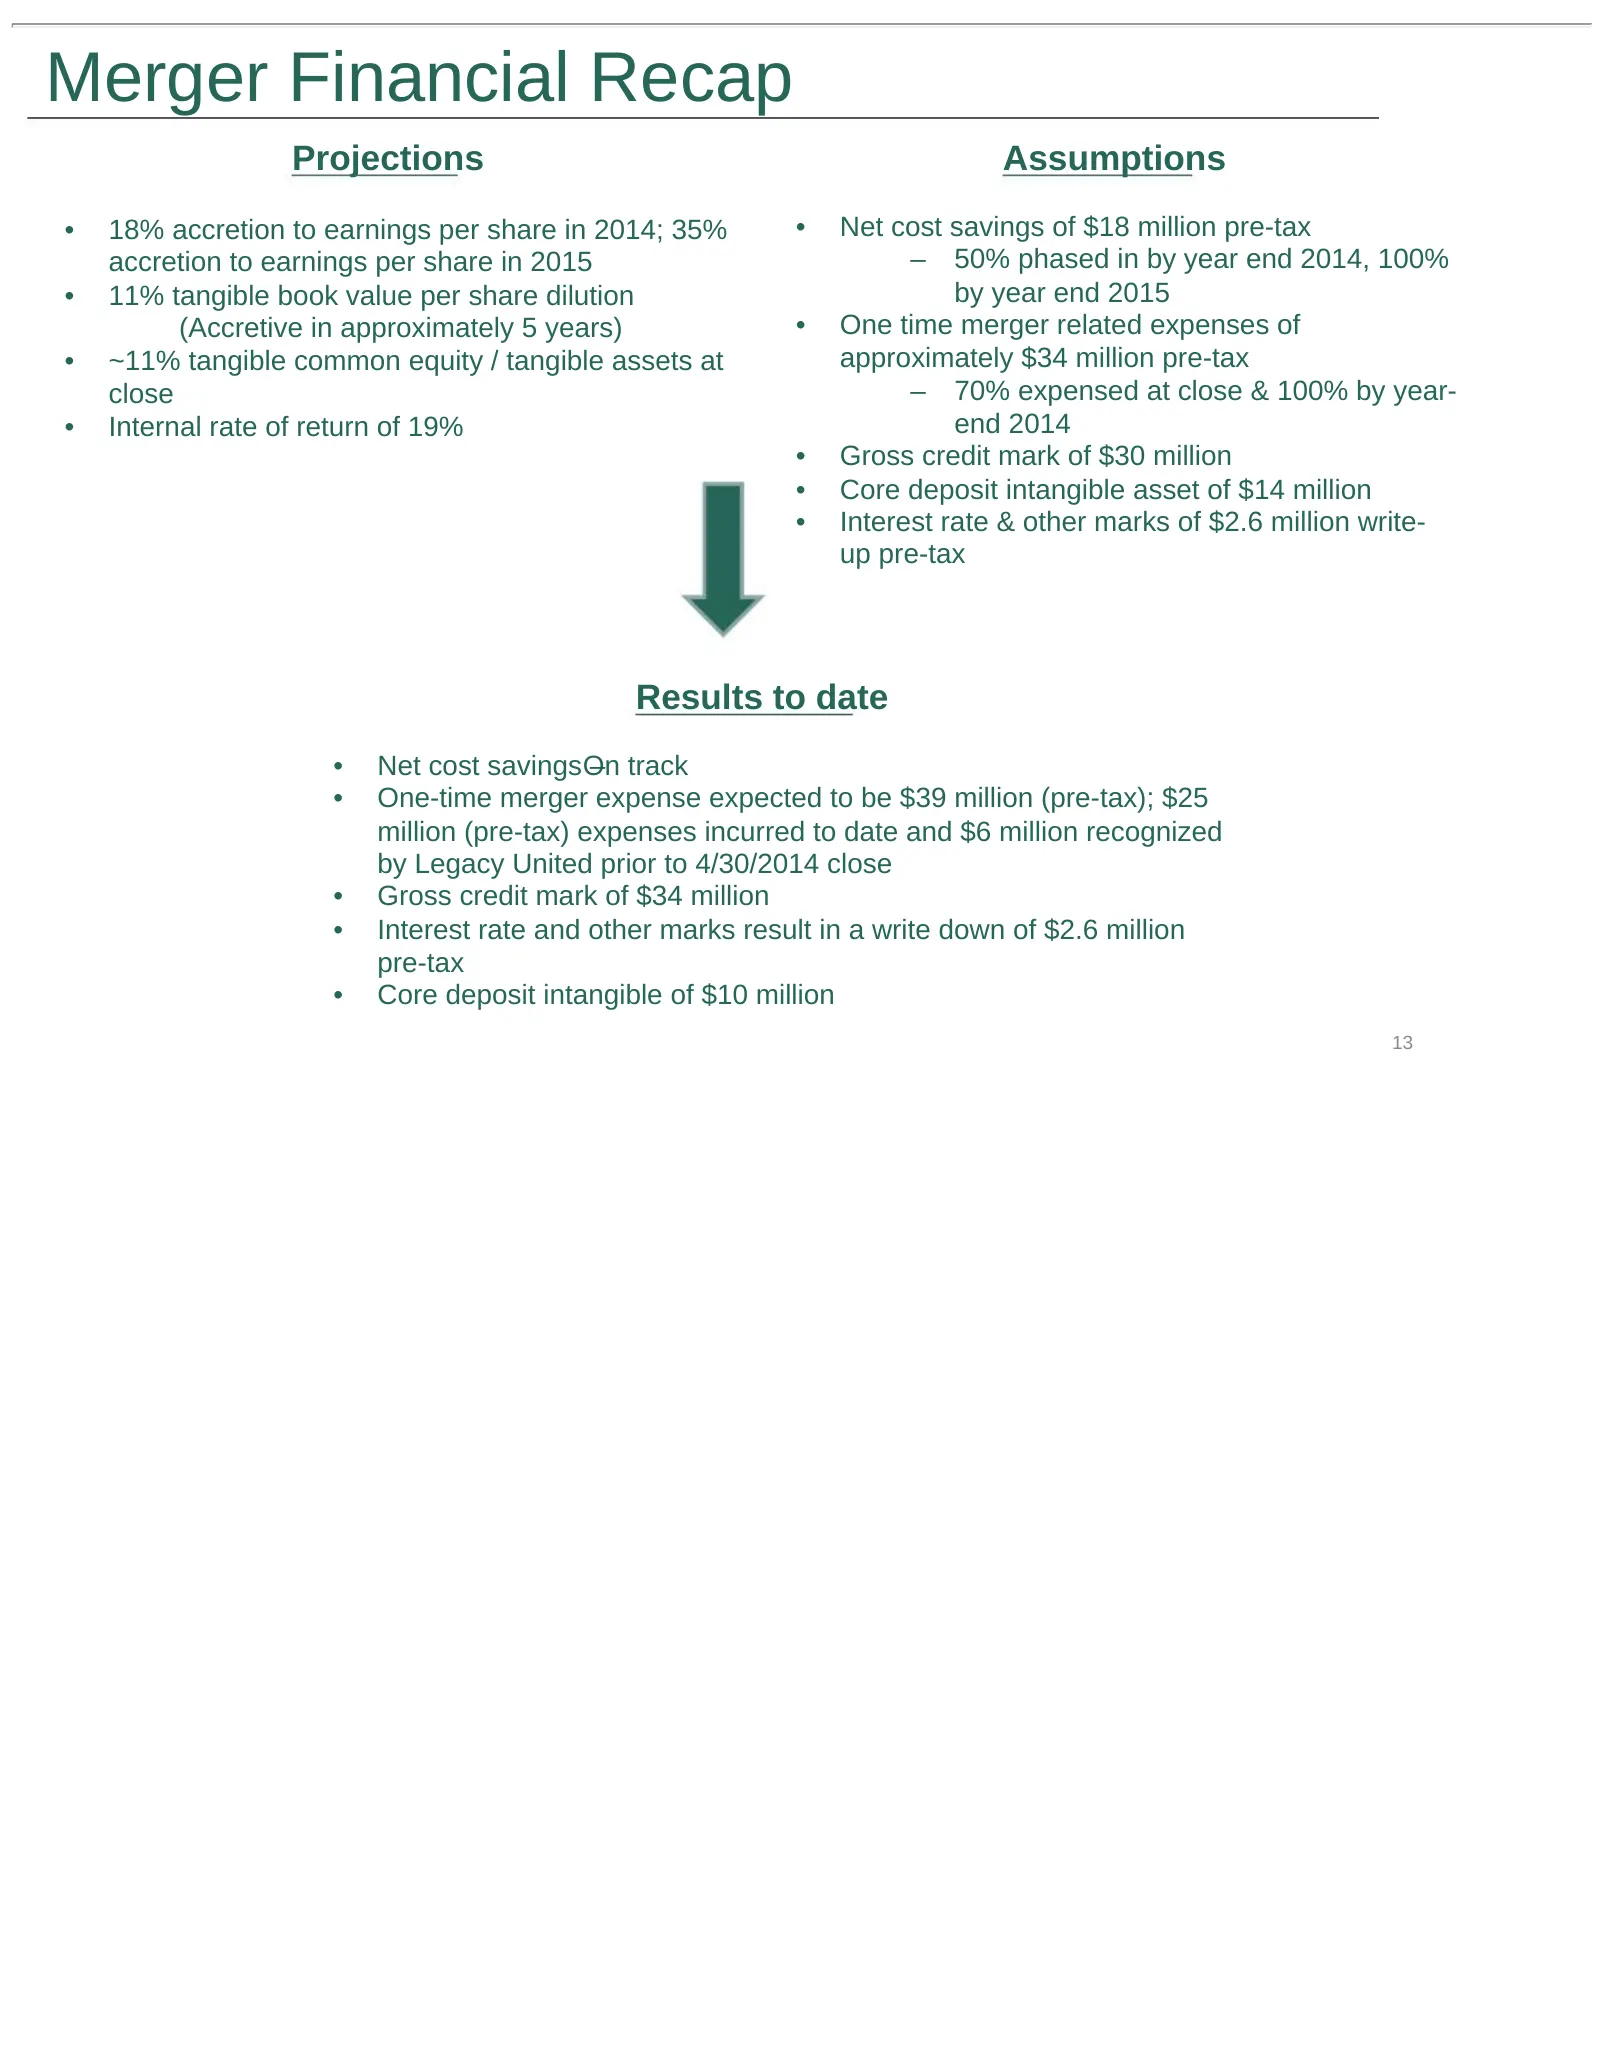
Merger Financial Recap Projections Assumptions • 18% accretion to earnings per share in 2014; 35% • Net cost savings of $18 million pre-tax accretion to earnings per share in 2015 – 50% phased in by year end 2014, 100% • 11% tangible book value per share dilution by year end 2015 (Accretive in appro
Slide 14: Loan Portfolio Allocation
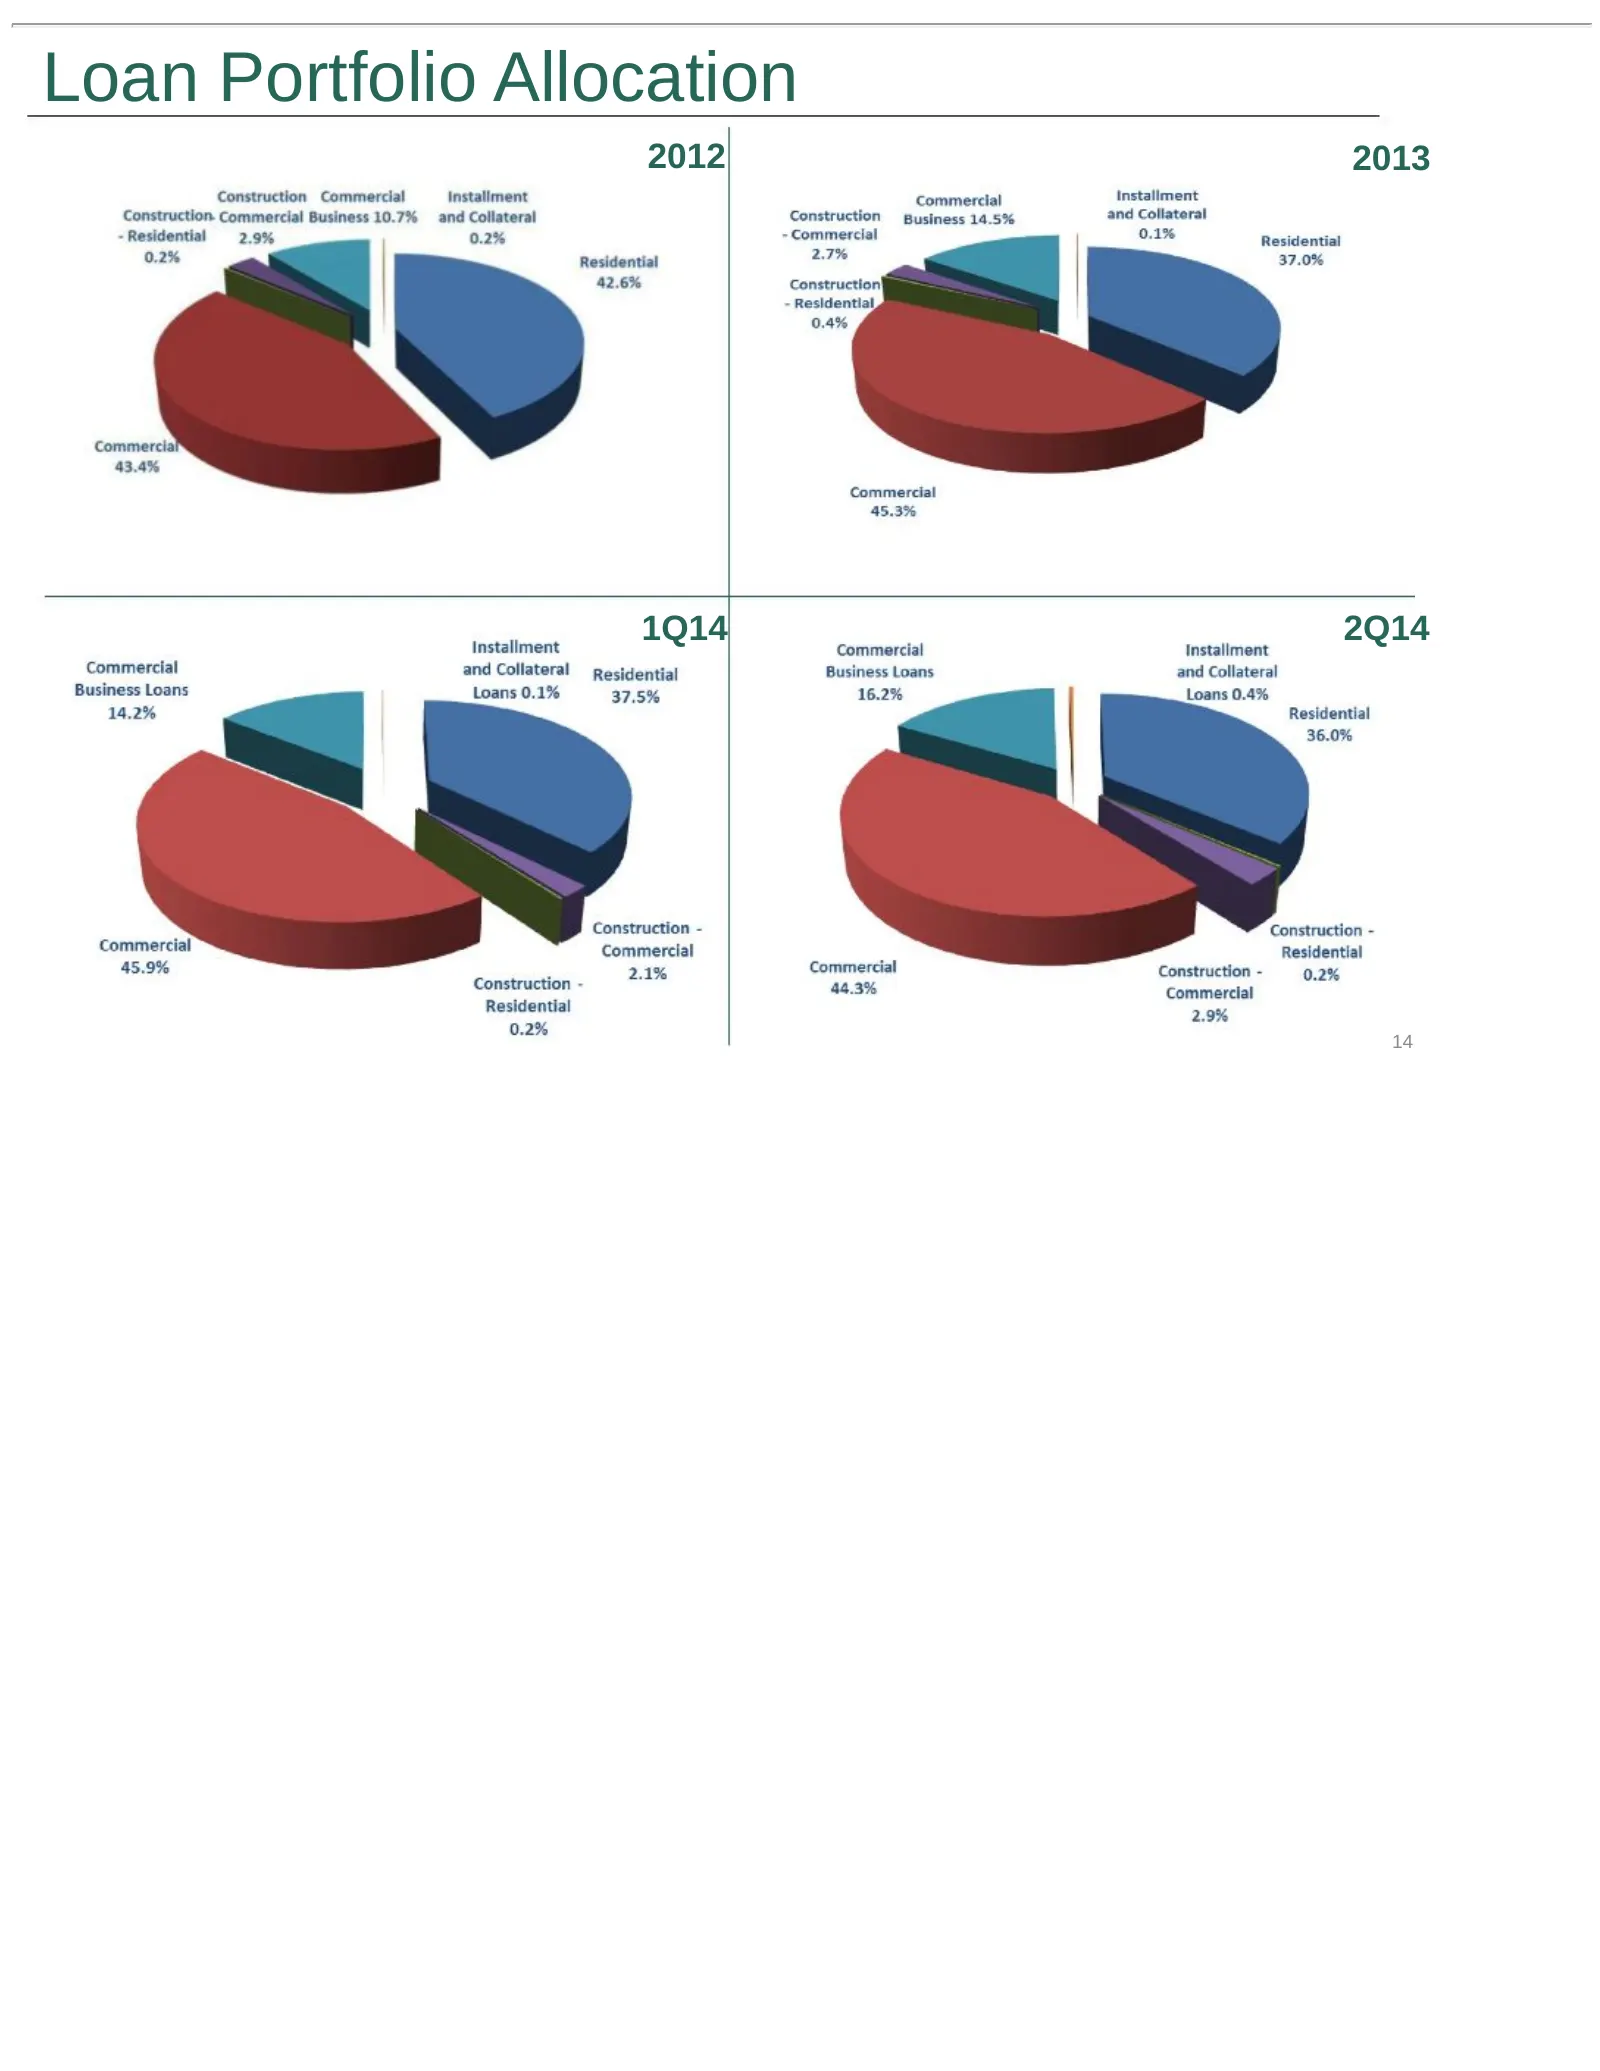
Loan Portfolio Allocation 2012 2013 1Q14 2Q14 14
Slide 15: Credit Culture –Fundamentals
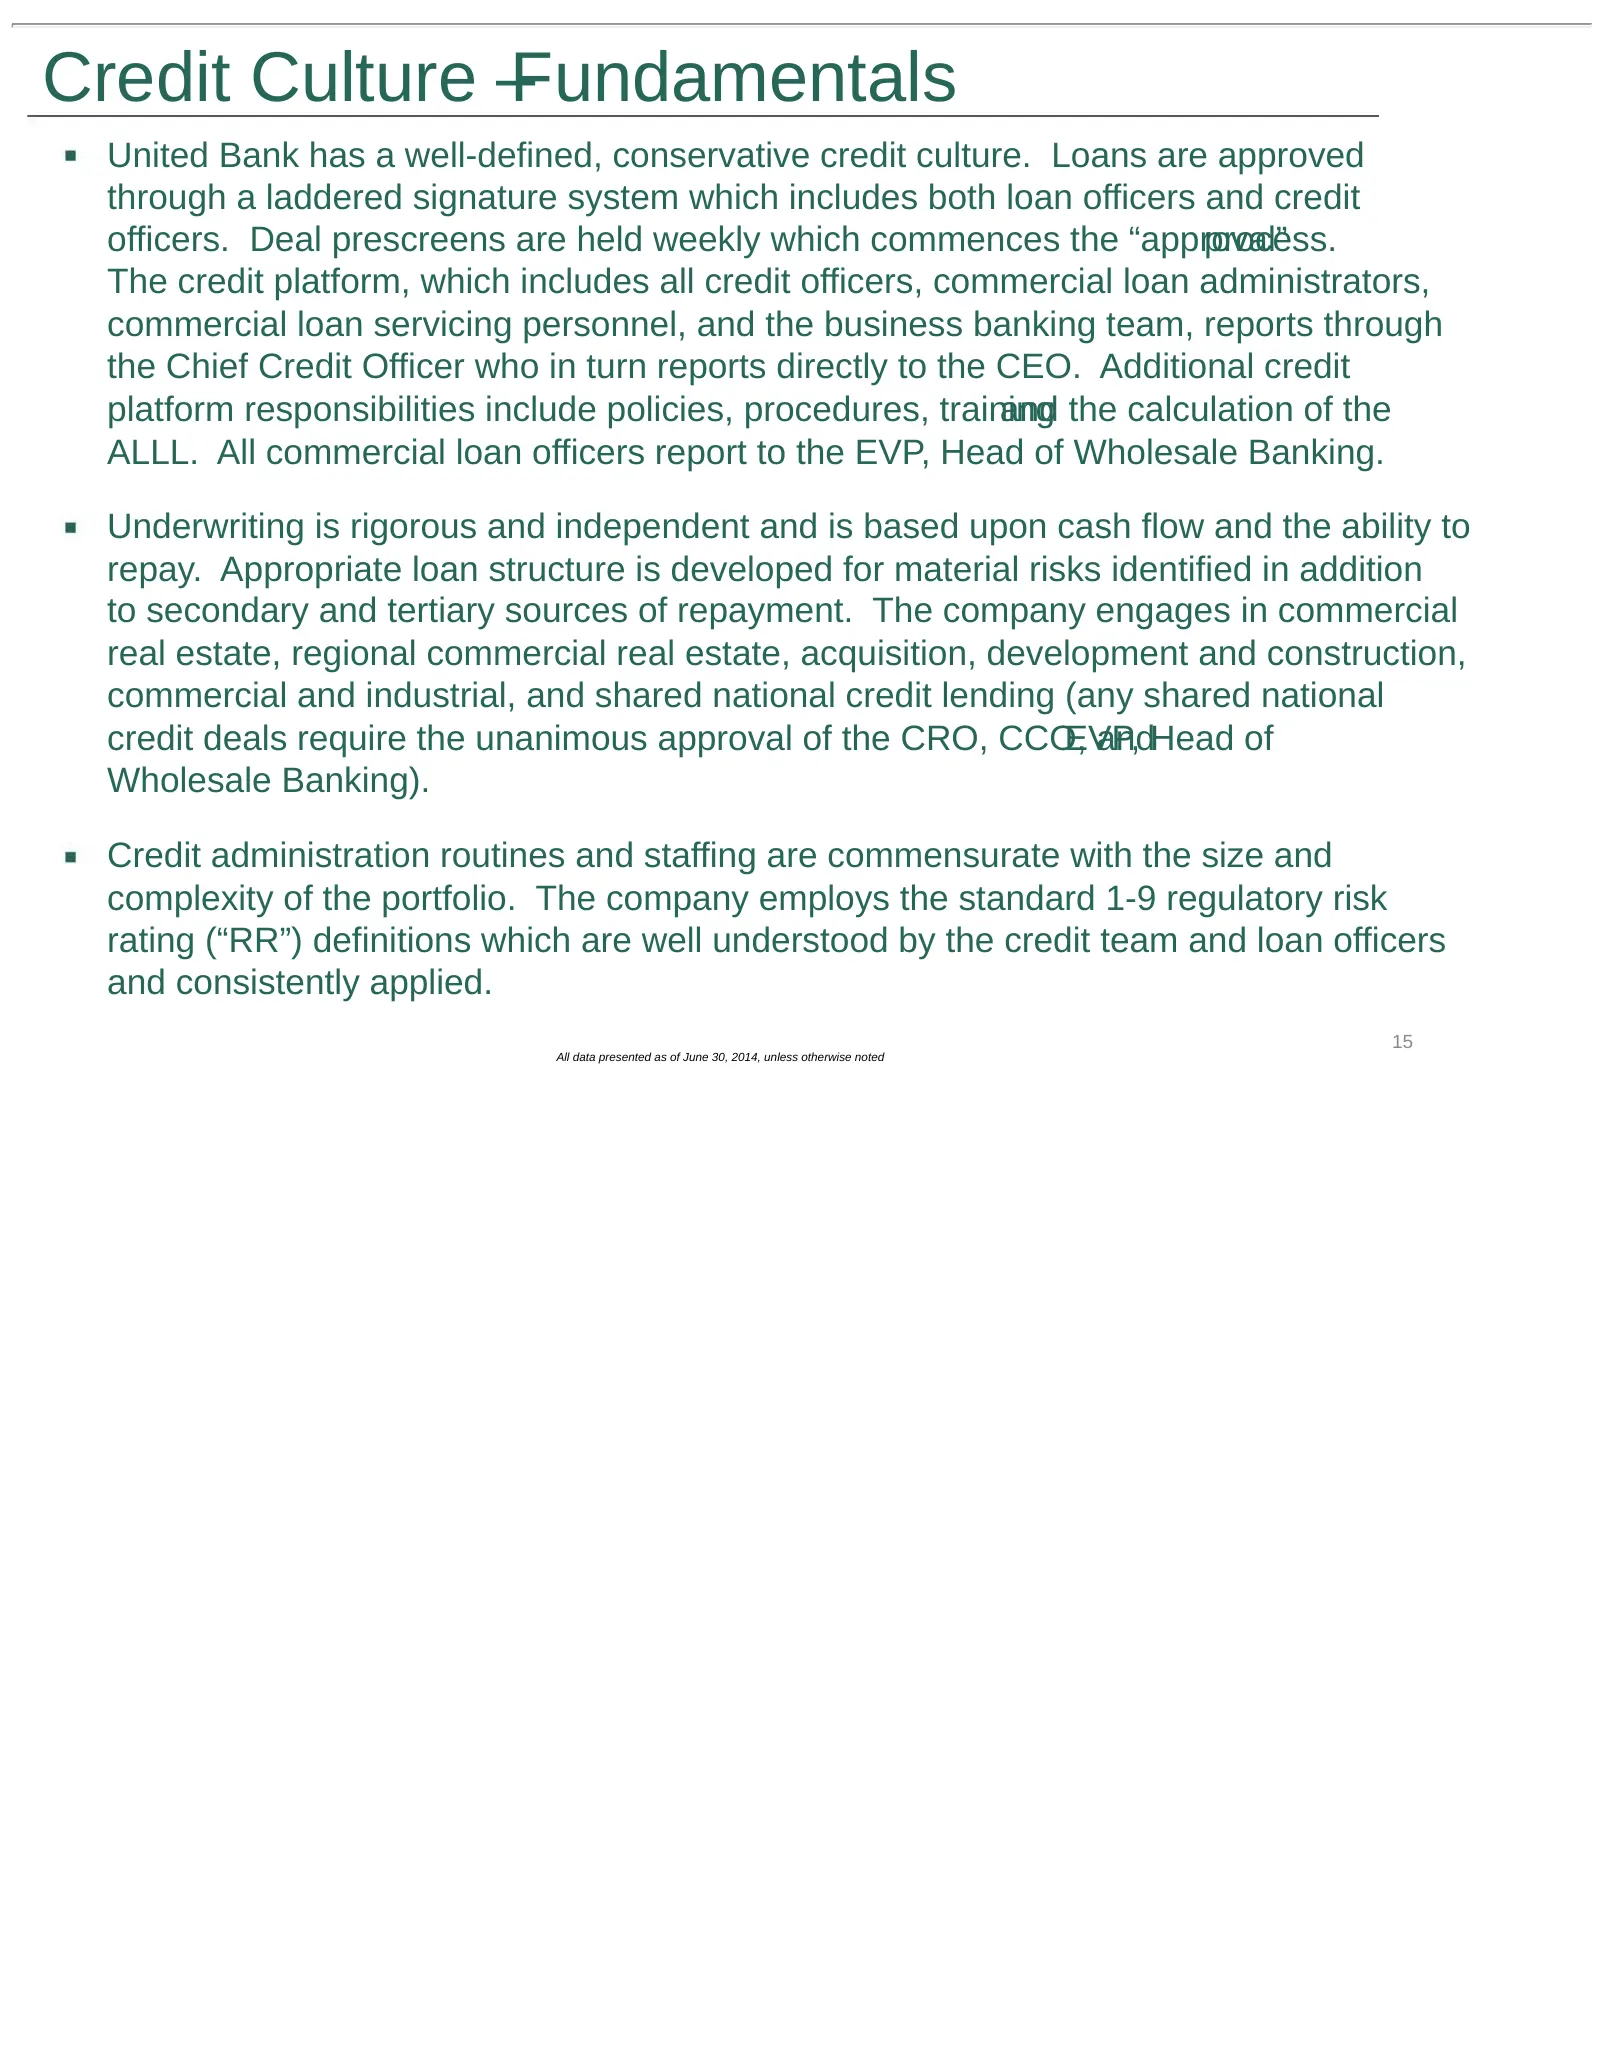
Credit Culture –Fundamentals United Bank has a well-defined, conservative credit culture. Loans are approved through a laddered signature system which includes both loan officers and credit officers. Deal prescreens are held weekly which commences the “approval” process. The credit platform, which i
Slide 16: Commercial Portfolio Composition MRQ
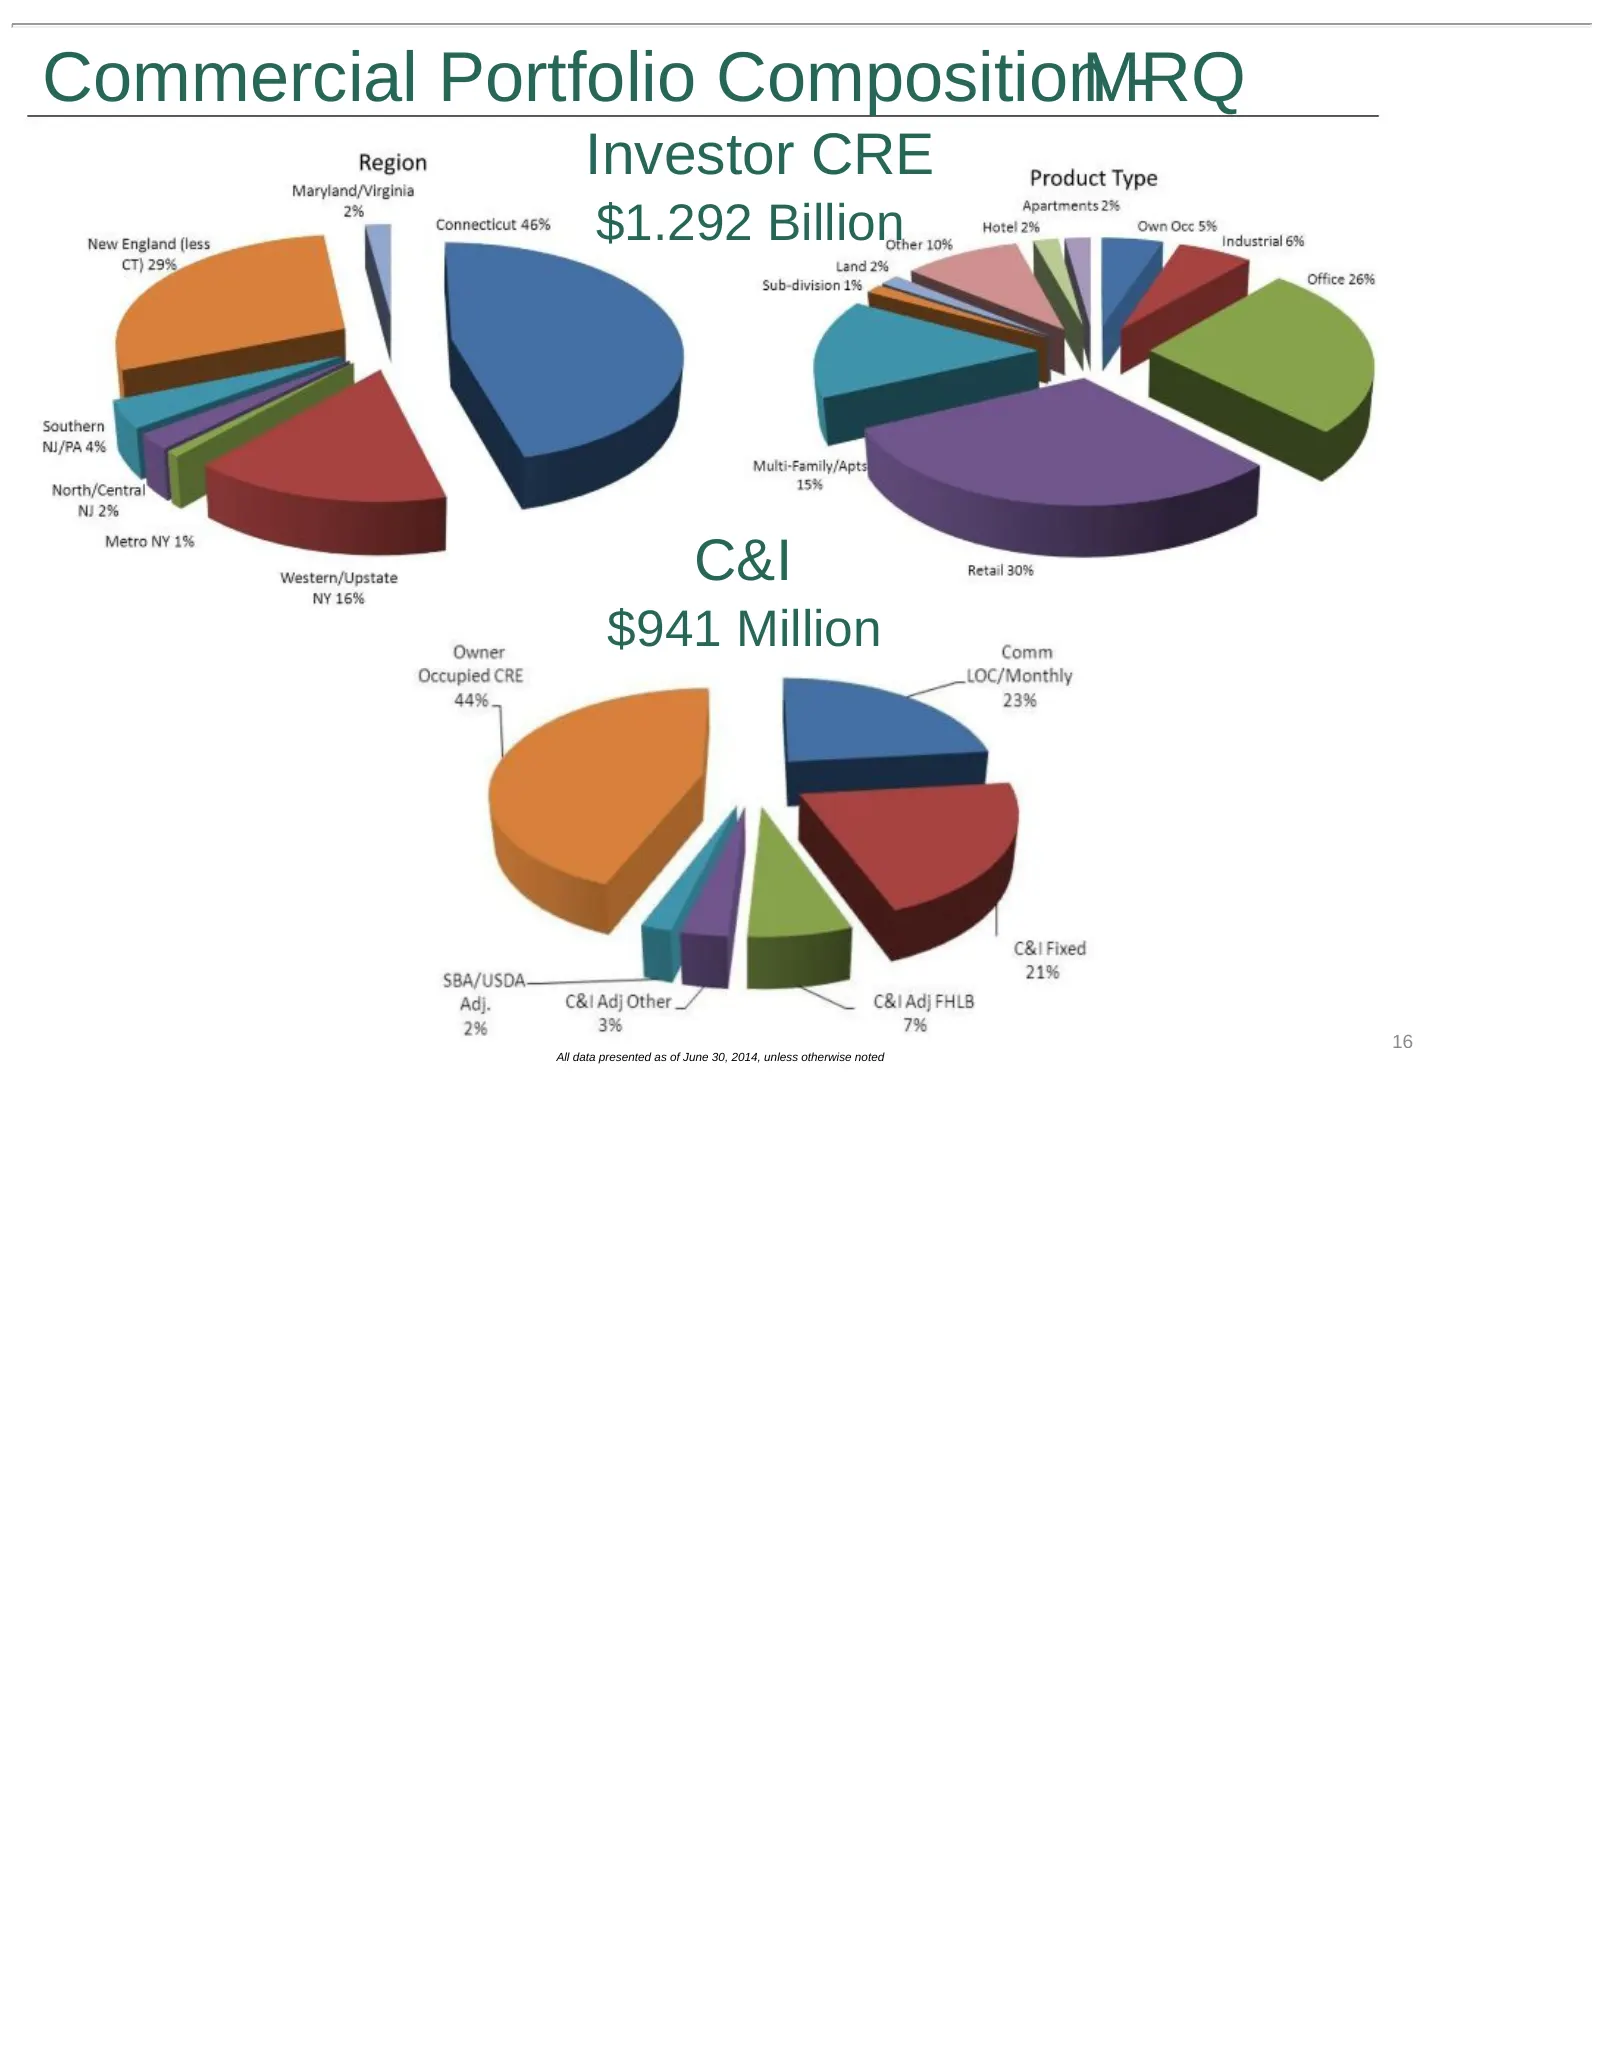
Commercial Portfolio CompositionMRQ - Investor CRE $1.292 Billion C&I $941 Million 16 All data presented as of June 30, 2014, unless otherwise noted
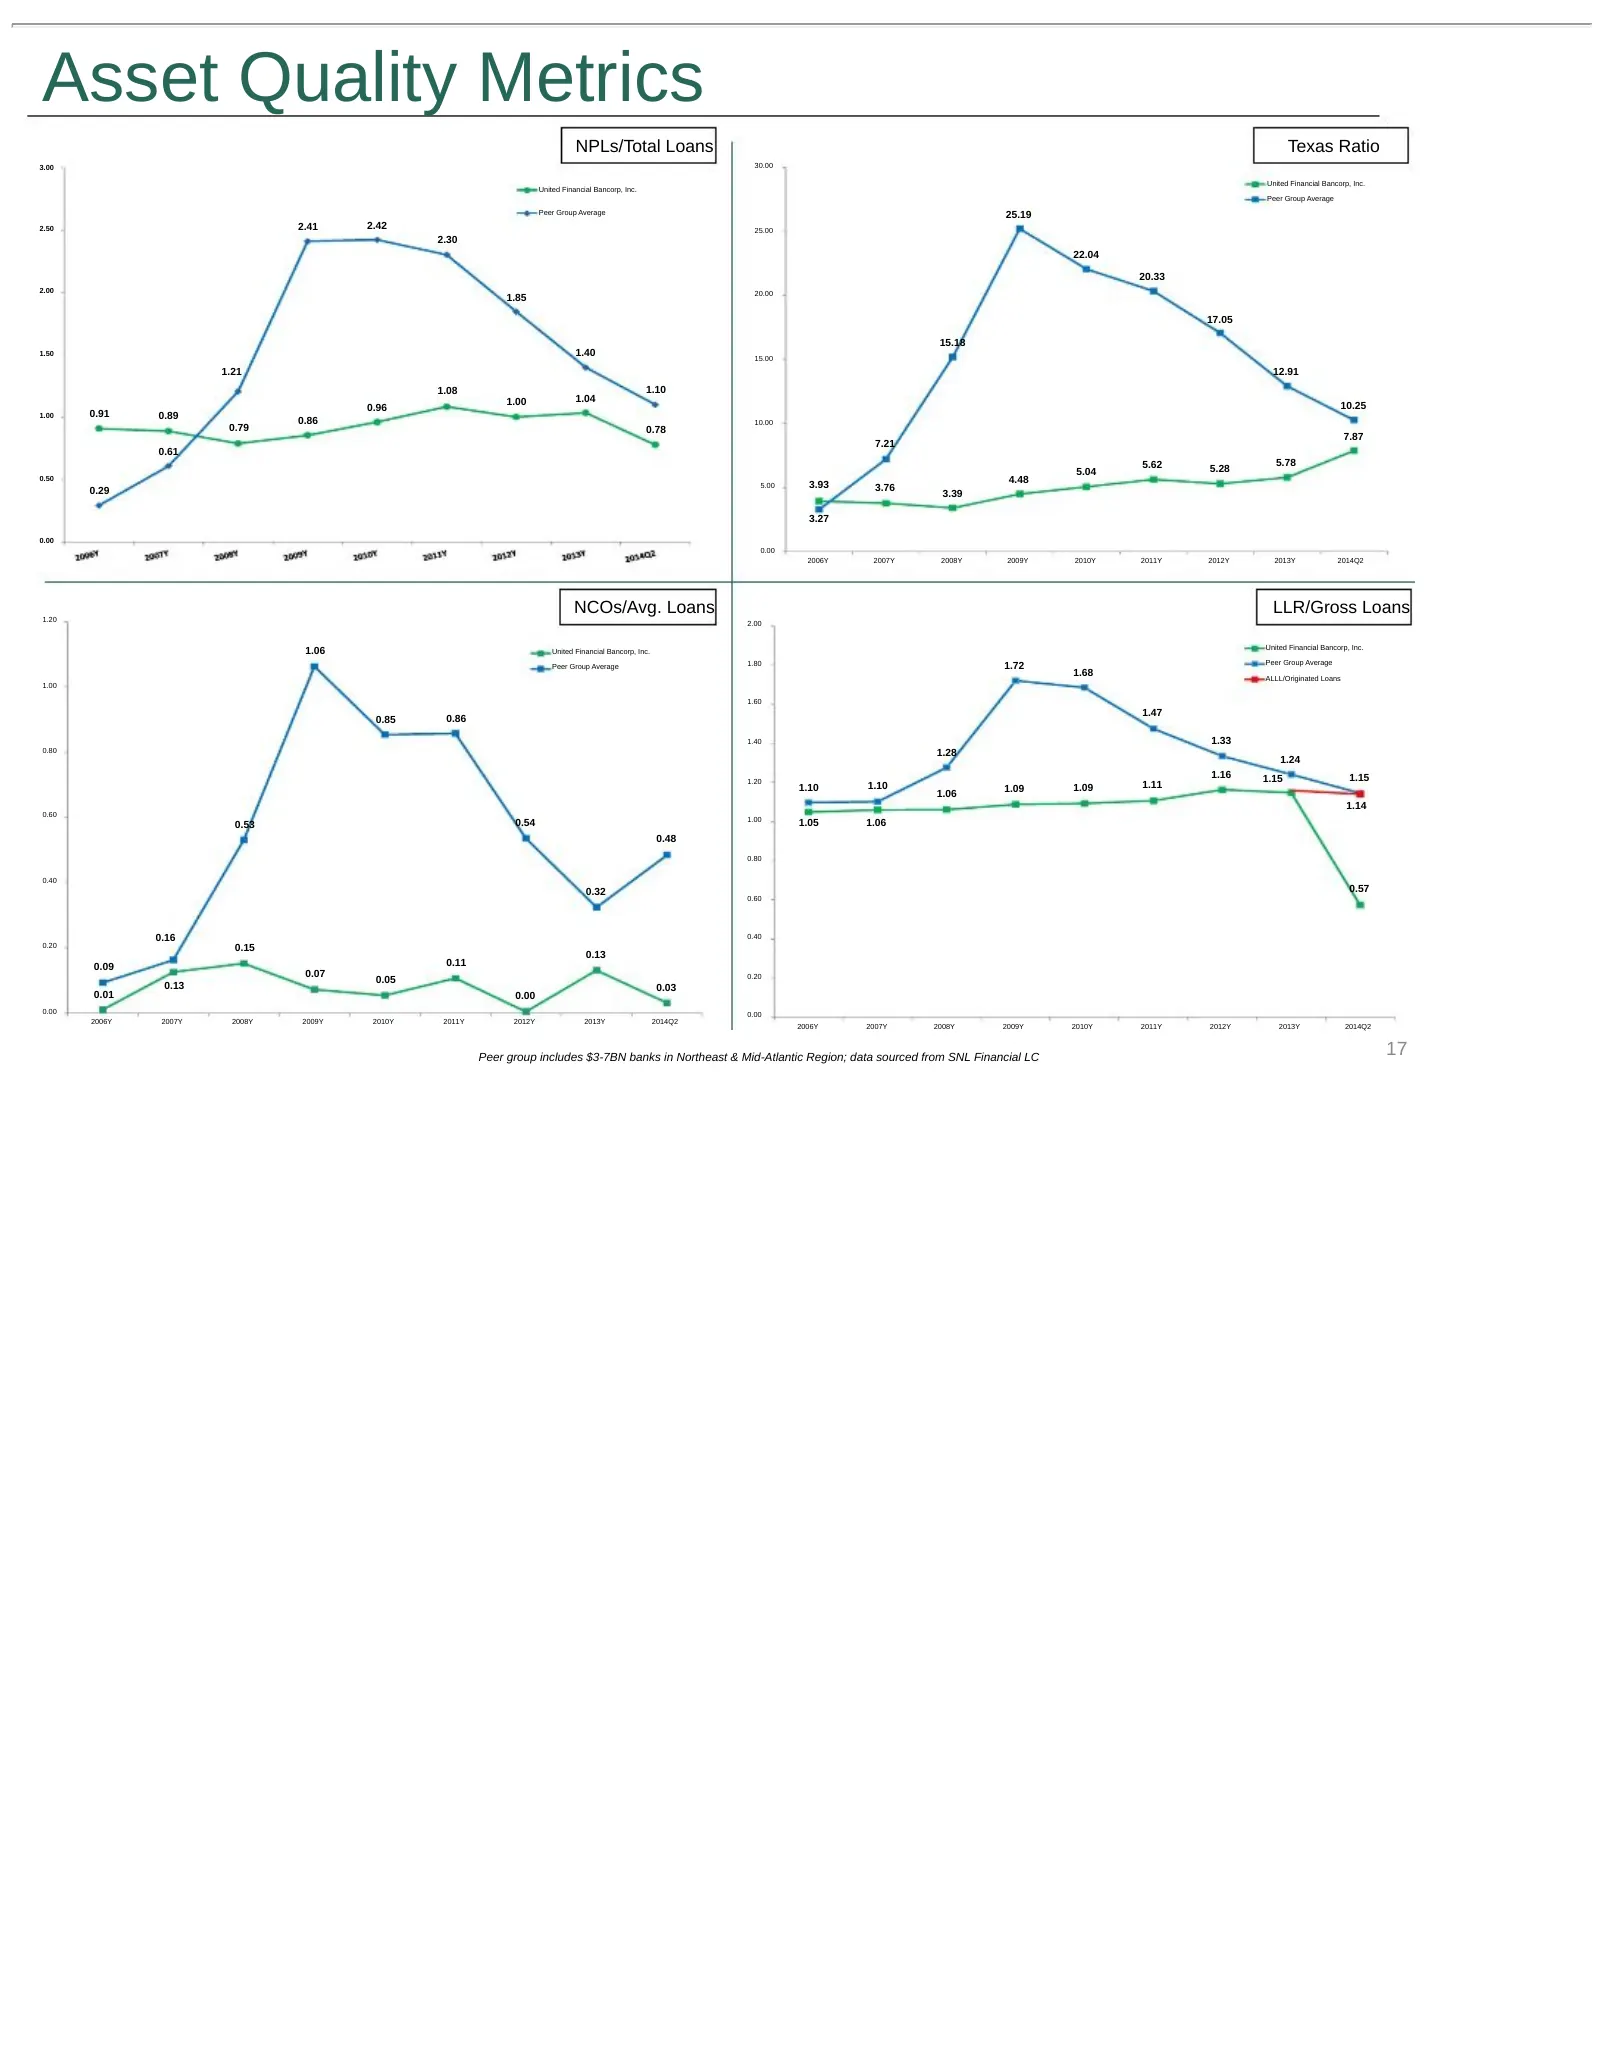
Slide 17: Asset Quality Metrics
Asset Quality Metrics NPLs/Total Loans Texas Ratio 3.00 30.00 United Financial Bancorp, Inc. United Financial Bancorp, Inc. Peer Group Average Peer Group Average 25.19 2.50 2.41 2.42 25.00 2.30 22.04 20.33 2.00 20.00 1.85 17.05 15.18 1.50 1.40 15.00 1.21 12.91 1.08 1.10 1.00 1.04 0.96 10.25 1.00 0.9
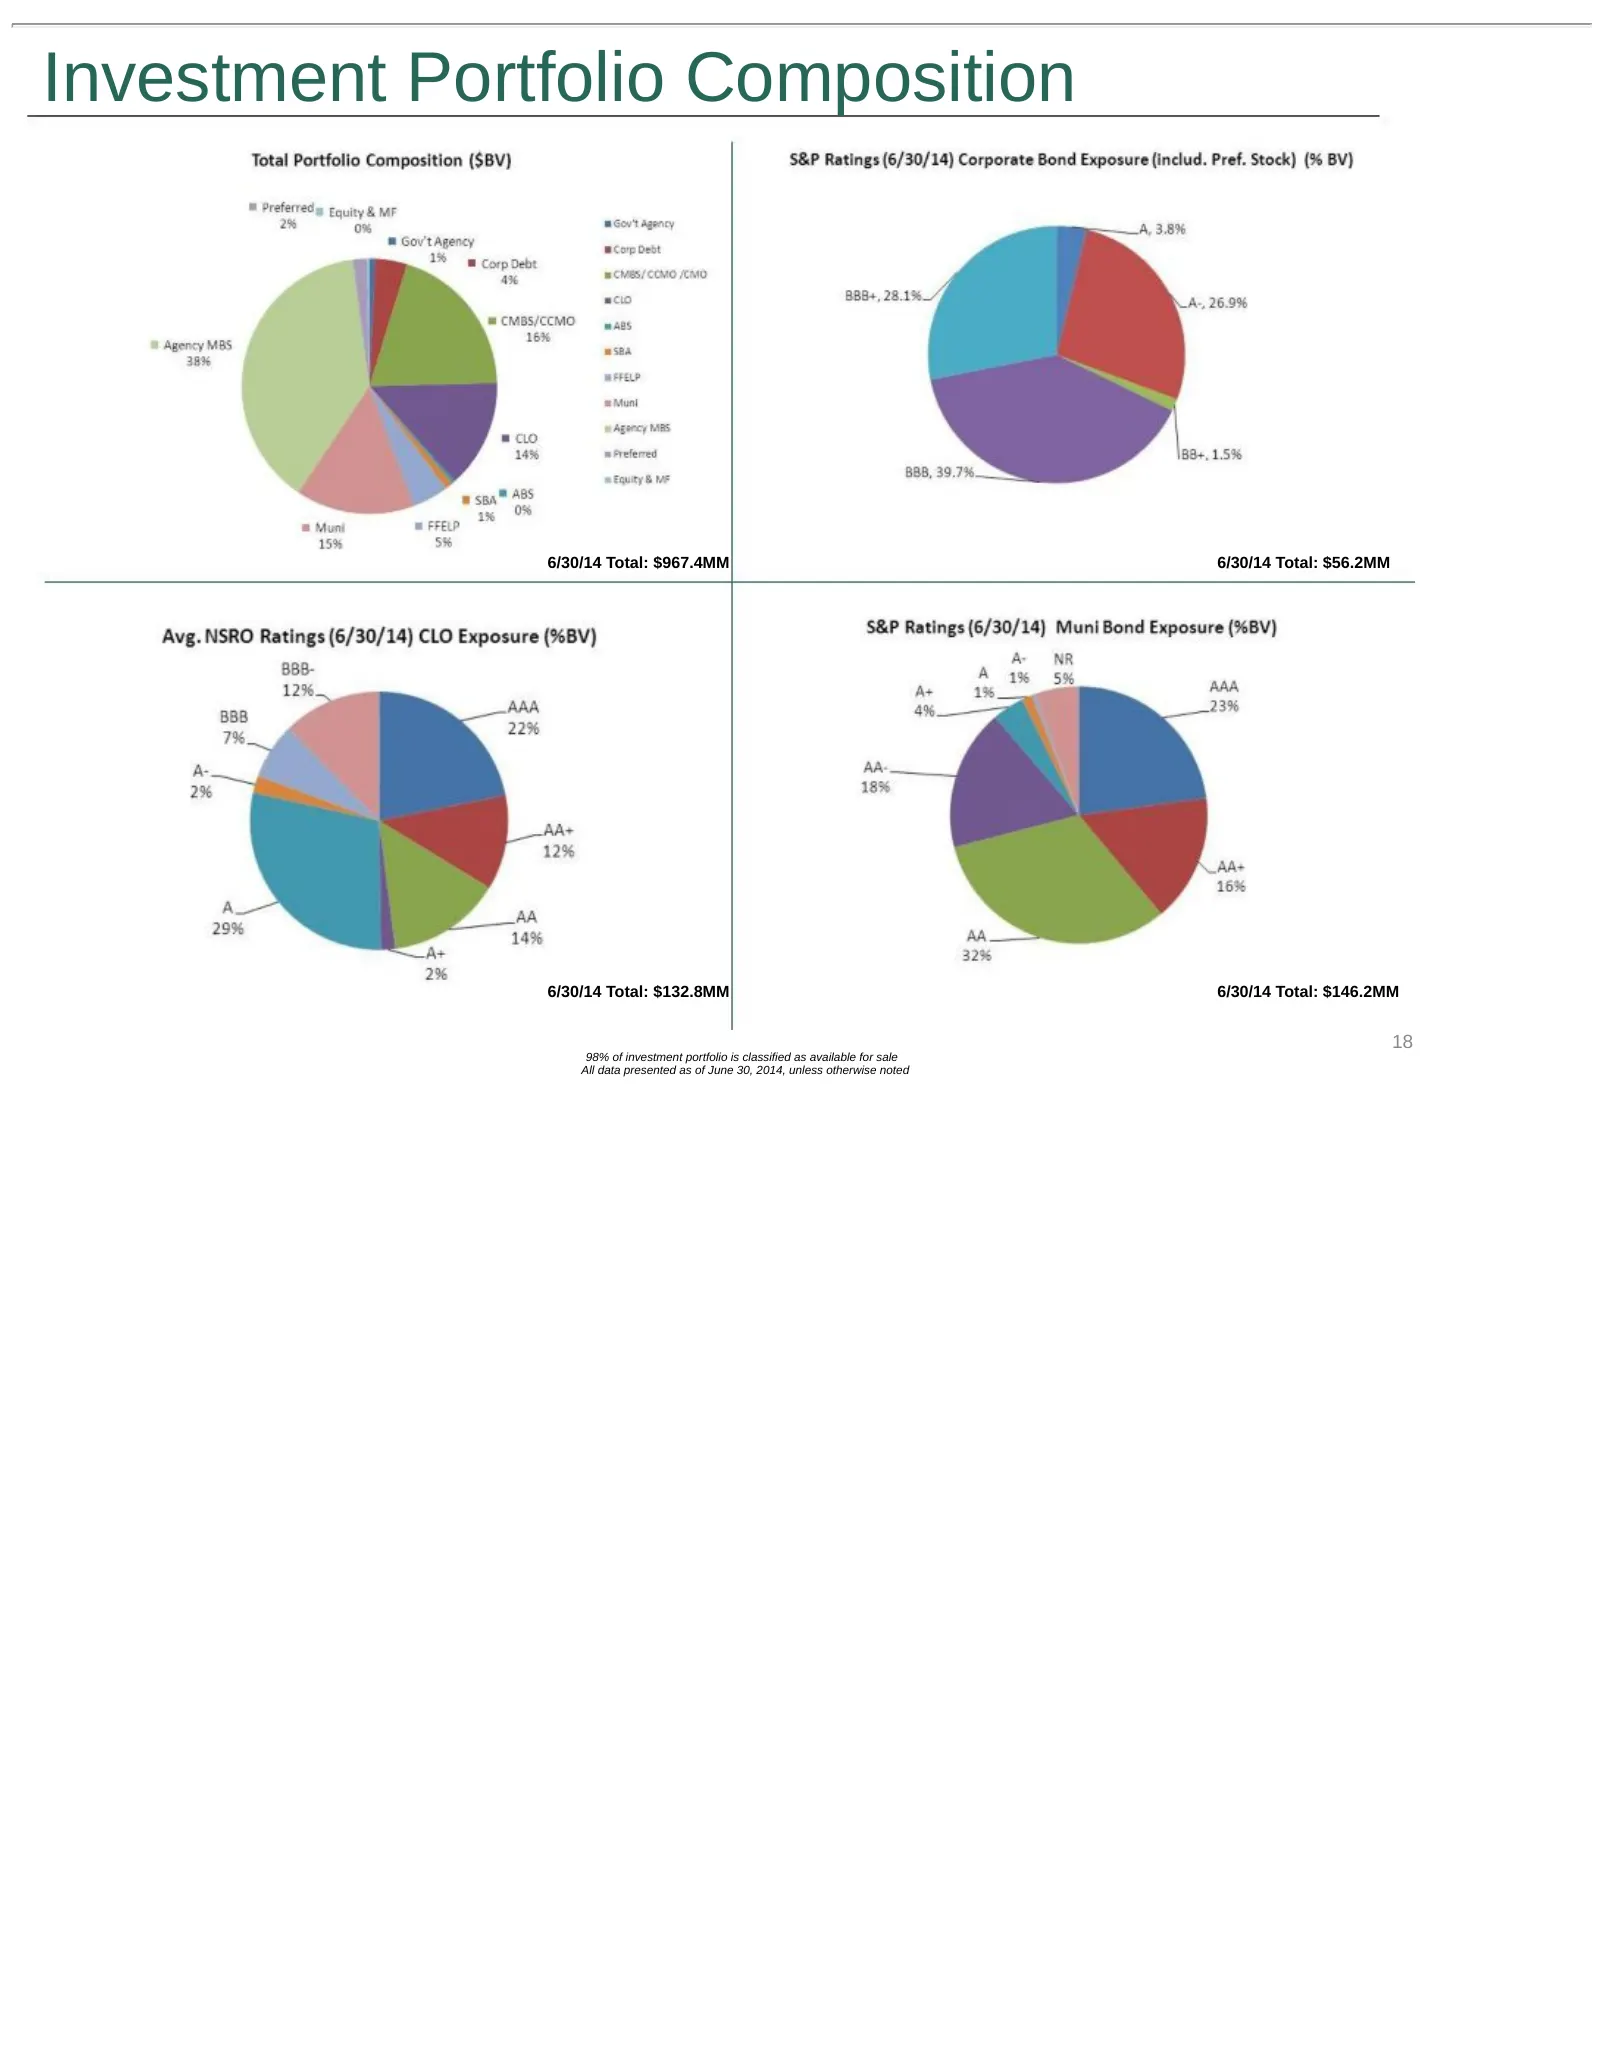
Slide 18: Investment Portfolio Composition
Investment Portfolio Composition 6/30/14 Total: $967.4MM 6/30/14 Total: $56.2MM 6/30/14 Total: $132.8MM 6/30/14 Total: $146.2MM 18 98% of investment portfolio is classified as available for sale All data presented as of June 30, 2014, unless otherwise noted
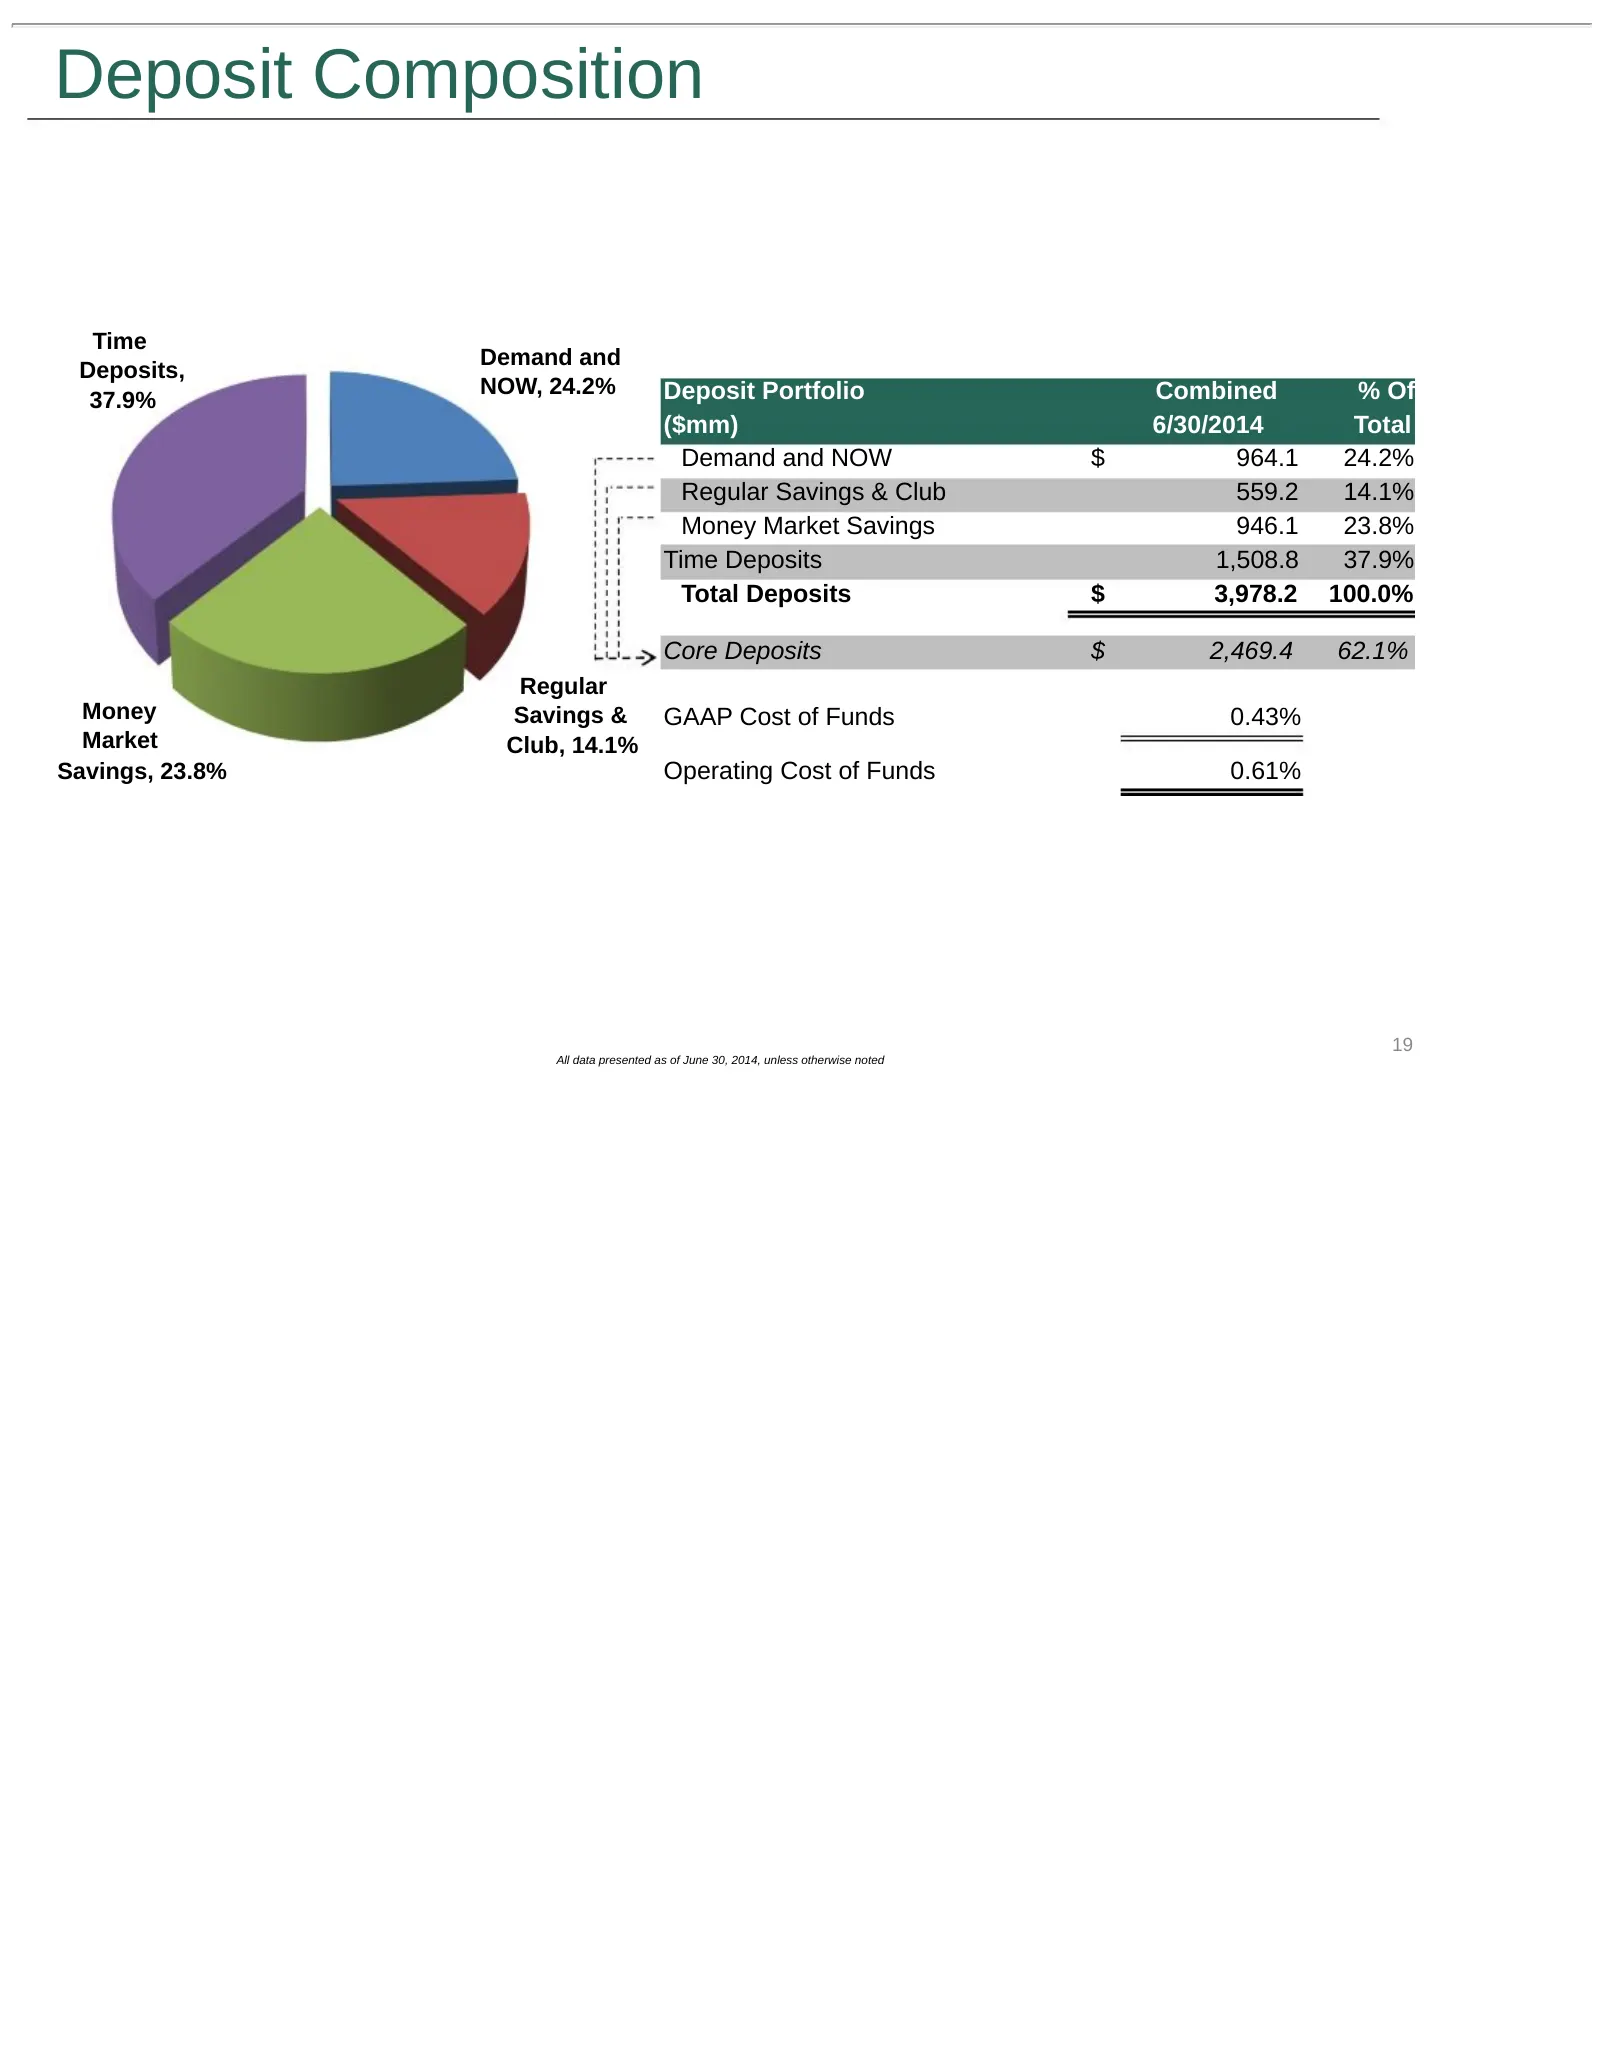
Slide 19: Deposit Composition
Deposit Composition Time Demand and Deposits, NOW, 24.2% Deposit Portfolio Combined % Of 37.9% ($mm) 6/30/2014 Total Demand and NOW $ 964.1 24.2% Regular Savings & Club 559.2 14.1% Money Market Savings 946.1 23.8% Time Deposits 1,508.8 37.9% Total Deposits $ 3,978.2 100.0% Core Deposits $ 2,469.4 62
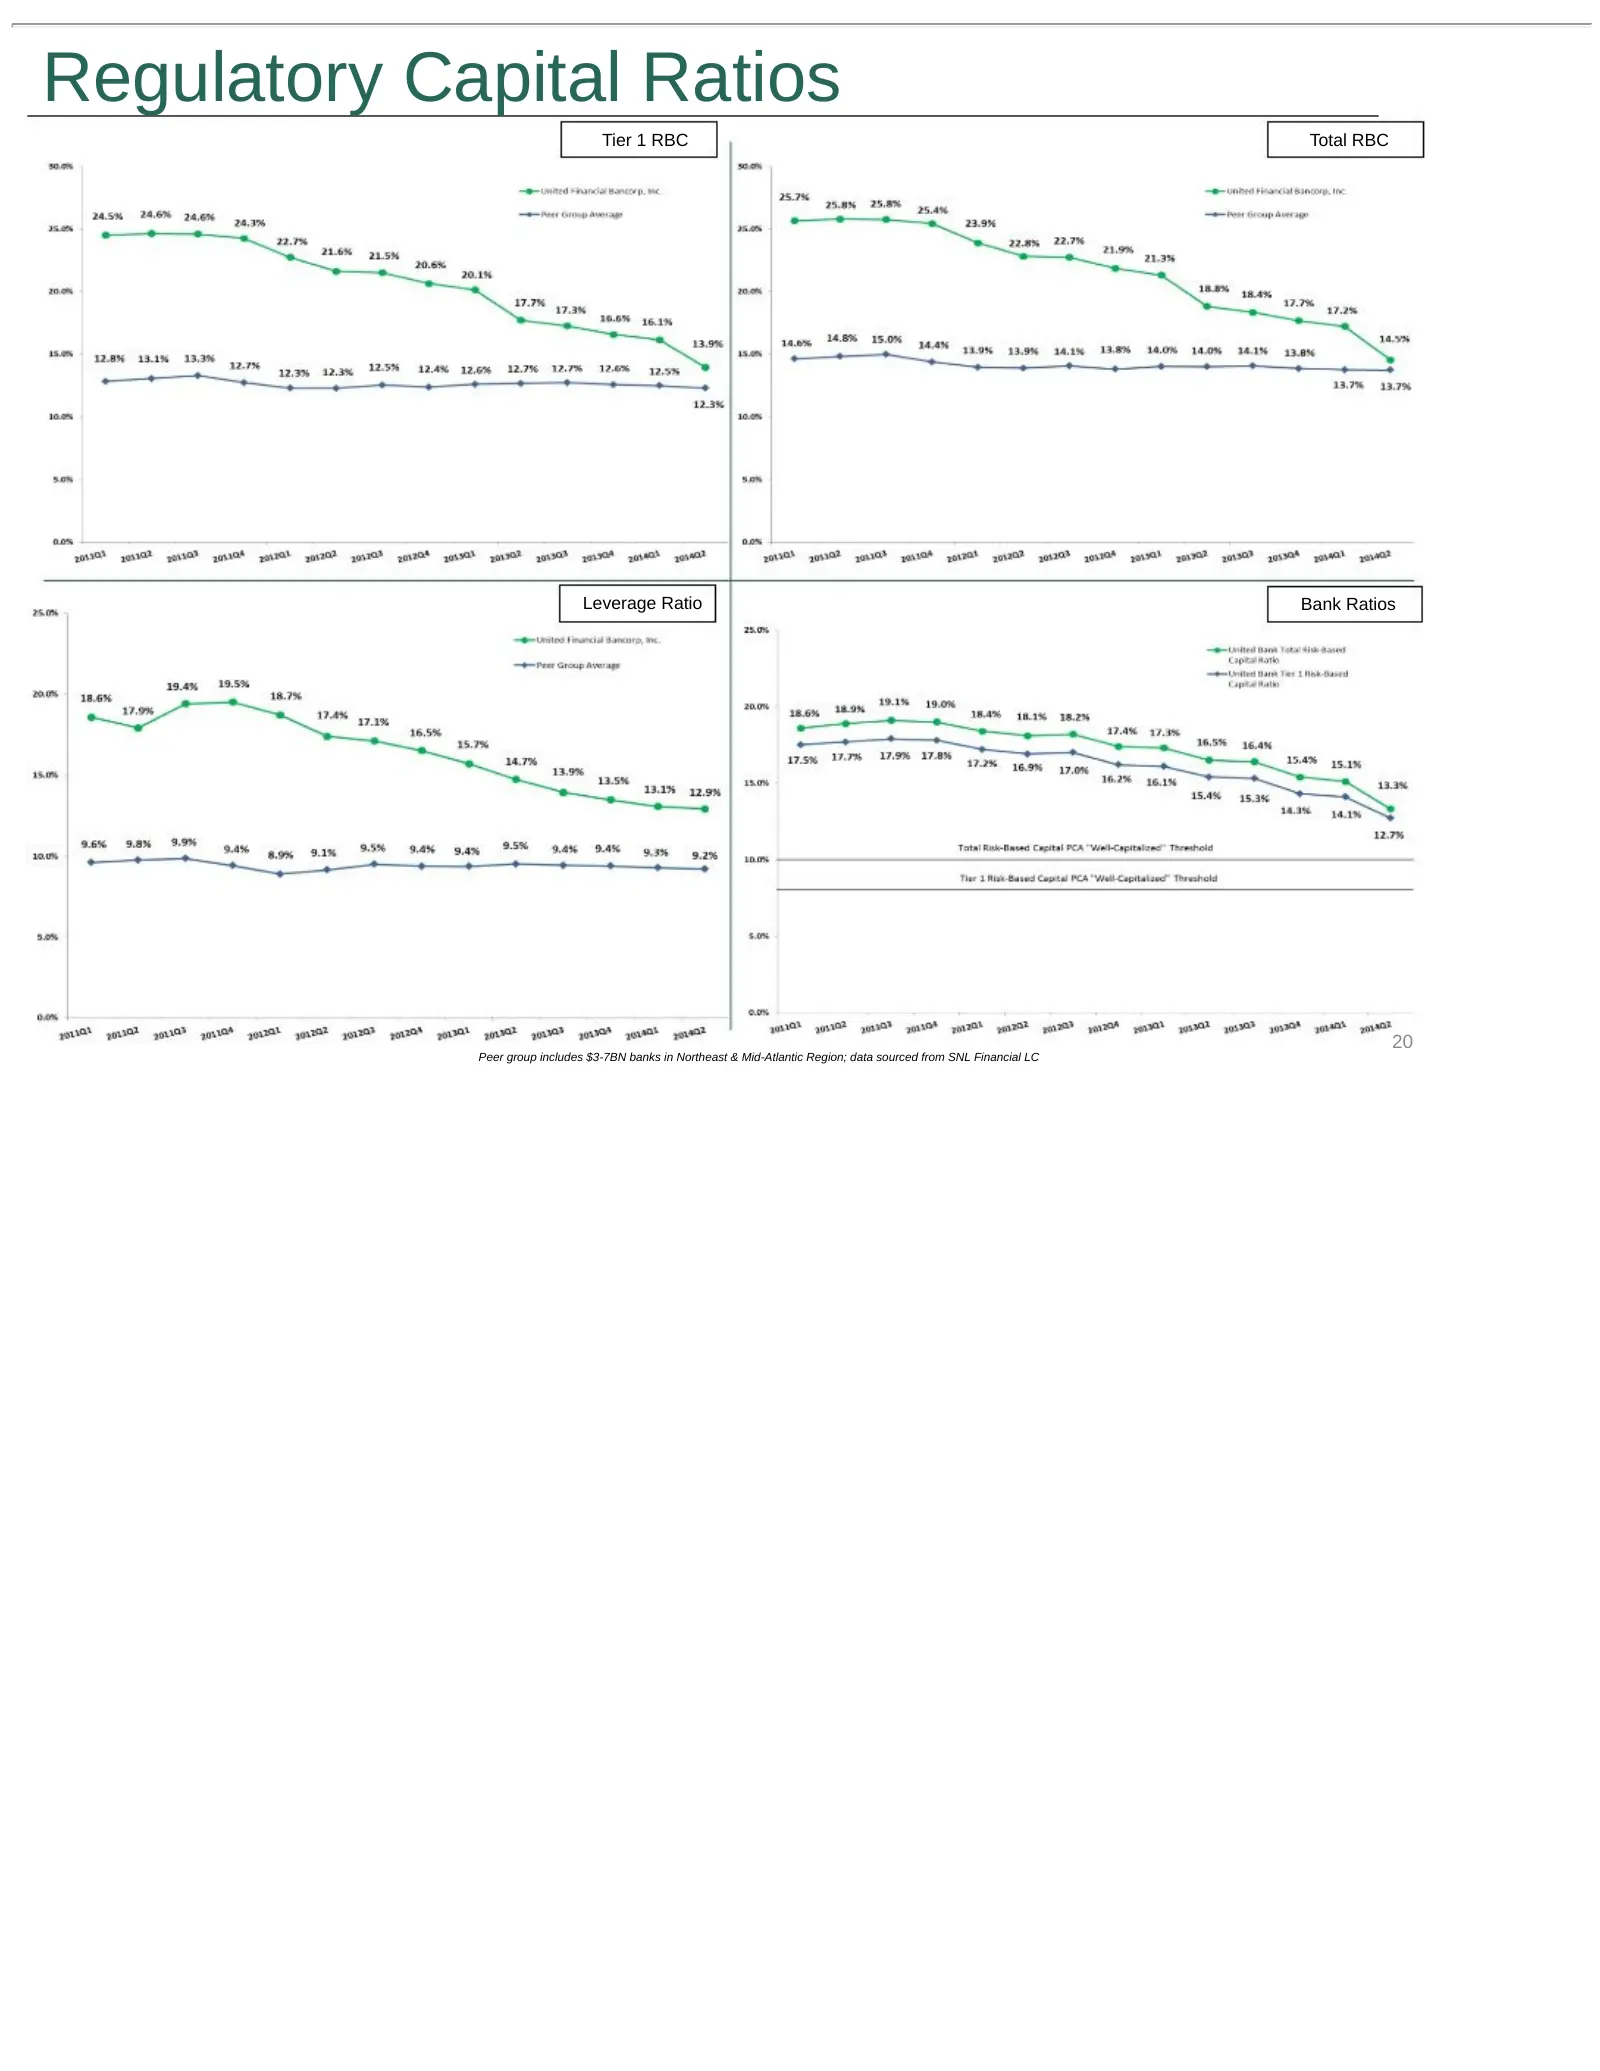
Slide 20: Regulatory Capital Ratios
Regulatory Capital Ratios Tier 1 RBC Total RBC Leverage Ratio Bank Ratios 20 Peer group includes $3-7BN banks in Northeast & Mid-Atlantic Region; data sourced from SNL Financial LC
Slide 21: ERM Enterprise Risk Management
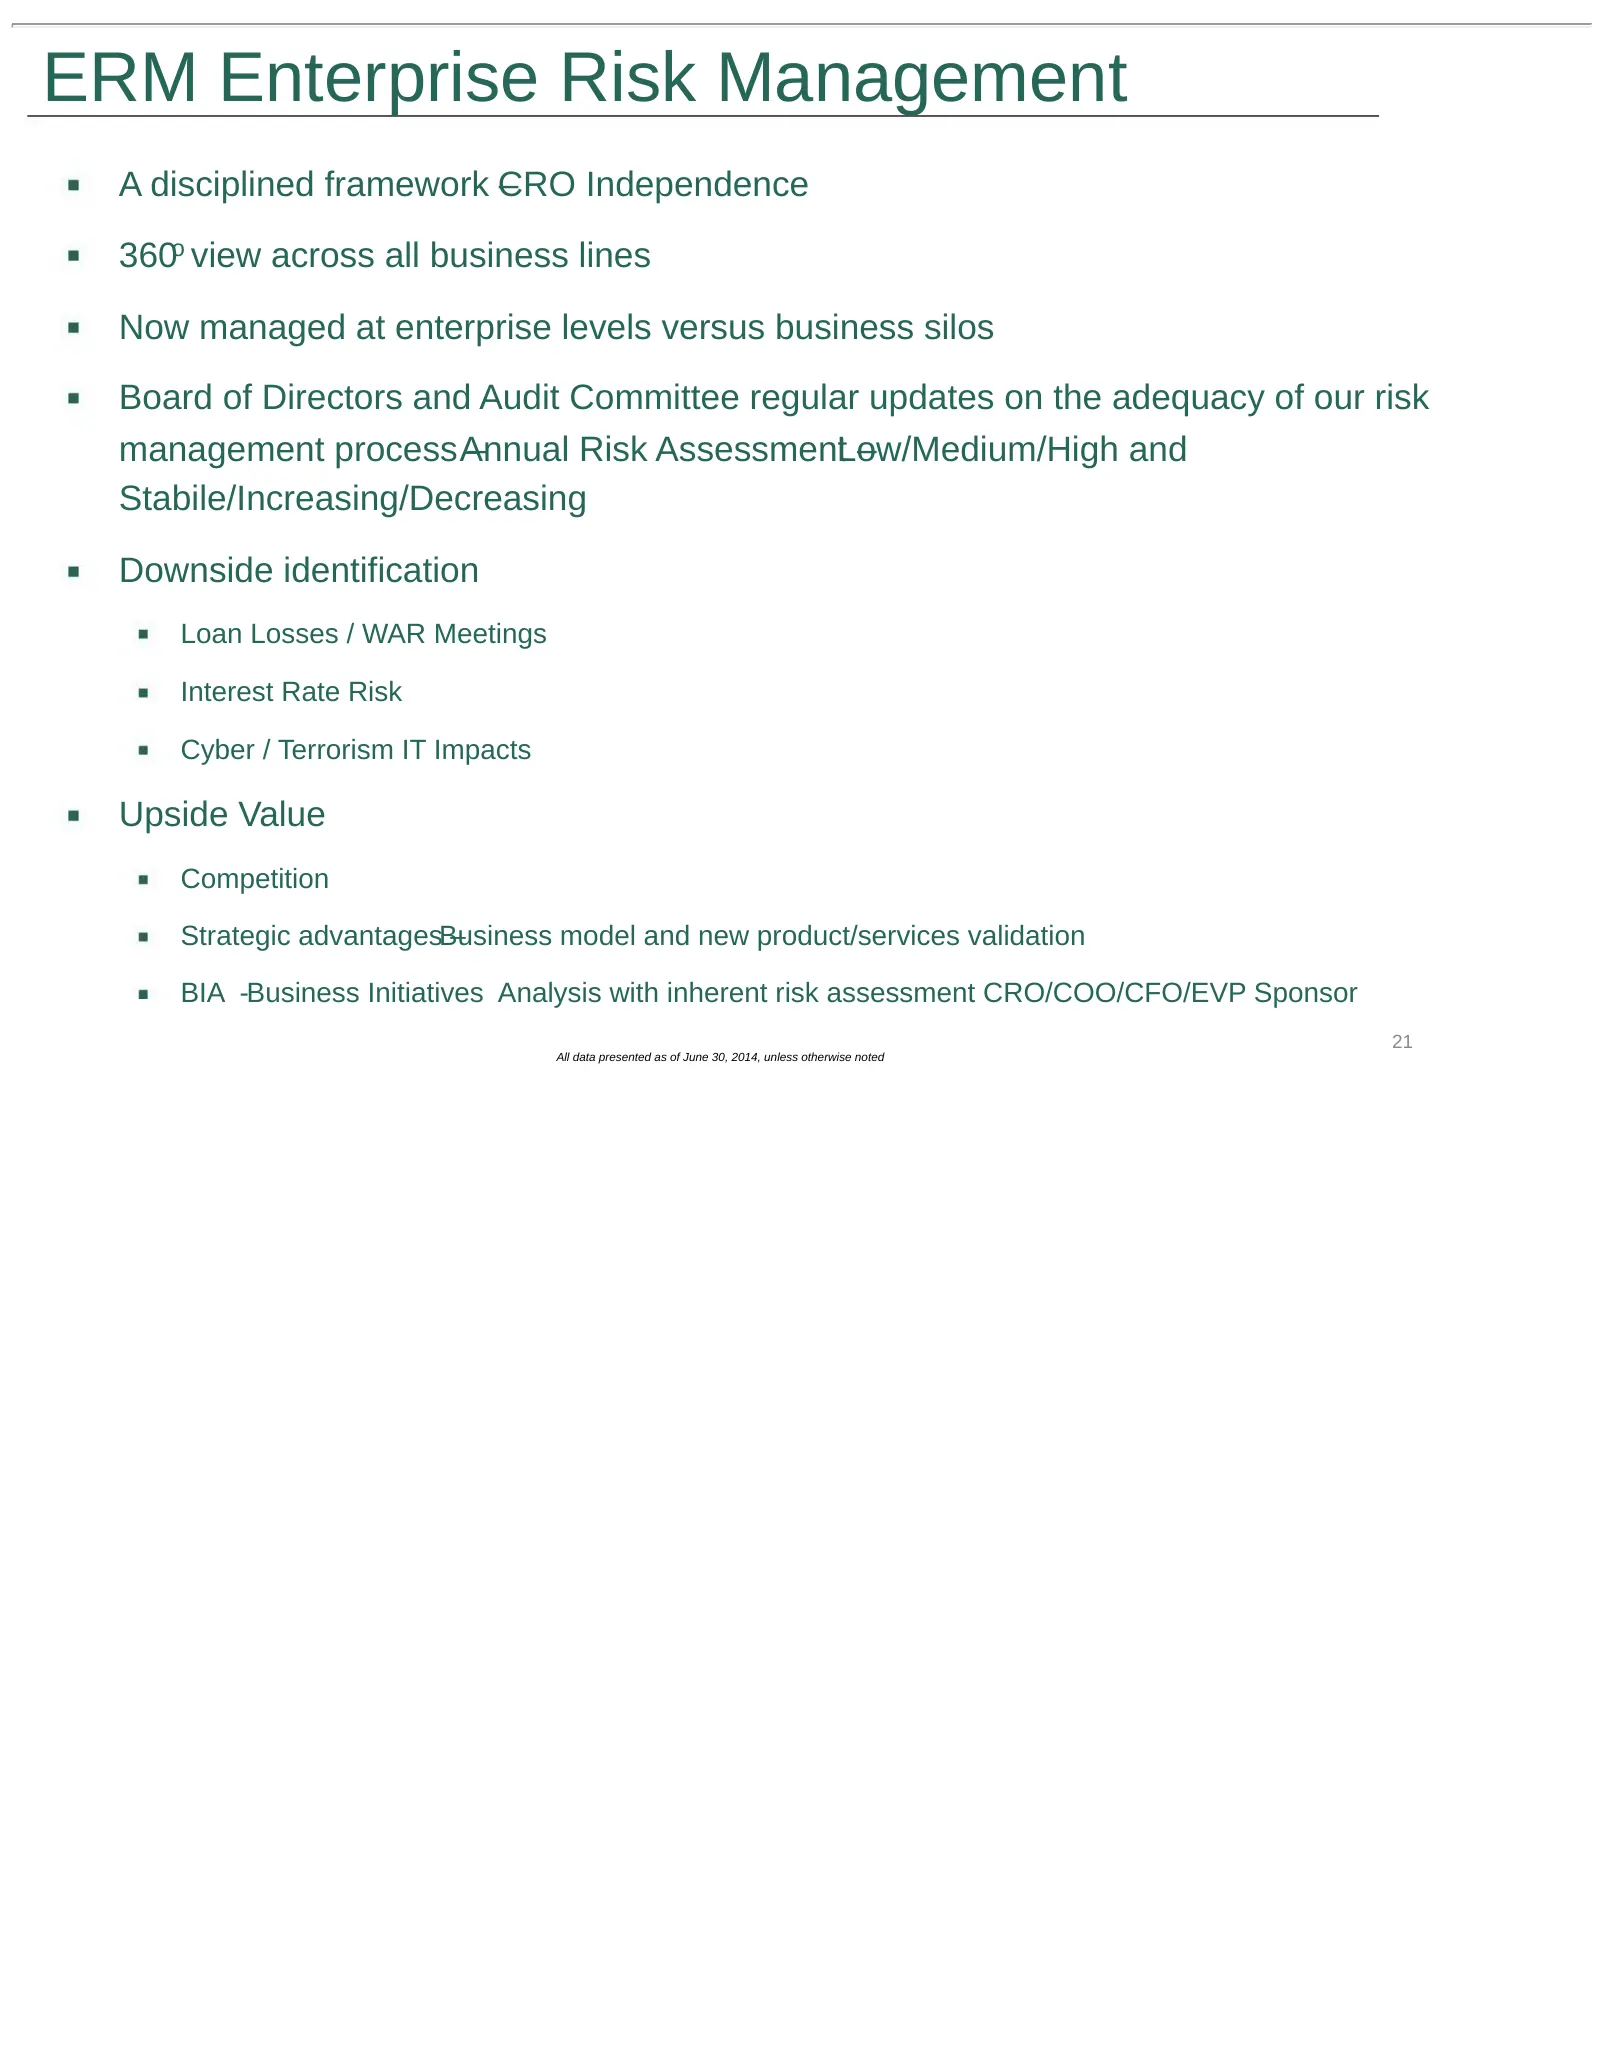
ERM Enterprise Risk Management A disciplined framework C – RO Independence 360o view across all business lines Now managed at enterprise levels versus business silos Board of Directors and Audit Committee regular updates on the adequacy of our risk management process Annual – Risk AssessmentLow/Medi
Slide 22: Net Interest Income Sensitivity Trends
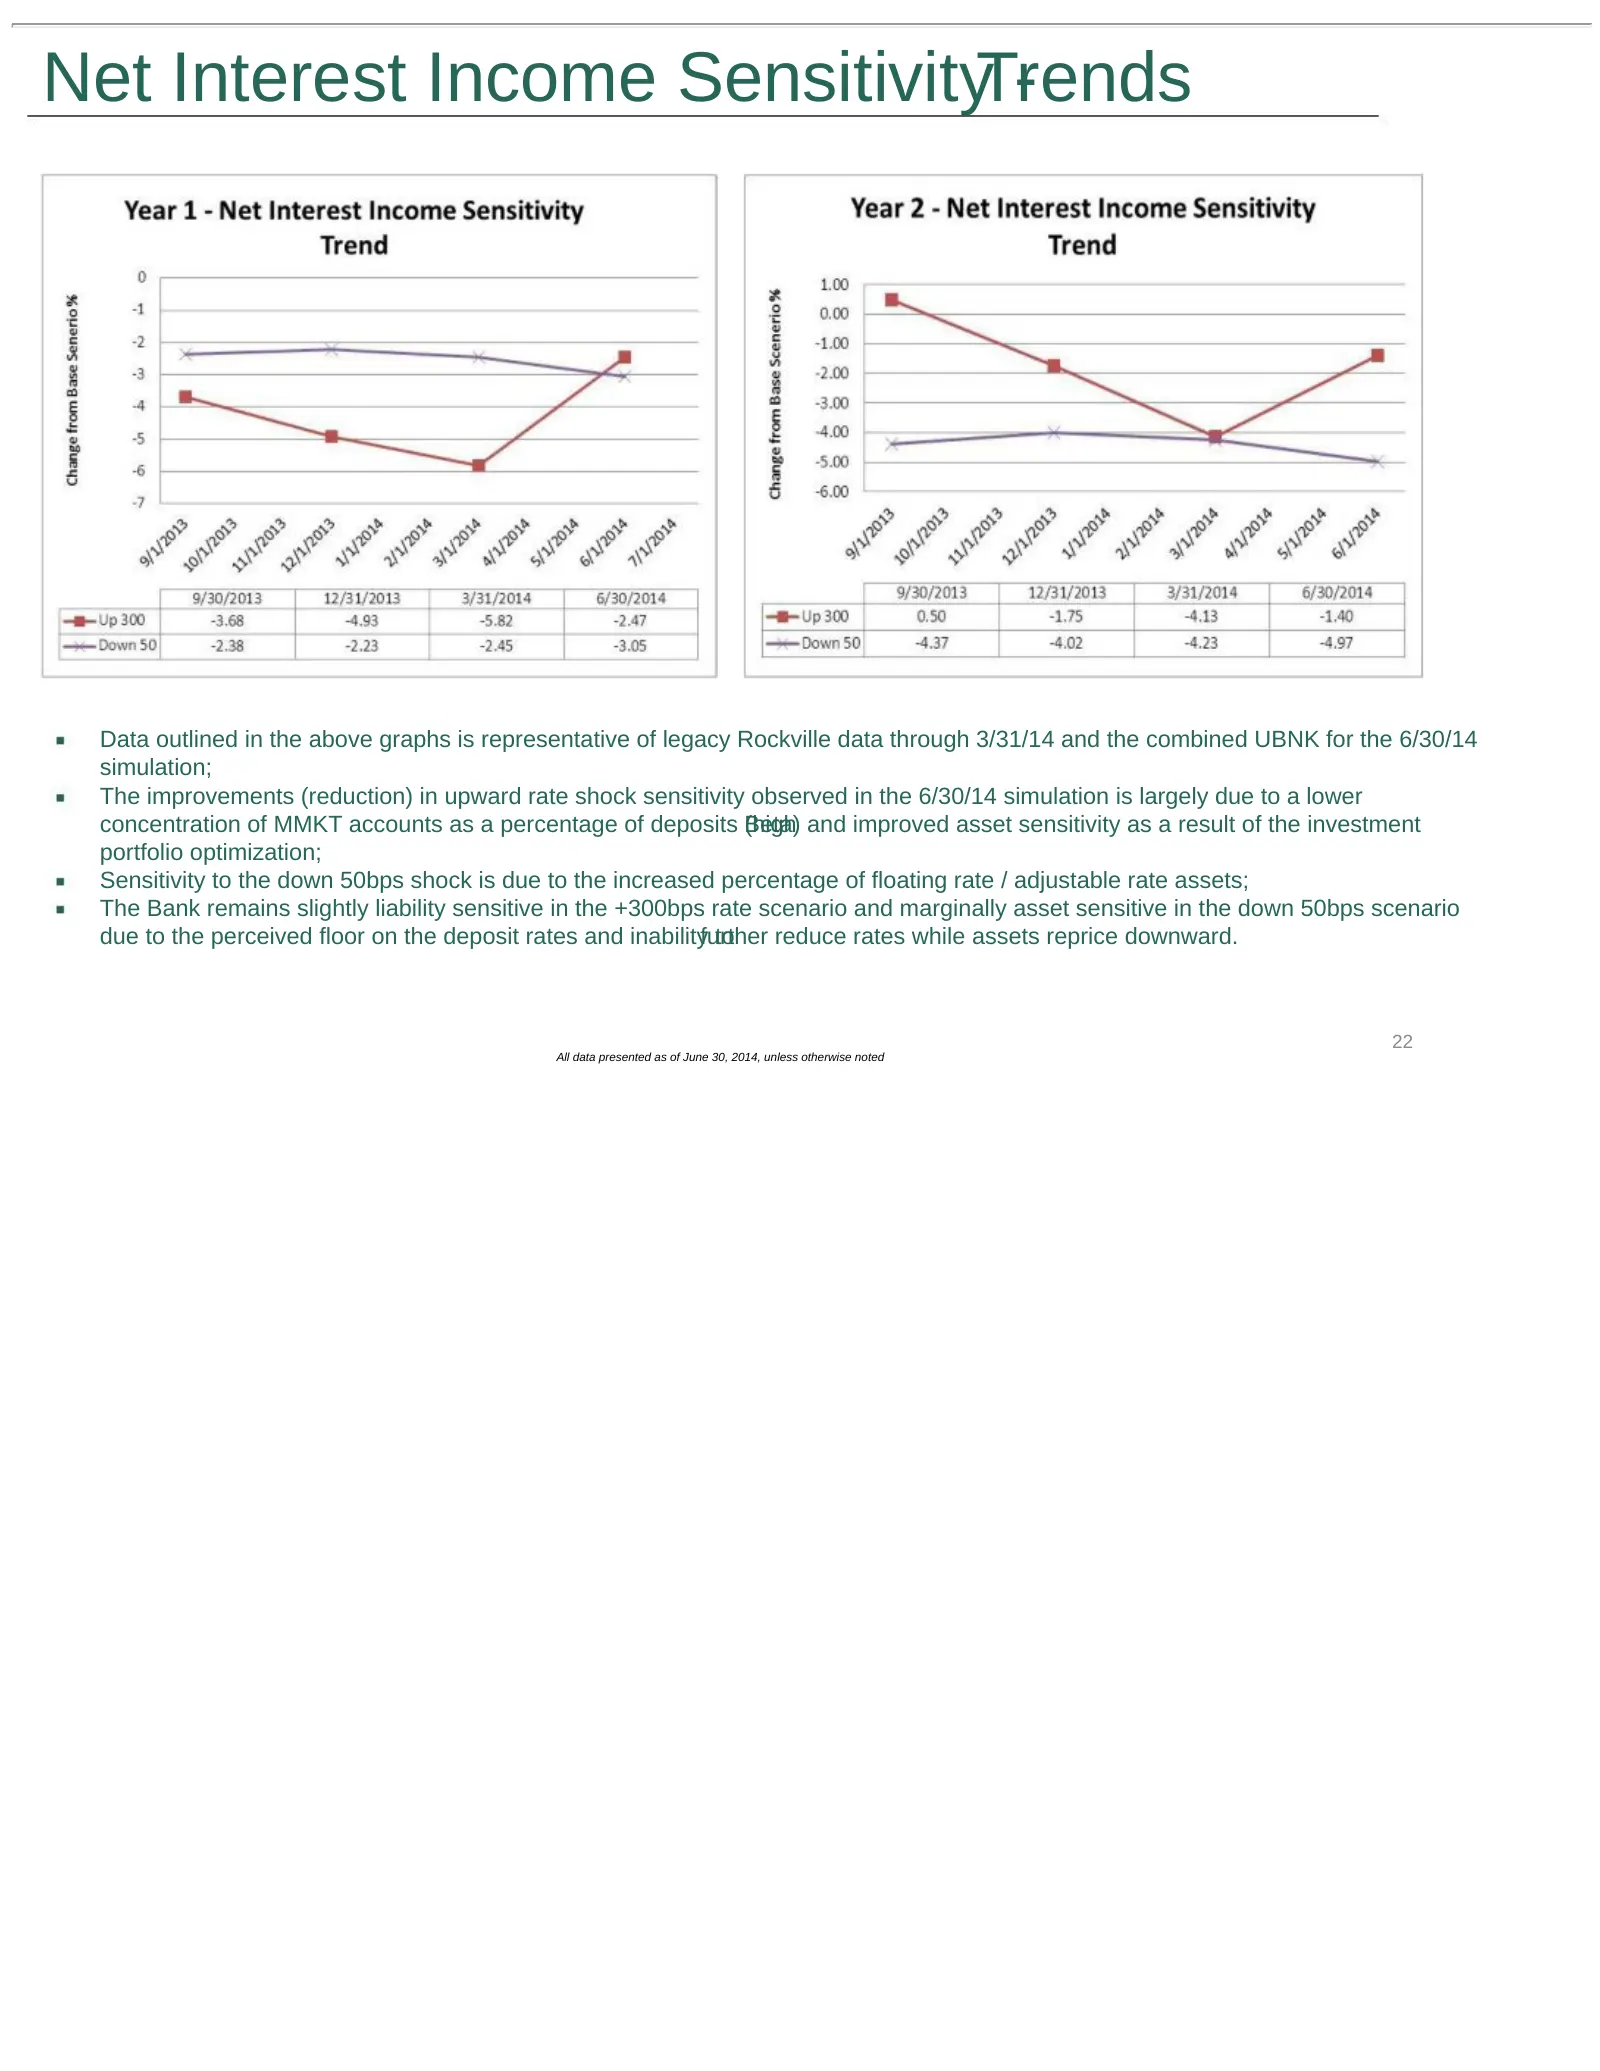
Net Interest Income SensitivityTrends - Data outlined in the above graphs is representative of legacy Rockville data through 3/31/14 and the combined UBNK for the 6/30/14 simulation; The improvements (reduction) in upward rate shock sensitivity observed in the 6/30/14 simulation is largely due to a
Slide 23: Holding Company Liquidity
Holding Company Liquidity As of June 30, 2014, UBNK had $30.4 million of operating cash available at the holding company; With the only debt facility at the HOLDCO consisting of a $7.73 million of junior subordinated debt, with a maturity date of March 15, 2036 (redeemable at PAR after 2011), the Co
Slide 24: Summary
Summary Recent merger of equals creating a leading community bank franchise in Hartford, CT – Springfield, MA market, western New England's largest metro area Merger created a larger scale business model that allows the experienced management team to focus on maximizing organizational performance, l

Slide 25: Appendix
Appendix
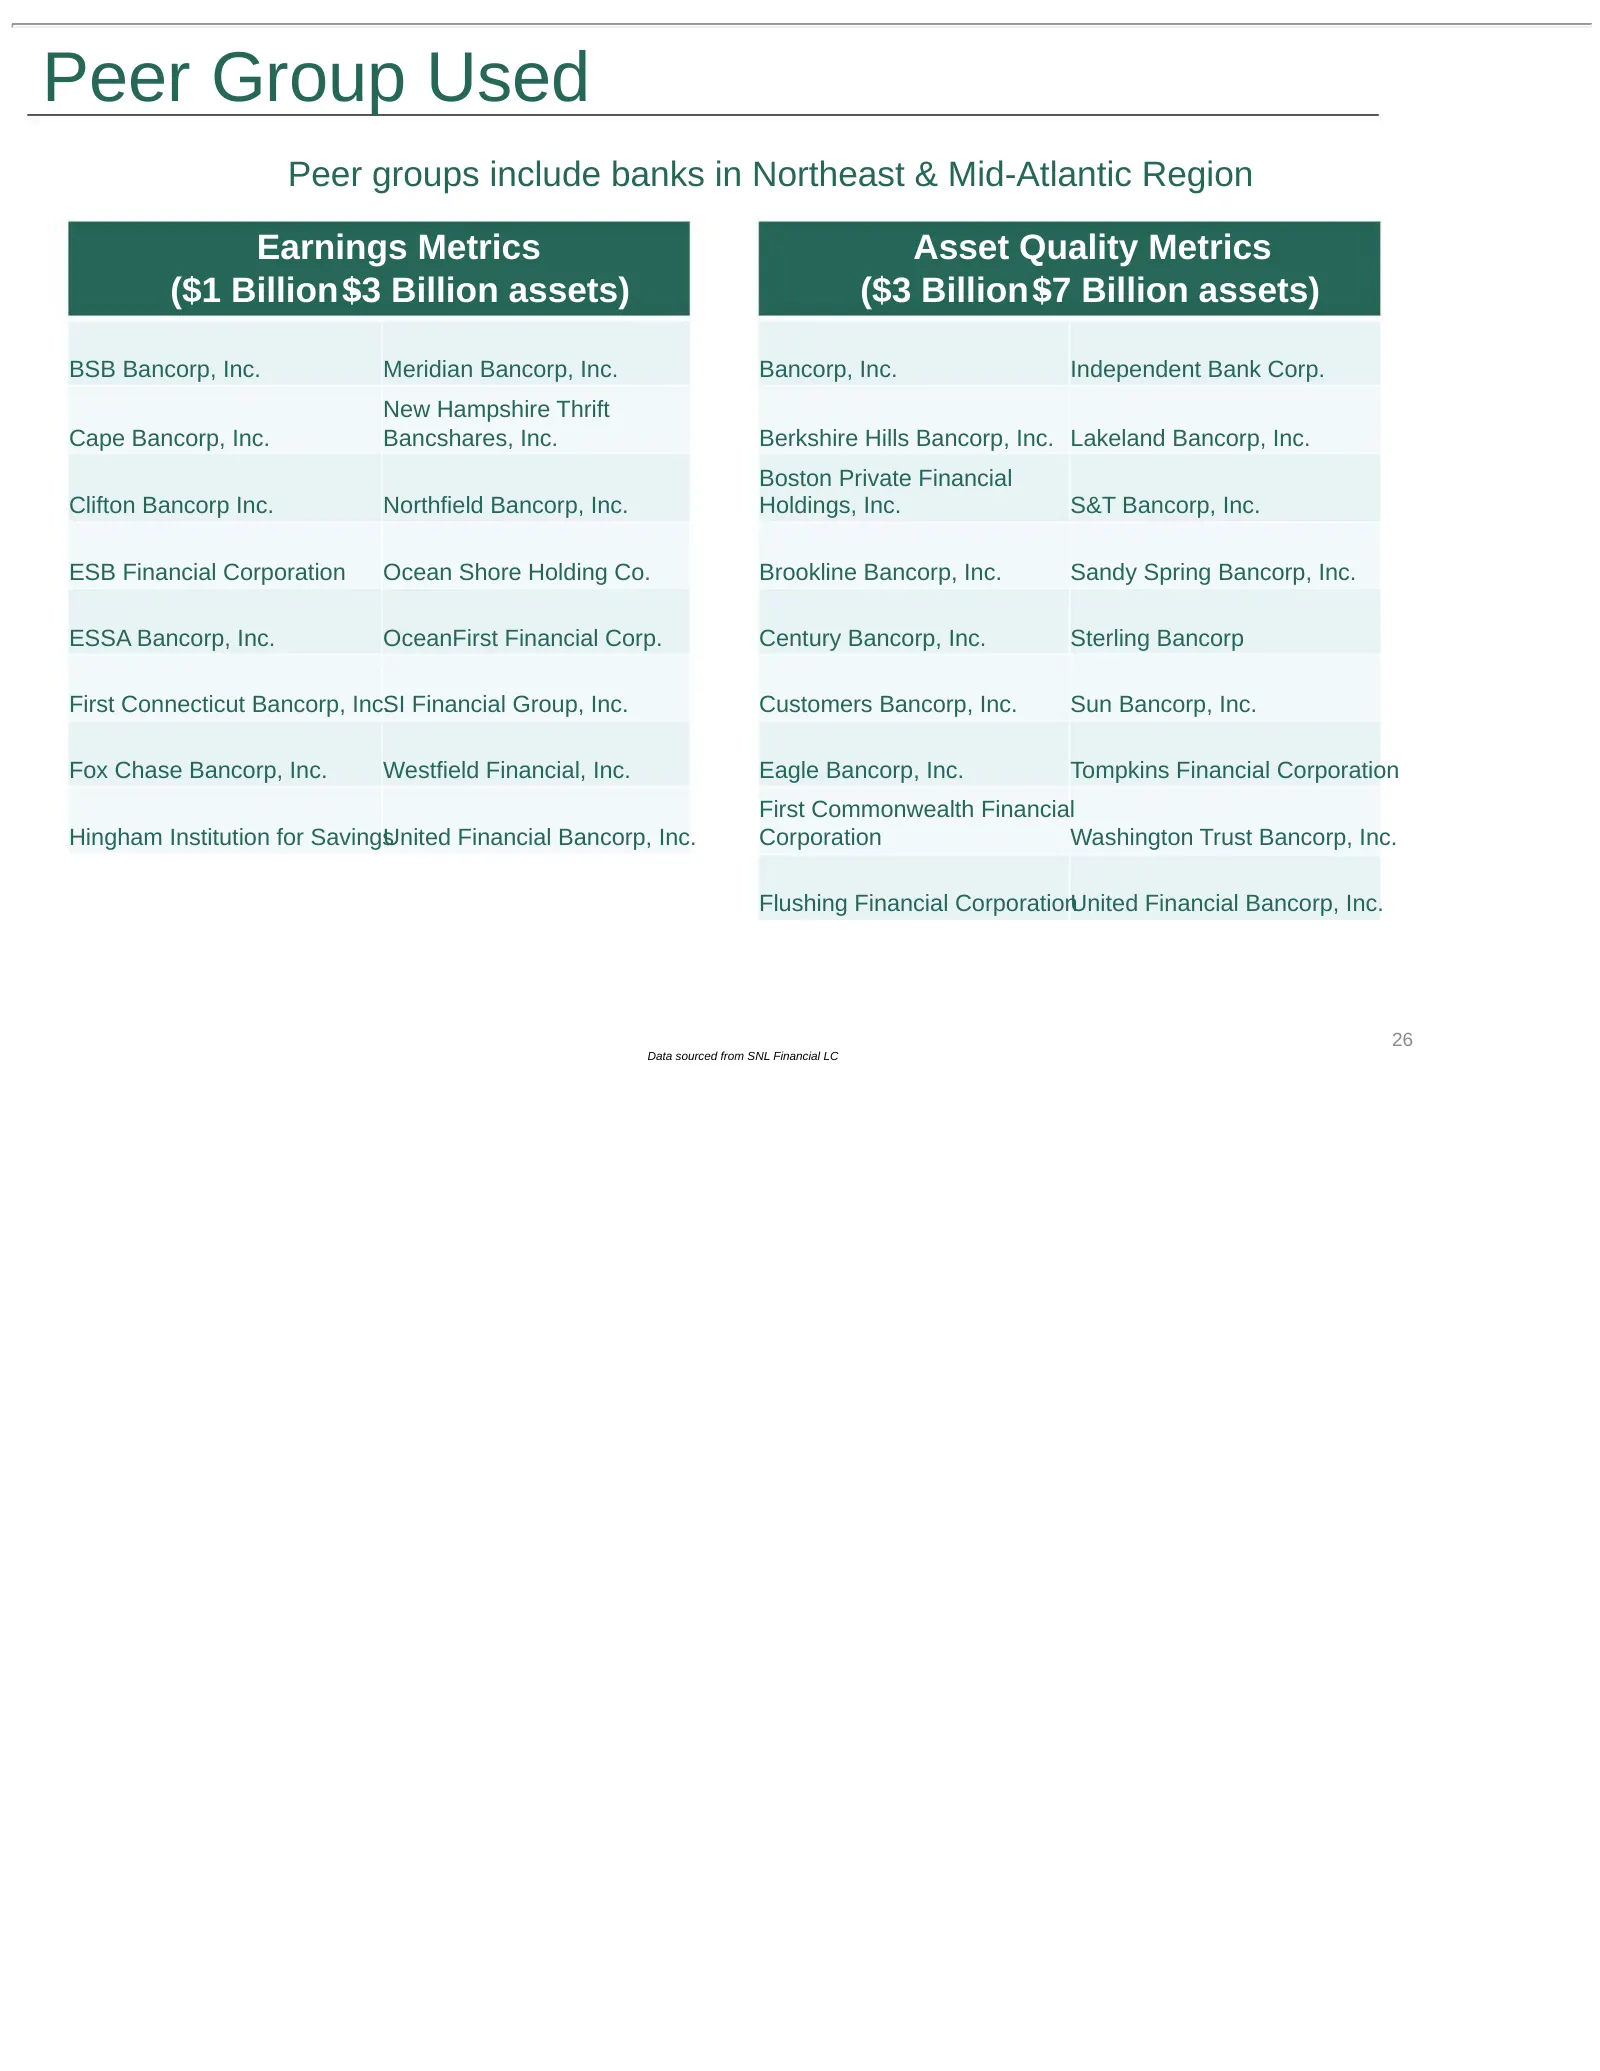
Slide 26: Peer Group Used
Peer Group Used Peer groups include banks in Northeast & Mid-Atlantic Region Earnings Metrics Asset Quality Metrics ($1 Billion $3 - Billion assets) ($3 Billion $7 - Billion assets) BSB Bancorp, Inc. Meridian Bancorp, Inc. Bancorp, Inc. Independent Bank Corp. New Hampshire Thrift Cape Bancorp, Inc.
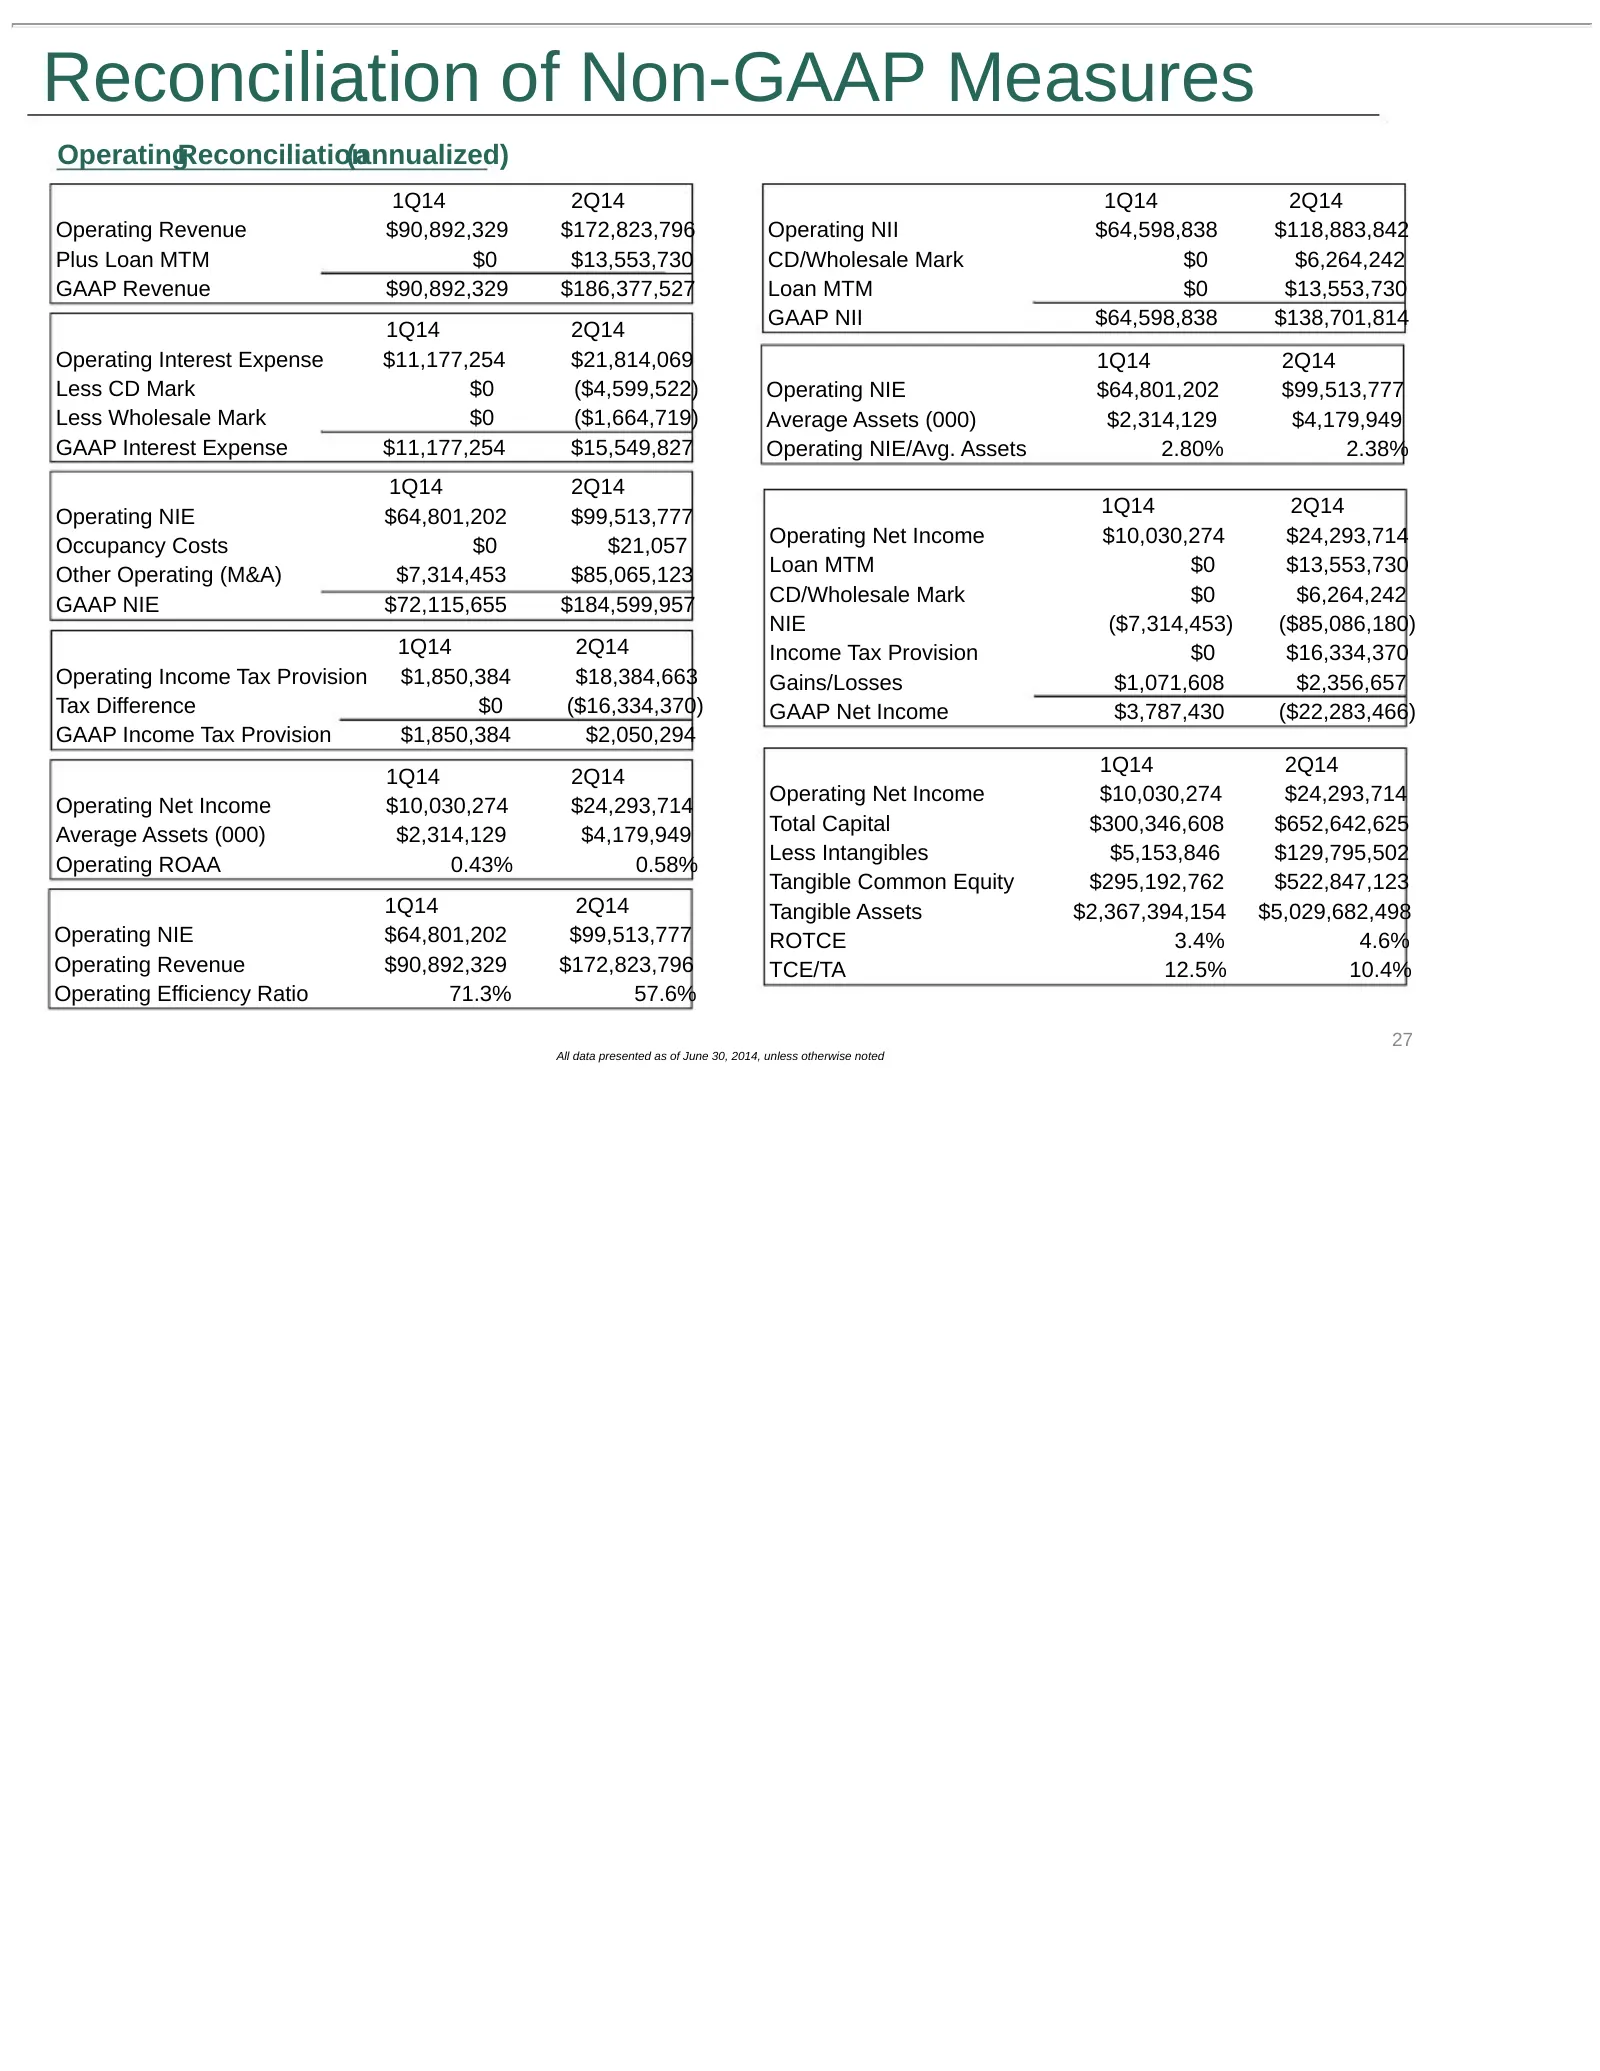
Slide 27: Reconciliation of Non-GAAP Measures
Reconciliation of Non-GAAP Measures OperatingReconciliation (annualized) 1Q14 2Q14 1Q14 2Q14 Operating Revenue $90,892,329 $172,823,796 Operating NII $64,598,838 $118,883,842 Plus Loan MTM $0 $13,553,730 CD/Wholesale Mark $0 $6,264,242 GAAP Revenue $90,892,329 $186,377,527 Loan MTM $0 $13,553,730 GA
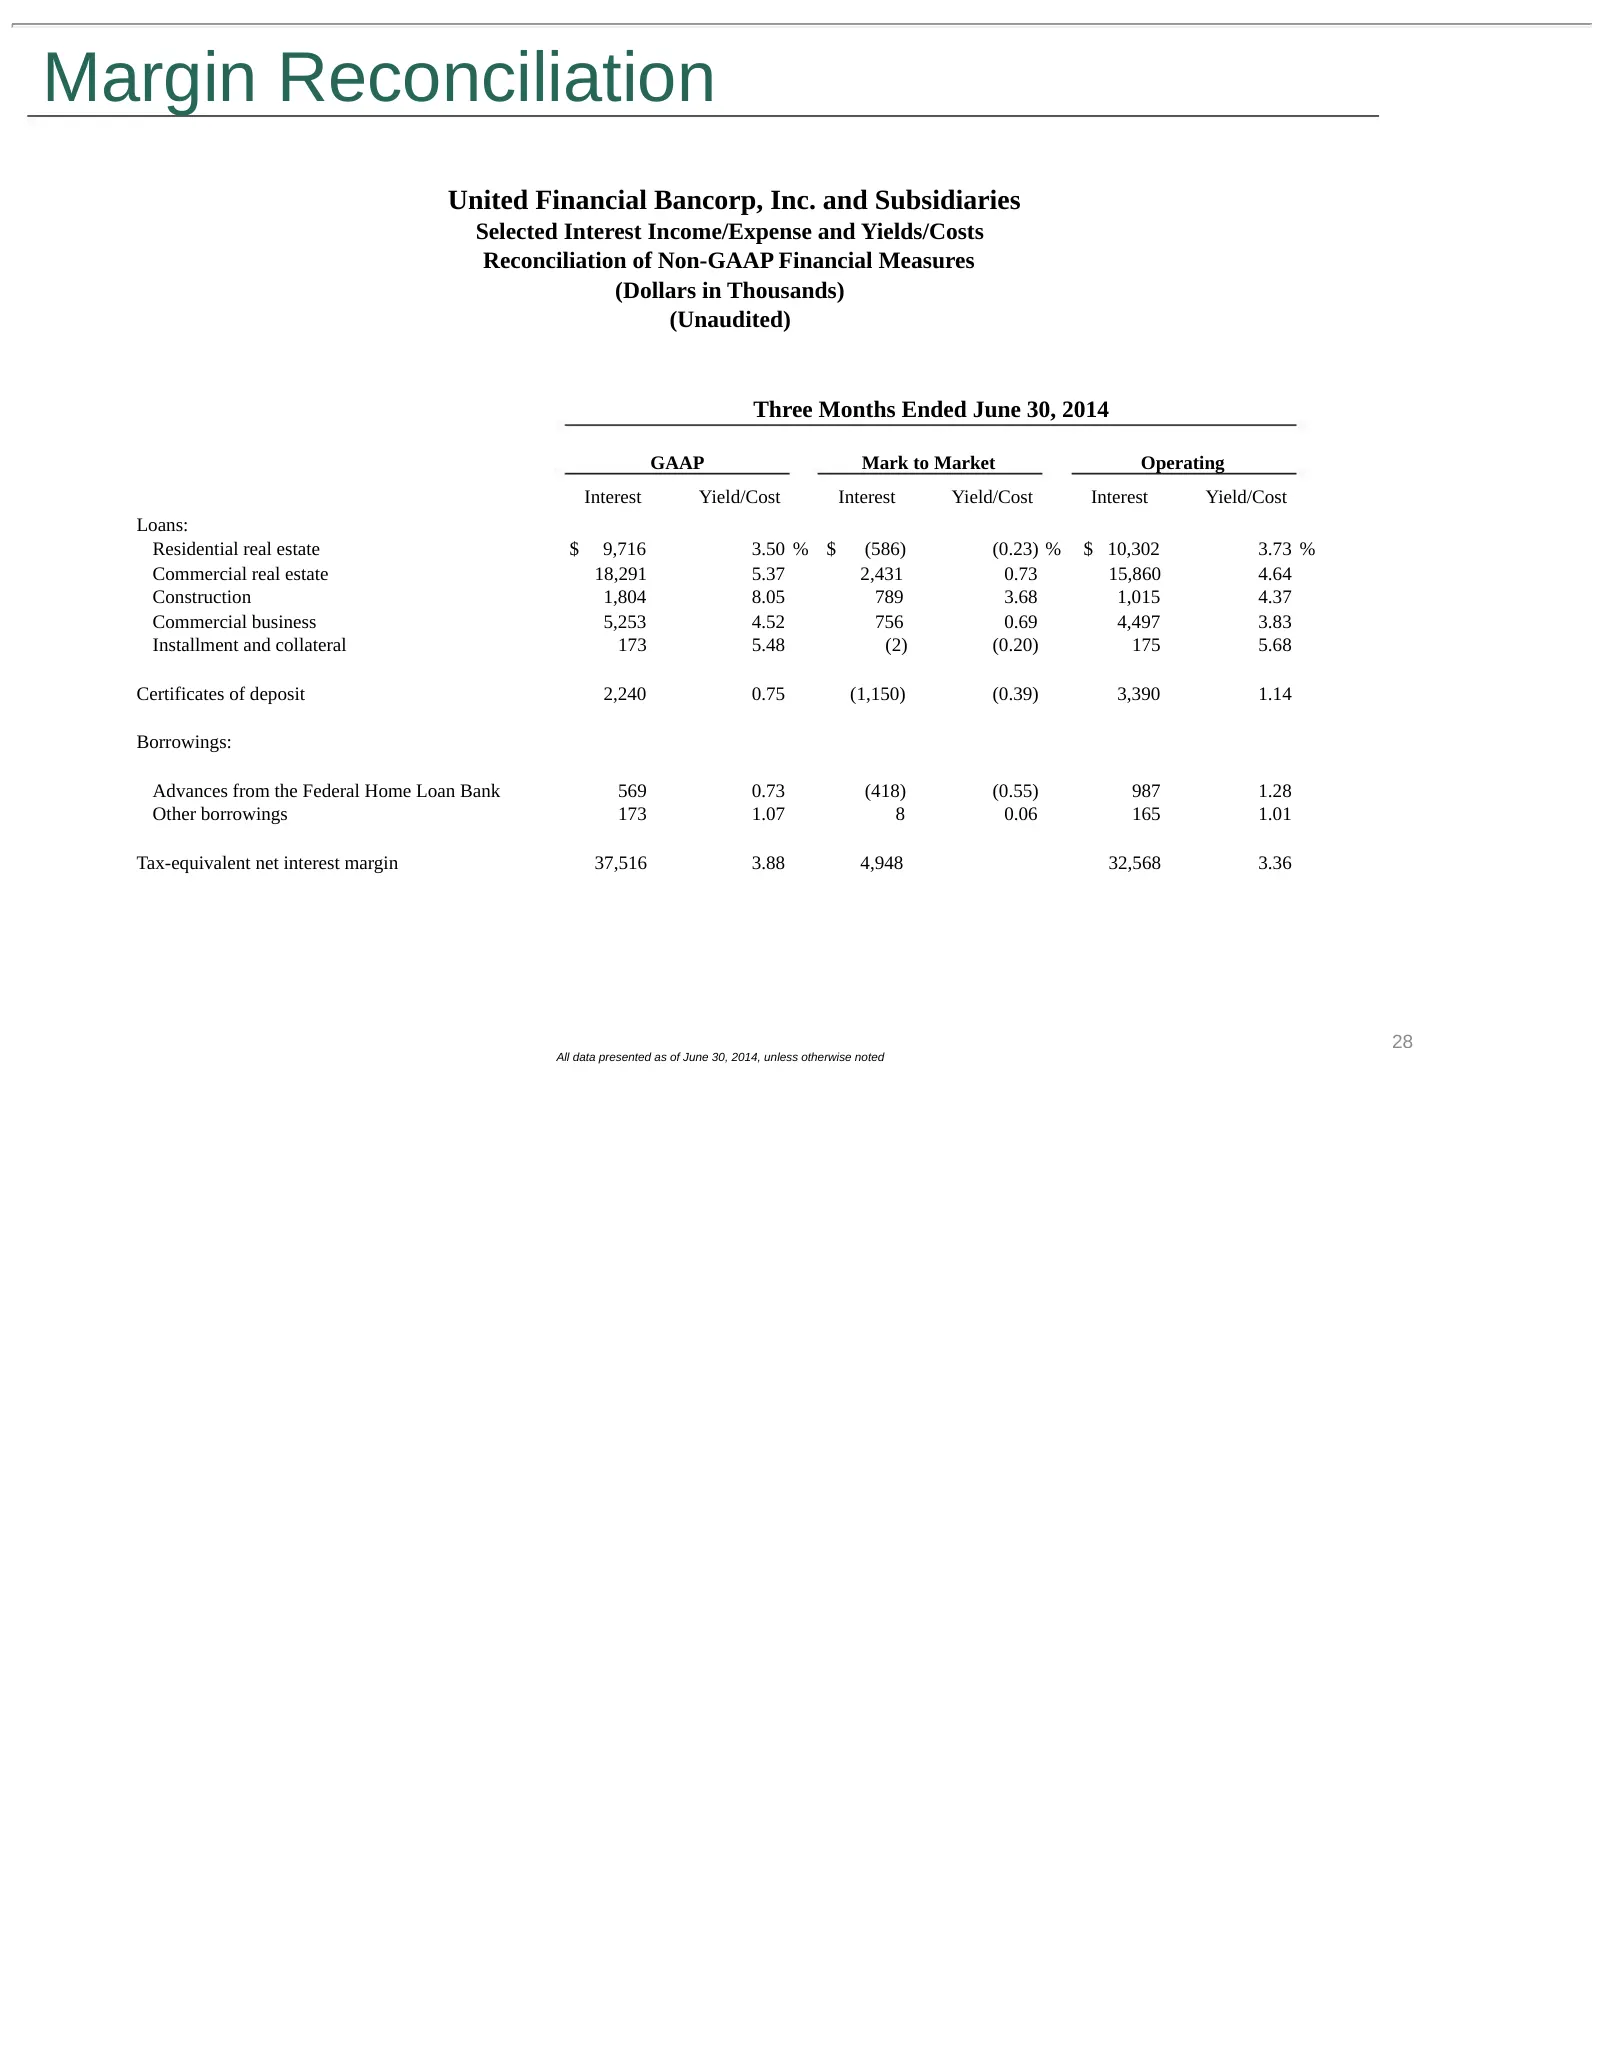
Slide 28: Margin Reconciliation
Margin Reconciliation United Financial Bancorp, Inc. and Subsidiaries Selected Interest Income/Expense and Yields/Costs Reconciliation of Non-GAAP Financial Measures (Dollars in Thousands) (Unaudited) Three Months Ended June 30, 2014 GAAP Mark to Market Operating Interest Yield/Cost Interest Yield/C
Source: SEC EDGAR · FWP filed Sep 17, 2014
More decks from United Financial Bancorp Inc
 Merger or Acquisition (July 2019)10 slides · Jul 15, 2019
 Shareholder Meeting (May 2019)14 slides · May 13, 2019
 Q1 2019 Earnings Presentation27 slides · Apr 16, 2019
 Q4 2018 Earnings Presentation26 slides · Jan 22, 2019
 Q3 2018 Earnings Presentation25 slides · Oct 16, 2018
 Q2 2018 Earnings Presentation25 slides · Jul 17, 2018