Altra Industrial Motion — Q1 2021 Earnings Presentation
17 slides from Altra Industrial Motion's earnings presentation, Apr 29, 2021
Slide 1: First Quarter 2021 Results
First Quarter 2021 Results April 29, 2021 1 Exhibit 99.2
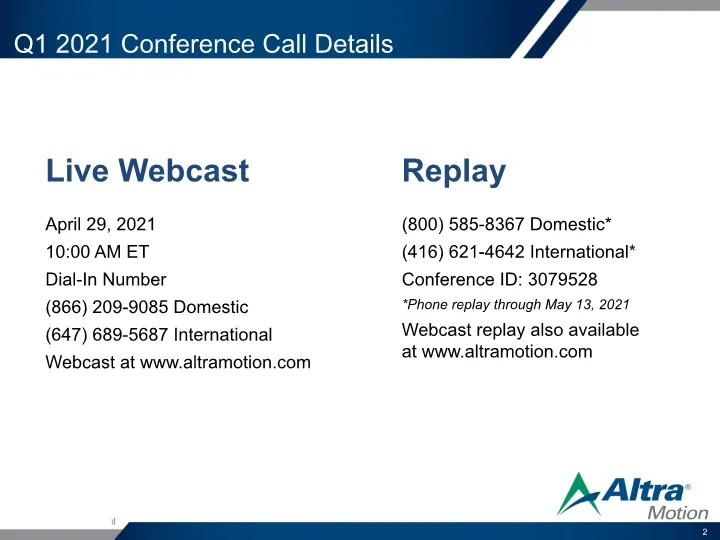
Slide 2: Q1 2021 Conference Call Details
2 Q1 2021 Conference Call Details Live Webcast April 29, 2021 10:00 AM ET Dial-In Number (866) 209-9085 Domestic (647) 689-5687 International Webcast at www.altramotion.com Replay (800) 585-8367 Domestic* (416) 621-4642 International* Conference ID: 3079528 *Phone replay through May 13, 2021 Webcast
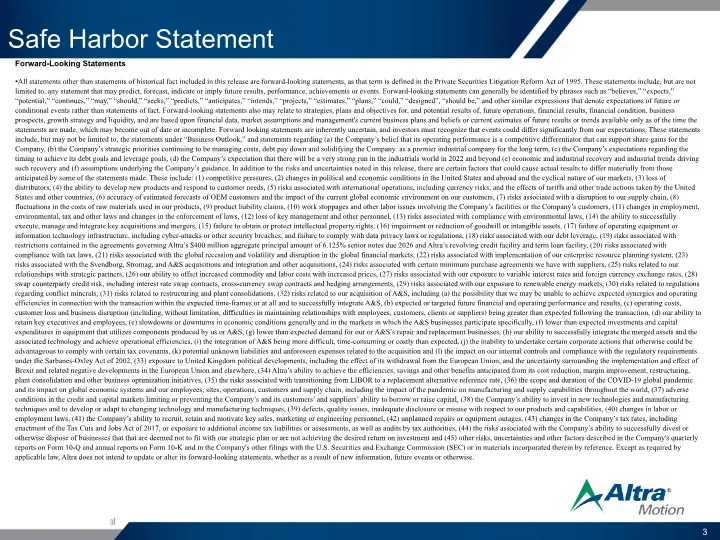
Slide 3: Safe Harbor Statement
Safe Harbor Statement Forward-Looking Statements All statements other than statements of historical fact included in this release are forward-looking statements, as that term is defined in the Private Securities Litigation Reform Act of 1995. These statements include, but are not limited to, any sta

Slide 4: Agenda and Speakers
Agenda and Speakers Executive Overview Market Review Q1 2021 Financial Review, 2021 Guidance Concluding Remarks Q&A Carl Christenson Chairman & Chief Executive Officer Christian Storch Executive Vice President & Chief Financial Officer 4
Slide 5: Q1 2021 CEO Executive Summary
Q1 2021 CEO EXECUTIVE SUMMARY An Economic Recovery is Starting to Take Hold Economic recovery spreading across more business segments Altra well-positioned to capitalize on strong secular tailwinds Bookings momentum continuing to build across early-cycle markets Emerging ramp-up in orders for later
Slide 6: Q1 2021 Performance Highlights
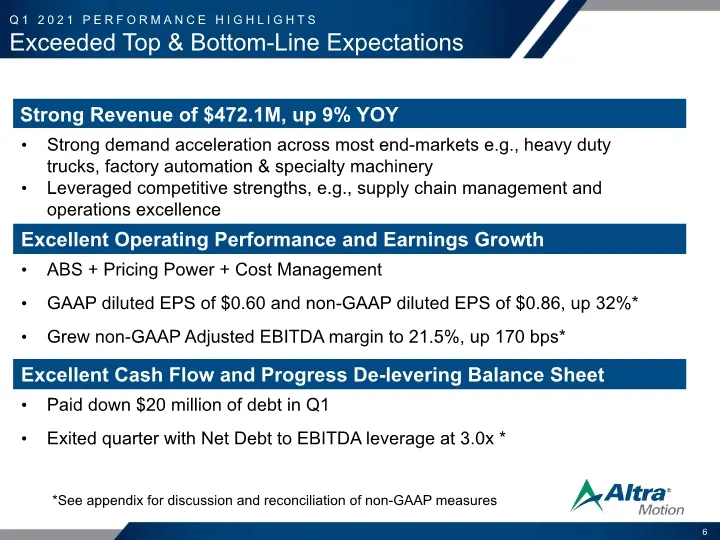
Q1 2021 PERFORMANCE HIGHLIGHTS Exceeded Top & Bottom-Line Expectations *See appendix for discussion and reconciliation of non-GAAP measures 6 Strong Revenue of $472.1M, up 9% YOY Strong demand acceleration across most end-markets e.g., heavy duty trucks, factory automation & specialty machinery Leve
Slide 7: Advancing Strategies to Drive Shareholder Value
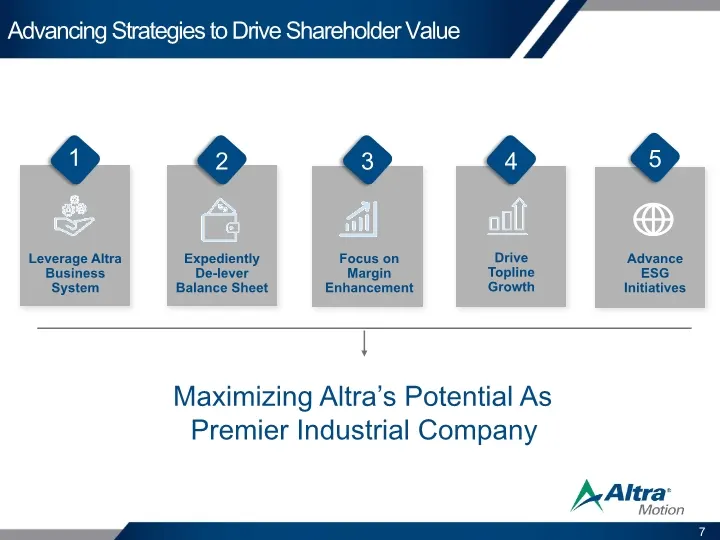
7 Advancing Strategies to Drive Shareholder Value Focus on Margin Enhancement 3 Leverage Altra Business System 1 Expediently De-lever Balance Sheet 2 Drive Topline Growth 4 Maximizing Altra’s Potential As Premier Industrial Company Advance ESG Initiatives 5
Slide 8: Broad Economic Recovery, Strong Tailwinds
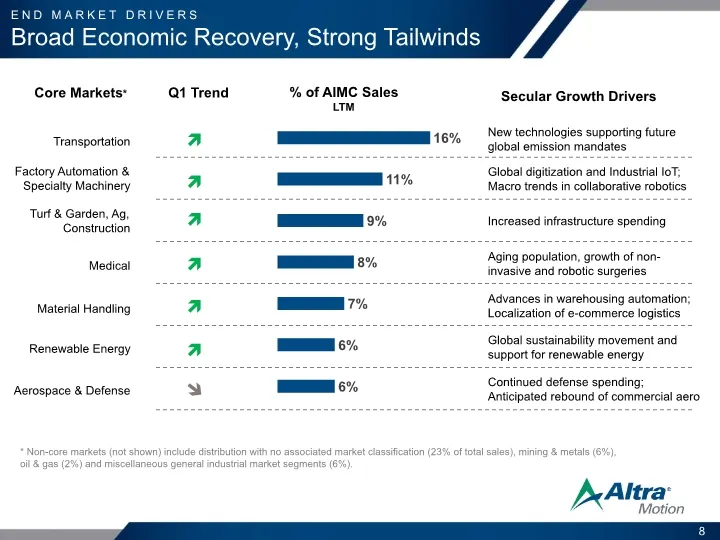
8 * Non-core markets (not shown) include distribution with no associated market classification (23% of total sales), mining & metals (6%), oil & gas (2%) and miscellaneous general industrial market segments (6%). Global digitization and Industrial IoT; Macro trends in collaborative robotics Increase
Slide 9: Q1 2021 Financial Highlights
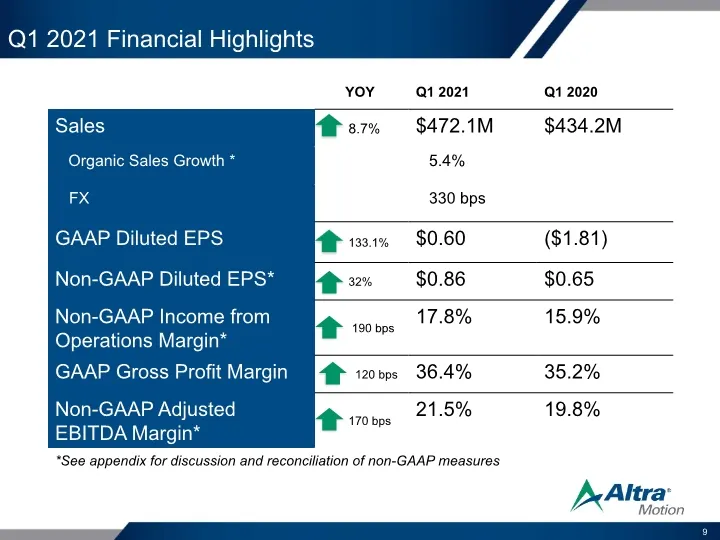
Q1 2021 Financial Highlights *See appendix for discussion and reconciliation of non-GAAP measures 9 YOY Q1 2021 Q1 2020 Sales 8.7% $472.1M $434.2M Organic Sales Growth * 5.4% FX 330 bps GAAP Diluted EPS 133.1% $0.60 ($1.81) Non-GAAP Diluted EPS* 32% $0.86 $0.65 Non-GAAP Income from Operations Margin
Slide 10: Balance Sheet Highlights
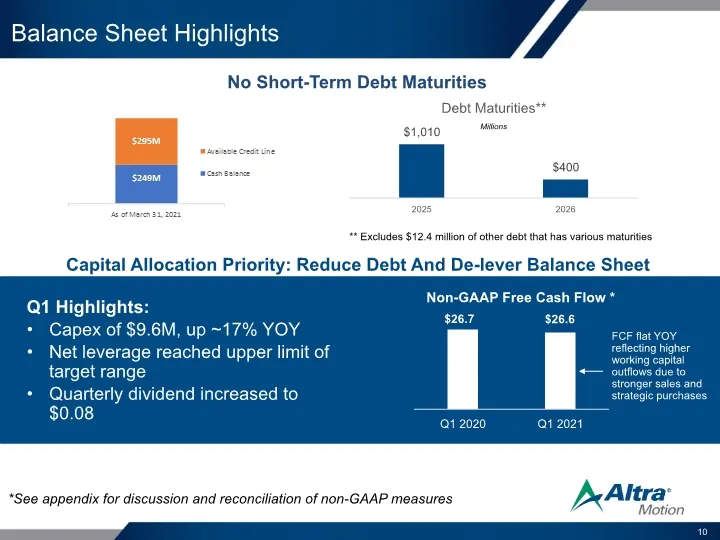
Balance Sheet Highlights 10 Capital Allocation Priority: Reduce Debt And De-lever Balance Sheet No Short-Term Debt Maturities ** Excludes $12.4 million of other debt that has various maturities Millions Q1 Highlights: Capex of $9.6M, up ~17% YOY Net leverage reached upper limit of target range Quart
Slide 11: 2021 Guidance – Provided 4/29/2021
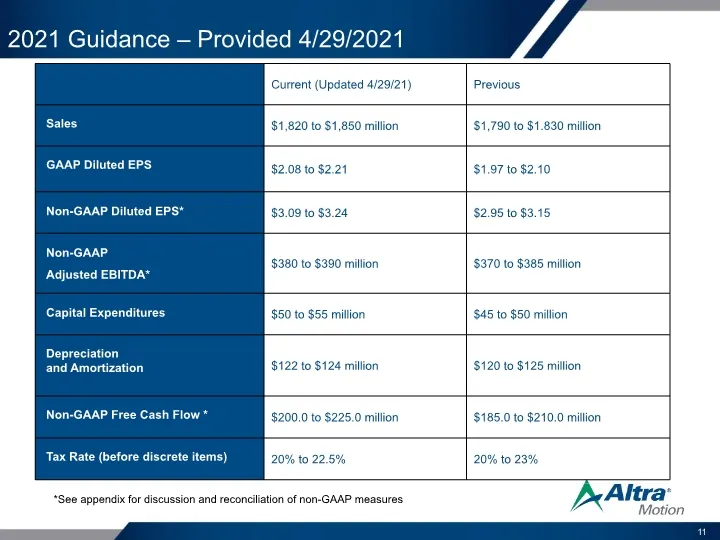
2021 Guidance – Provided 4/29/2021 *See appendix for discussion and reconciliation of non-GAAP measures 11 Current (Updated 4/29/21) Previous Sales $1,820 to $1,850 million $1,790 to $1.830 million GAAP Diluted EPS $2.08 to $2.21 $1.97 to $2.10 Non-GAAP Diluted EPS* $3.09 to $3.24 $2.95 to $3.15 Non
Slide 12: Optimistic for Altra's Future – Long Runway Ahead
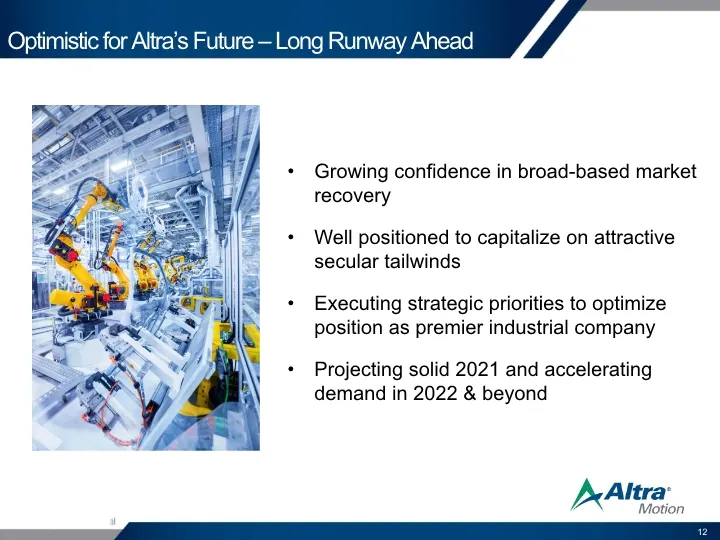
Optimistic for Altra’s Future – Long Runway Ahead Growing confidence in broad-based market recovery Well positioned to capitalize on attractive secular tailwinds Executing strategic priorities to optimize position as premier industrial company Projecting solid 2021 and accelerating demand in 2022 &
Slide 13: Discussion of Non-GAAP Measures
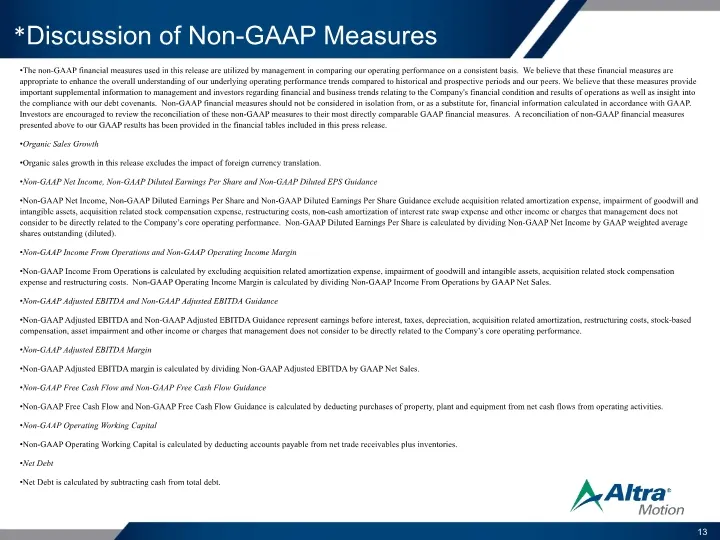
*Discussion of Non-GAAP Measures The non-GAAP financial measures used in this release are utilized by management in comparing our operating performance on a consistent basis. We believe that these financial measures are appropriate to enhance the overall understanding of our underlying operating per
Slide 14: Reconciliation of Non-GAAP Net Income
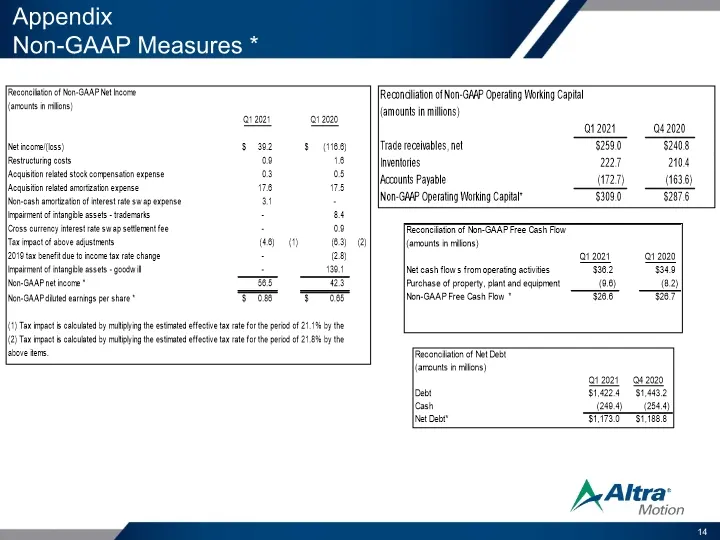
Appendix Non-GAAP Measures * 14 Reconciliation of Non-GAAP Net Income (amounts in millions) Q1 2021 Q1 2020 Net income/(loss) $ 39.2 $ (116.6) Restructuring costs 0.9 1.6 Acquisition related stock compensation expense 0.3 0.5 Acquisition related amortization expense 17.6 17.5 Non-cash amortization o
Slide 15: Reconciliation of Non-GAAP Income from Operations by Segment
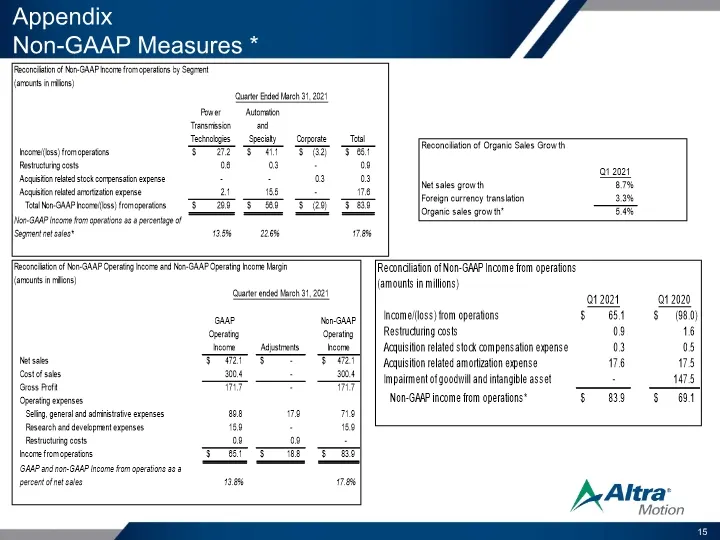
Appendix Non-GAAP Measures * 15 Reconciliation of Non-GAAP Income from operations by Segment (amounts in millions) Quarter Ended March 31, 2021 Power Transmission Technologies Automation and Specialty Corporate Total Income/(loss) from operations $ 27.2 $ 41.1 $ (3.2) $ 65.1 Restructuring costs 0.6
Slide 16: Reconciliation of 2021 Non-GAAP Guidance
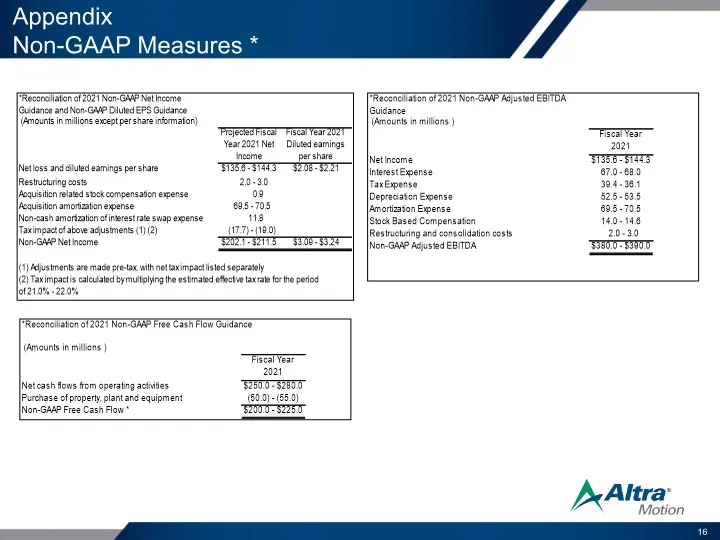
Appendix Non-GAAP Measures * 16 *Reconciliation of 2021 Non-GAAP Net Income Guidance and Non-GAAP Diluted EPS Guidance (Amounts in millions except per share information) Projected Fiscal Year 2021 Net Income Fiscal Year 2021 Diluted earnings per share Net loss and diluted earnings per share $135.6 -
Slide 17: Non-GAAP Adjusted EBITDA Reconciliation
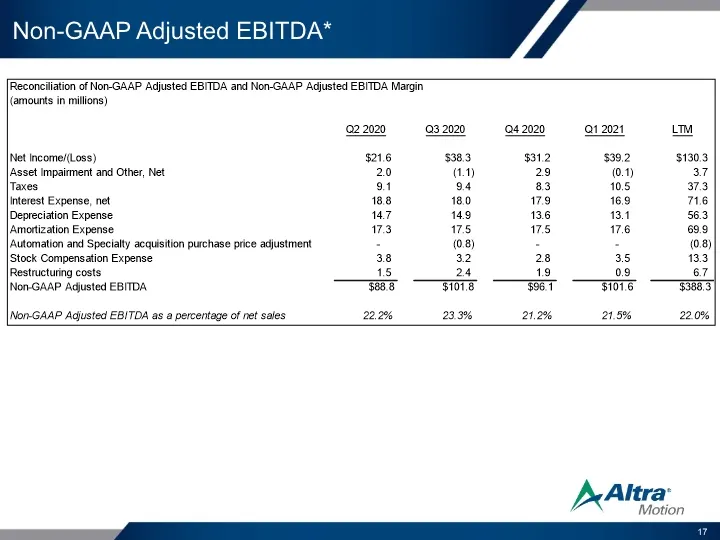
Non-GAAP Adjusted EBITDA* 17 Reconciliation of Non-GAAP Adjusted EBITDA and Non-GAAP Adjusted EBITDA Margin (amounts in millions) Q2 2020 Q3 2020 Q4 2020 Q1 2021 LTM Net Income/(Loss) $21.6 $38.3 $31.2 $39.2 $130.3 Asset Impairment and Other, Net 2.0 (1.1) 2.9 (0.1) 3.7 Taxes 9.1 9.4 8.3 10.5 37.3 I
Source: SEC EDGAR · 8-K filed Apr 29, 2021
More decks from Altra Industrial Motion Corp
 Q2 2022 Earnings Presentation25 slides · Jul 28, 2022
 Q1 2022 Earnings Presentation25 slides · Apr 28, 2022
 Investor Day (March 2022)135 slides · Mar 11, 2022
 Q4 2021 Earnings Presentation17 slides · Feb 16, 2022
 Q3 2021 Earnings Presentation16 slides · Oct 22, 2021
 Q2 2021 Earnings Presentation16 slides · Jul 23, 2021