State Bank Financial Corporation
State Bank Financial — 2016 FIG Partners West Coast CEO Forum
15 slides from State Bank Financial's conference presentation, Feb 3, 2016

Slide 1: State Bank Financial Corporation 2016 FIG Partners West Coast CEO Forum
State Bank Financial Corporation 2016 FIG Partners West Coast CEO Forum February 2016
Slide 2: Cautionary Note Regarding Forward-Looking Statements
2 Cautionary Note Regarding Forward-Looking Statements Certain statements contained in this presentation that are not statements of historical fact are forward-looking statements. These forward-looking statements, which are based on certain assumptions and describe our future plans, strategies and e
Slide 3: State Bank Financial Corp. Profile
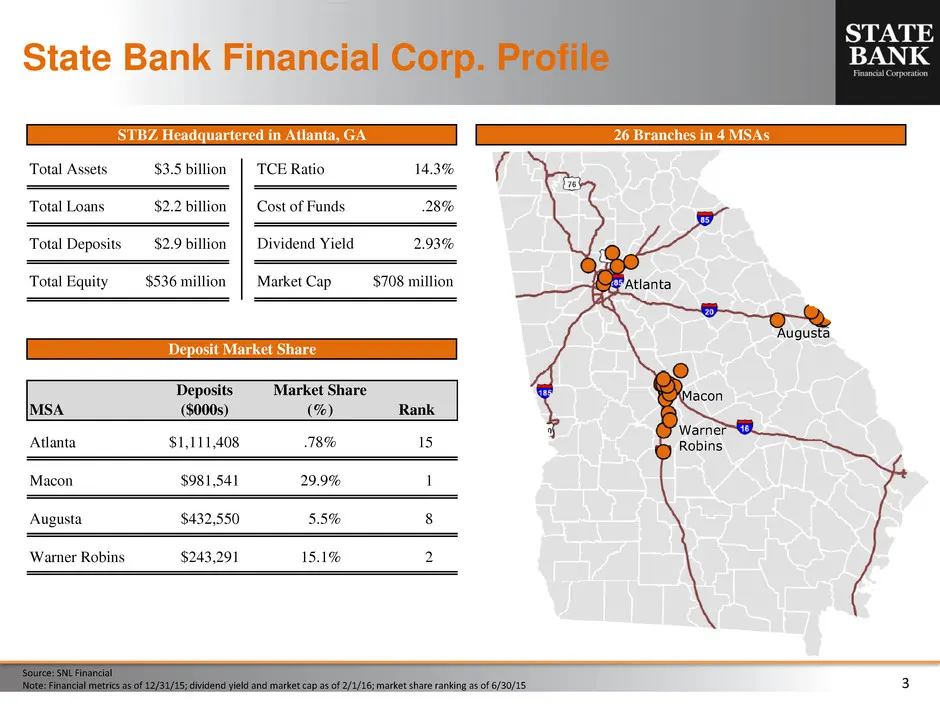
3 State Bank Financial Corp. Profile Source: SNL Financial Note: Financial metrics as of 12/31/15; dividend yield and market cap as of 2/1/16; market share ranking as of 6/30/15 Atlanta Macon Warner Robins Augusta STBZ Headquartered in Atlanta, GA Deposit Market Share 26 Branches in 4 MSAs Total Ass
Slide 4: State Bank Financial Corp. Highlights
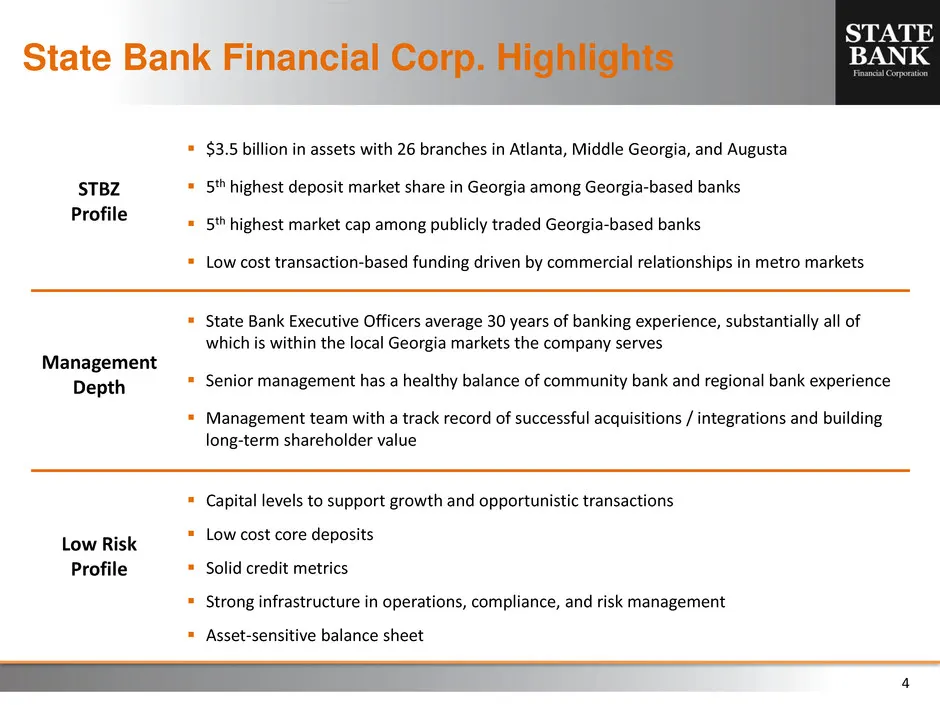
4 State Bank Financial Corp. Highlights STBZ Profile $3.5 billion in assets with 26 branches in Atlanta, Middle Georgia, and Augusta 5th highest deposit market share in Georgia among Georgia-based banks 5th highest market cap among publicly traded Georgia-based banks Low cost transaction-bas
Slide 5: Acquisition History
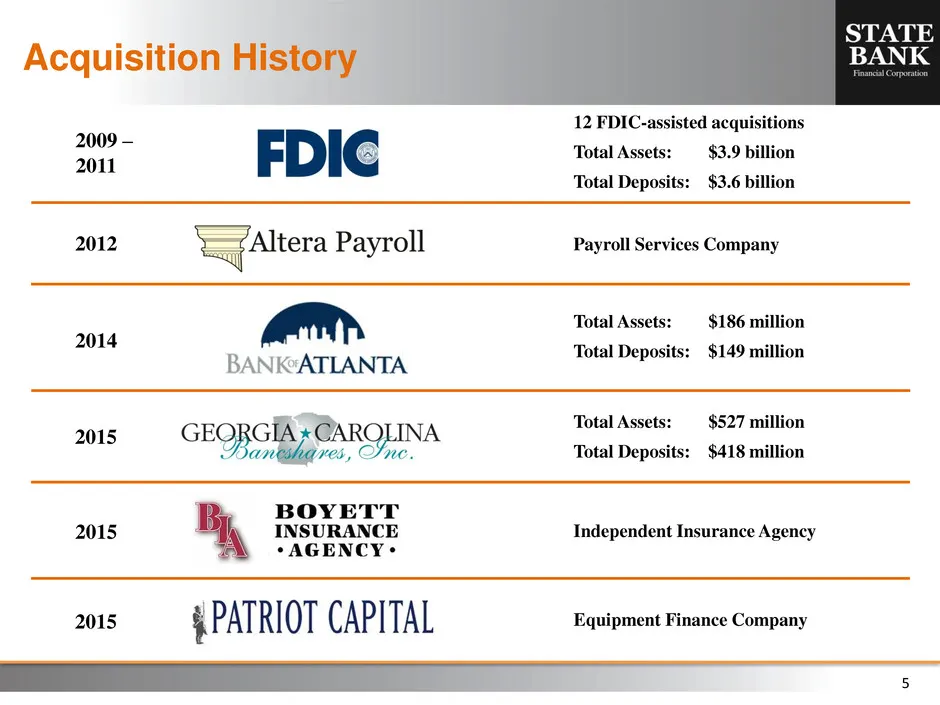
5 Acquisition History 2009 – 2011 2012 2014 2015 2015 12 FDIC-assisted acquisitions Total Assets: $3.9 billion Total Deposits: $3.6 billion Total Assets: $186 million Total Deposits: $149 million Total Assets: $527 million Total Deposits: $418 million Payroll Services Company Independent Insurance A
Slide 6: Deposit Market Share
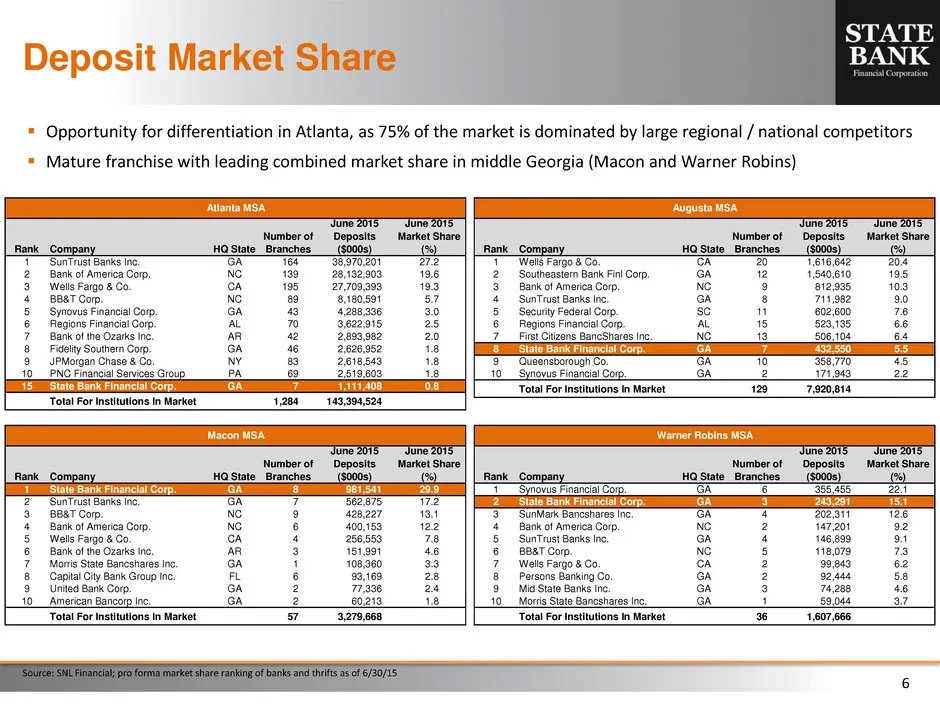
6 Source: SNL Financial; pro forma market share ranking of banks and thrifts as of 6/30/15 Deposit Market Share Opportunity for differentiation in Atlanta, as 75% of the market is dominated by large regional / national competitors Mature franchise with leading combined market share in middle Geo
Slide 7: Market Contribution
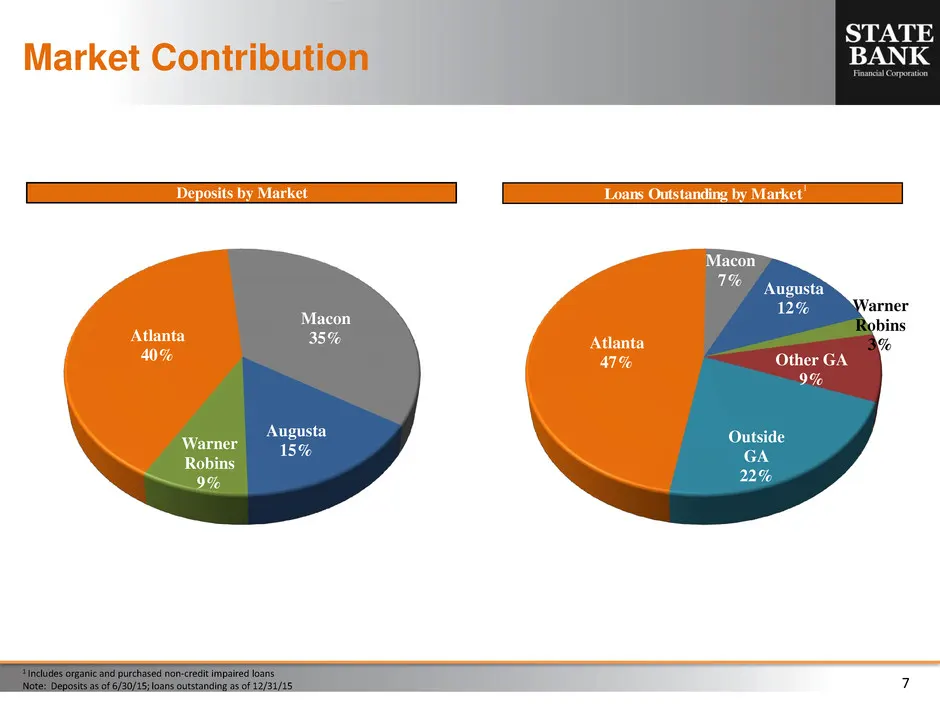
7 Market Contribution Deposits by Market 1 Includes organic and purchased non-credit impaired loans Note: Deposits as of 6/30/15; loans outstanding as of 12/31/15 Loans Outstanding by Market 1 Atlanta 40% Macon 35% Augusta 15% Warner Robins 9% Atlanta 47% Macon 7% Augusta 12% Warner Robins 3% Other
Slide 8: 2015 Highlights
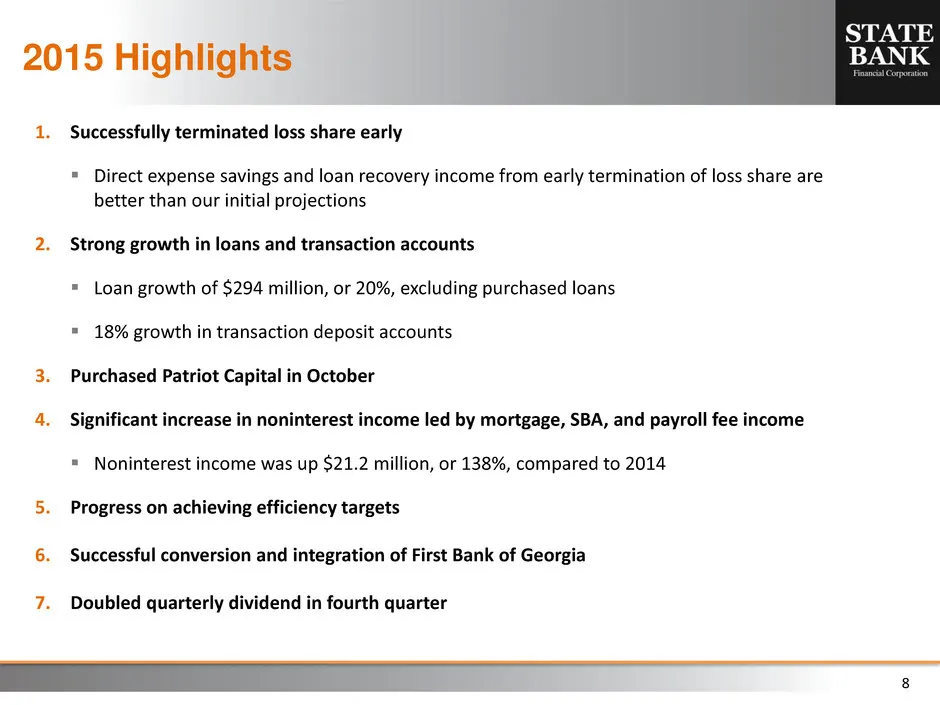
8 2015 Highlights 1. Successfully terminated loss share early Direct expense savings and loan recovery income from early termination of loss share are better than our initial projections 2. Strong growth in loans and transaction accounts Loan growth of $294 million, or 20%, excluding purchased l
Slide 9: Income Statement Highlights
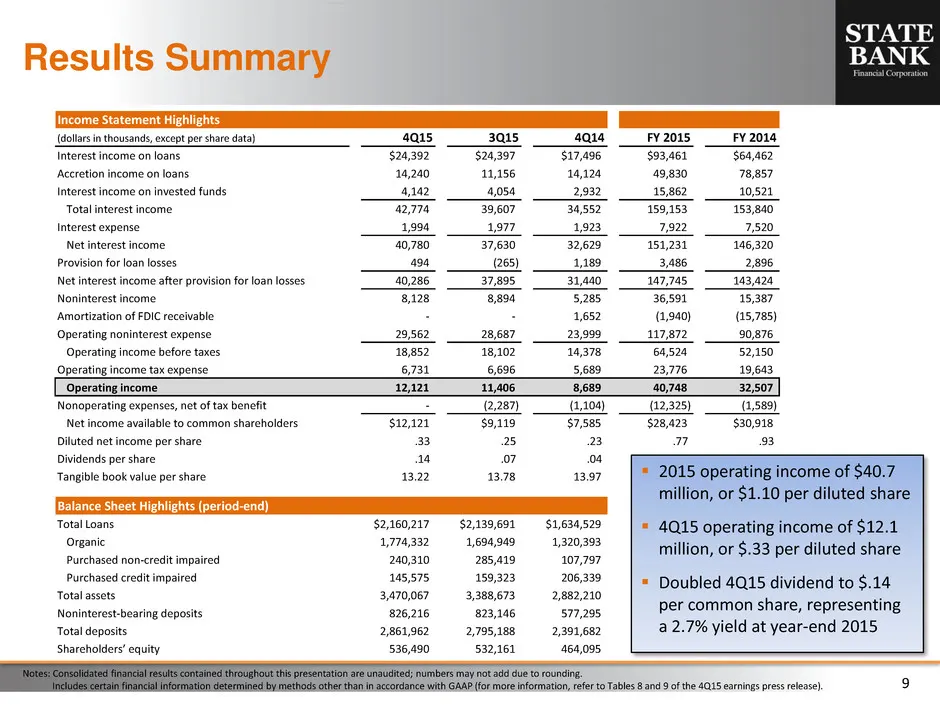
9 Income Statement Highlights (dollars in thousands, except per share data) 4Q15 3Q15 4Q14 FY 2015 FY 2014 Interest income on loans $24,392 $24,397 $17,496 $93,461 $64,462 Accretion income on loans 14,240 11,156 14,124 49,830 78,857 Interest income on invested funds 4,142 4,054 2,932 15,862 10,521 T
Slide 10: Core Deposit Funding Mix
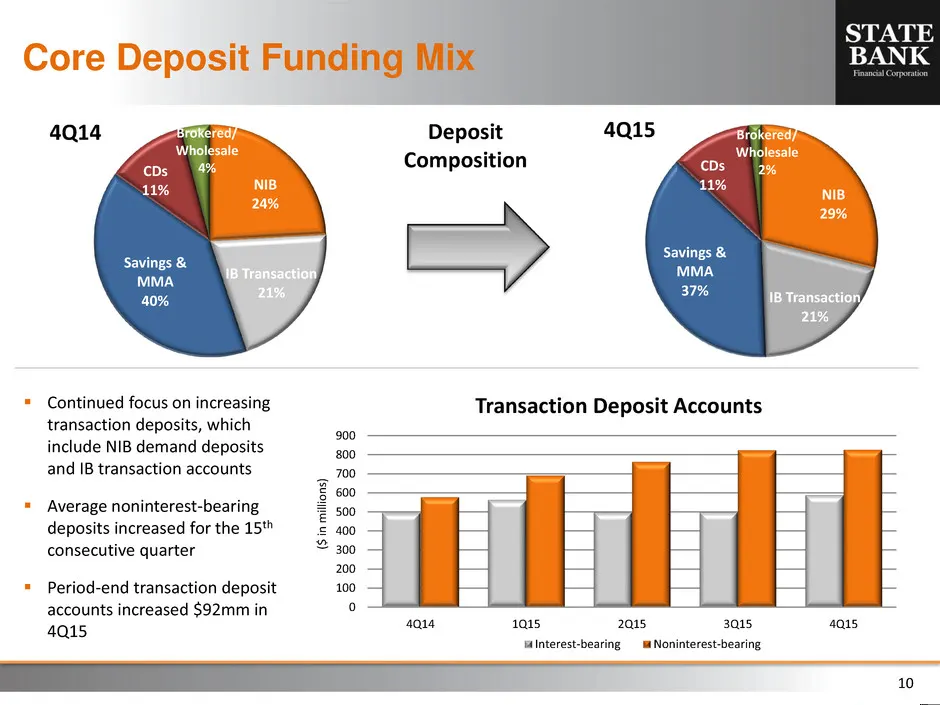
10 Core Deposit Funding Mix Continued focus on increasing transaction deposits, which include NIB demand deposits and IB transaction accounts Average noninterest-bearing deposits increased for the 15th consecutive quarter Period-end transaction deposit accounts increased $92mm in 4Q15 ($ i n m
Slide 11: Strong Loan Growth
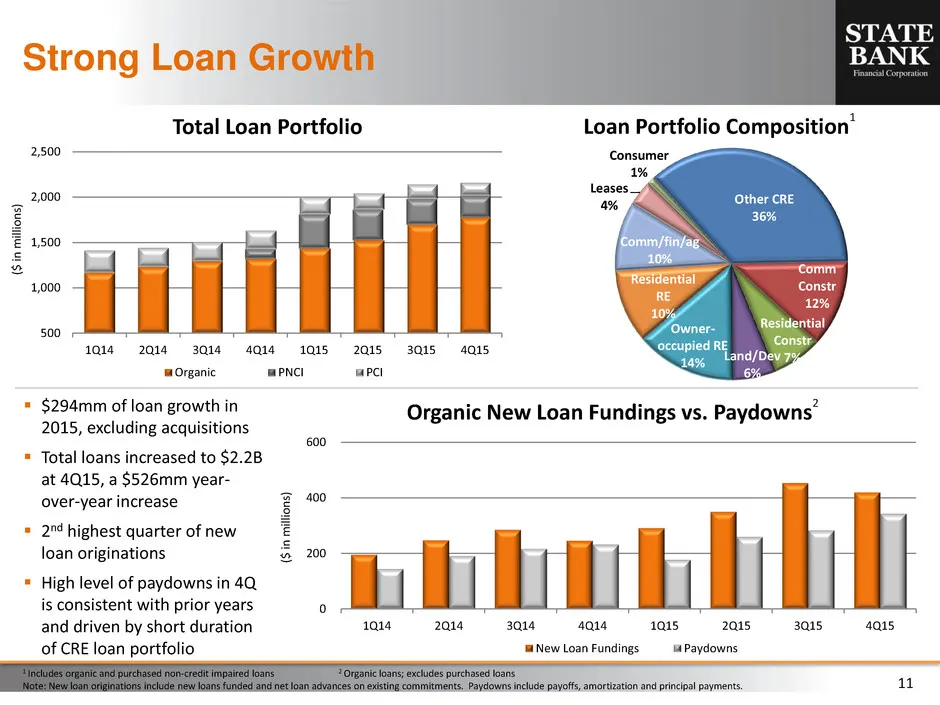
11 Other CRE 36% Comm Constr 12% Residential Constr 7%Land/Dev 6% Owner- occupied RE 14% Residential RE 10% Comm/fin/ag 10% Leases 4% Consumer 1% Strong Loan Growth ($ i n mi llio n s) $294mm of loan growth in 2015, excluding acquisitions Total loans increased to $2.2B at 4Q15, a $526mm year- ov
Slide 12: Revenue Trends
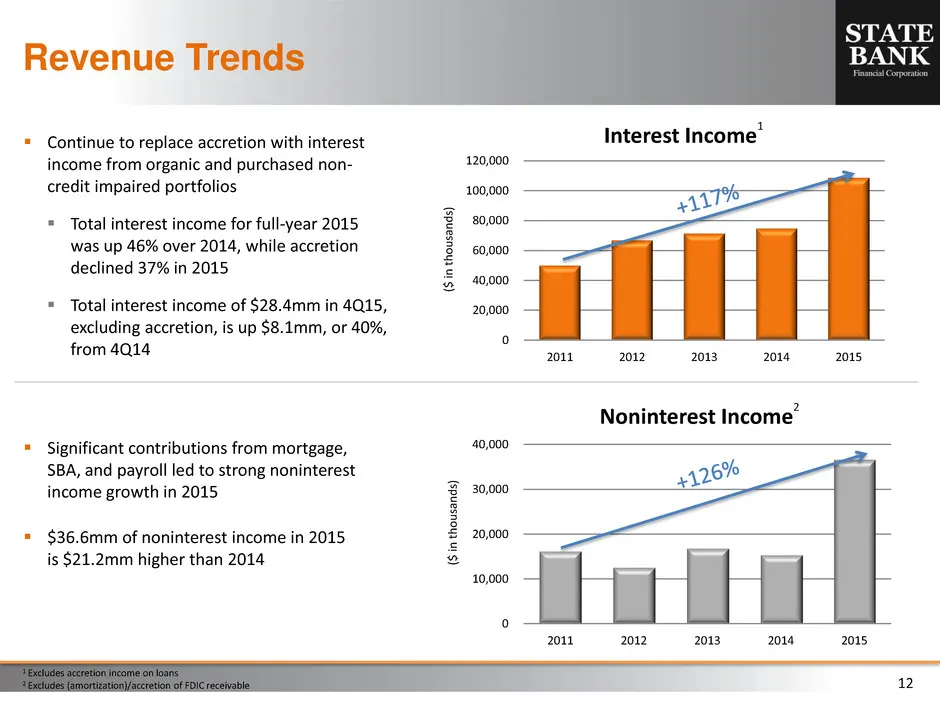
12 0 10,000 20,000 30,000 40,000 2011 2012 2013 2014 2015 Noninterest Income 2 Continue to replace accretion with interest income from organic and purchased non- credit impaired portfolios Total interest income for full-year 2015 was up 46% over 2014, while accretion declined 37% in 2015 Total
Slide 13: Growing Noninterest Income
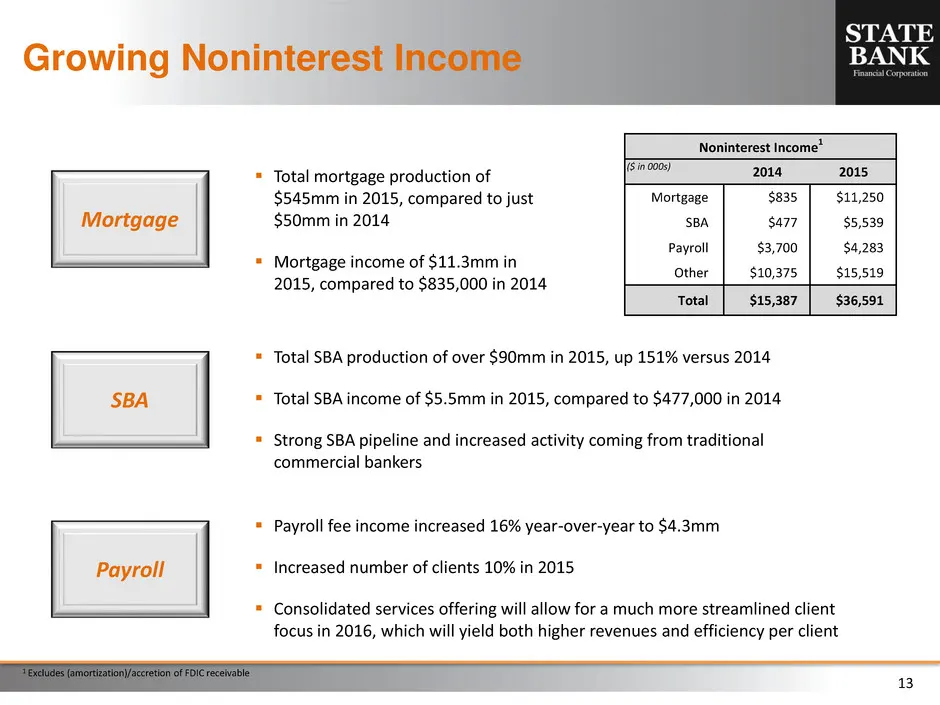
13 Growing Noninterest Income Total mortgage production of $545mm in 2015, compared to just $50mm in 2014 Mortgage income of $11.3mm in 2015, compared to $835,000 in 2014 Mortgage SBA Payroll Total SBA production of over $90mm in 2015, up 151% versus 2014 Total SBA income of $5.5mm in 2015,
Slide 14: Maintaining Solid Asset Quality
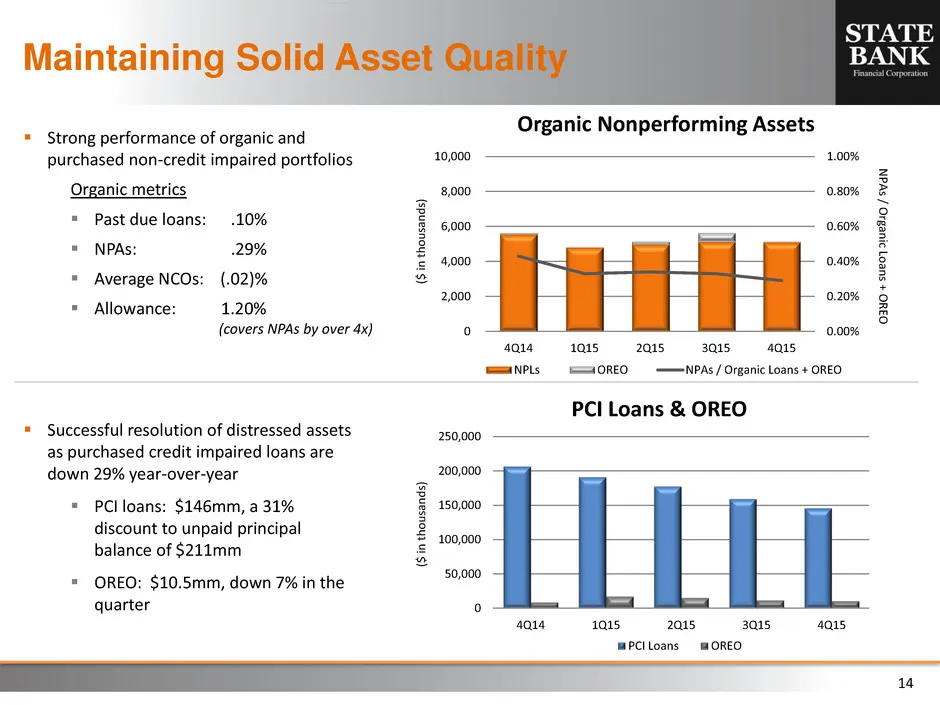
14 ($ i n t h o u sa n d s) Maintaining Solid Asset Quality Strong performance of organic and purchased non-credit impaired portfolios Organic metrics Past due loans: .10% NPAs: .29% Average NCOs: (.02)% Allowance: 1.20% (covers NPAs by over 4x) N PA s / Orga n ic L o an s + OR EO ($ i n t
Slide 15: State Bank Financial Corp. STBZ Profile
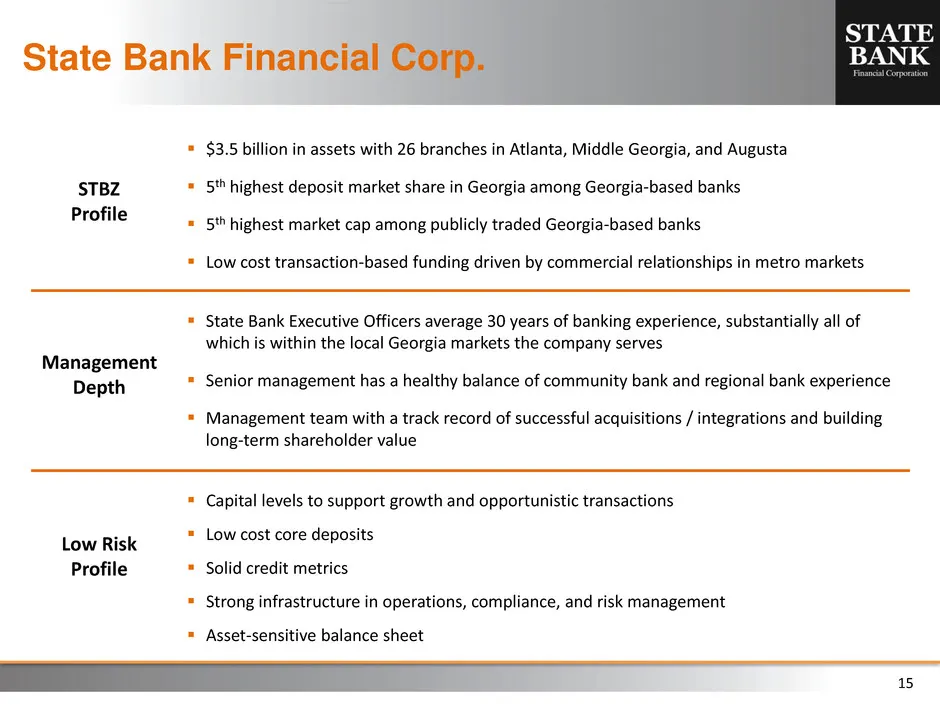
15 State Bank Financial Corp. STBZ Profile $3.5 billion in assets with 26 branches in Atlanta, Middle Georgia, and Augusta 5th highest deposit market share in Georgia among Georgia-based banks 5th highest market cap among publicly traded Georgia-based banks Low cost transaction-based funding
Source: SEC EDGAR · 8-K filed Feb 3, 2016
More decks from State Bank Financial Corporation
 Merger or Acquisition (May 2018)20 slides · May 14, 2018
 Investor Presentation (May 2018)18 slides · May 7, 2018
 Q1 2018 Earnings Presentation11 slides · Apr 26, 2018
 Q4 2017 Earnings Presentation14 slides · Jan 25, 2018
 Investor Presentation (December 2017)18 slides · Dec 11, 2017
 Q3 2017 Earnings Presentation12 slides · Oct 26, 2017