William Lyon Homes — Q1 2004 Earnings Presentation
19 slides from William Lyon Homes's earnings presentation, May 17, 2004

Slide 1: First Quarter 2004 Earnings Conference Call
First Quarter 2004 Earnings Conference Call May 12, 2004

Slide 2: Disclosure Statement
Disclosure Statement • Certain statements contained in this release and conference call that are not historical information contain forward-looking statements. The forward-looking statements involve risk and uncertainties and actual results may differ materially from those projected or implied. Furt
Slide 3: 1st Quarter 2004 Highlights & Accomplishments
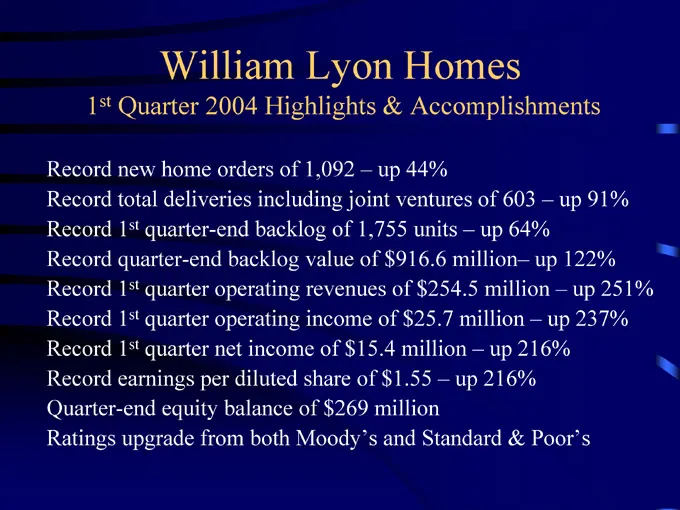
1st Quarter 2004 Highlights & Accomplishments Record new home orders of 1,092 – up 44% Record total deliveries including joint ventures of 603 – up 91% Record 1st quarter-end backlog of 1,755 units – up 64% Record quarter-end backlog value of $916.6 million– up 122% Record 1st quarter operating reve
Slide 4: 1st Quarter 2004—Summary Results
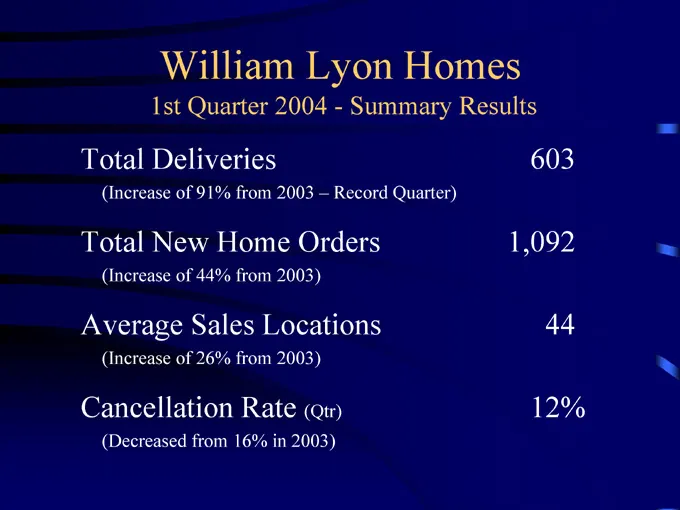
1st Quarter 2004—Summary Results Total Deliveries 603 (Increase of 91% from 2003 – Record Quarter) Total New Home Orders 1,092 (Increase of 44% from 2003) Average Sales Locations 44 (Increase of 26% from 2003) Cancellation Rate (Qtr) 12% (Decreased from 16% in 2003)
Slide 5: Sales Locations
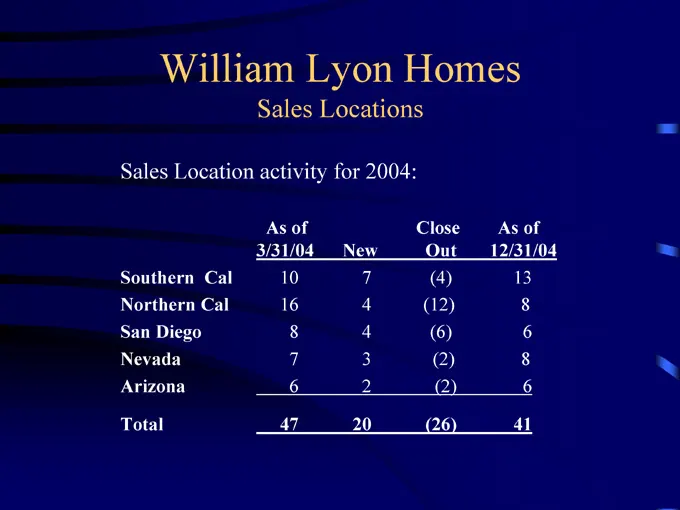
Sales Locations Sales Location activity for 2004: As of 3/31/04 New Close Out As of 12/31/04 Southern Cal 10 7 (4) 13 Northern Cal 16 4 (12) 8 San Diego 8 4 (6) 6 Nevada 7 3 (2) 8 Arizona 6 2 (2) 6 Total 47 20 (26) 41
Slide 6: Backlog Summary
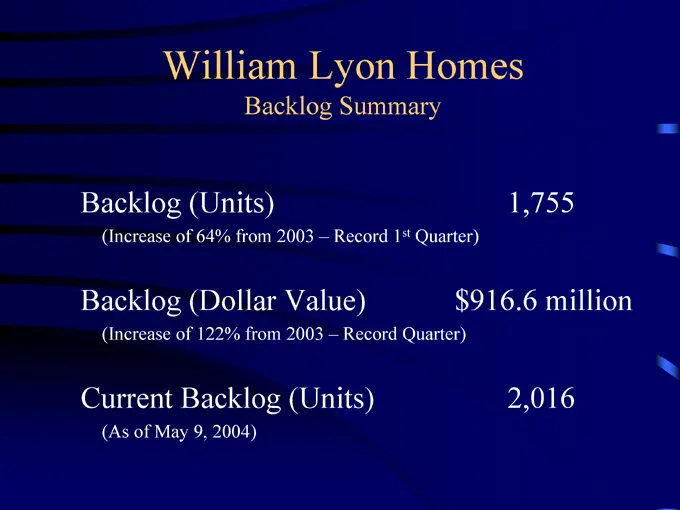
Backlog Summary Backlog (Units) 1,755 (Increase of 64% from 2003 – Record 1st Quarter) Backlog (Dollar Value) $916.6 million (Increase of 122% from 2003 – Record Quarter) Current Backlog (Units) 2,016 (As of May 9, 2004)
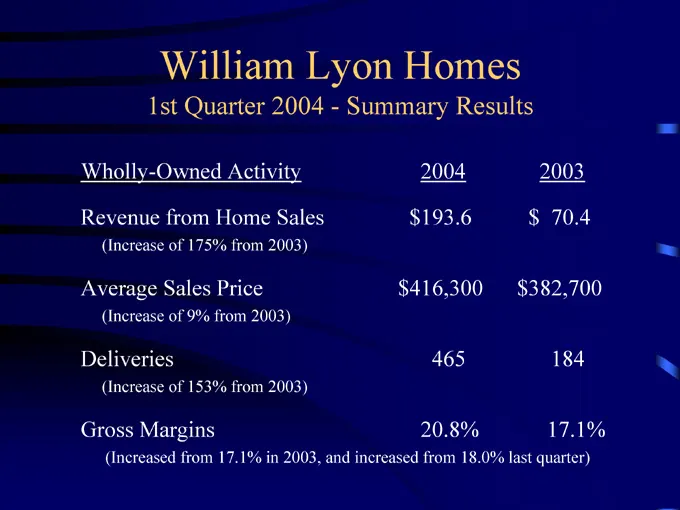
Slide 7: 1st Quarter 2004—Summary Results (Wholly-Owned)
1st Quarter 2004—Summary Results Wholly-Owned Activity 2004 2003 Revenue from Home Sales $193.6 $ 70.4 (Increase of 175% from 2003) Average Sales Price $416,300 $382,700 (Increase of 9% from 2003) Deliveries 465 184 (Increase of 153% from 2003) Gross Margins 20.8% 17.1% (Increased from 17.1% in 2003
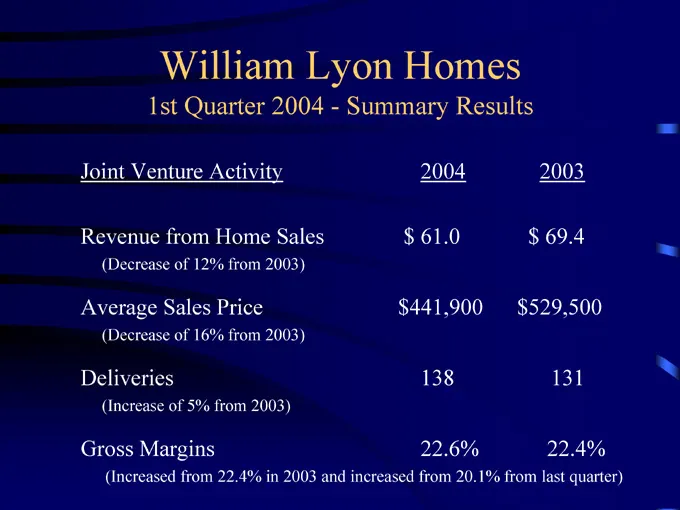
Slide 8: 1st Quarter 2004—Summary Results (Joint Venture)
1st Quarter 2004—Summary Results Joint Venture Activity 2004 2003 Revenue from Home Sales $ 61.0 $ 69.4 (Decrease of 12% from 2003) Average Sales Price $441,900 $529,500 (Decrease of 16% from 2003) Deliveries 138 131 (Increase of 5% from 2003) Gross Margins 22.6% 22.4% (Increased from 22.4% in 2003
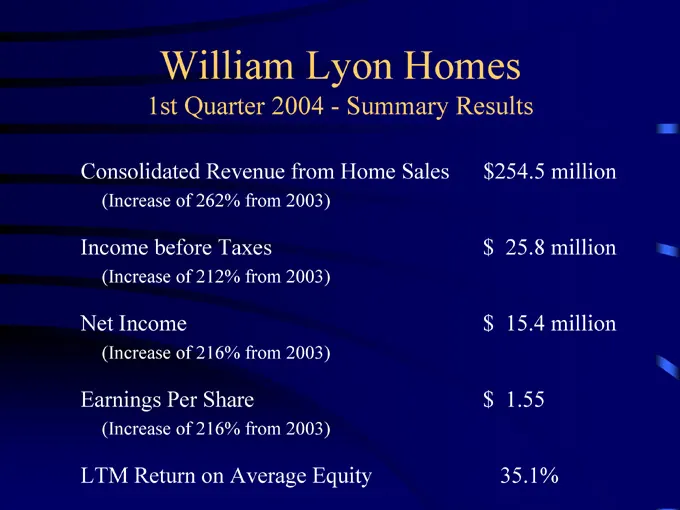
Slide 9: 1st Quarter 2004—Summary Results (Consolidated)
1st Quarter 2004—Summary Results Consolidated Revenue from Home Sales $254.5 million (Increase of 262% from 2003) Income before Taxes $ 25.8 million (Increase of 212% from 2003) Net Income $ 15.4 million (Increase of 216% from 2003) Earnings Per Share $ 1.55 (Increase of 216% from 2003) LTM Return o
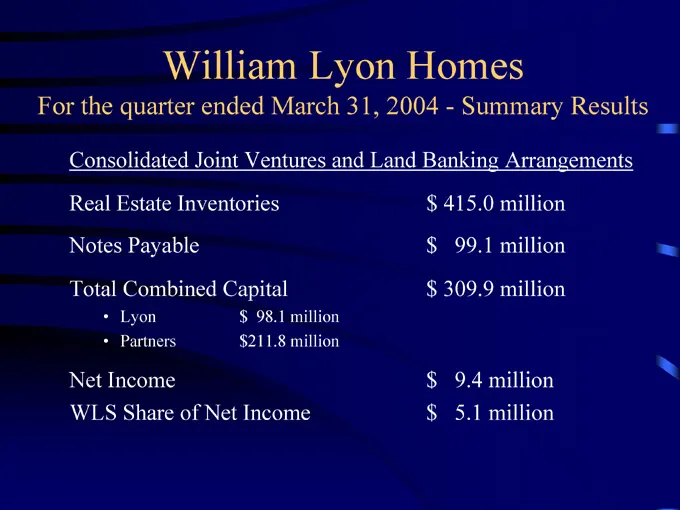
Slide 10: Quarter ended March 31, 2004—Joint Ventures and Land Banking
For the quarter ended March 31, 2004—Summary Results Consolidated Joint Ventures and Land Banking Arrangements Real Estate Inventories $ 415.0 million Notes Payable $ 99.1 million Total Combined Capital $ 309.9 million • Lyon $ 98.1 million • Partners $211.8 million Net Income $ 9.4 million WLS Shar
Slide 11: March 31, 2004—Summary Results
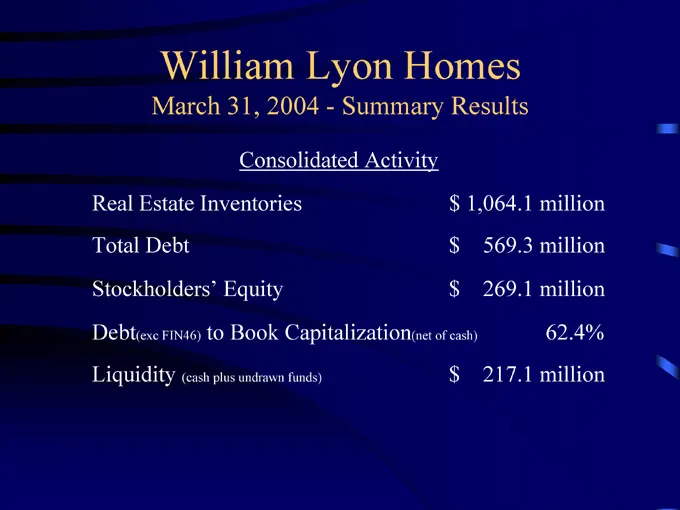
March 31, 2004—Summary Results Consolidated Activity Real Estate Inventories $ 1,064.1 million Total Debt $ 569.3 million Stockholders’ Equity $ 269.1 million Debt(exc FIN46) to Book Capitalization(net of cash) 62.4% Liquidity (cash plus undrawn funds) $ 217.1 million
Slide 12: EBITDA
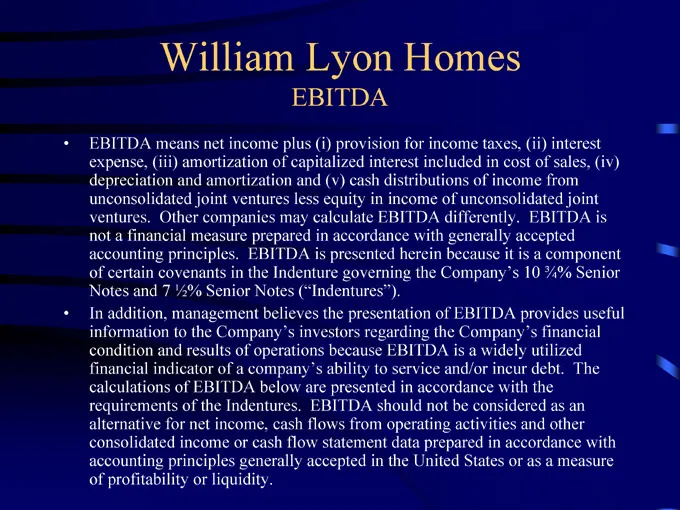
EBITDA • EBITDA means net income plus (i) provision for income taxes, (ii) interest expense, (iii) amortization of capitalized interest included in cost of sales, (iv) depreciation and amortization and (v) cash distributions of income from unconsolidated joint ventures less equity in income of uncon
Slide 13: Reconciliation of Net Income to EBITDA
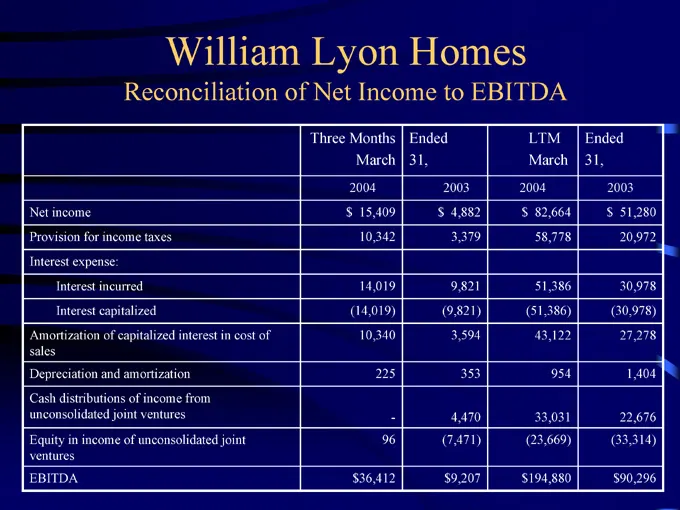
Reconciliation of Net Income to EBITDA Three Months Ended March 31, LTM Ended March 31, 2004 2003 2004 2003 Net income $ 15,409 $ 4,882 $ 82,664 $ 51,280 Provision for income taxes 10,342 3,379 58,778 20,972 Interest expense: Interest incurred 14,019 9,821 51,386 30,978 Interest capitalized (14,019)
Slide 14: Reconciliation of Net Cash Used in Operating Activities to EBITDA
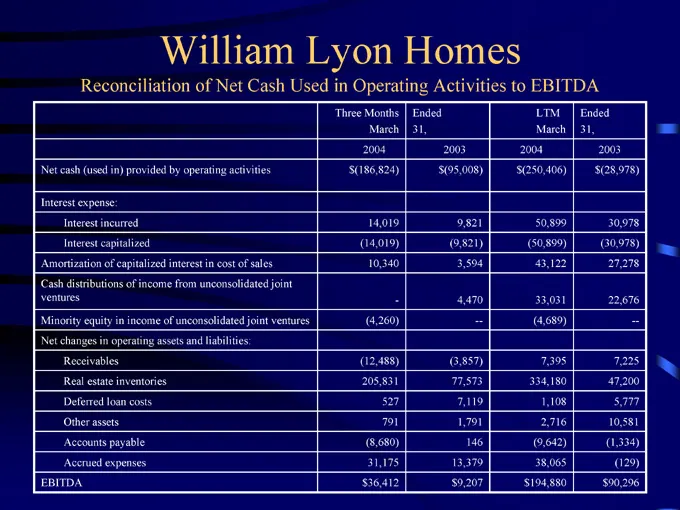
Reconciliation of Net Cash Used in Operating Activities to EBITDA Three Months Ended March 31, LTM Ended March 31, 2004 2003 2004 2003 Net cash (used in) provided by operating activities $(186,824) $(95,008) $(250,406) $(28,978) Interest expense: Interest incurred 14,019 9,821 50,899 30,978 Interest
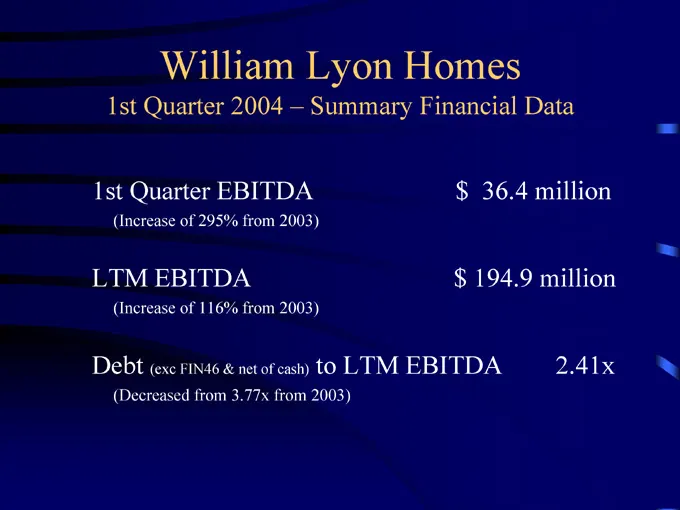
Slide 15: 1st Quarter 2004 – Summary Financial Data
1st Quarter 2004 – Summary Financial Data 1st Quarter EBITDA $ 36.4 million (Increase of 295% from 2003) LTM EBITDA $ 194.9 million (Increase of 116% from 2003) Debt (exc FIN46 & net of cash) to LTM EBITDA 2.41x (Decreased from 3.77x from 2003)
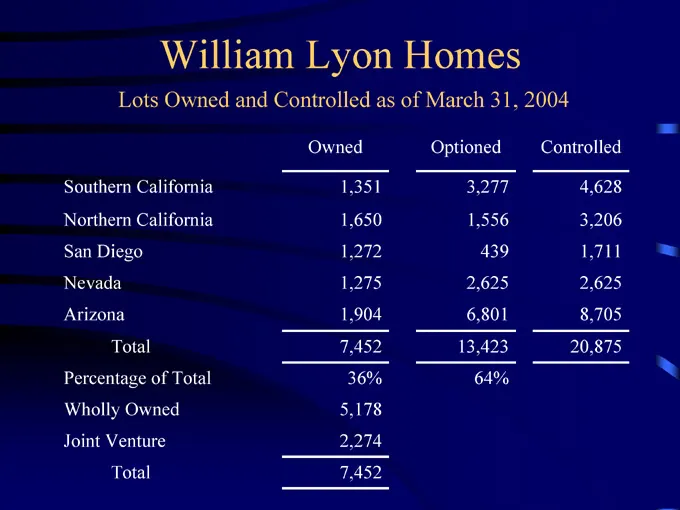
Slide 16: Lots Owned and Controlled as of March 31, 2004
Lots Owned and Controlled as of March 31, 2004 Owned Optioned Controlled Southern California 1,351 3,277 4,628 Northern California 1,650 1,556 3,206 San Diego 1,272 439 1,711 Nevada 1,275 2,625 2,625 Arizona 1,904 6,801 8,705 Total 7,452 13,423 20,875 Percentage of Total 36% 64% Wholly Owned 5,178 J

Slide 17: FASB Interpretation No. 46 (FIN 46)
FASB Interpretation No. 46 (FIN 46) Consolidation of Variable Interest Entities

Slide 18: FIN Application
FIN 46 Application • Joint ventures and partnerships • Land banking arrangements • Land option arrangements • Model sale/leaseback arrangements

Slide 19: FIN Effective Dates
FIN 46 Effective Dates • Variable interest entities created after January 31, 2003 – Immediately • Variable interest entities created before February 1, 2003 – Beginning July 1, 2003
Source: SEC EDGAR · 8-K filed May 17, 2004
More decks from William Lyon Homes
 Merger or Acquisition (November 2019)18 slides · Nov 6, 2019
 Q2 2019 Earnings Presentation15 slides · Aug 1, 2019
 Q1 2019 Earnings Presentation14 slides · May 2, 2019
 Q4 2018 Earnings Presentation18 slides · Feb 14, 2019
 Q3 2018 Earnings Presentation17 slides · Oct 30, 2018
 2018 Zelman Housing Summit31 slides · Sep 27, 2018