C&D Technologies — Adams Harkness 25th Annual Summer Seminar (August 2005)
23 slides from C&D Technologies's conference presentation, Aug 4, 2005
Slide 1: C&D Technologies, Inc.
C&D Technologies, Inc. (NYSE: CHP) Adams Harkness 25th Annual Summer Seminar August 4, 2005 Jeffrey A. Graves, President and CEO Stephen Markert, Vice President and CFO
Slide 2: Forward Looking Statements
Forward Looking Statements These materials may contain forward-looking statements (within the meaning of Section 27A of the Securities Act of 1933 and Section 21E of the Securities Exchange Act of 1934). Words such as “anticipates”, “expects”, “believes” and similar expressions reflecting something
Slide 3: Jeff Graves - Overview
Jeff Graves - Overview Joined C&D 7-5-05 Prior experience: KEMET Corporation General Electric Power Systems Division and Corporate Res earch & Development Center Rockwell International Corporation Howmet Corporation Core areas of expertise: Customer focus and alignment Development & commercializatio
Slide 4: Initial Observations of C&D
Initial Observations of C&D With a renewed focus on execution, customer satisfaction, quality and technology development, C&D can re-energize profitability. Significant Opportunities: 99 year history World-class customer base Industry-leading technology Powerful international manufacturing platform
Slide 5: Priorities
Priorities Return to profitable growth Customer focus alignment of assets and resources Execution of fundamentals: Quality, Delivery, Reynosa location Technology leadership Energy storage and electronics Integration of recent acquisitions Strategic sourcing (e.g., Lead) in Supply Chain Management
Slide 6: Divisional Review
Divisional Review
Slide 7: Overview
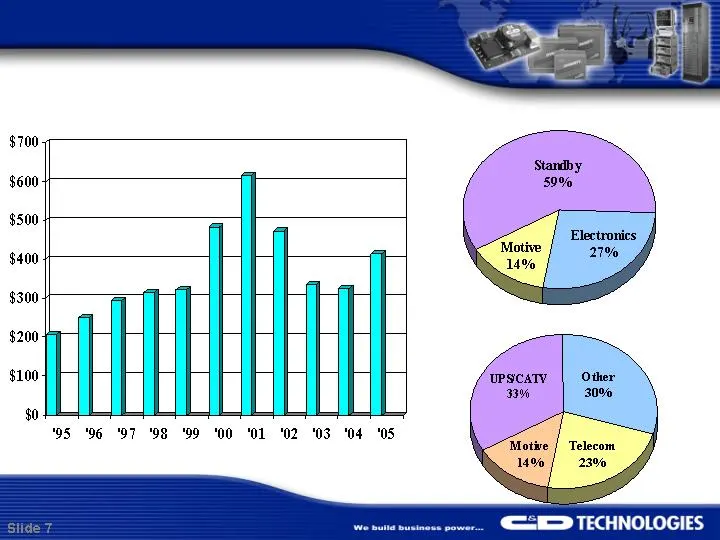
Overview Revenues by Division – FY 2005 $414.7M Revenues by Market – FY 2005 $414.7M Annual Revenues - $ Millions C&D Technologies, Inc.
Slide 8: Standby Power Division at a Glance
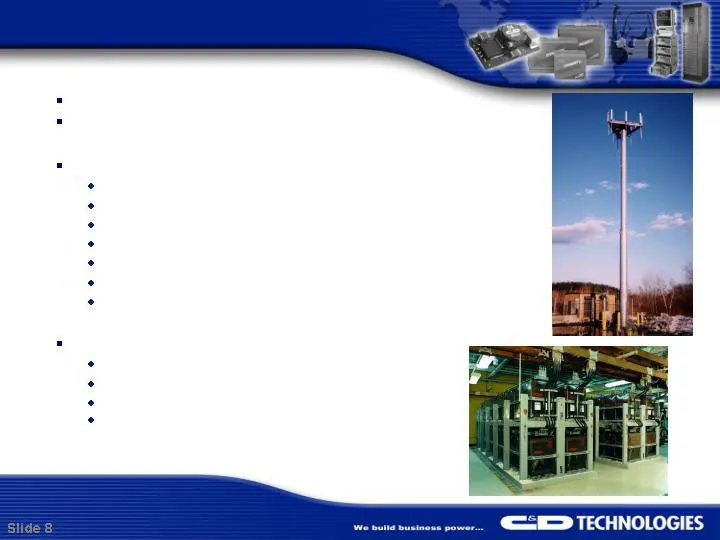
Standby Power Division at a Glance FY 2005 Revenues: $245.8 million 59% of CHP total Applications Standby Batteries & Electronics Wire line / Fiber Wireless Cell Sites/Pager Sites Wireless Broadband Cable Head End Power Generation Uninterruptible Power Supplies Strategic Initiatives Drive value thro
Slide 9: Capacity as Battery Ages
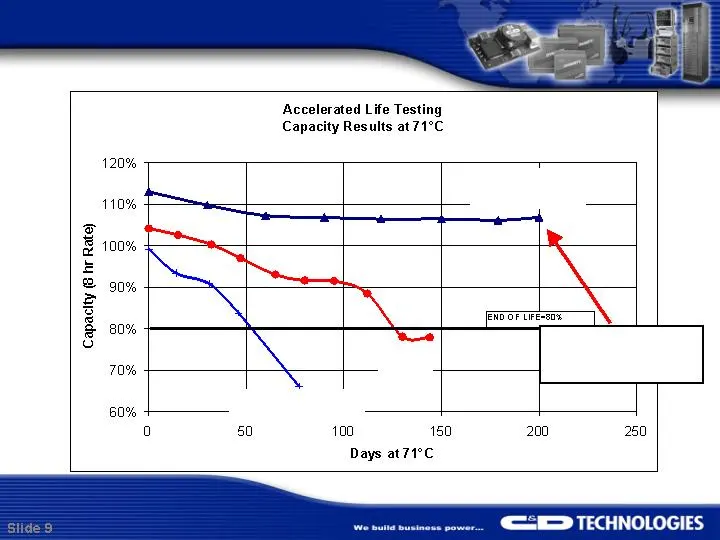
Capacity as Battery Ages msEndur Typical VRLA MSE Greater than 20 yr life 10 days = 1 yr
Slide 10: Motive Power Division at a Glance
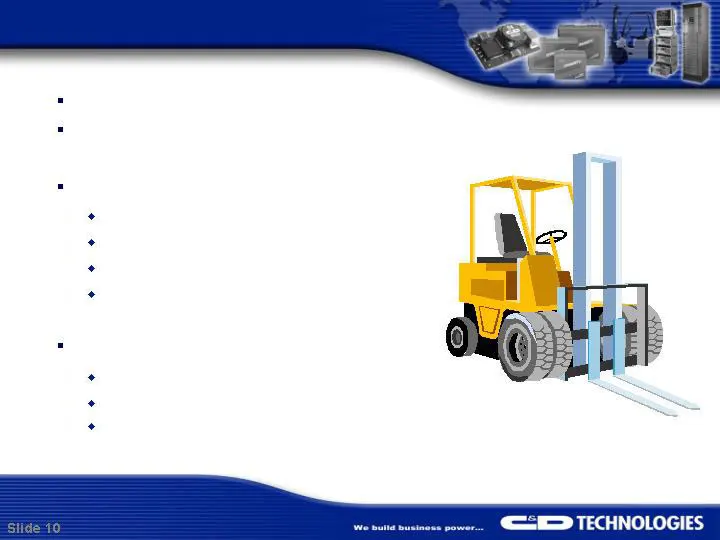
Motive Power Division at a Glance FY 2005 Revenues: $57.4 million 14% of CHP total Applications Electric powered forklift trucks Other material handling equipment Automatic guided vehicles Airline ground support vehicles Q3 decision for strategic direction On-time delivery Reynosa location improveme
Slide 11: Power Electronics Division at a Glance
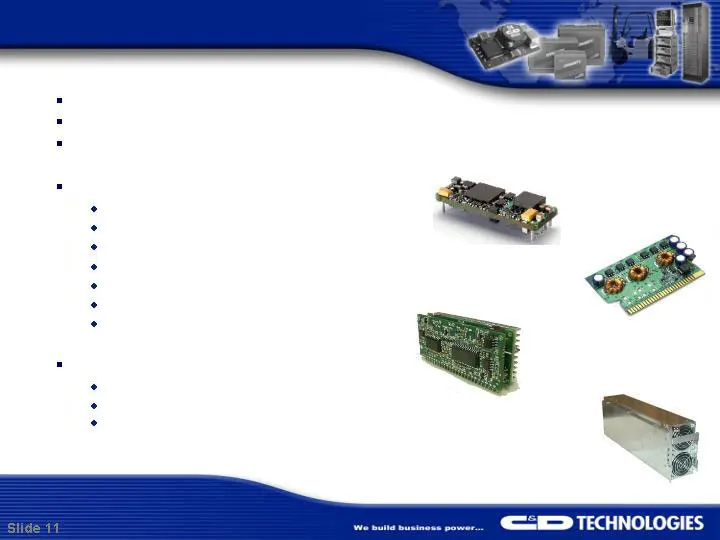
Power Electronics Division at a Glance FY 2005 Revenues: $111.5 million 27% of CHP total Expected to be over 35% in current fiscal year Products: Eighth Bricks Quarter Bricks Half Bricks SIPs VRMs Power Pods AC/DC Front Ends Strategic Initiatives Leverage technology leadership Complete integration o
Slide 12: Power Electronics Acquisitions
Power Electronics Acquisitions
Slide 13: CPS Power Electronics: Building Blocks One-Stop Power Electronics Solution
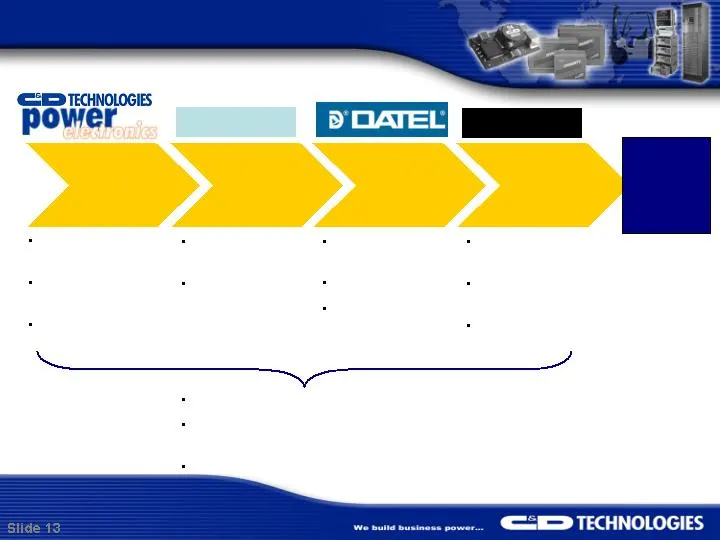
C P S Power Electronics: Building Blocks One-Stop Power Electronics Solution Low to Medium Power Products Typically serves Tier 2 and 3 OEM DC/DC, AC/DC and Magnetics Well developed channels to market Medium Power Products Distribution Strategy DC/DC only Entry into Data Acquisition and Panel Meters
Slide 14: Legacy PED Overview
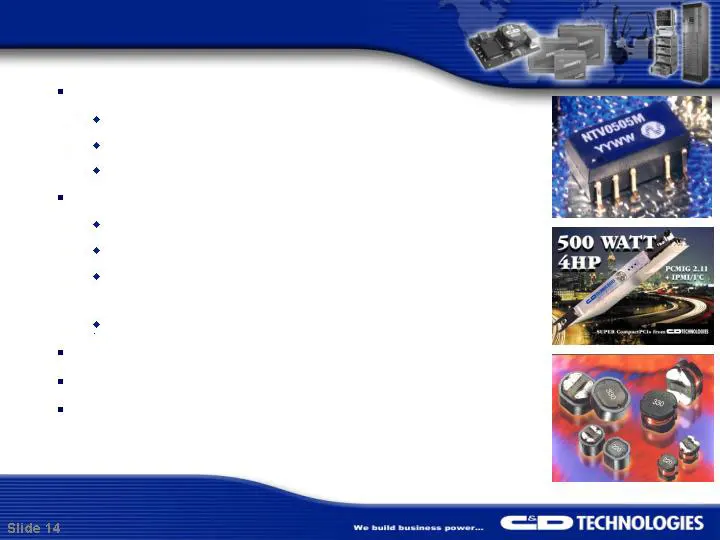
Legacy PED Overview DC/DC Converters Less than 1 Watt t o 150 Watts Leader in package size including 1/8 brick at 50 watts Very high efficiency / performance AC/DC and DC/DC Power Supplies Custom and standard products 50 Watts to 3000 Watts Leader in Compact PCI packaging including IPMI (remote moni
Slide 15: Celab Overview
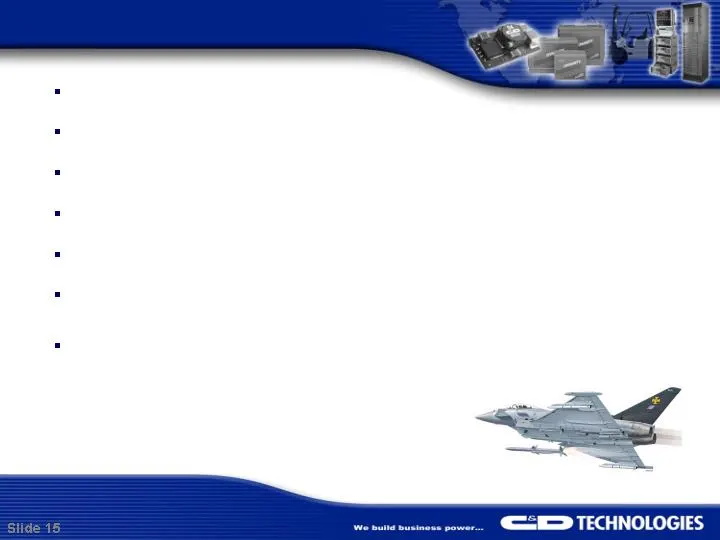
Celab Overview Acquired March 2004 UK Based – Enhances international presence Revenues ~ $12 million Highly profitable Military electronics niche Cable TV power product Potential cross selling opportunities in North America
Slide 16: Datel Overview
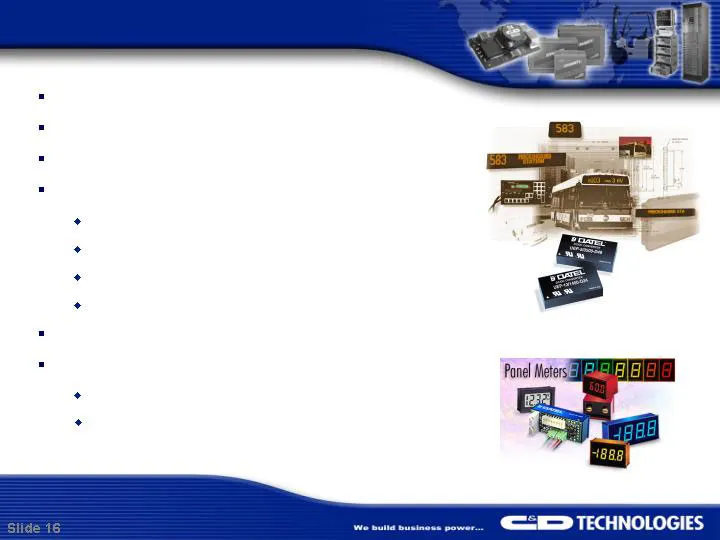
Datel Overview Acquired June 2005 Revenues ~ $60 million Strong mid-power DC/DC converter business Long-established international presence UK France Germany Japan Very large customer base Two new product lines Digital Panel Meters Data Acquisition Components
Slide 17: CPS Overview
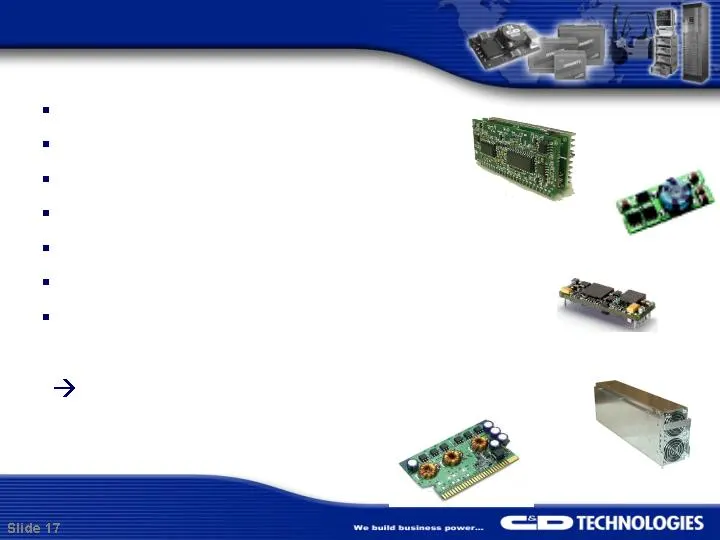
CPS Overview Acquired September 2005 Revenues ~ $90 million Current revenues - ~ $60 million High Power DC/DC Converters AC/DC Power Supplies Premier engineering / technology team Access to Tier 1 OEMs Integration challenges underestimated
Slide 18: PED Acquisition Benefits
PED Acquisition Benefits Post-acquisitions, PED is a fully-integrated provider of power electronics products Diverse product line to meet broad range of customer requirements Technology development and product design leader Multiple channels to market Global manufacturing platform Global R&D resourc
Slide 19: Multiple Channels to Market
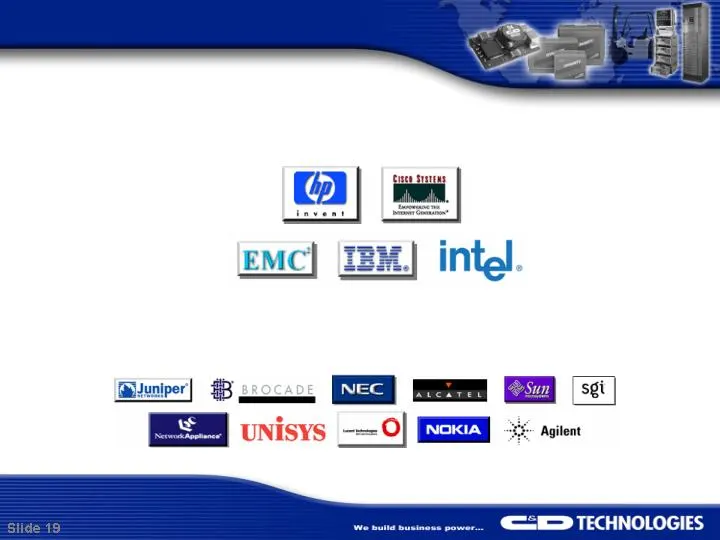
Multiple Channels to Market Flagship Customers (Direct sales, direct engineering) - Standard and custom products Broad Market (Representatives, distribution) - Standard product only
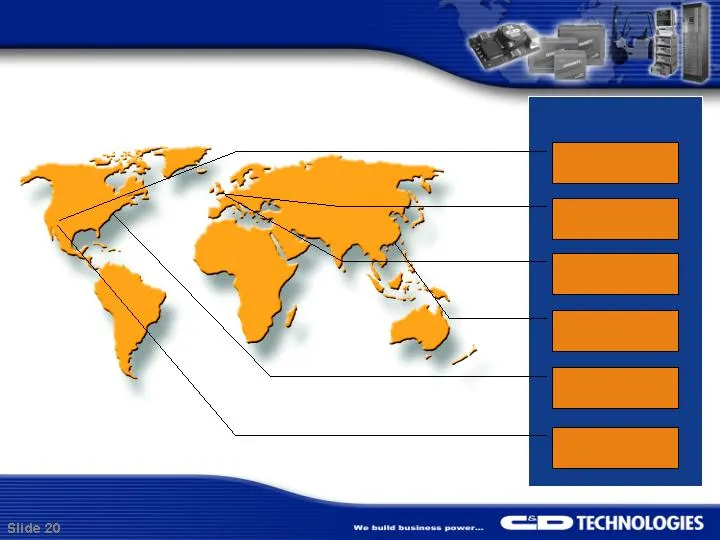
Slide 20: PED Global Manufacturing Presence
Manufacturing PED Global Manufacturing Presence Tucson, USA 106 Employees Mansfield, USA 355 Employees Milton Keynes, UK 89 Employees Nogales, Mexico 204 Employees Guangzhou, China 403 Employees Bordon, UK 78 Employees 495,000ft 2 of Manufacturing Facilities 1,235 Employees
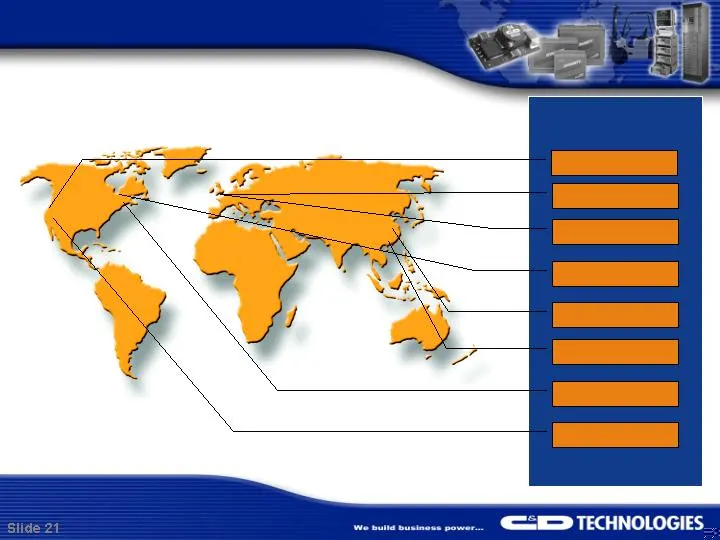
Slide 21: PED Global Engineering Presence
Engineering PED Global Engineering Presence Tucson, USA Mansfield, USA Milton Keynes, UK Guangzhou, China Shanghai, China Oregon, USA Toronto, Canada Bordon, UK 8 Engineering Locations on 3 Continents - 82 Design Engineers
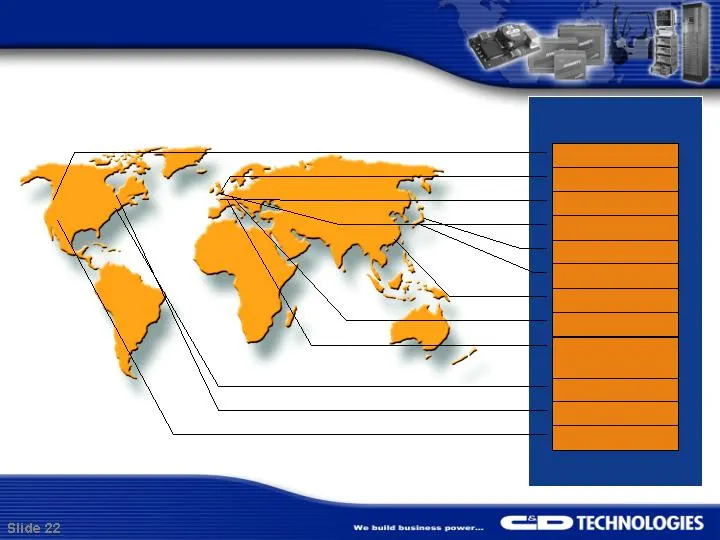
Slide 22: PED Global Sales Presence
Sales PED Global Sales Presence Portland, USA Mansfield, USA Milton Keynes, UK Munich, Germany Tadley, UK Montigny Le Bretonneux, France Guangzhou, China Tokyo, Japan Osaka, Japan Toronto, Canada Tucson, USA Bordon, UK 12 Sales Locations in 7 Countries on 3 Continents
Slide 23: SE TECHNOLOGIES
SE TECHNOLOGIES
Source: SEC EDGAR · 8-K filed Aug 4, 2005