American National Bankshares Inc
American National Bankshares — Investor Presentation (July 2017)
40 slides from American National Bankshares's investor presentation, Jul 31, 2017

Slide 1: FUTURE ~~
FUTURE ~~
Slide 2: Forward-Looking Statements
Certain statements in this presentation may constitute “forward-looking statements” within the meaning of the Private Securities Litigation Reform Act of 1995. Forward-looking statements are statements that include projections, predictions, expectations or beliefs about future events or results or o
Slide 3: Agenda
1. Introduction to American National Bankshares Inc. 2. Recent quarter performance and accomplishments 3. Financial performance 4. Capital management 5. Why invest in American National? AGENDA 3
Slide 4: Introduction to American National
INTRODUCTION TO AMERICAN NATIONAL 4
Slide 5: Vision and Guiding Principles
VISION We will be the best provider of relationship- based financial services in the communities we serve, resulting in enhanced shareholder value, customer loyalty and employee satisfaction GUIDING PRINCIPLES 1. Operate a sound, efficient, growing and highly profitable company. 2. Identify and resp
Slide 6: Key Highlights Franchise Review
Key Highlights Franchise Review 6 • Disciplined loan growth with top tier asset quality • Noninterest bearing deposit funding in excess of peer levels • Effectively leveraging capital with ability to further support future growth • Strong profitability • Proven track record of shareholder returns •
Slide 7: American National
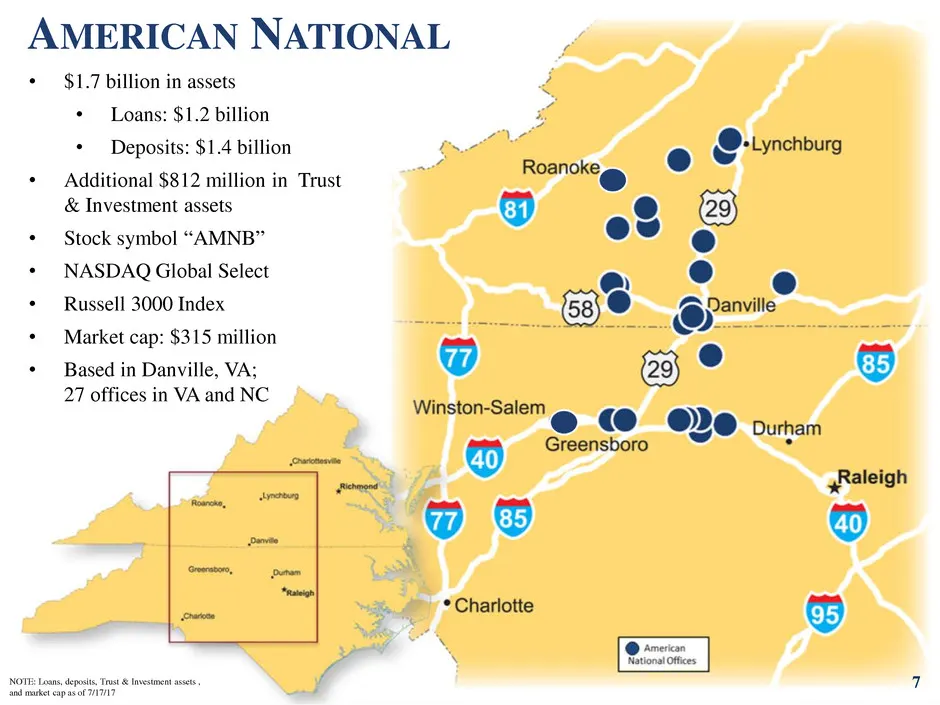
AMERICAN NATIONAL 7 • $1.7 billion in assets • Loans: $1.2 billion • Deposits: $1.4 billion • Additional $812 million in Trust & Investment assets • Stock symbol “AMNB” • NASDAQ Global Select • Russell 3000 Index • Market cap: $315 million • Based in Danville, VA; 27 offices in VA and NC NOTE: Loans
Slide 8: We Are...
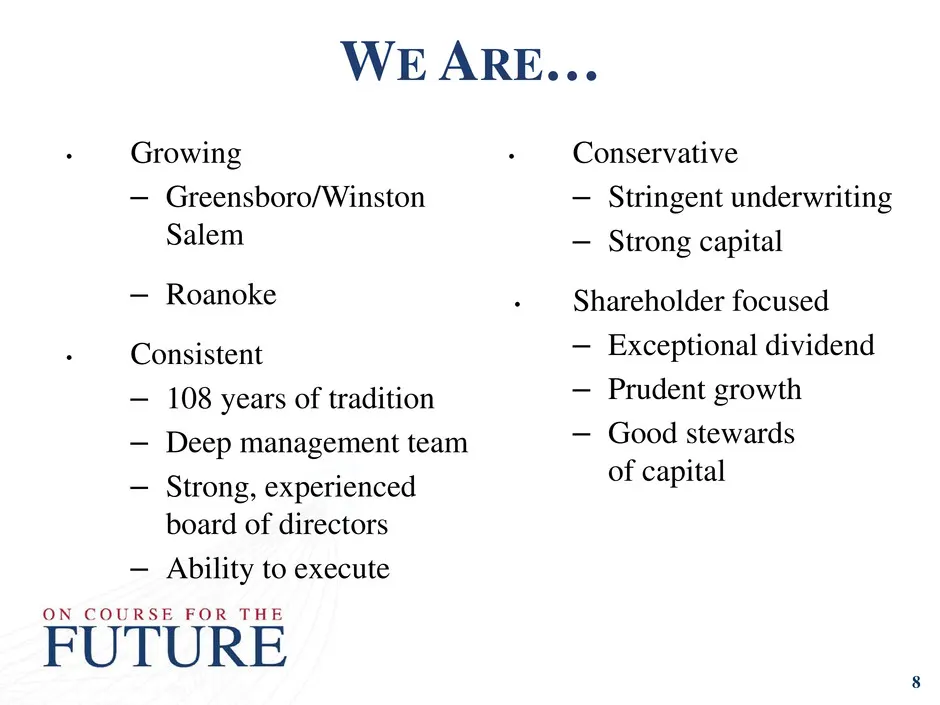
• Growing – Greensboro/Winston Salem – Roanoke • Consistent – 108 years of tradition – Deep management team – Strong, experienced board of directors – Ability to execute • Conservative – Stringent underwriting – Strong capital • Shareholder focused – Exceptional dividend – Prudent growth – Good stew
Slide 9: Our Priorities
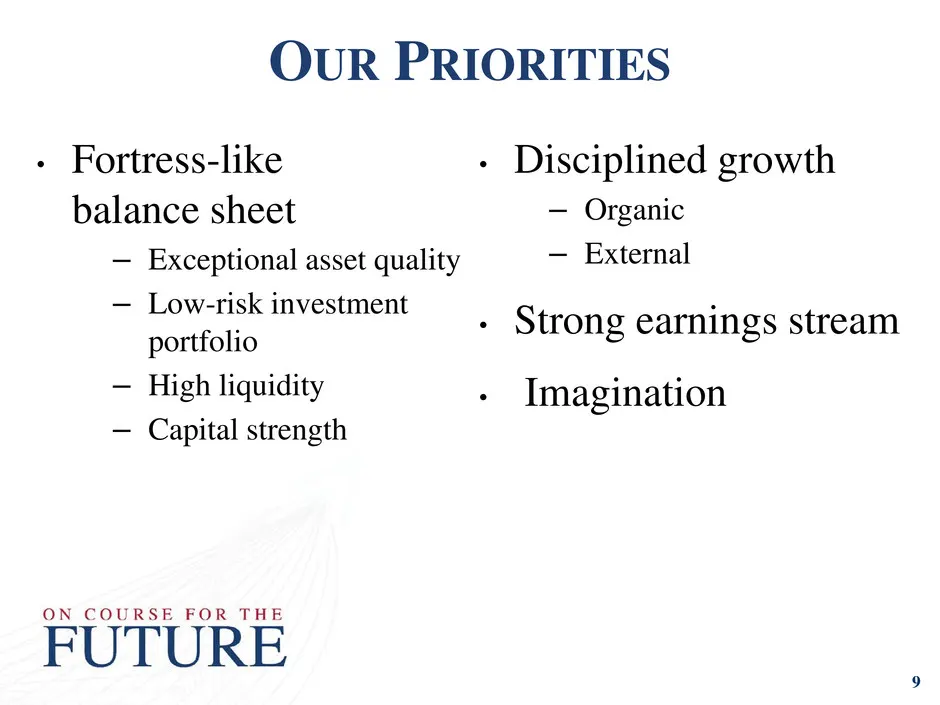
• Fortress-like balance sheet – Exceptional asset quality – Low-risk investment portfolio – High liquidity – Capital strength • Disciplined growth – Organic – External • Strong earnings stream • Imagination OUR PRIORITIES 9
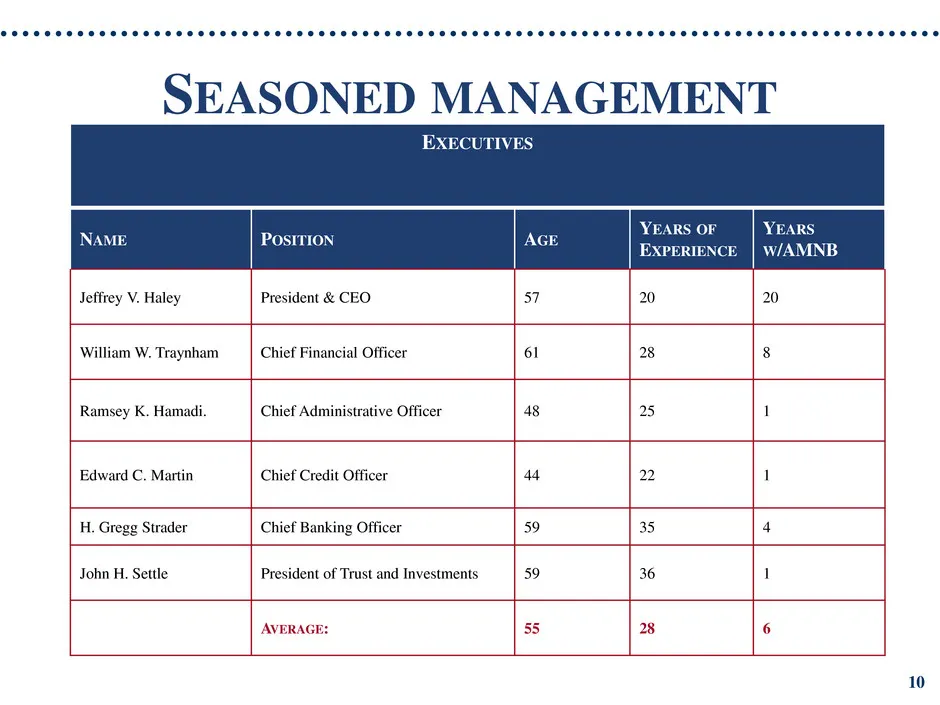
Slide 10: Seasoned Management
SEASONED MANAGEMENT 10 EXECUTIVES NAME POSITION AGE YEARS OF EXPERIENCE YEARS W/AMNB Jeffrey V. Haley President & CEO 57 20 20 William W. Traynham Chief Financial Officer 61 28 8 Ramsey K. Hamadi. Chief Administrative Officer 48 25 1 Edward C. Martin Chief Credit Officer 44 22 1 H. Gregg Strader Chi

Slide 11: Growth Strategy
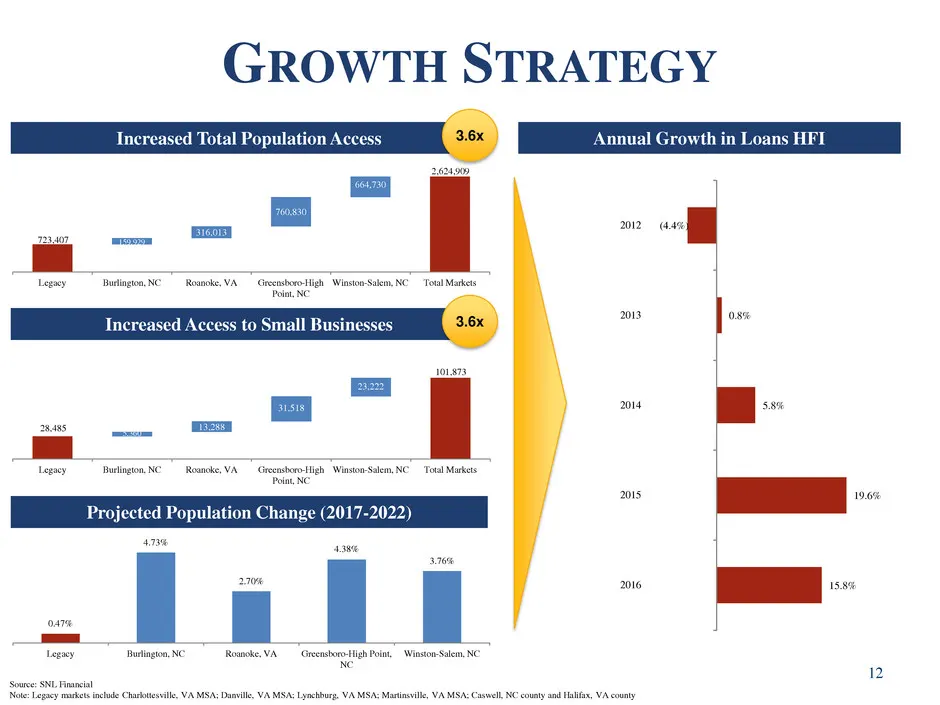
11 GROWTH STRATEGY • Organic growth 2016 – 16% • Leverage core market position in Danville • 33% deposit market share • North Carolina CAGR since 2012 • All markets – 15% • Greensboro – 30% • Team lift outs Winston-Salem, NC & Roanoke, VA • Succession for Chief Credit Officer • 7 commercial bankers
Slide 12: Growth Strategy
12 Source: SNL Financial Note: Legacy markets include Charlottesville, VA MSA; Danville, VA MSA; Lynchburg, VA MSA; Martinsville, VA MSA; Caswell, NC county and Halifax, VA county 723,407 2,624,909 159,929 316,013 760,830 664,730 Legacy Burlington, NC Roanoke, VA Greensboro-High Point, NC Winston-Sa
Slide 13: Balance Sheet Growth vs. Peers
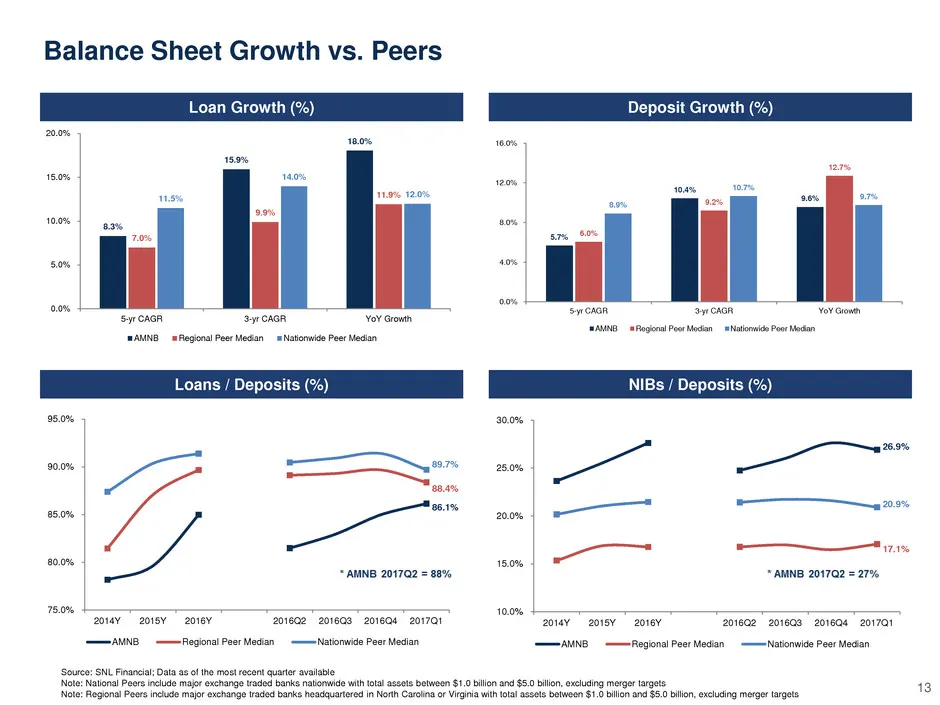
Loan Growth (%) Deposit Growth (%) Loans / Deposits (%) NIBs / Deposits (%) Balance Sheet Growth vs. Peers 13 Source: SNL Financial; Data as of the most recent quarter available Note: National Peers include major exchange traded banks nationwide with total assets between $1.0 billion and $5.0 billio
Slide 14: Diverse Revenue Stream
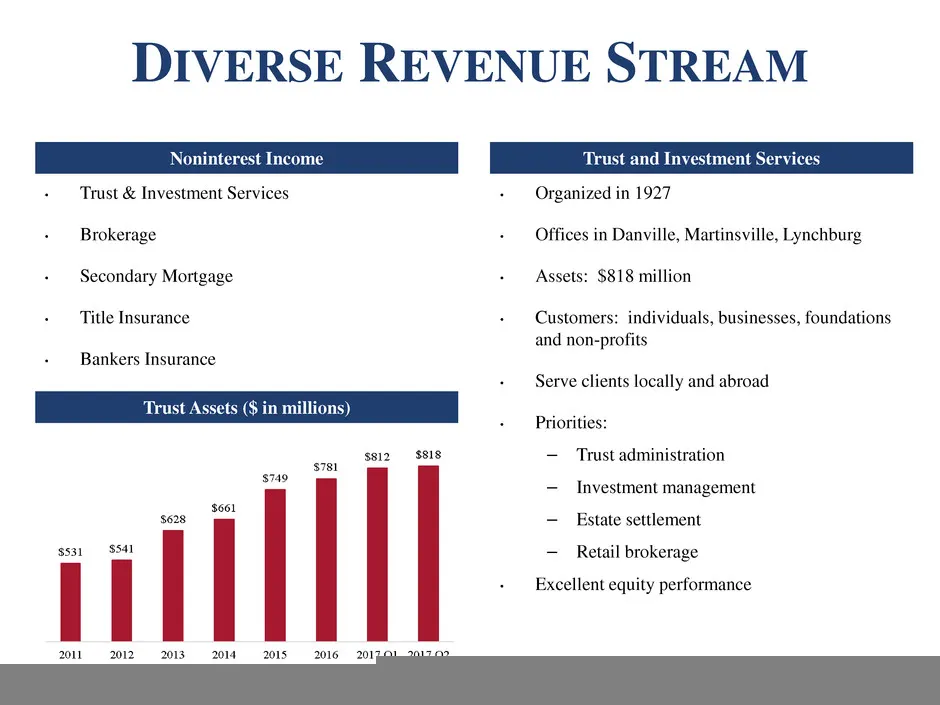
14 DIVERSE REVENUE STREAM Noninterest Income • Trust & Investment Services • Brokerage • Secondary Mortgage • Title Insurance • Bankers Insurance Trust and Investment Services • Organized in 1927 • Offices in Danville, Martinsville, Lynchburg • Assets: $818 million • Customers: individuals, business
Slide 15: Superior Asset Quality
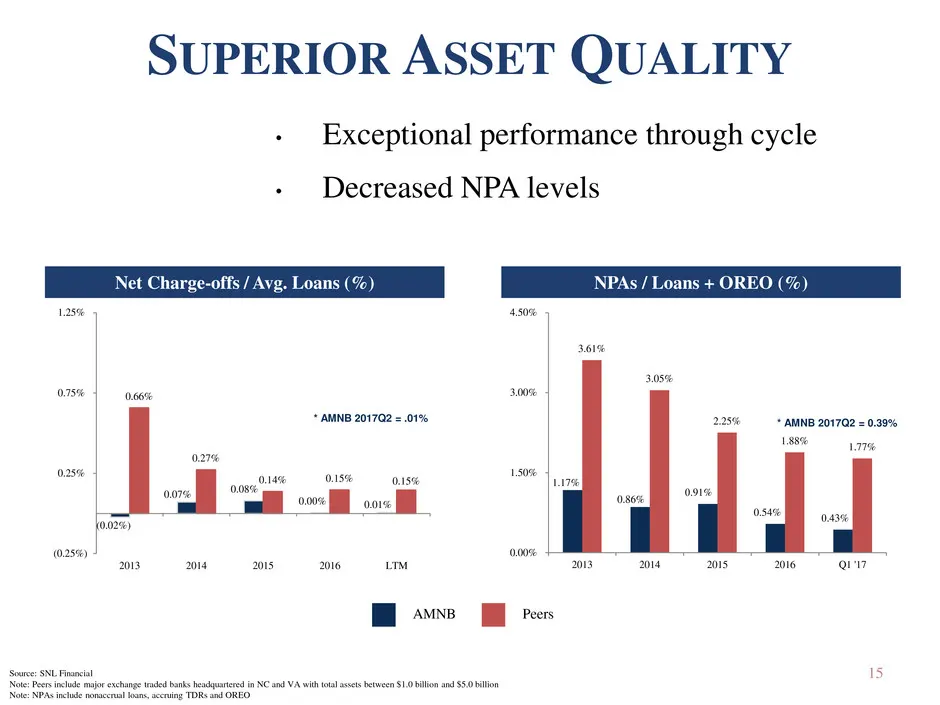
15 SUPERIOR ASSET QUALITY Net Charge-offs / Avg. Loans (%) NPAs / Loans + OREO (%) Source: SNL Financial Note: Peers include major exchange traded banks headquartered in NC and VA with total assets between $1.0 billion and $5.0 billion Note: NPAs include nonaccrual loans, accruing TDRs and OREO AMNB
Slide 16: Asset Quality vs. Peers
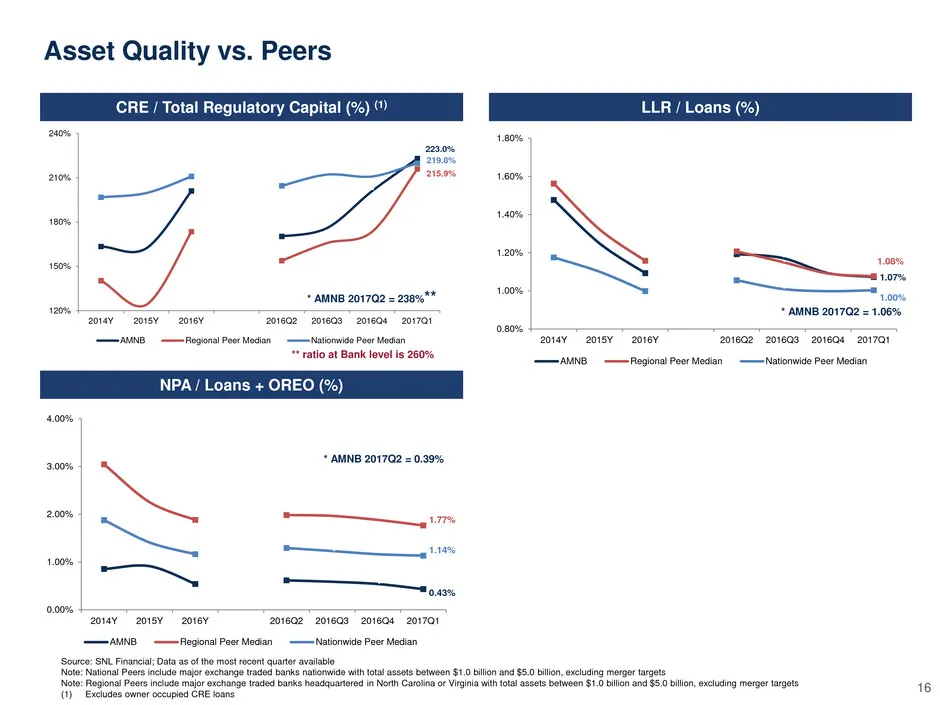
NPA / Loans + OREO (%) LLR / Loans (%) Asset Quality vs. Peers 16 Source: SNL Financial; Data as of the most recent quarter available Note: National Peers include major exchange traded banks nationwide with total assets between $1.0 billion and $5.0 billion, excluding merger targets Note: Regional P
Slide 17: Loan Portfolio
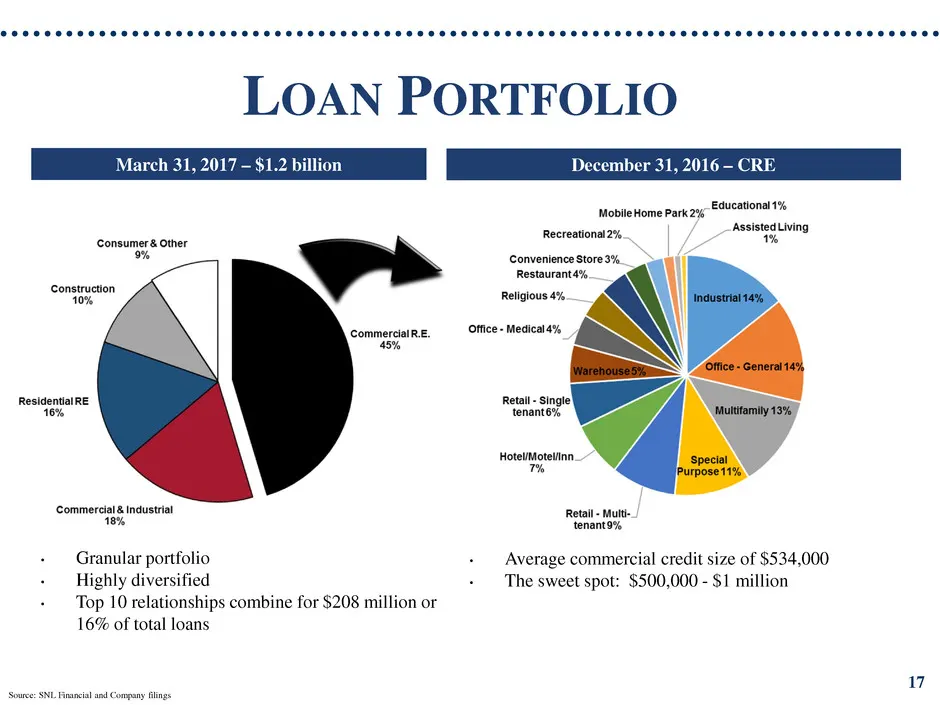
LOAN PORTFOLIO March 31, 2017 – $1.2 billion Source: SNL Financial and Company filings December 31, 2016 – CRE 17 • Average commercial credit size of $534,000 • The sweet spot: $500,000 - $1 million • Granular portfolio • Highly diversified • Top 10 relationships combine for $208 million or 16% of t
Slide 18: Deposit Portfolio
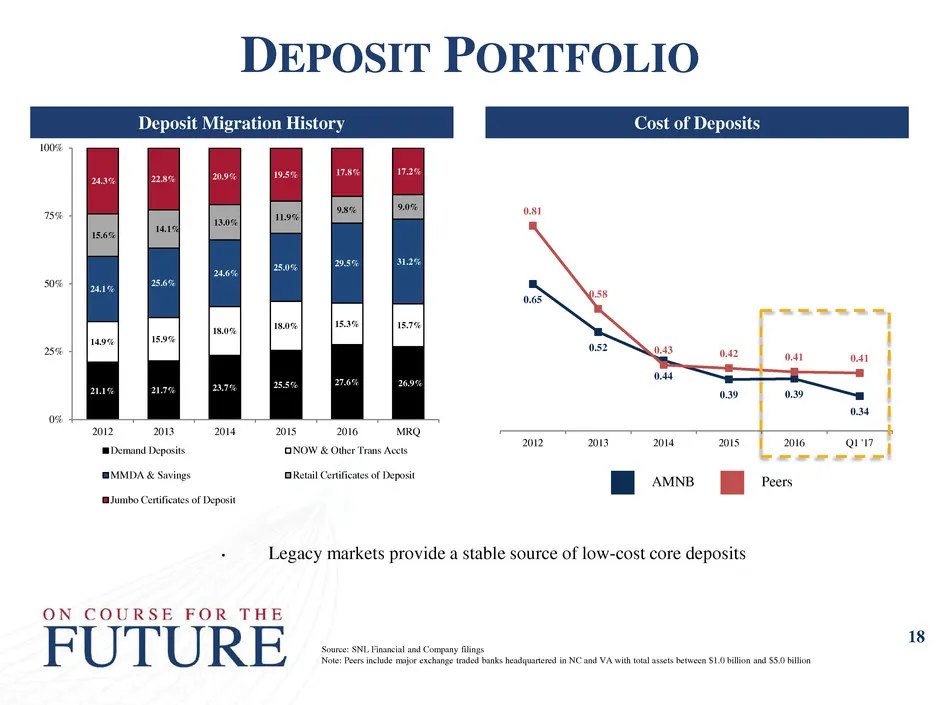
21.1% 21.7% 23.7% 25.5% 27.6% 26.9% 14.9% 15.9% 18.0% 18.0% 15.3% 15.7% 24.1% 25.6% 24.6% 25.0% 29.5% 31.2% 15.6% 14.1% 13.0% 11.9% 9.8% 9.0% 24.3% 22.8% 20.9% 19.5% 17.8% 17.2% 0% 25% 50% 75% 100% 2012 2013 2014 2015 2016 MRQ Demand Deposits NOW & Other Trans Accts MMDA & Savings Retail Certificate
Slide 19: Securities Portfolio
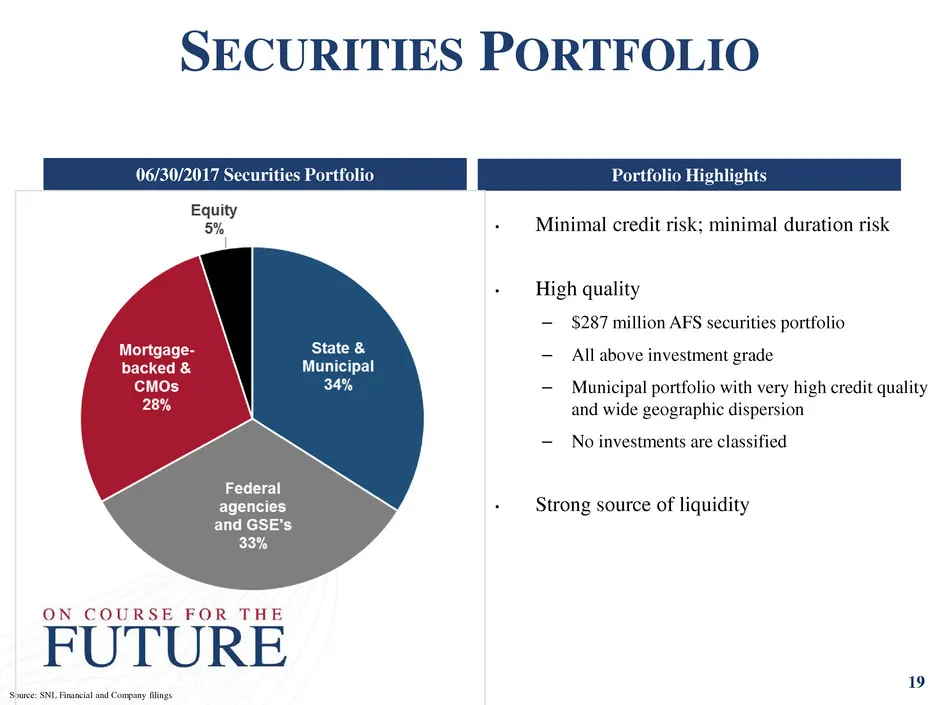
SECURITIES PORTFOLIO Source: SNL Financial and Company filings • Minimal credit risk; minimal duration risk • High quality – $287 million AFS securities portfolio – All above investment grade – Municipal portfolio with very high credit quality and wide geographic dispersion – No investments are clas
Slide 20: Q2 2017 Performance & Recent Accomplishments
Q2 - 2017 PERFORMANCE & RECENT ACCOMPLISHMENTS 20
Slide 21: Q2 2017 Highlights
Q2 2017 HIGHLIGHTS 21 • Annualized loan growth 21% • Diluted EPS: $0.49 (YTD $0.97) • NPAs to Total Assets: 0.40% vs. 0.43% in Q1 2017 • Dividend: $0.24 paid in Q2 – Paid $0.96 full year for 2016
Slide 22: Financial Performance and Peer Comparison
FINANCIAL PERFORMANCE AND PEER COMPARISON 22
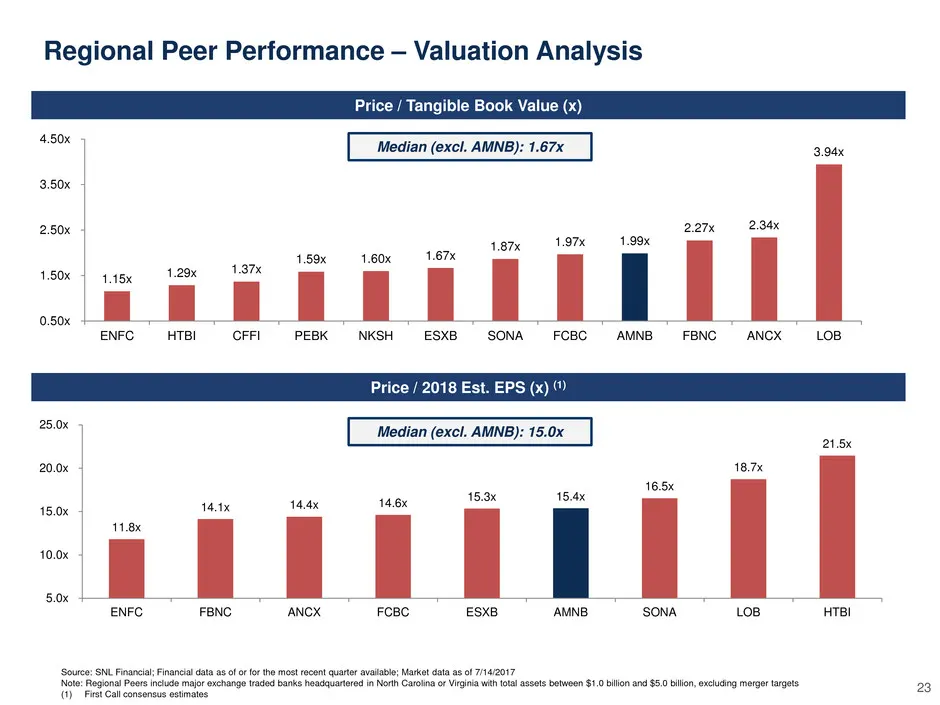
Slide 23: Regional Peer Performance – Valuation Analysis
11.8x 14.1x 14.4x 14.6x 15.3x 15.4x 16.5x 18.7x 21.5x 5.0x 10.0x 15.0x 20.0x 25.0x ENFC FBNC ANCX FCBC ESXB AMNB SONA LOB HTBI 1.15x 1.29x 1.37x 1.59x 1.60x 1.67x 1.87x 1.97x 1.99x 2.27x 2.34x 3.94x 0.50x 1.50x 2.50x 3.50x 4.50x ENFC HTBI CFFI PEBK NKSH ESXB SONA FCBC AMNB FBNC ANCX LOB Price / Tang
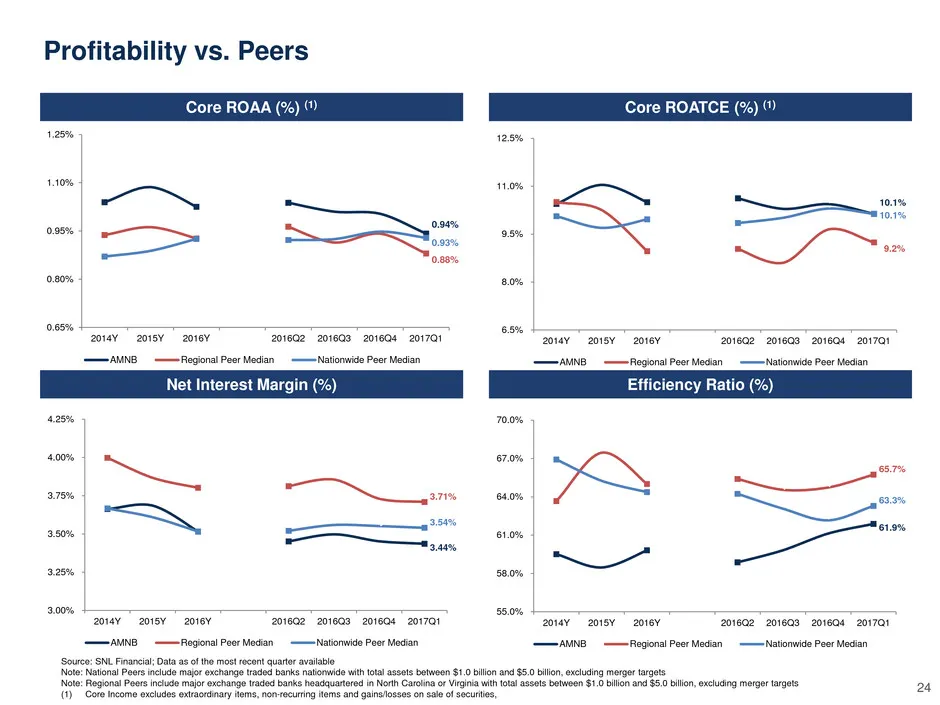
Slide 24: Profitability vs. Peers
Core ROAA (%) (1) Core ROATCE (%) (1) Net Interest Margin (%) Efficiency Ratio (%) Profitability vs. Peers 24 Source: SNL Financial; Data as of the most recent quarter available Note: National Peers include major exchange traded banks nationwide with total assets between $1.0 billion and $5.0 billio
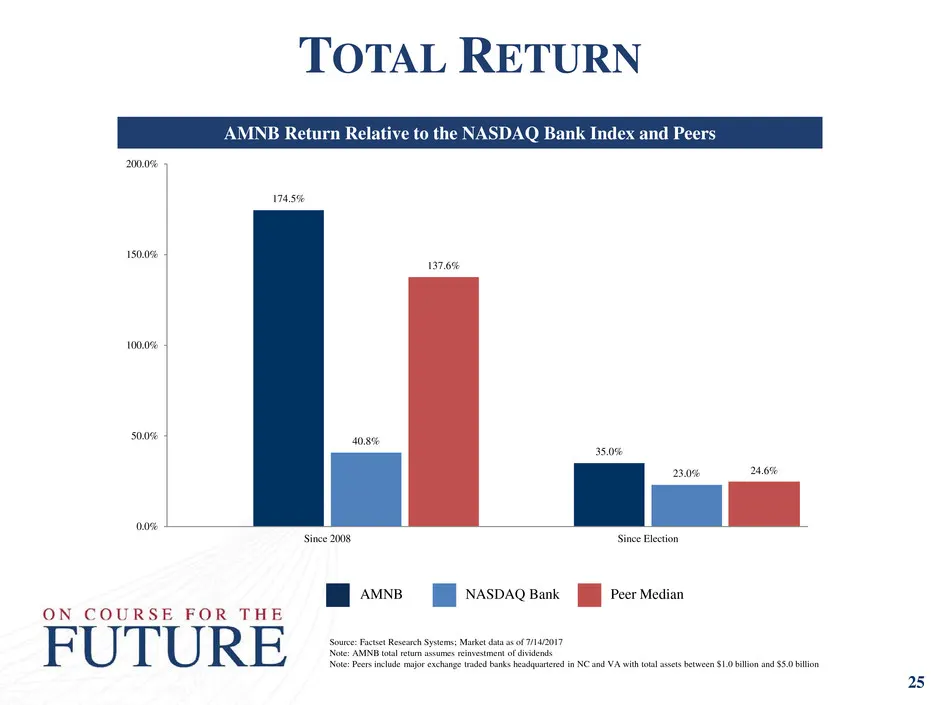
Slide 25: Total Return
TOTAL RETURN AMNB Return Relative to the NASDAQ Bank Index and Peers Source: Factset Research Systems; Market data as of 7/14/2017 Note: AMNB total return assumes reinvestment of dividends Note: Peers include major exchange traded banks headquartered in NC and VA with total assets between $1.0 billi
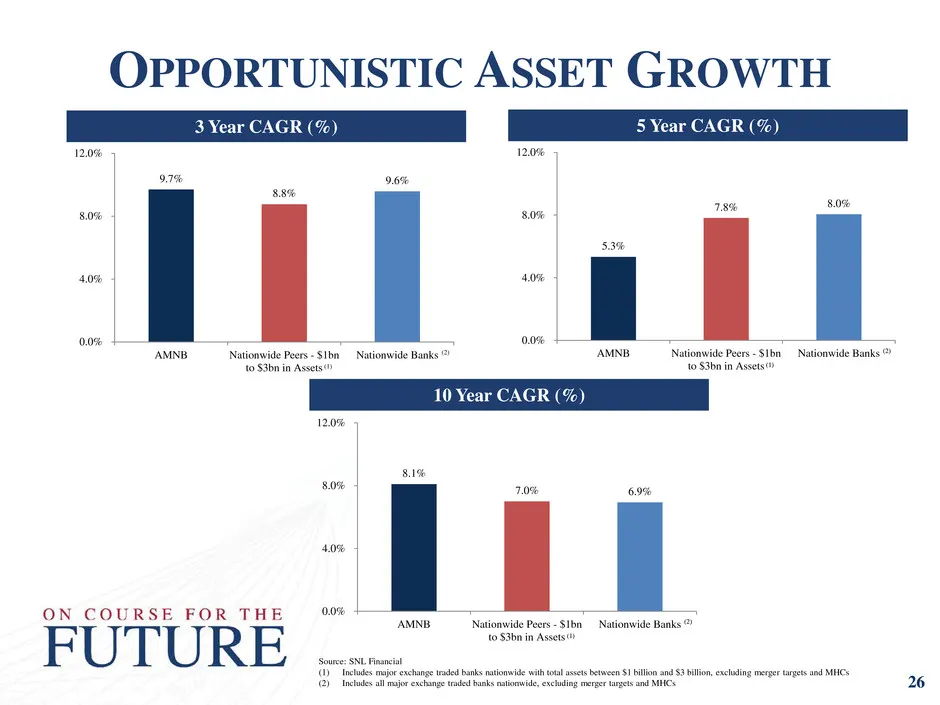
Slide 26: Opportunistic Asset Growth
3 Year CAGR (%) 5 Year CAGR (%) Source: SNL Financial (1) Includes major exchange traded banks nationwide with total assets between $1 billion and $3 billion, excluding merger targets and MHCs (2) Includes all major exchange traded banks nationwide, excluding merger targets and MHCs 9.7% 8.8% 9.6% 0
Slide 27: Trading Multiples Analysis
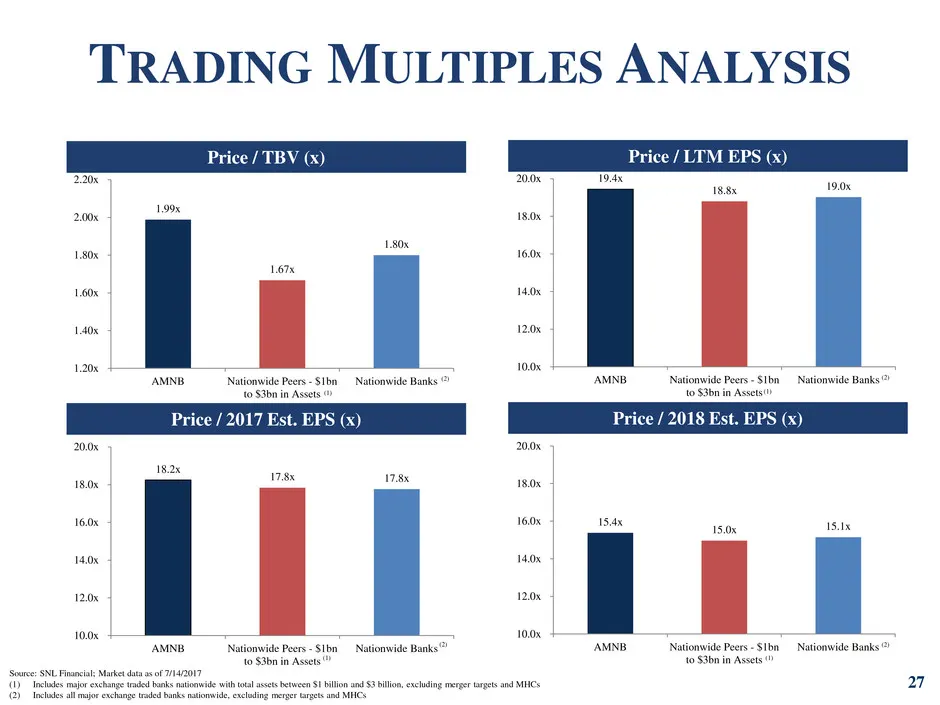
Price / TBV (x) Price / LTM EPS (x) Source: SNL Financial; Market data as of 7/14/2017 (1) Includes major exchange traded banks nationwide with total assets between $1 billion and $3 billion, excluding merger targets and MHCs (2) Includes all major exchange traded banks nationwide, excluding merger
Slide 28: Historical Peer Comparison
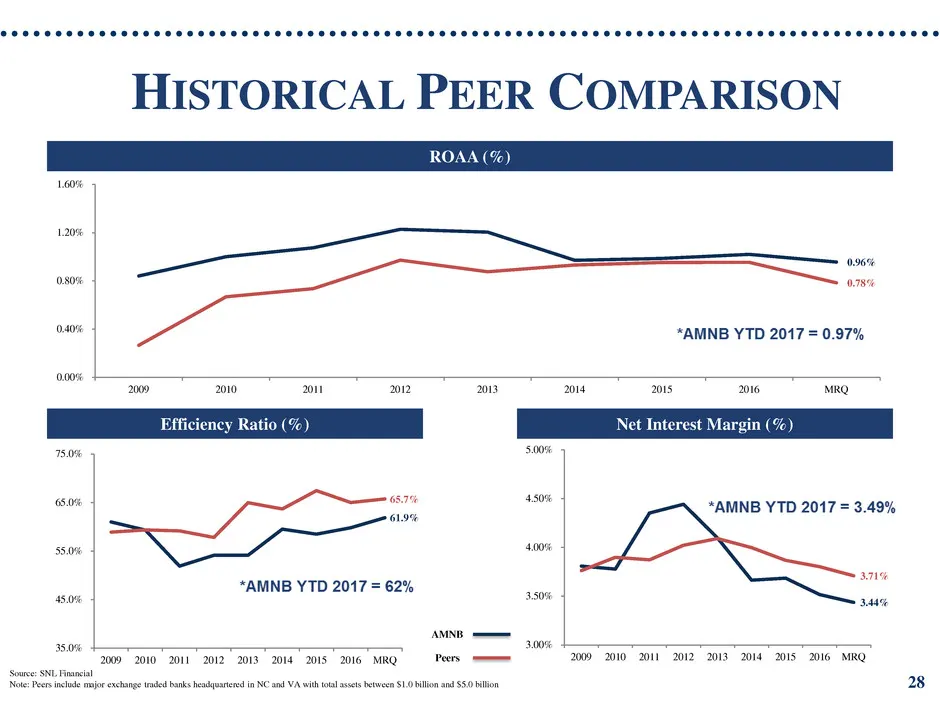
0.96% 0.78% 0.00% 0.40% 0.80% 1.20% 1.60% 2009 2010 2011 2012 2013 2014 2015 2016 MRQ HISTORICAL PEER COMPARISON ROAA (%) Source: SNL Financial Note: Peers include major exchange traded banks headquartered in NC and VA with total assets between $1.0 billion and $5.0 billion Efficiency Ratio (%) Net
Slide 29: Nationwide MRQ Comparison
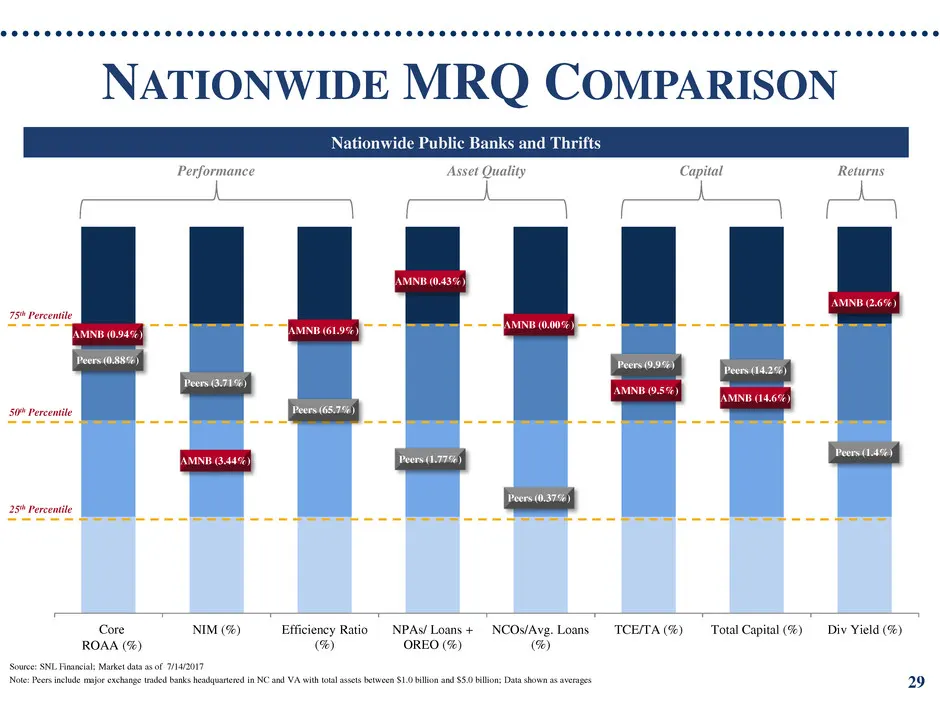
Core ROAA (%) NIM (%) Efficiency Ratio (%) NPAs/ Loans + OREO (%) NCOs/Avg. Loans (%) TCE/TA (%) Total Capital (%) Div Yield (%) NATIONWIDE MRQ COMPARISON Source: SNL Financial; Market data as of 7/14/2017 Note: Peers include major exchange traded banks headquartered in NC and VA with total assets b
Slide 30: Capital Management
CAPITAL MANAGEMENT FUTURE
Slide 31: Capital Management
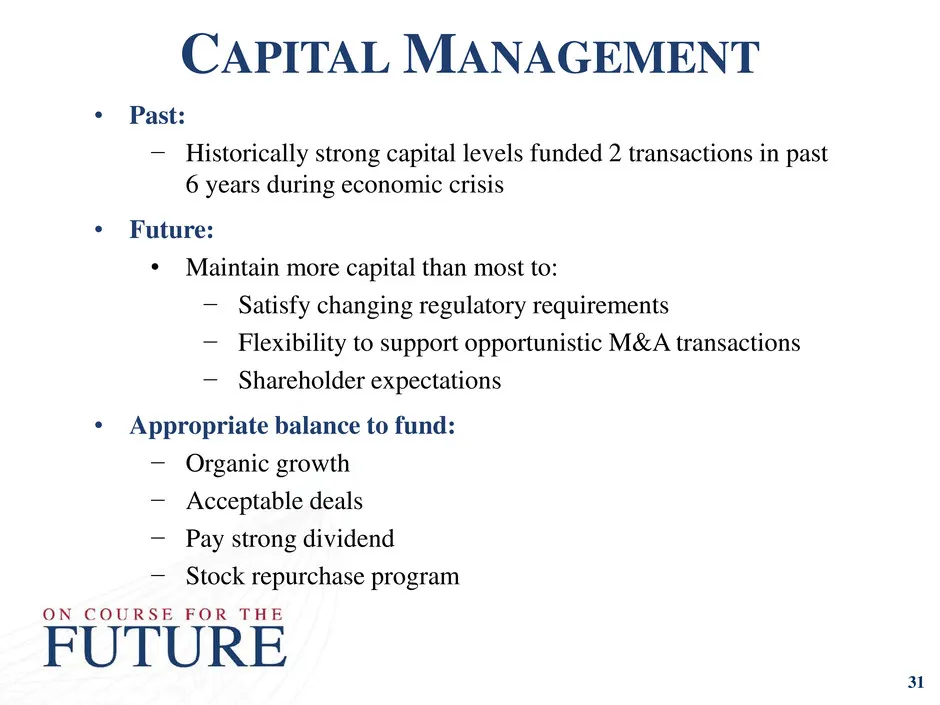
• Past: − Historically strong capital levels funded 2 transactions in past 6 years during economic crisis • Future: • Maintain more capital than most to: − Satisfy changing regulatory requirements − Flexibility to support opportunistic M&A transactions − Shareholder expectations • Appropriate balanc
Slide 32: Capital Ratio Trends
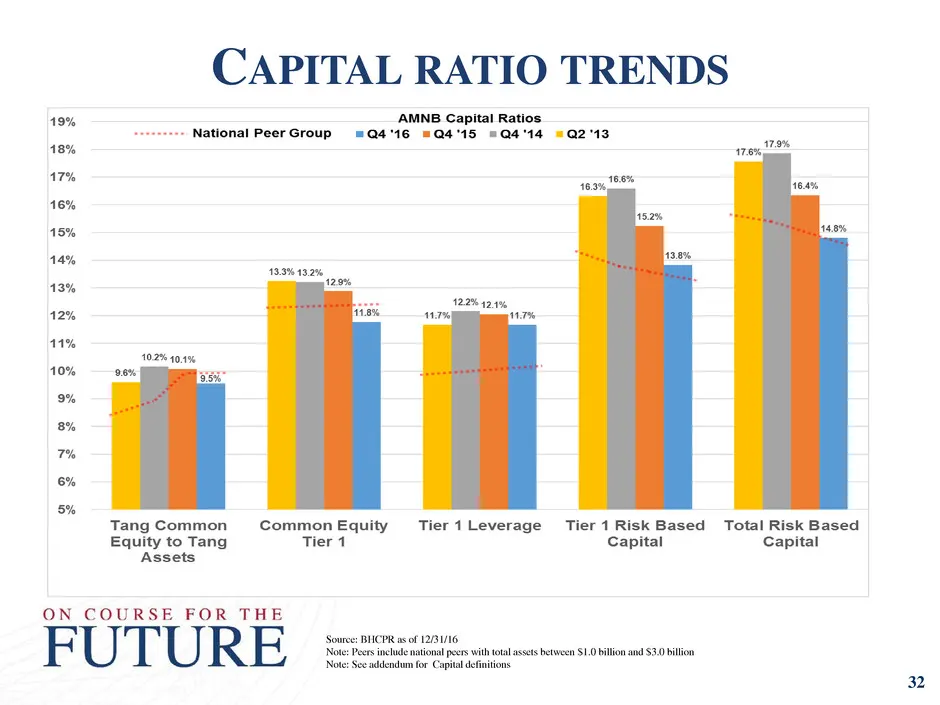
32 CAPITAL RATIO TRENDS Source: BHCPR as of 12/31/16 Note: Peers include national peers with total assets between $1.0 billion and $3.0 billion Note: See addendum for Capital definitions
Slide 33: Capital Ratios vs. Peers
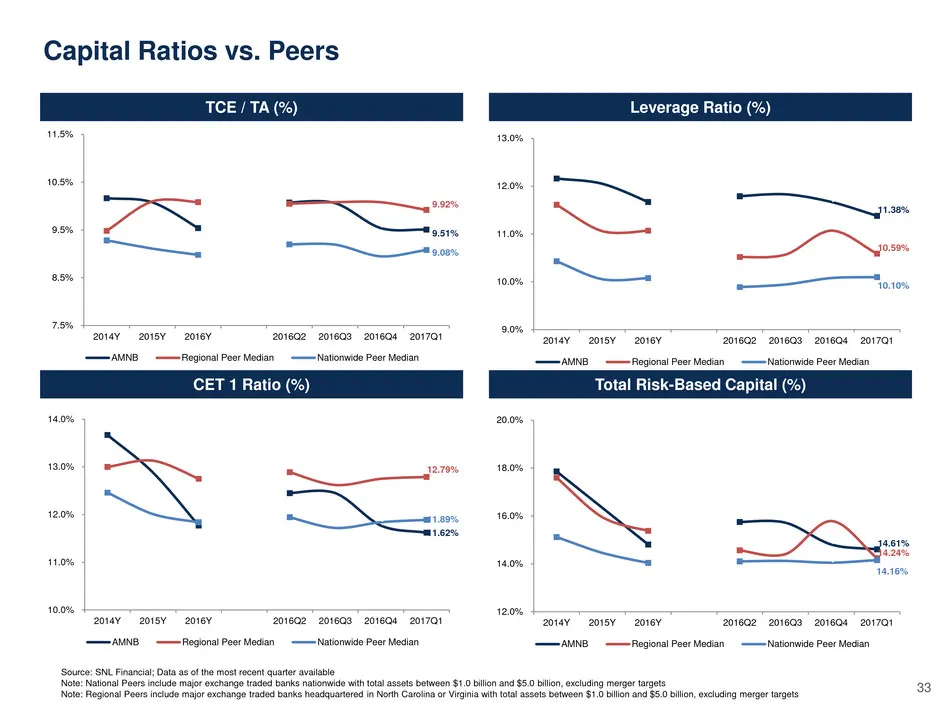
TCE / TA (%) Leverage Ratio (%) CET 1 Ratio (%) Total Risk-Based Capital (%) Capital Ratios vs. Peers 33 Source: SNL Financial; Data as of the most recent quarter available Note: National Peers include major exchange traded banks nationwide with total assets between $1.0 billion and $5.0 billion, ex
Slide 34: Dividends
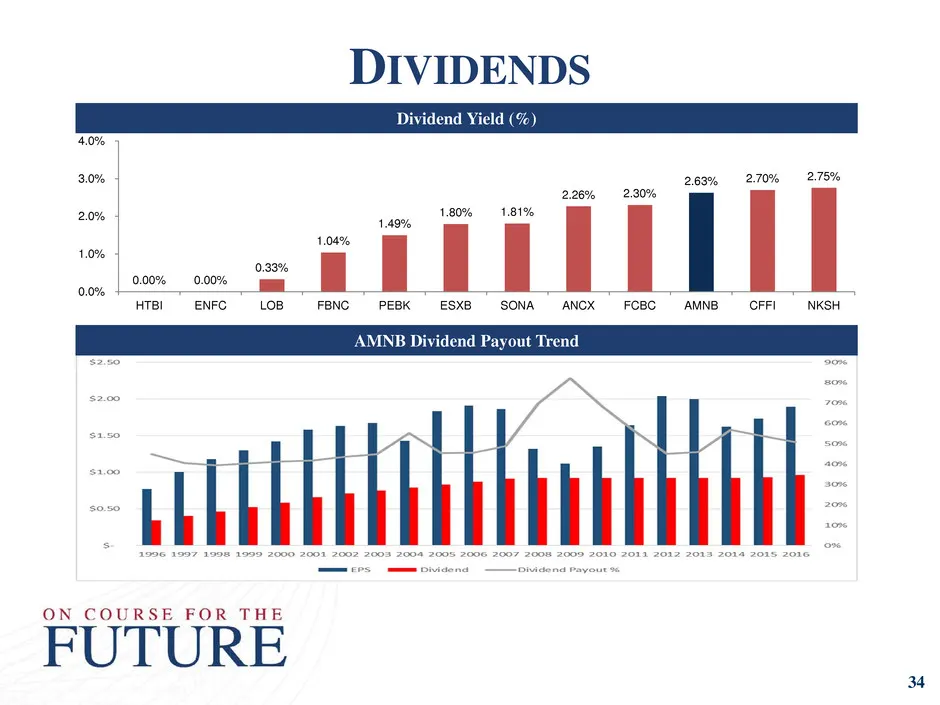
34 0.00% 0.00% 0.33% 1.04% 1.49% 1.80% 1.81% 2.26% 2.30% 2.63% 2.70% 2.75% 0.0% 1.0% 2.0% 3.0% 4.0% HTBI ENFC LOB FBNC PEBK ESXB SONA ANCX FCBC AMNB CFFI NKSH DIVIDENDS Dividend Yield (%) AMNB Dividend Payout Trend
Slide 35: Opportunistic Acquisition Strategy
OPPORTUNISTIC ACQUISITION STRATEGY • Fair value accounting changed the game • Capital is necessary to be a player • Focused on growth markets in NC and VA • Characteristics of targets: – $250 million-$750 million size – Practical assimilation – Manageable credit issues – Compatible cultures – EPS ac
Slide 36: Why Invest in American National?
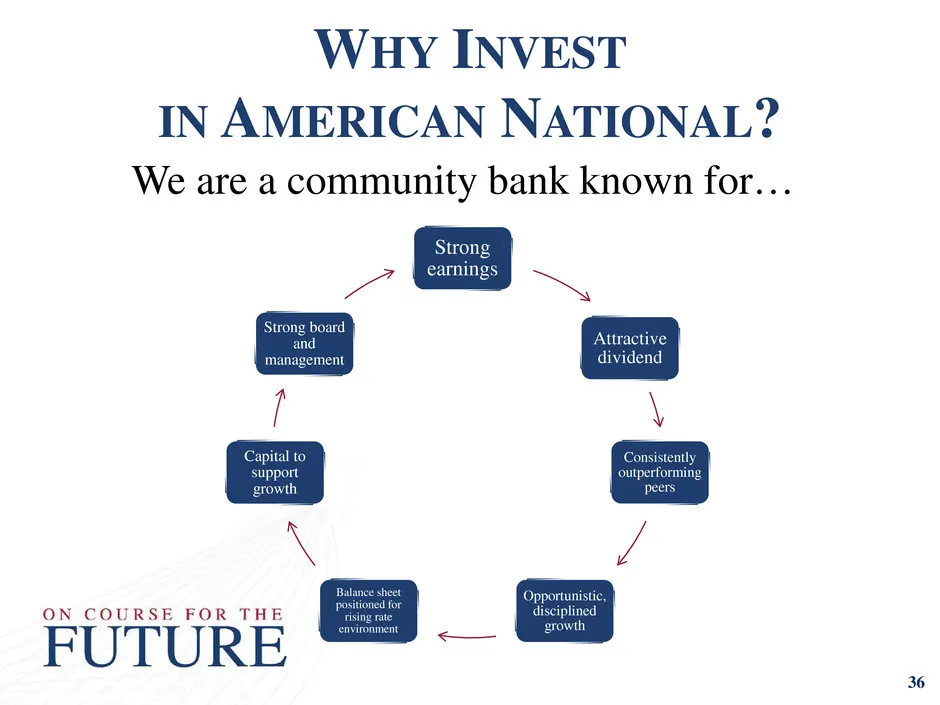
We are a community bank known for… WHY INVEST IN AMERICAN NATIONAL? 36 Strong earnings Attractive dividend Consistently outperforming peers Opportunistic, disciplined growth Balance sheet positioned for rising rate environment Capital to support growth Strong board and management
Slide 37: Industries in AMNB Markets
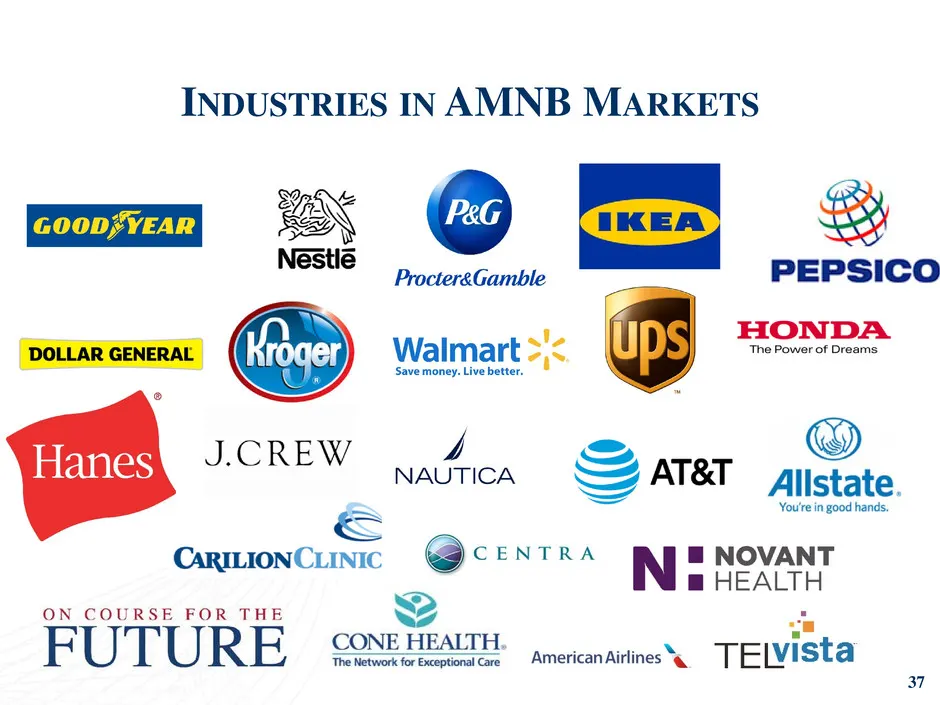
INDUSTRIES IN AMNB MARKETS 37
Slide 38: Colleges and Universities in AMNB Markets
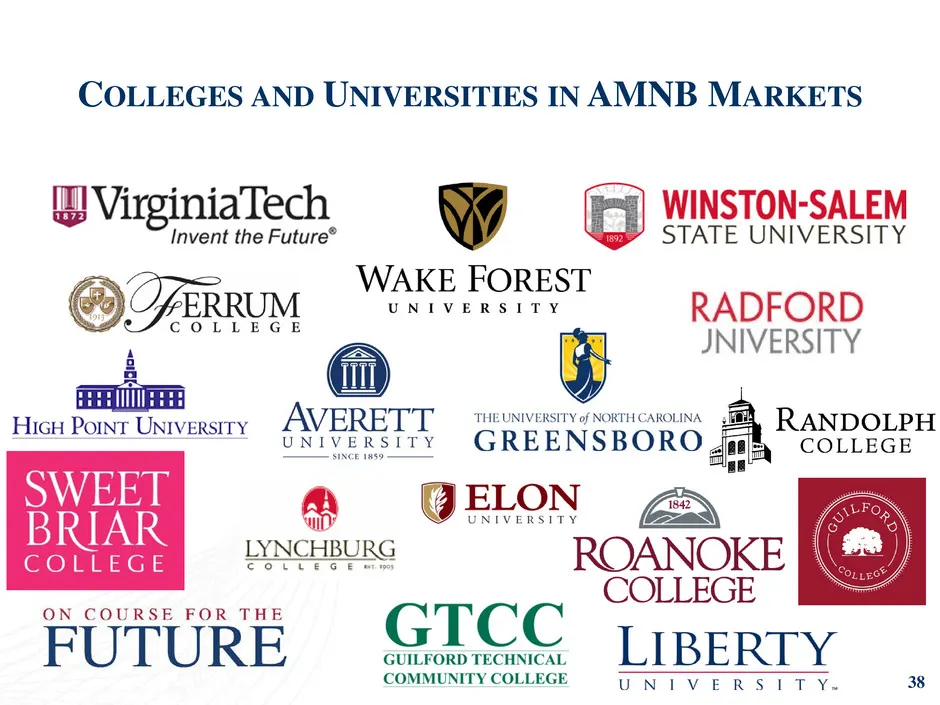
COLLEGES AND UNIVERSITIES IN AMNB MARKETS 38

Slide 39: Questions?
39 QUESTIONS?
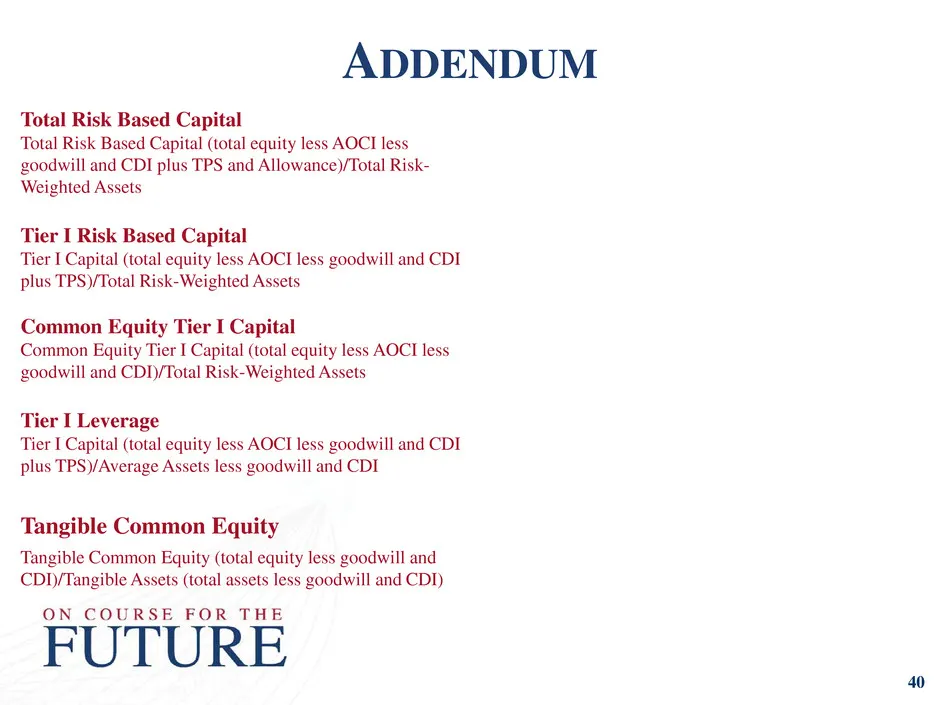
Slide 40: Addendum: Capital Definitions
Total Risk Based Capital Total Risk Based Capital (total equity less AOCI less goodwill and CDI plus TPS and Allowance)/Total Risk- Weighted Assets Tier I Risk Based Capital Tier I Capital (total equity less AOCI less goodwill and CDI plus TPS)/Total Risk-Weighted Assets Common Equity Tier I Capital
Source: SEC EDGAR · 8-K filed Jul 31, 2017
More decks from American National Bankshares Inc
 Investor Presentation (July 2022)32 slides · Jul 27, 2022
 Investor Presentation (June 2022)32 slides · Jun 14, 2022
 Investor Presentation (May 2021)34 slides · May 28, 2021
 Investor Presentation (July 2019)47 slides · Jul 29, 2019
 Investor Presentation (July 2019)47 slides · Jul 8, 2019
 Investor Presentation (March 2019)42 slides · Mar 25, 2019