Hudson Valley — Investor Day (November 2014)
52 slides from Hudson Valley's investor day presentation, Nov 19, 2014
Slide 1: 2014 Investor Day
2014 Investor Day November 19, 2014
Slide 2: Forward Looking Statements
Forward Looking Statements The information presented herein contains forward looking statements within the meaning of the Private Securities Litigation Reform Act of 1995 giving Sterling Bancorp (“Sterling” or “STL”) expectations or predictions of future financial or business performance or conditio
Slide 3: Additional information about the proposed transaction
Investors and security holders are urged to carefully review and consider each of Sterling Bancorp’s and Hudson Valley Holding Corp.’s public filings with the SEC, including but not limited to their Annual Reports on Form 10-K, their proxy statements, their Current Reports on Form 8-K and their Quar
Slide 4: Agenda
Agenda Sterling Bancorp Today Strategic Platform and Objectives Strategic Initiatives: 2015 and Beyond Business Line Performance M&A Update Questions and Answers
Slide 5: Sterling Bancorp Today
Sterling Bancorp Today
Slide 6: Sterling Bancorp Today
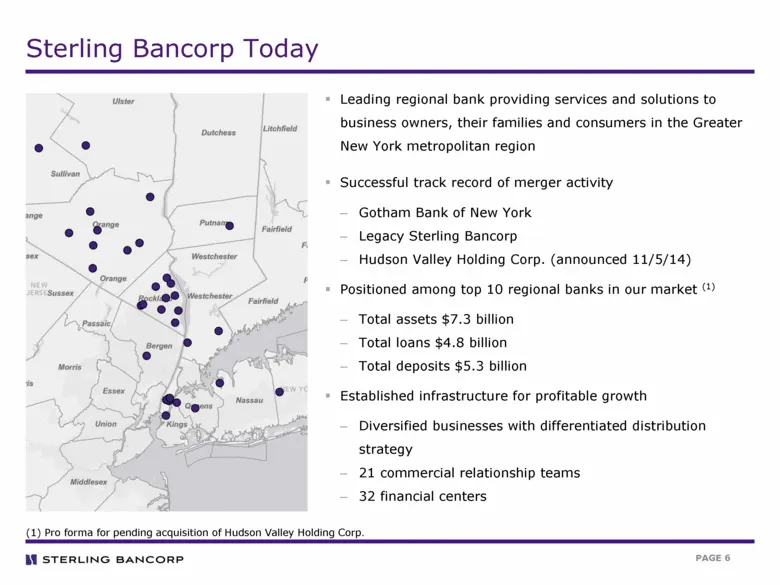
Sterling Bancorp Today Leading regional bank providing services and solutions to business owners, their families and consumers in the Greater New York metropolitan region Successful track record of merger activity Gotham Bank of New York Legacy Sterling Bancorp Hudson Valley Holding Corp. (announced
Slide 7: On-Track to Becoming a High Performing Regional Bank
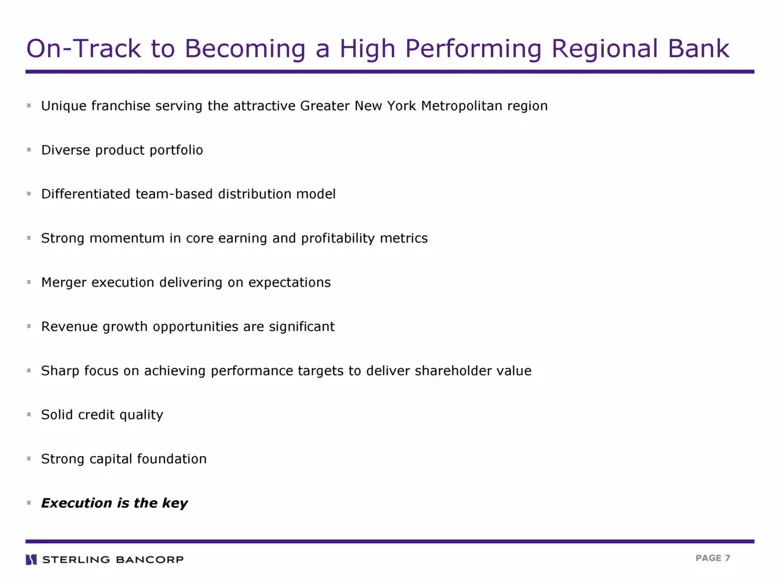
On-Track to Becoming a High Performing Regional Bank Unique franchise serving the attractive Greater New York Metropolitan region Diverse product portfolio Differentiated team-based distribution model Strong momentum in core earning and profitability metrics Merger execution delivering on expectatio
Slide 8: Reconciliation of GAAP Earnings to Core Earnings
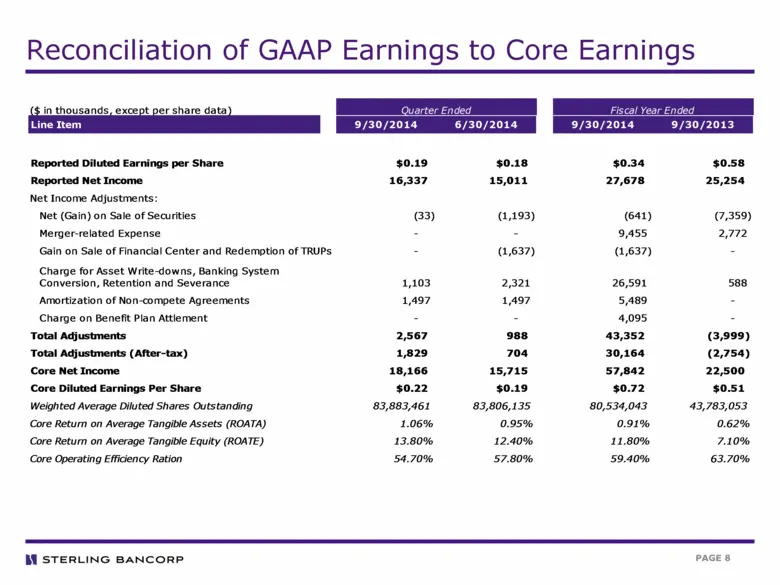
Reconciliation of GAAP Earnings to Core Earnings ($ in thousands, except per share data) Line Item 9/30/2014 6/30/2014 9/30/2014 9/30/2013 Reported Diluted Earnings per Share $0.19 $0.18 $0.34 $0.58 Reported Net Income 16,337 15,011 27,678 25,254 Net Income Adjustments: Net (Gain) on Sale of Securit
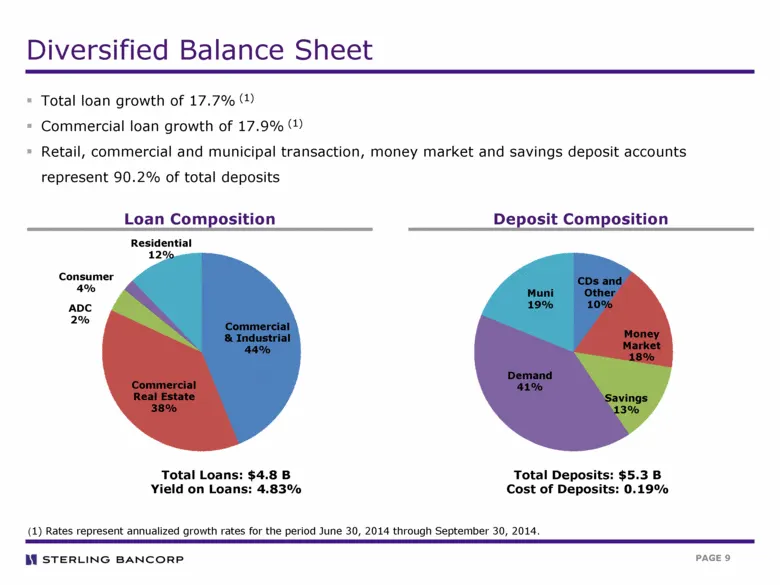
Slide 9: Diversified Balance Sheet
Diversified Balance Sheet Total loan growth of 17.7% (1) Commercial loan growth of 17.9% (1) Retail, commercial and municipal transaction, money market and savings deposit accounts represent 90.2% of total deposits Total Loans: $4.8 B Yield on Loans: 4.83% Total Deposits: $5.3 B Cost of Deposits: 0.
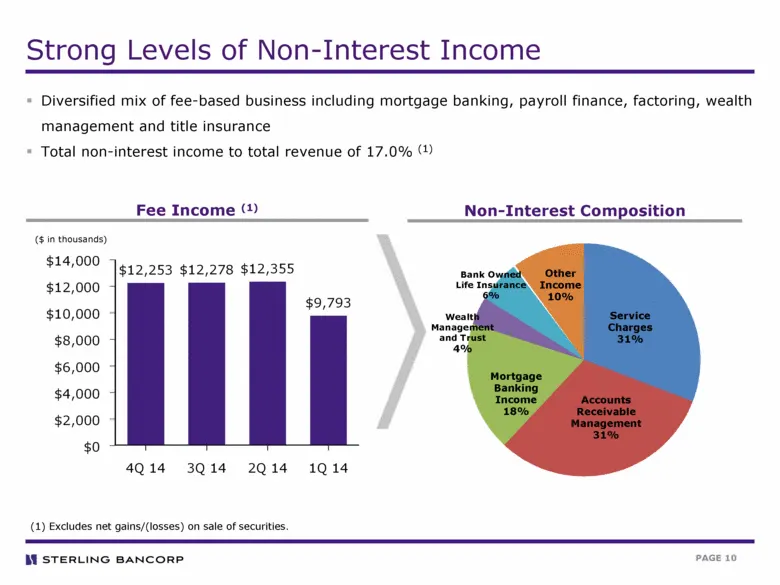
Slide 10: Strong Levels of Non-Interest Income
Strong Levels of Non-Interest Income Diversified mix of fee-based business including mortgage banking, payroll finance, factoring, wealth management and title insurance Total non-interest income to total revenue of 17.0% (1) (1) Excludes net gains/(losses) on sale of securities. Other Income 10% Acc
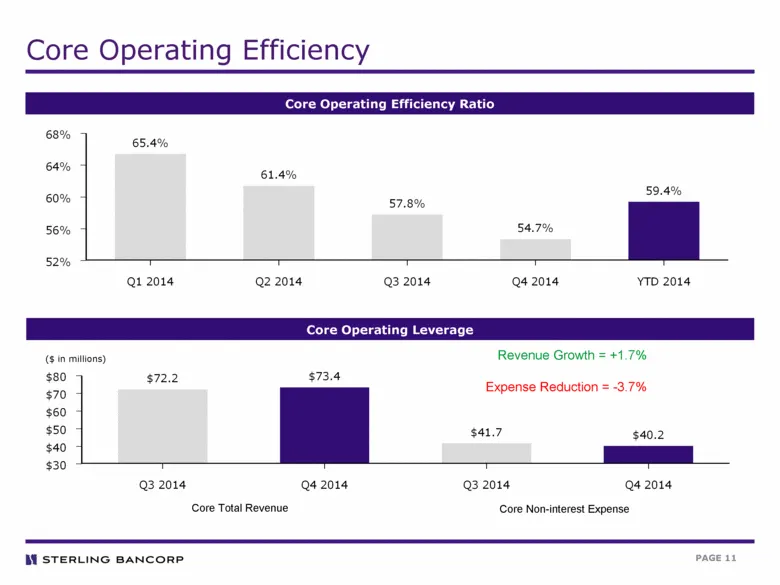
Slide 11: Core Operating Efficiency
Core Operating Efficiency Core Operating Efficiency Ratio Core Operating Leverage Revenue Growth = +1.7% Expense Reduction = -3.7% Core Total Revenue Core Non-interest Expense ($ in millions)
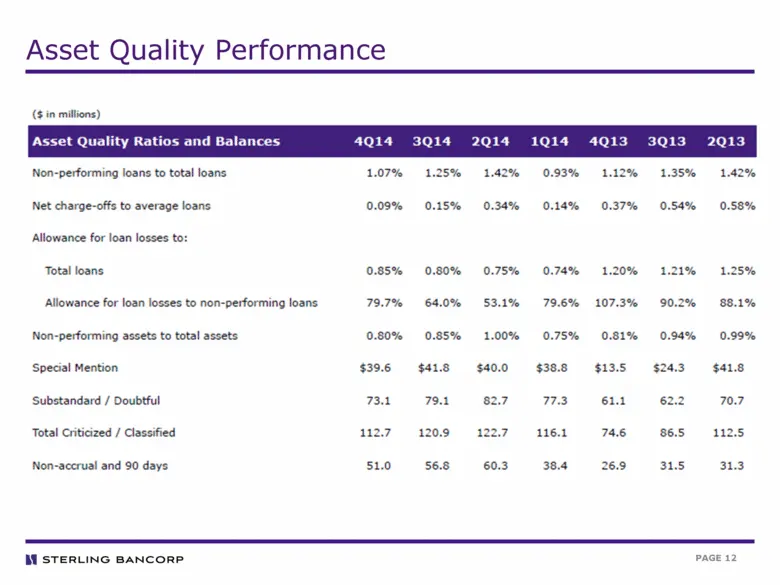
Slide 12: Asset Quality Performance
Asset Quality Performance ($ in millions) Asset Quality Ratios and Balances 4Q14 3Ql4 2Q14 1Q14 4Q13 3Q13 2Q13 Non-performing loans to total loans 1.07% 1.25% 1.42% 0.93% 1.12% 1.35% 1.42% Net charge-offs to average loans 0.09% 0.15% 0.34% 0.14% 0.37% 0. 54% 0.58% Allowance for loan losses to: Total
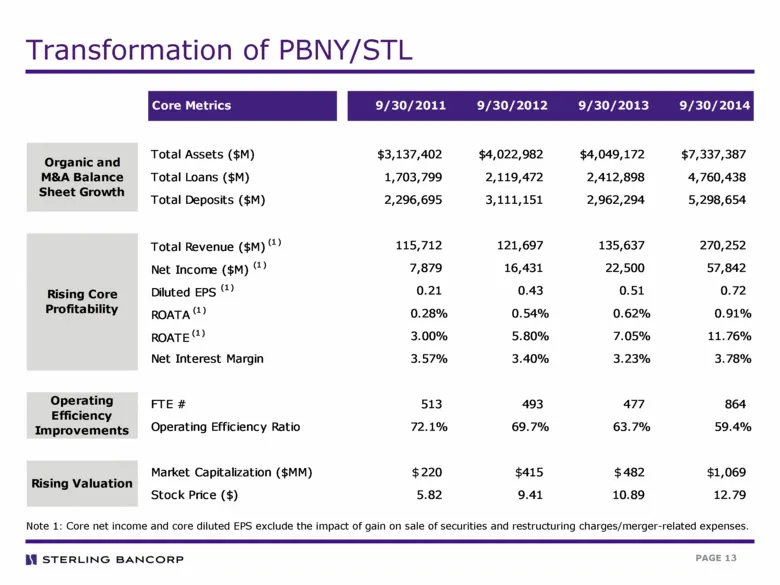
Slide 13: Transformation of PBNY/STL
Transformation of PBNY/STL Note 1: Core net income and core diluted EPS exclude the impact of gain on sale of securities and restructuring charges/merger-related expenses. $ $ $ $ Core Metrics 9/30/2011 9/30/2012 9/30/2013 9/30/2014 Total Assets ($M) $3,137,402 $4,022,982 $4,049,172 $7,337,387 Total
Slide 14: Strategic Platform and Objectives
Strategic Platform and Objectives
Slide 15: Our Mission and Objectives
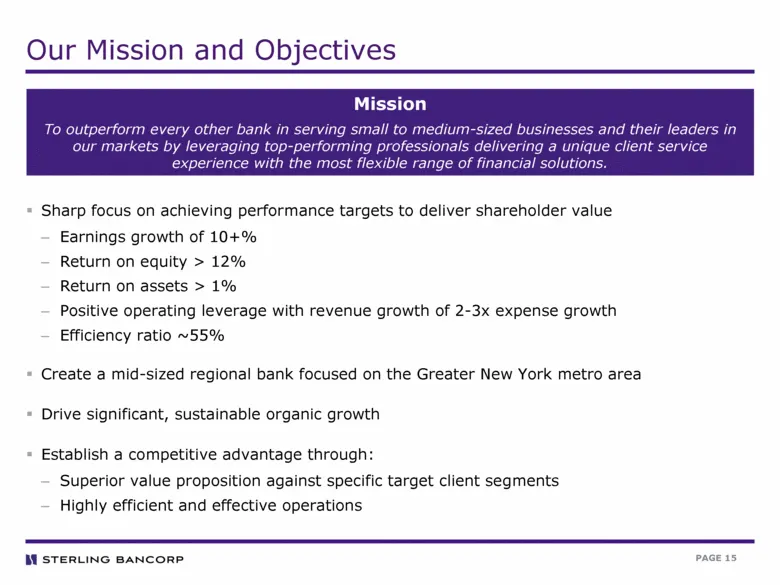
Our Mission and Objectives Sharp focus on achieving performance targets to deliver shareholder value Earnings growth of 10+% Return on equity > 12% Return on assets > 1% Positive operating leverage with revenue growth of 2-3x expense growth Efficiency ratio ~55% Create a mid-sized regional bank focu
Slide 16: Our Strategic Principles
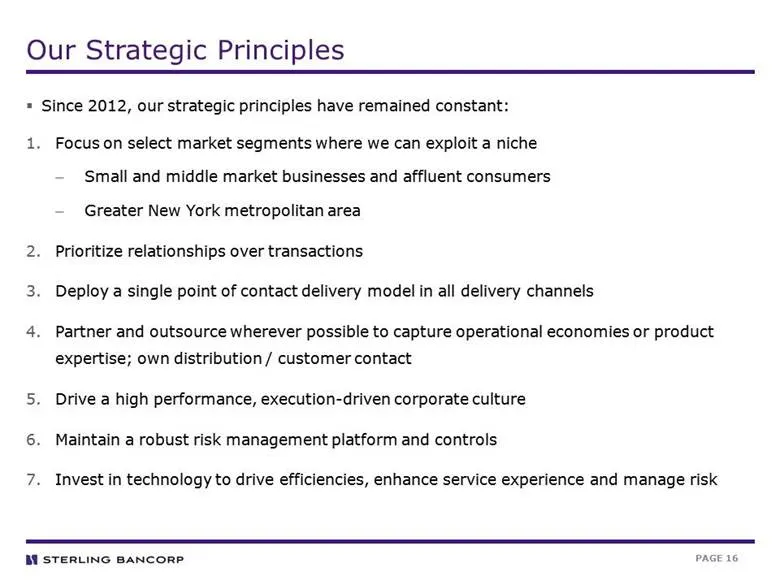
Since 2012, our strategic principles have remained constant: Focus on select market segments where we can exploit a niche Small and middle market businesses and affluent consumers Greater New York metropolitan area Prioritize relationships over transactions Deploy a single point of contact delivery
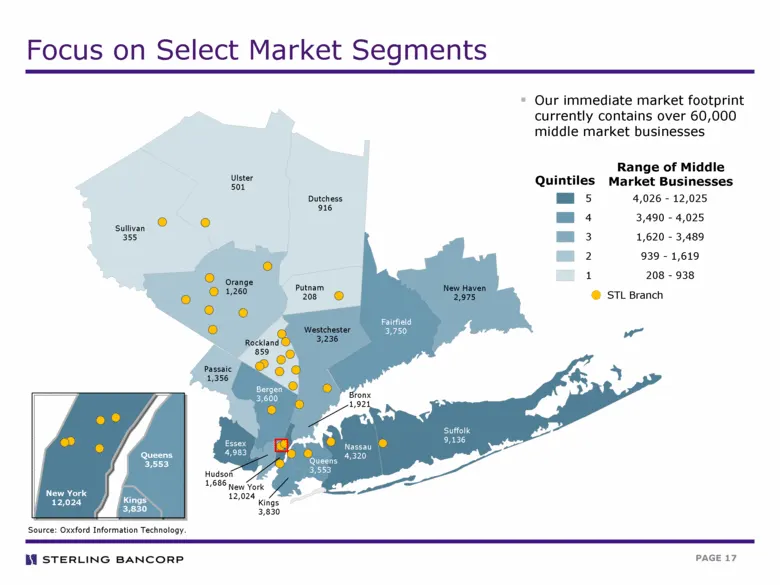
Slide 17: Focus on Select Market Segments
Source: Oxxford Information Technology. New Haven 2,975 Fairfield 3,750 Hudson 1,686 Essex 4,983 Bergen 3,600 Passaic 1,356 Queens 3,553 New York 12,024 Nassau 4,320 Bronx 1,921 Suffolk 9,136 Rockland 859 Westchester 3,236 Putnam 208 Orange 1,260 Sullivan 355 Dutchess 916 Ulster 501 Kings 3,830 4,02
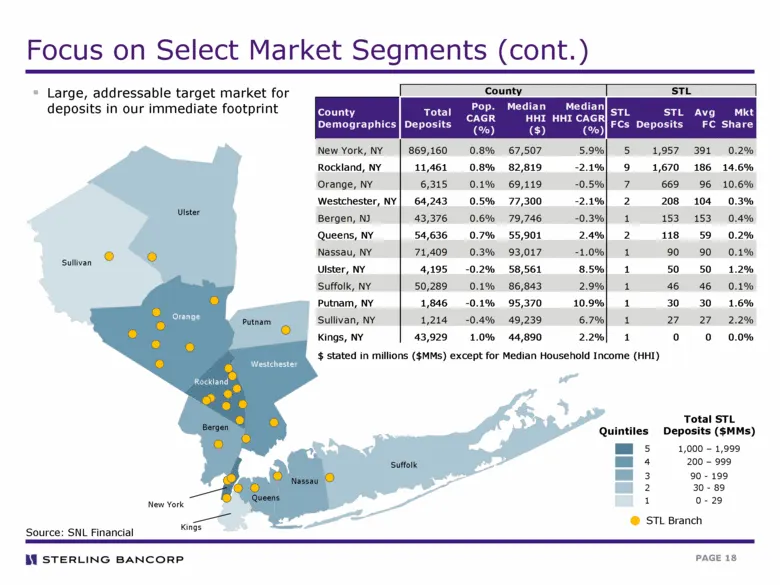
Slide 18: Focus on Select Market Segments (cont.)
Bergen Queens New York Nassau Suffolk Rockland Westchester Putnam Orange Sullivan Ulster Kings 1,000 – 1,999 200 – 999 90 - 199 30 - 89 0 - 29 Total STL Deposits ($MMs) Quintiles 5 4 3 2 1 STL Branch Large, addressable target market for deposits in our immediate footprint Focus on Select Market Segm
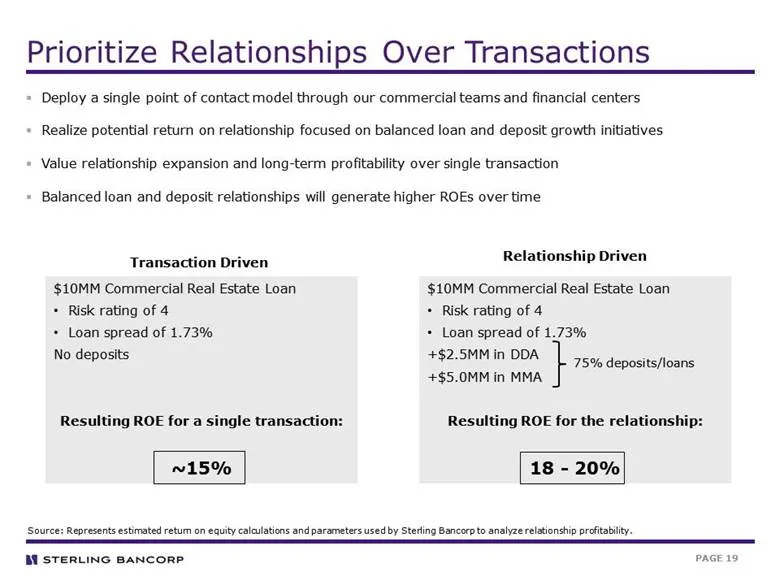
Slide 19: Prioritize Relationships Over Transactions
Prioritize Relationships Over Transactions $10MM Commercial Real Estate Loan Risk rating of 4 Loan spread of 1.73% No deposits Resulting ROE for a single transaction: ~15% Transaction Driven Relationship Driven $10MM Commercial Real Estate Loan Risk rating of 4 Loan spread of 1.73% +$2.5MM in DDA +$
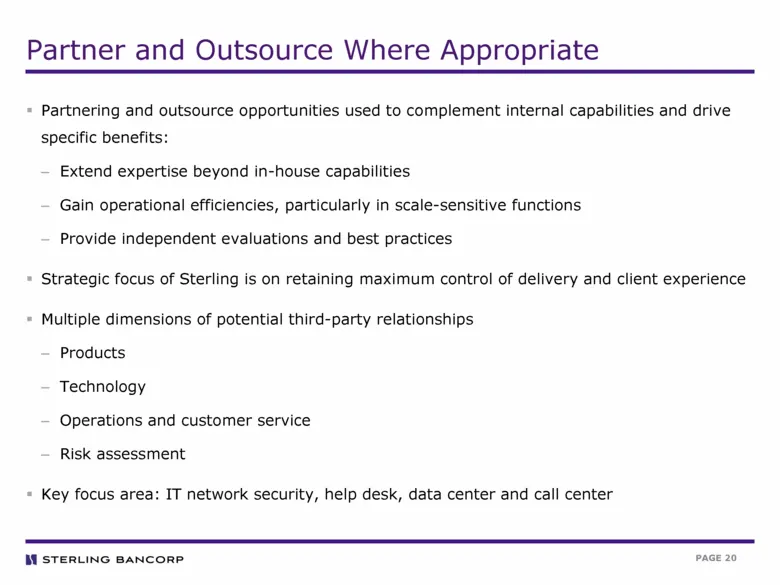
Slide 20: Partner and Outsource Where Appropriate
Partner and Outsource Where Appropriate Partnering and outsource opportunities used to complement internal capabilities and drive specific benefits: Extend expertise beyond in-house capabilities Gain operational efficiencies, particularly in scale-sensitive functions Provide independent evaluations
Slide 21: Drive High Performance, Execution-Driven Culture
Drive High Performance, Execution-Driven Culture Recruit and develop talent exhibiting core values Provide clear message regarding goals and objectives for the Company, business units and individuals Balanced scorecards deployed across the entire enterprise Performance measured on both results and e
Slide 22: Maintain a Robust Risk Management Capability
Maintain a Robust Risk Management Capability Actively measure and manage across all dimensions of risk Executive level focus and strong Board level reporting and accountability Risk measures and accountability embedded in business units with centralized monitoring and oversight Deploy contemporary a
Slide 23: Selectively Invest in Technology
Selectively Invest in Technology Deploy technology to enhance business operations Client service experience Efficiencies and productivity Management information Risk management Extensively utilize third-party providers for licensed software and hosted services; limit proprietary and custom developme

Slide 24: Strategic Initiatives: 2015 and Beyond
Strategic Initiatives: 2015 and Beyond
Slide 25: Key Initiatives For 2015 and Beyond
Key Initiatives For 2015 and Beyond Successful merger and integration of Hudson Valley Continued deployment of Commercial Banking Team Strategy Further diversify business mix through organic growth and opportunistic M&A Leverage mortgage banking business as key component of private banking / wealth
Slide 26: Commercial Banking Team Strategy
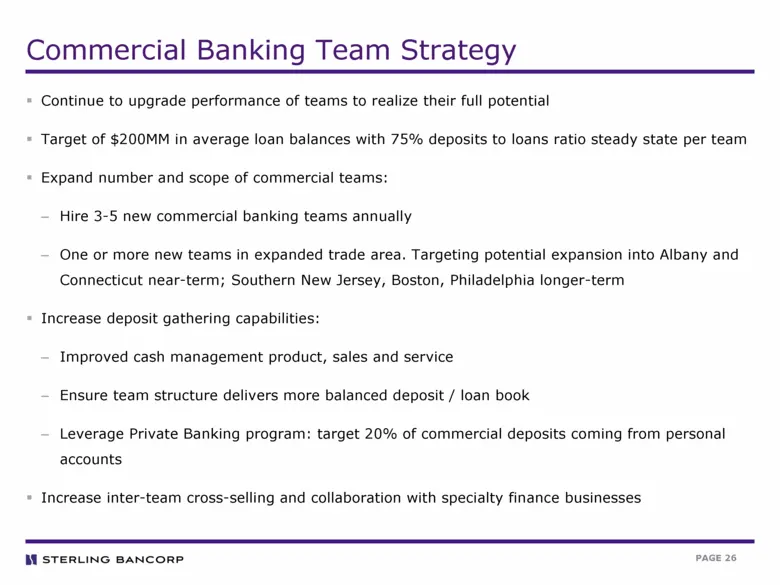
Commercial Banking Team Strategy Continue to upgrade performance of teams to realize their full potential Target of $200MM in average loan balances with 75% deposits to loans ratio steady state per team Expand number and scope of commercial teams: Hire 3-5 new commercial banking teams annually One o
Slide 27: Evolving Commercial Banking Team Strategy
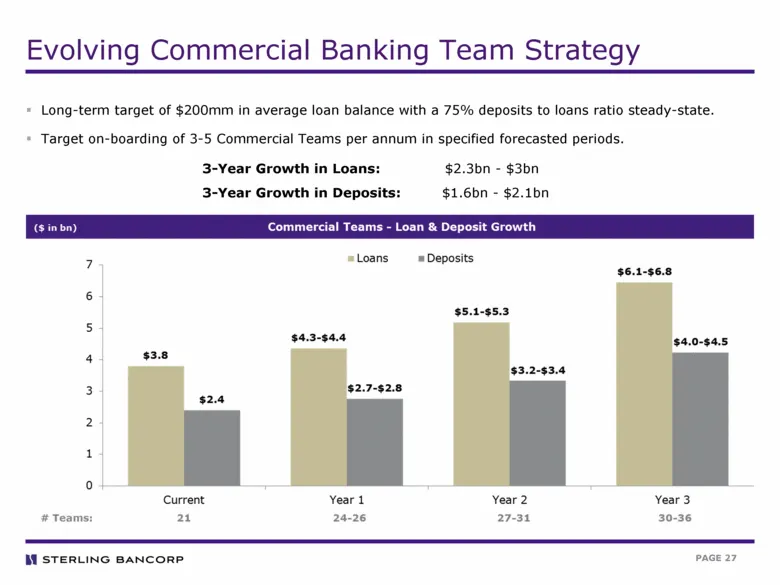
Evolving Commercial Banking Team Strategy Long-term target of $200mm in average loan balance with a 75% deposits to loans ratio steady-state. Target on-boarding of 3-5 Commercial Teams per annum in specified forecasted periods. 3-Year Growth in Loans: $2.3bn - $3bn 3-Year Growth in Deposits: $1.6bn
Slide 28: Transform Our Retail Delivery System
Transform Our Retail Delivery System Changing consumer banking patterns allow us to continue consolidating our financial centers Explore exit of locations that have low growth potential or can be served through other existing locations Create a single point of contact – team based structure Transiti
Slide 29: Strategic Initiatives will Drive Long-Term Value Creation
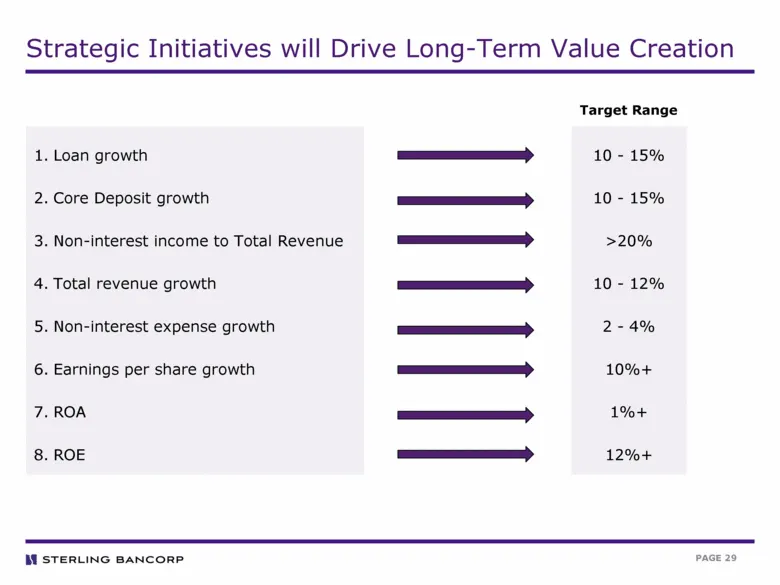
Strategic Initiatives will Drive Long-Term Value Creation Loan growth Core Deposit growth Non-interest income to Total Revenue Total revenue growth Non-interest expense growth Earnings per share growth ROA ROE Target Range 10 - 15% 10 - 15% >20% 10 - 12% 2 - 4% 10%+ 1%+ 12%+

Slide 30: Overview of Business Lines
Overview of Business Lines
Slide 31: Strong, Proven Management Team
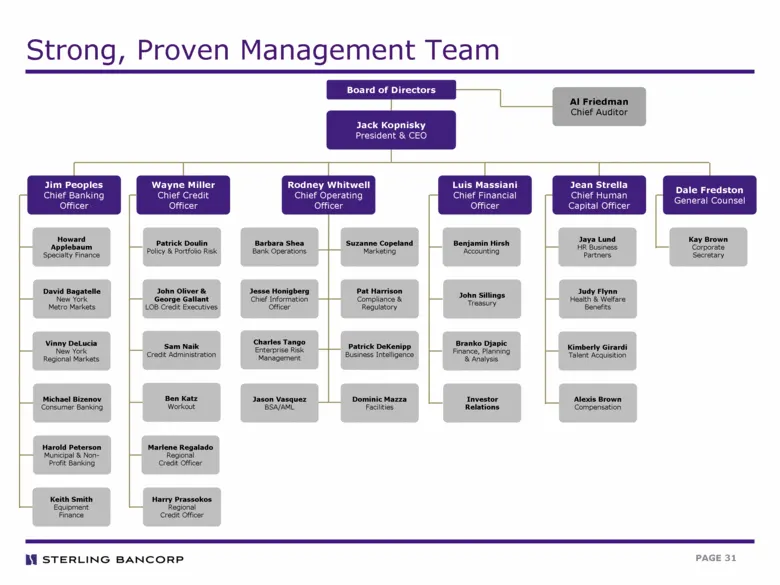
Strong, Proven Management Team Rodney Whitwell Chief Operating Officer Jack Kopnisky President & CEO Al Friedman Chief Auditor Wayne Miller Chief Credit Officer Luis Massiani Chief Financial Officer Jim Peoples Chief Banking Officer Patrick Doulin Policy & Portfolio Risk Jason Vasquez BSA/AML Charle
Slide 32: Broad Array of Client Solutions
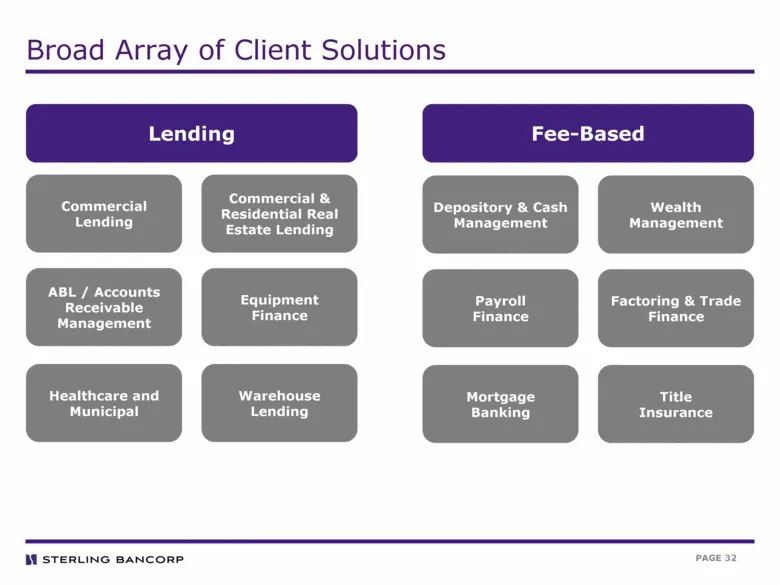
Broad Array of Client Solutions Lending Fee-Based Commercial Lending Commercial & Residential Real Estate Lending ABL / Accounts Receivable Management Equipment Finance Healthcare and Municipal Warehouse Lending Depository & Cash Management Wealth Management Payroll Finance Factoring & Trade Finance
Slide 33: Origination Capabilities Across Broad Asset Classes
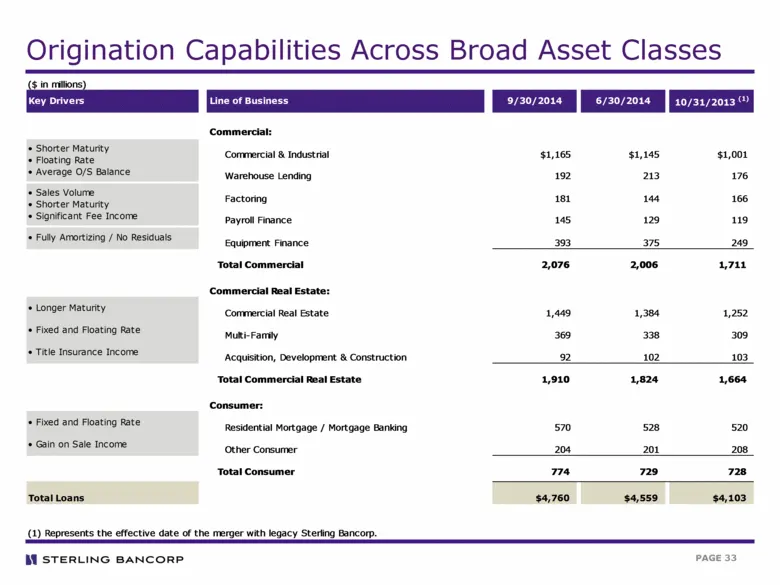
Origination Capabilities Across Broad Asset Classes ($ in millions) Key Drivers Line of Business 9/30/2014 6/30/2014 10/31/2013 (1) Commercial: Commercial & Industrial $1,165 $1,145 $1,001 Warehouse Lending 192 213 176 Factoring 181 144 166 Payroll Finance 145 129 119 • Fully Amortizing / No Residua
Slide 34: Loan Diversity Provides Balance Sheet Flexibility
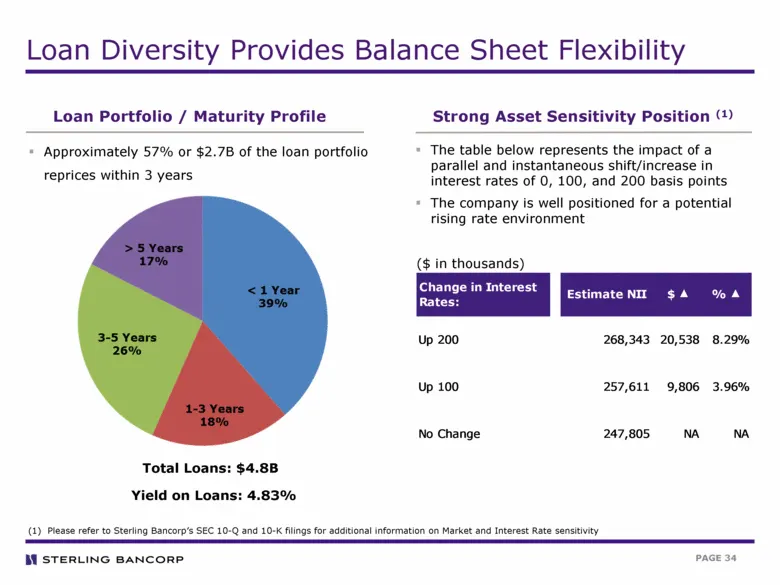
Loan Diversity Provides Balance Sheet Flexibility Loan Portfolio / Maturity Profile Strong Asset Sensitivity Position (1) (1) Please refer to Sterling Bancorp’s SEC 10-Q and 10-K filings for additional information on Market and Interest Rate sensitivity Yield on Loans: 4.83% Total Loans: $4.8B Appro
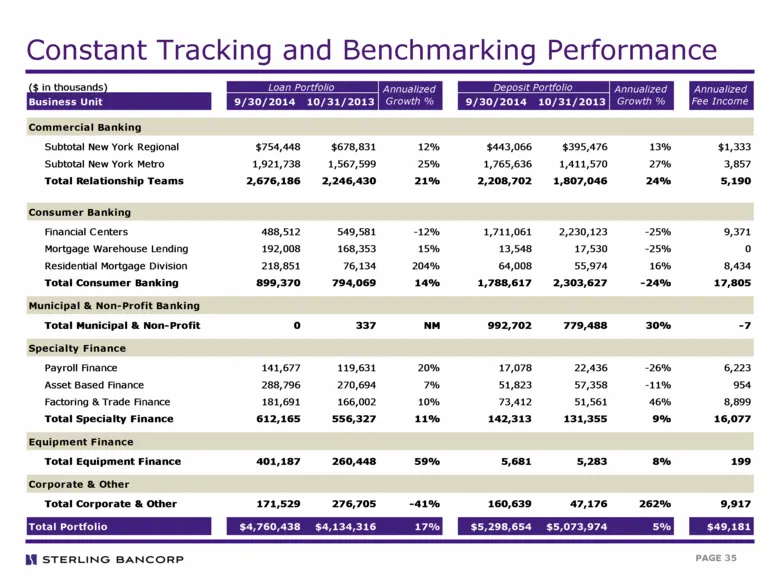
Slide 35: Constant Tracking and Benchmarking Performance
Constant Tracking and Benchmarking Performance ($ in thousands) Business Unit 9/30/2014 10/31/2013 9/30/2014 10/31/2013 Commercial Banking Subtotal New York Regional $754,448 $678,831 12% $443,066 $395,476 13% $1,333 Subtotal New York Metro 1,921,738 1,567,599 25% 1,765,636 1,411,570 27% 3,857 Total
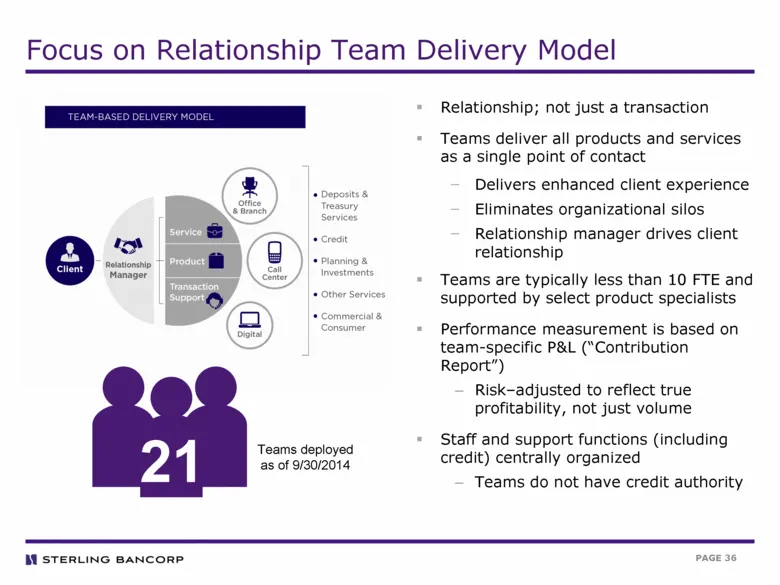
Slide 36: Focus on Relationship Team Delivery Model
Focus on Relationship Team Delivery Model Relationship; not just a transaction Teams deliver all products and services as a single point of contact Delivers enhanced client experience Eliminates organizational silos Relationship manager drives client relationship Teams are typically less than 10 FTE
Slide 37: Contribution Report Overview
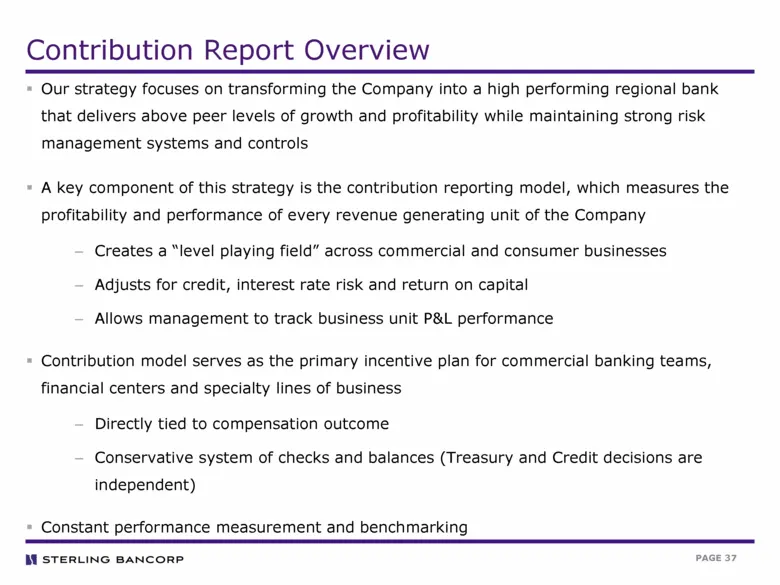
Contribution Report Overview Our strategy focuses on transforming the Company into a high performing regional bank that delivers above peer levels of growth and profitability while maintaining strong risk management systems and controls A key component of this strategy is the contribution reporting
Slide 38: Contribution Report Overview (cont.)
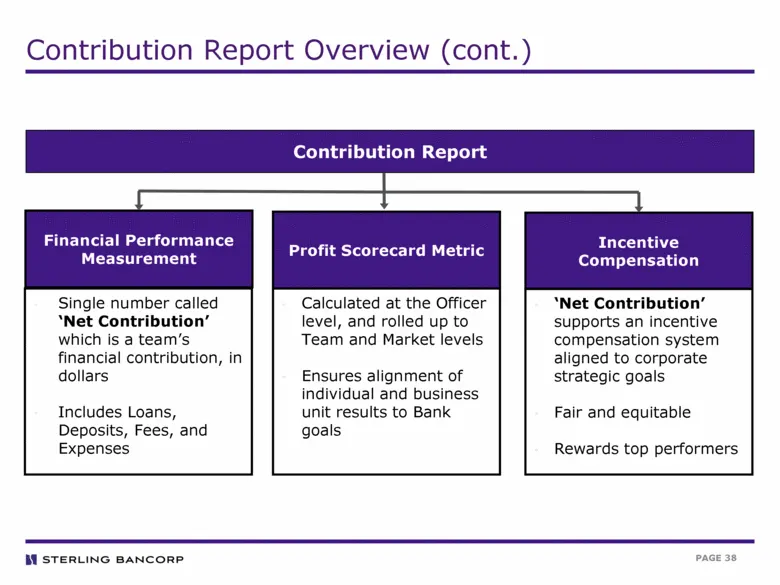
Contribution Report Overview (cont.) Single number called ‘Net Contribution’ which is a team’s financial contribution, in dollars Includes Loans, Deposits, Fees, and Expenses Contribution Report Financial Performance Measurement Incentive Compensation Profit Scorecard Metric Calculated at the Office
Slide 39: Net Contribution Components
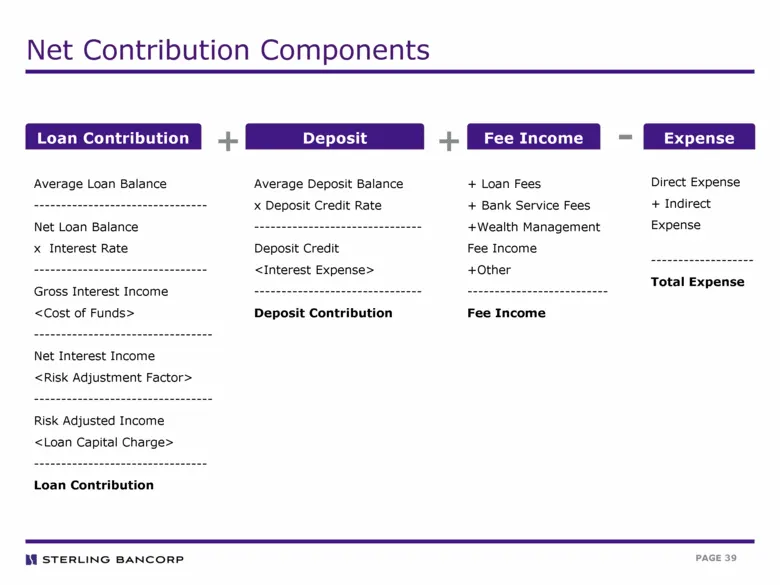
Net Contribution Components Loan Contribution Deposit Contribution + Expense - Average Loan Balance -------------------------------- Net Loan Balance x Interest Rate -------------------------------- Gross Interest Income <Cost of Funds> --------------------------------- Net Interest Income <Risk Adj

Slide 40: Merger & Acquisition Update Hudson Valley Holding Corp.
Merger & Acquisition Update Hudson Valley Holding Corp.
Slide 41: Hudson Valley Transaction Highlights
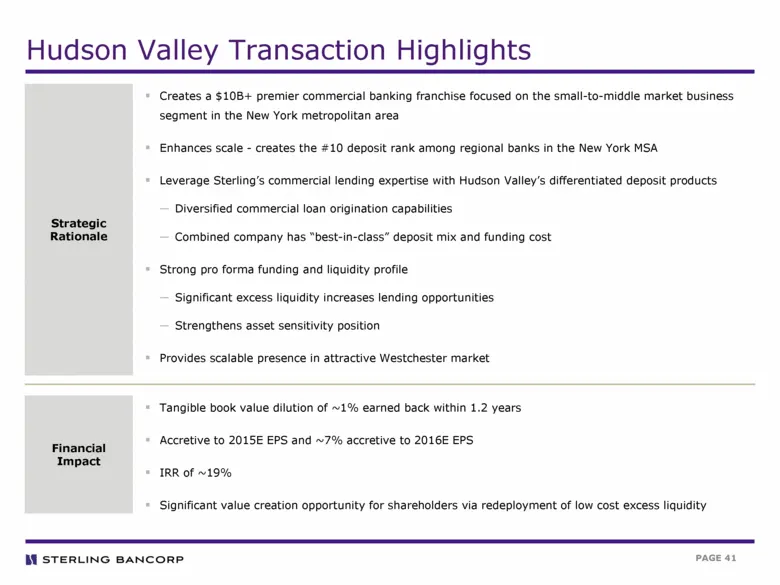
Hudson Valley Transaction Highlights Strategic Rationale Financial Impact Creates a $10B+ premier commercial banking franchise focused on the small-to-middle market business segment in the New York metropolitan area Enhances scale - creates the #10 deposit rank among regional banks in the New York M
Slide 42: Transaction Overview
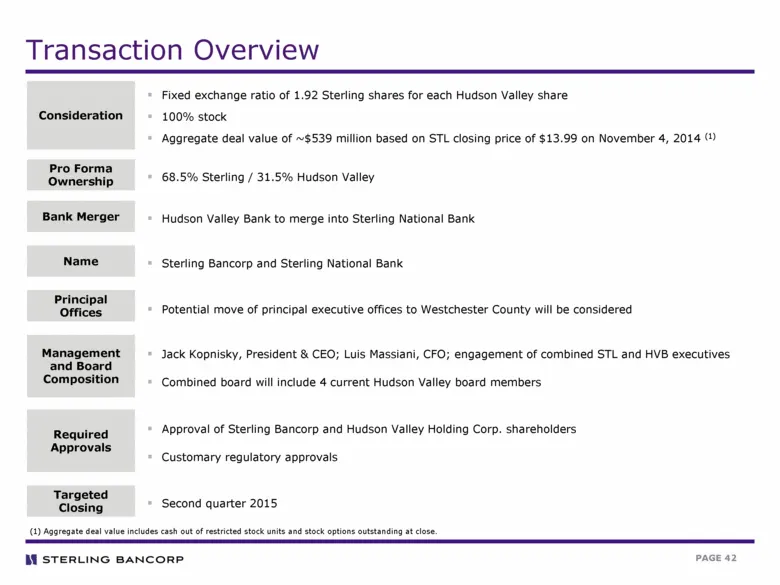
Transaction Overview Consideration Pro Forma Ownership Bank Merger Principal Offices Management and Board Composition Required Approvals Targeted Closing Name Fixed exchange ratio of 1.92 Sterling shares for each Hudson Valley share 100% stock Aggregate deal value of ~$539 million based on STL closi
Slide 43: Combined Franchise
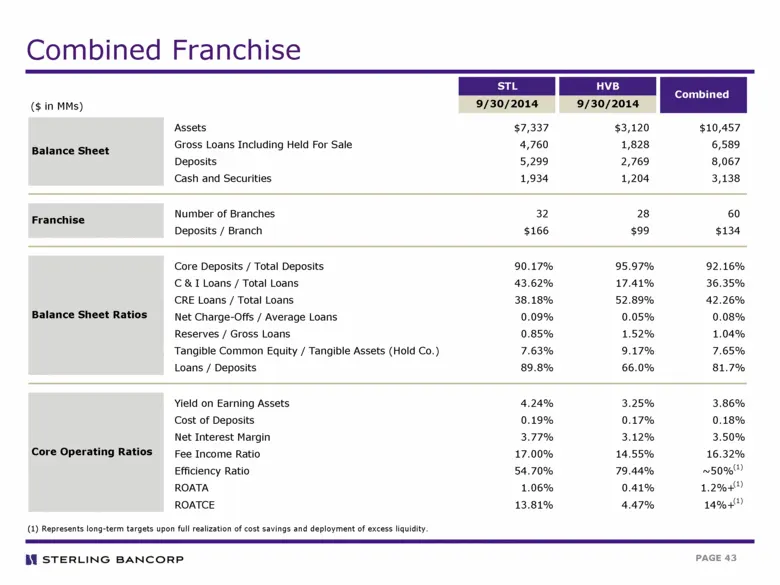
Combined Franchise STL HVB ($ in MMs) 9/30/2014 9/30/2014 Assets $7,337 $3,120 $10,457 Gross Loans Including Held For Sale 4,760 1,828 6,589 Deposits 5,299 2,769 8,067 Cash and Securities 1,934 1,204 3,138 Number of Branches 32 28 60 Deposits / Branch $166 $99 $134 Core Deposits / Total Deposits 90.
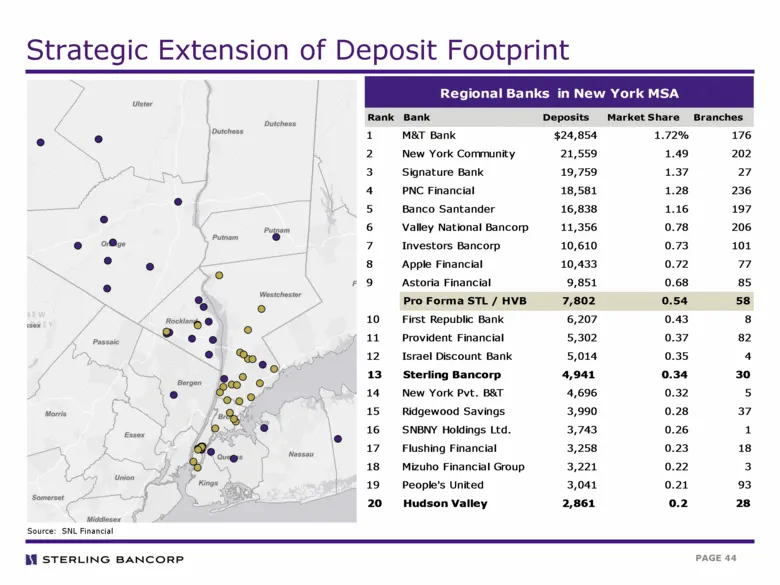
Slide 44: Strategic Extension of Deposit Footprint
Strategic Extension of Deposit Footprint Source: SNL Financial Regional Banks in New York MSA Rank Bank Deposits Market Share Branches 1 M&T Bank $24,854 1.72% 176 2 New York Community 21,559 1.49 202 3 Signature Bank 19,759 1.37 27 4 PNC Financial 18,581 1.28 236 5 Banco Santander 16,838 1.16 197 6
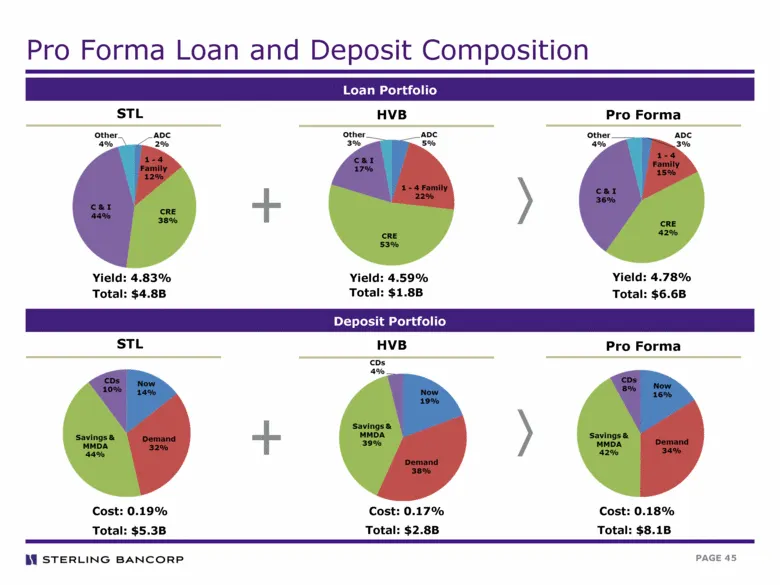
Slide 45: Pro Forma Loan and Deposit Composition
Pro Forma Loan and Deposit Composition STL HVB Pro Forma Yield: 4.83% Yield: 4.59% Yield: 4.78% Loan Portfolio STL HVB Pro Forma Cost: 0.19% Cost: 0.17% Cost: 0.18% Deposit Portfolio Total: $5.3B Total: $6.6B Total: $1.8B Total: $4.8B Total: $8.1B Total: $2.8B
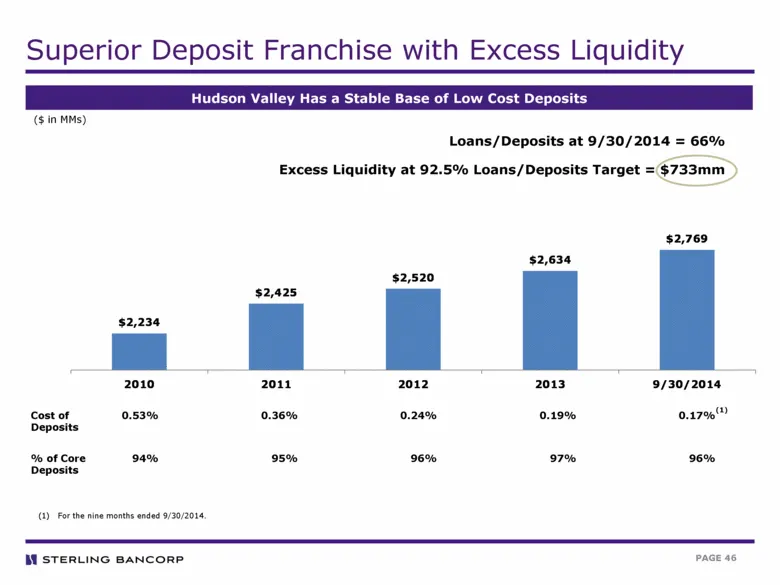
Slide 46: Superior Deposit Franchise with Excess Liquidity
Superior Deposit Franchise with Excess Liquidity Hudson Valley Has a Stable Base of Low Cost Deposits ($ in MMs) Loans/Deposits at 9/30/2014 = 66% Excess Liquidity at 92.5% Loans/Deposits Target = $733mm Cost of Deposits 0.53% 0.36% 0.24% 0.19% 0.17% For the nine months ended 9/30/2014. % of Core De
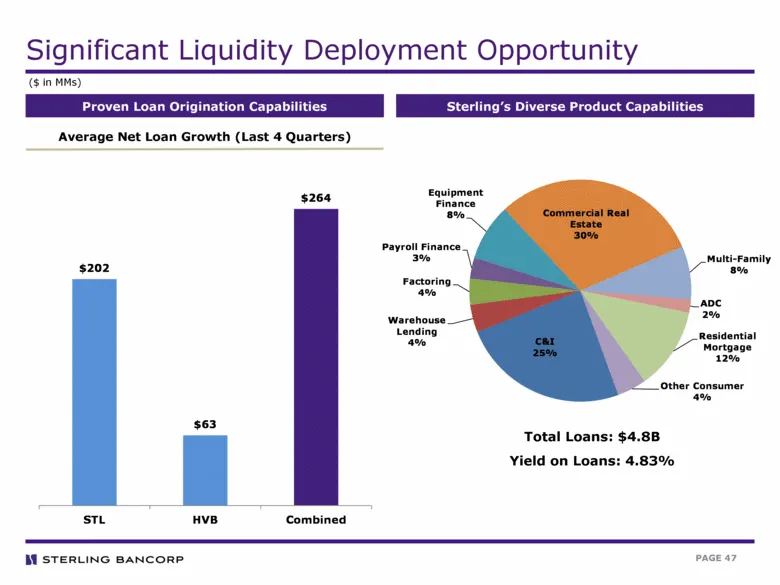
Slide 47: Significant Liquidity Deployment Opportunity
Significant Liquidity Deployment Opportunity Proven Loan Origination Capabilities Sterling’s Diverse Product Capabilities ($ in MMs) Average Net Loan Growth (Last 4 Quarters) Total Loans: $4.8B Yield on Loans: 4.83% C&I 25% Warehouse Lending 4% Factoring 4% Payroll Finance 3% Equipment Finance 8% Co
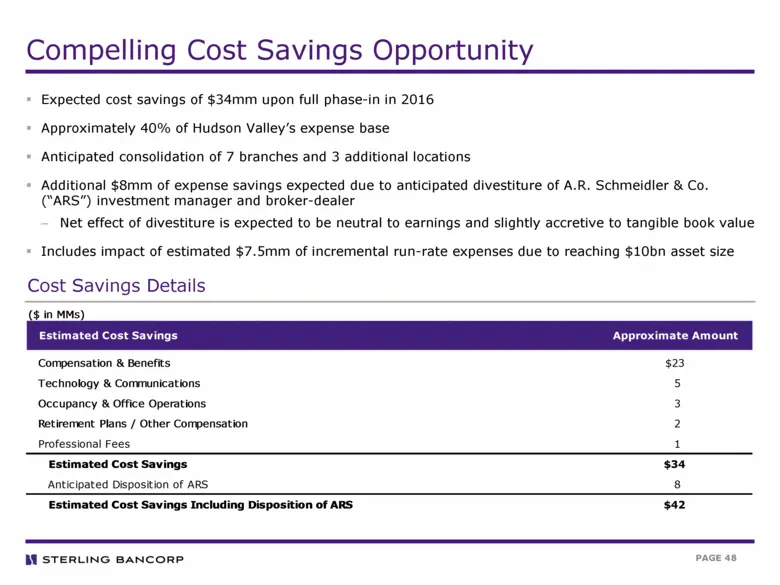
Slide 48: Compelling Cost Savings Opportunity
Compelling Cost Savings Opportunity Expected cost savings of $34mm upon full phase-in in 2016 Approximately 40% of Hudson Valley’s expense base Anticipated consolidation of 7 branches and 3 additional locations Additional $8mm of expense savings expected due to anticipated divestiture of A.R. Schmei
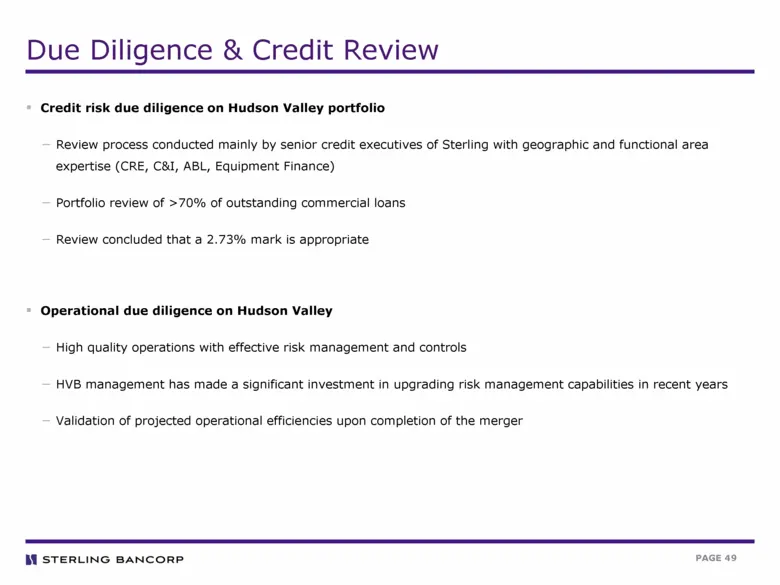
Slide 49: Due Diligence & Credit Review
Due Diligence & Credit Review Credit risk due diligence on Hudson Valley portfolio Review process conducted mainly by senior credit executives of Sterling with geographic and functional area expertise (CRE, C&I, ABL, Equipment Finance) Portfolio review of >70% of outstanding commercial loans Review
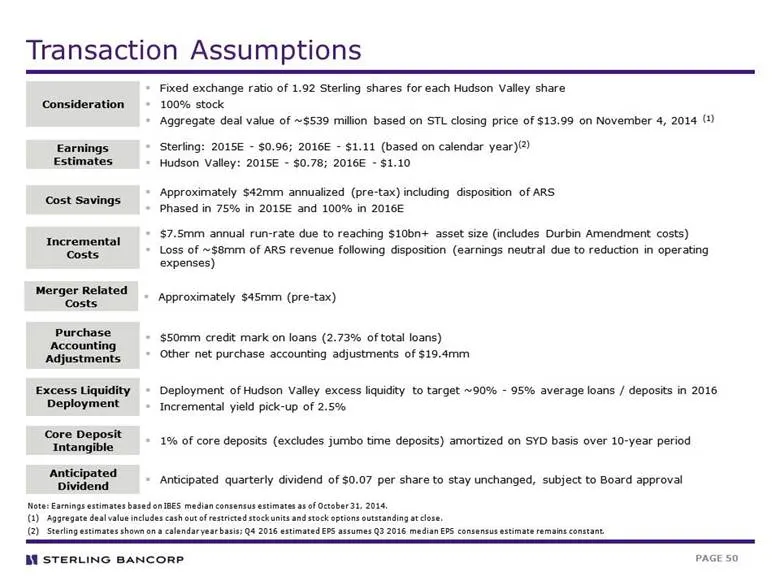
Slide 50: Transaction Assumptions
Transaction Assumptions Consideration Merger Related Costs Anticipated Dividend Cost Savings Fixed exchange ratio of 1.92 Sterling shares for each Hudson Valley share 100% stock Aggregate deal value of ~$539 million based on STL closing price of $13.99 on November 4, 2014 (1) Approximately $42mm ann
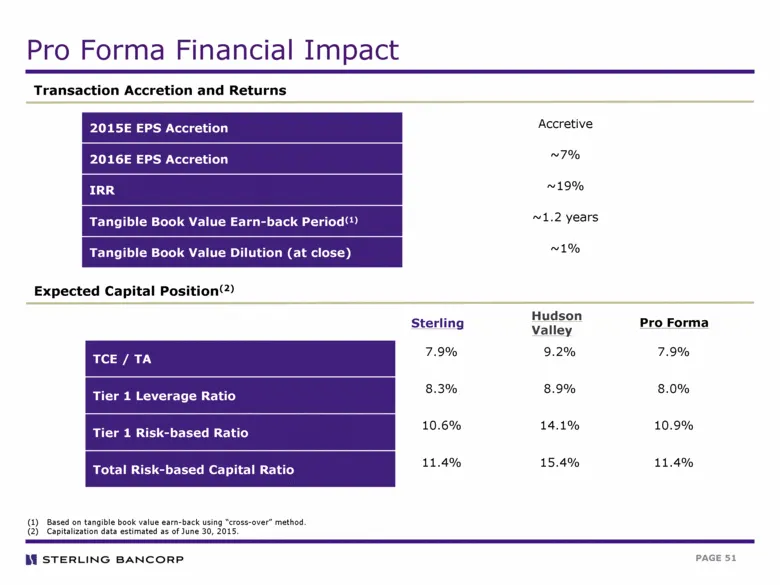
Slide 51: Pro Forma Financial Impact
Pro Forma Financial Impact Transaction Accretion and Returns Expected Capital Position(2) 2015E EPS Accretion Accretive 2016E EPS Accretion ~7% IRR ~19% Tangible Book Value Earn-back Period(1) ~1.2 years Tangible Book Value Dilution (at close) ~1% TCE / TA 7.9% 9.2% 7.9% Tier 1 Leverage Ratio 8.3% 8
Slide 52: Sterling Bancorp
STERLING BANCORP
Source: SEC EDGAR · 425 filed Nov 19, 2014
More decks from Hudson Valley Holding Corp
 Merger or Acquisition (November 2014)17 slides · Nov 5, 2014
 Investor Presentation (July 2014)32 slides · Jul 25, 2014
 Investor Presentation (May 2014)32 slides · May 1, 2014
 Investor Presentation (November 2013)48 slides · Nov 13, 2013
 Investor Presentation (August 2013)46 slides · Aug 21, 2013
 Investor Presentation (June 2013)54 slides · Jun 17, 2013