Real Goods Solar — IPO Roadshow (June 2016)
29 slides from Real Goods Solar's IPO roadshow presentation, Jun 28, 2016
Slide 1: Investor Presentation June 27, 2016
Issuer Free Writing Prospectus dated June 27, 2016 (Related to Preliminary Prospectus dated June 27, 2016) Filed Pursuant to Rule 433 SEC File No. 333-211915 Investor Presentation June 27, 2016 NASDAQ: RGSE 1 Issuer Free Writing Prospectus dated June 27, 2016 (Related to Preliminary Prospectus dated
Slide 2: Statutory Notice
Statutory Notice Real Goods Solar, Inc. (the “Company”) has filed a registration statement on Form S - 1 (file number: 333 - 211915) including a preliminary prospectus with the Securities and Exchange Commission (“SEC”) for the offering to which this presentation relates. Before you invest, you shou
Slide 3: Forward-Looking Statements
Forward - Looking Statements NASDAQ : RGSE 3 This presentation by Real Goods Solar, Inc. (the “Company,” “we”, “us,” “its,” “our”) contains forward - looking statements and forward - looking hypothetical examples or constructs within the meaning of the U.S. Private Securities Litigation Reform Act o
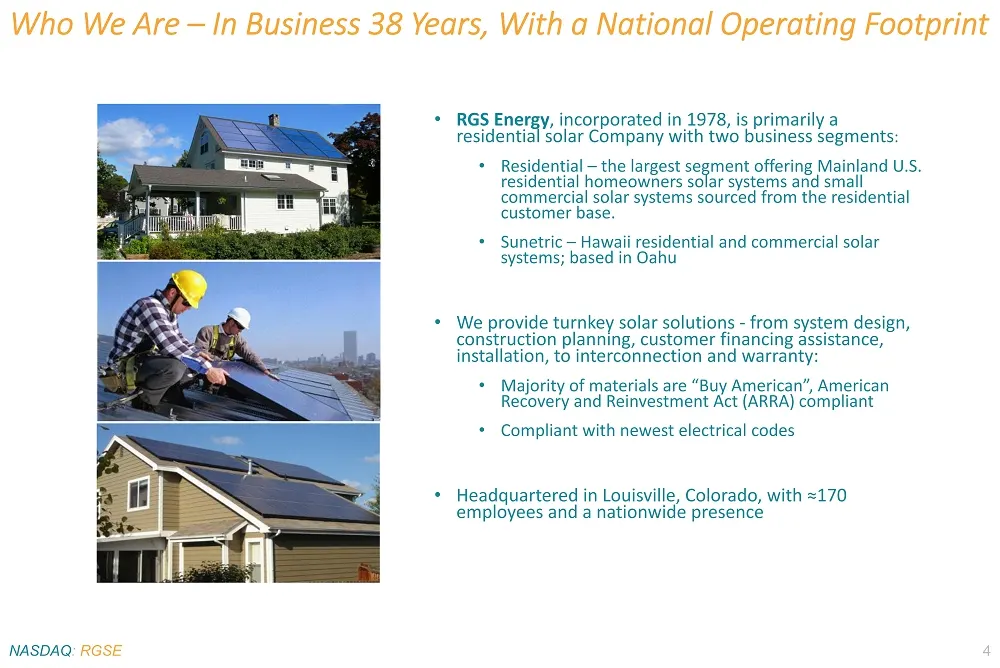
Slide 4: Who We Are – In Business 38 Years, With a National Operating Footprint
• RGS Energy , incorporated in 1978, is primarily a residential solar Company with two business segments : • Residential – the largest segment offering Mainland U.S. residential homeowners solar systems and small commercial solar systems sourced from the residential customer base. • Sunetric – Hawai
Slide 5: A Brief History of RGS
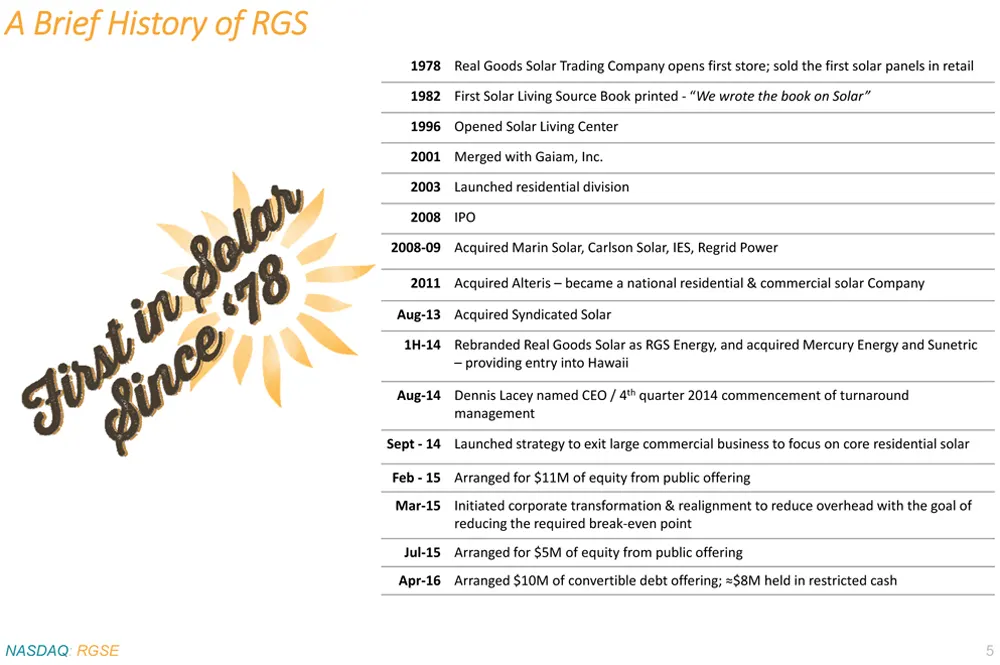
NASDAQ : RGSE 5 A Brief History of RGS 1978 Real Goods Solar Trading Company opens first store; sold the first solar panels in retail 1982 First Solar Living Source Book printed - “ We wrote the book on Solar” 1996 Opened Solar Living Center 2001 Merged with Gaiam , Inc. 2003 Launched residential di
Slide 6: Residential Segment: We Have a National Operating Footprint
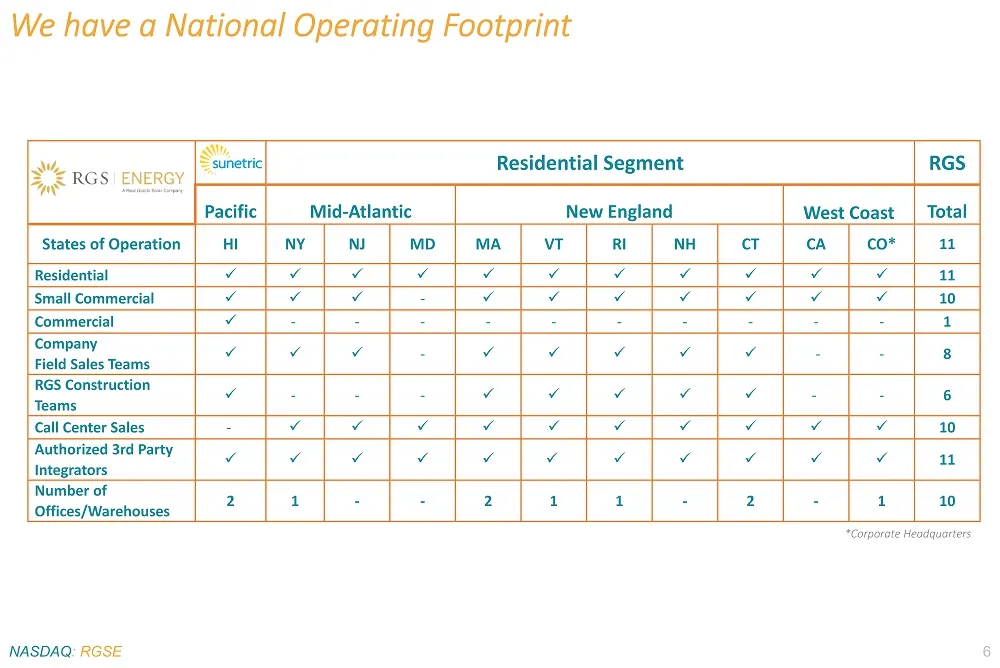
Residential Segment RGS Pacific Mid - Atlantic New England West Coast Total States of Operation HI NY NJ MD MA VT RI NH CT CA CO* 11 Residential x x x x x x x x x x x 11 Small Commercial x x x - x x x x x x x 10 Commercial x - - - - - - - - - - 1 Company Field Sales Teams x x x - x x x x x - - 8 RGS
Slide 7: Macro Conditions Positive for Industry - Strong Outlook for Business Growth
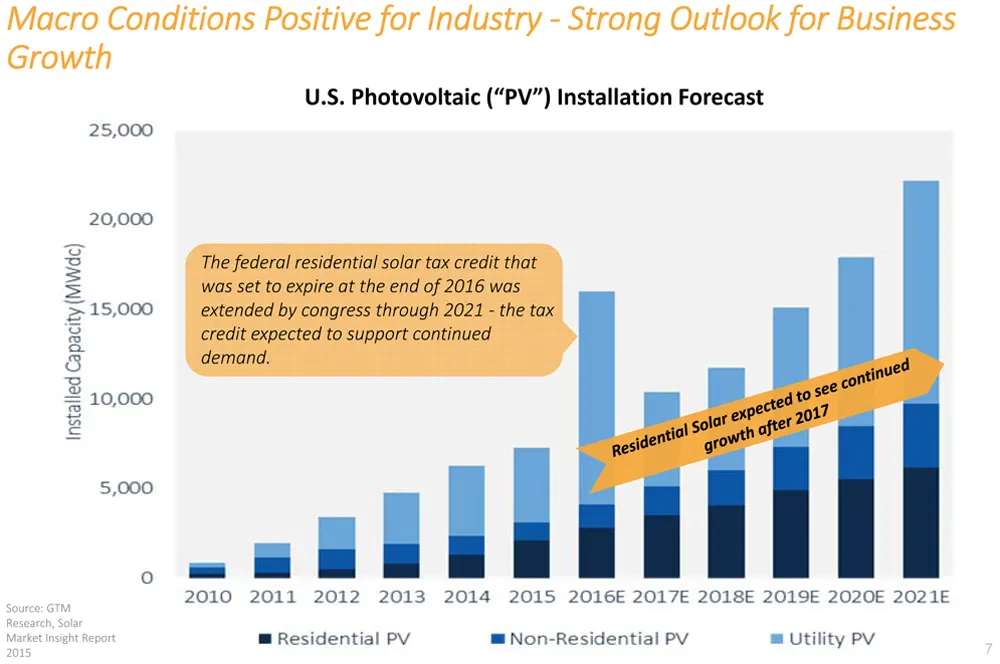
Macro Conditions Positive for Industry - Strong Outlook for Business Growth Source: GTM Research, Solar Market Insight Report 2015 The federal residential solar tax credit that was set to expire at the end of 2016 was extended by congress through 2021 - the tax credit expected to support continued d
Slide 8: Macro Conditions Positive: Increasing Electricity Rates & Declining Costs
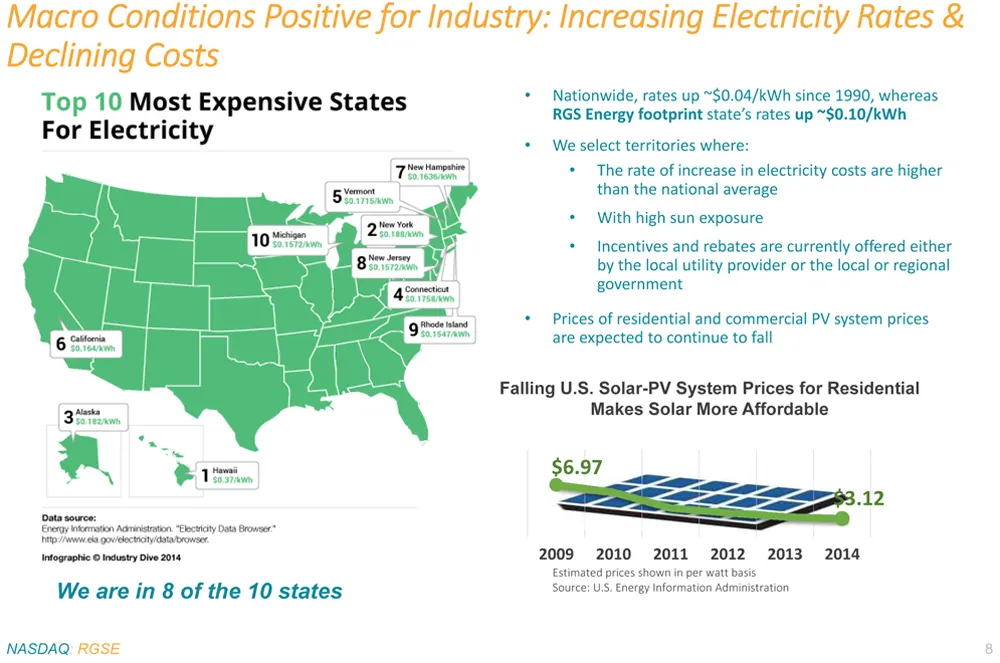
• Nationwide, rates up ~$0.04/kWh since 1990, whereas RGS Energy footprint state’s rates up ~$0.10/kWh • We select territories where: • The rate of increase in electricity costs are higher than the national average • With high sun exposure • Incentives and rebates are currently offered either by the
Slide 9: Although Macro Conditions are Positive, Industry Results are Not
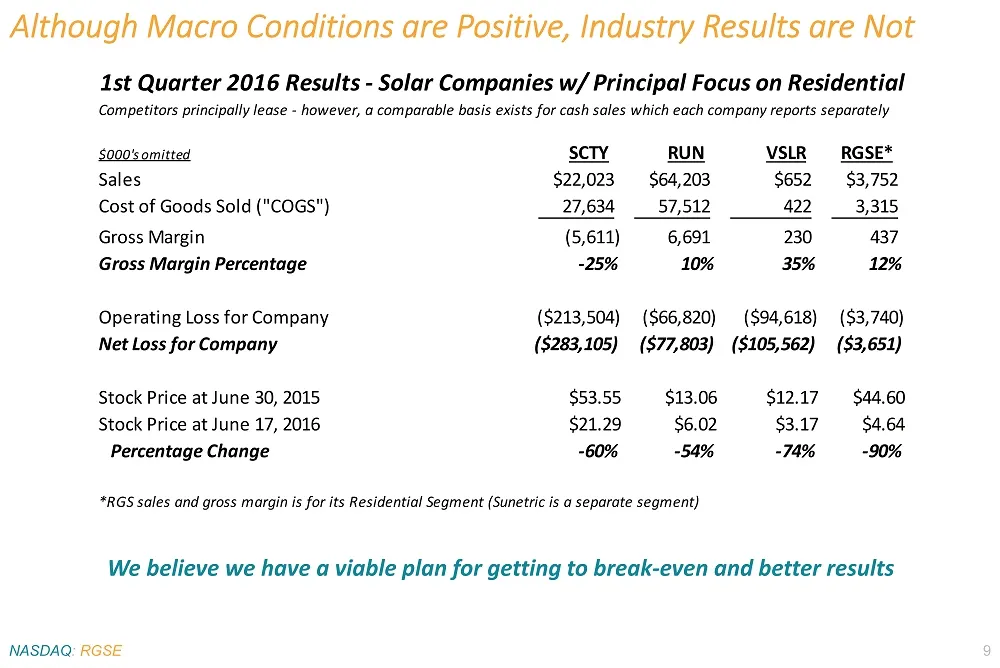
Although Macro Conditions are Positive, Industry Results are Not NASDAQ : RGSE 9 We believe we have a viable plan for getting to break - even and better results 1st Quarter 2016 Results - Solar Companies w/ Principal Focus on Residential Competitors principally lease - however, a comparable basis ex
Slide 10: Corporate transformation progress and initiatives by Turnaround Management
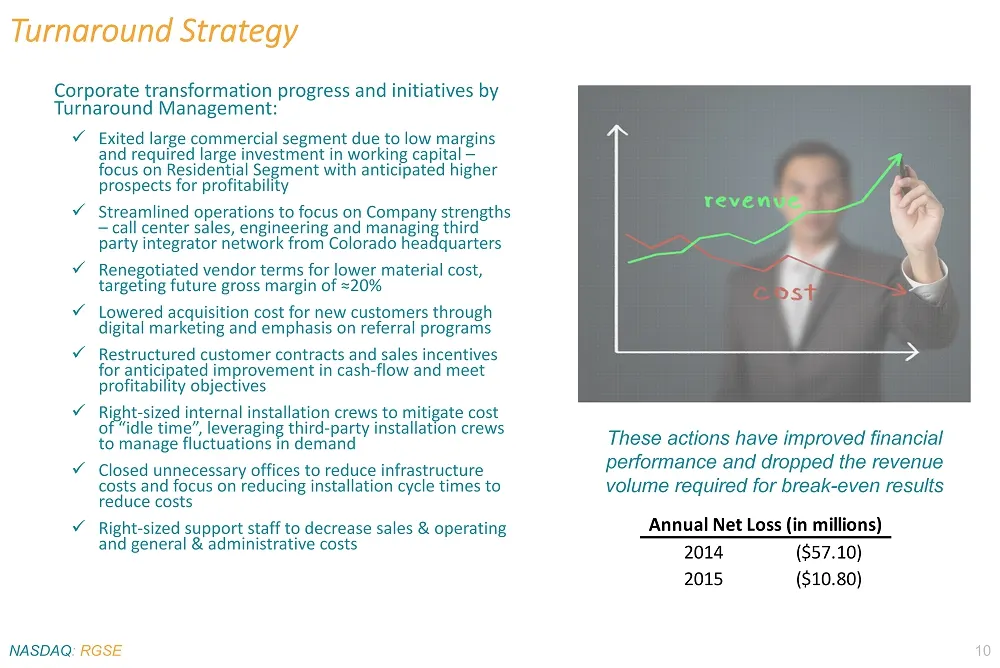
Corporate transformation progress and initiatives by Turnaround Management: x Exited large commercial segment due to low margins and required large investment in working capital – focus on Residential Segment with anticipated higher prospects for profitability x Streamlined operations to focus on Co
Slide 11: Our Strategy - Designed to Mitigate Industry Risks
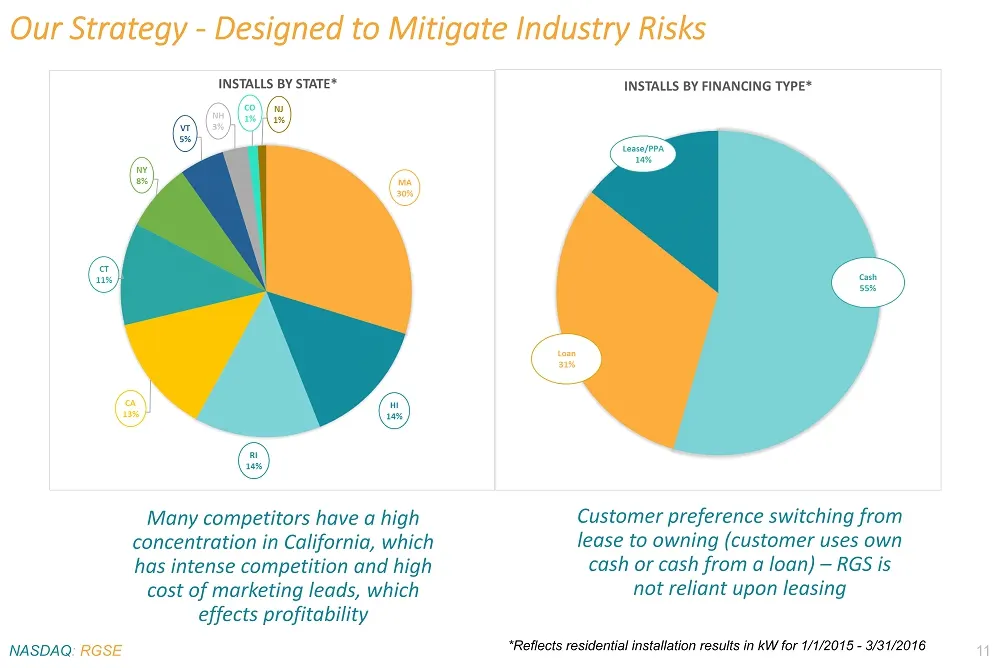
NASDAQ : RGSE 11 Our Strategy - Designed to Mitigate Industry Risks Customer preference switching from lease to owning (customer uses own cash or cash from a loan) – RGS is not reliant upon leasing Many competitors have a high concentration in California, which has intense competition and high cost
Slide 12: Our Strategy - Not Dependent on Leasing
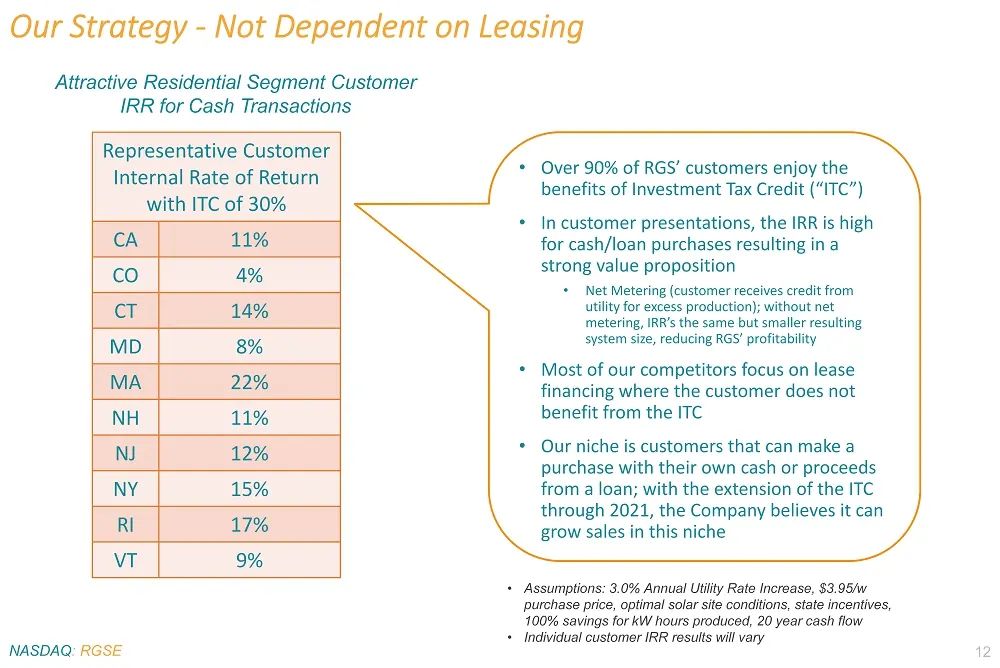
NASDAQ : RGSE 12 Our Strategy - Not Dependent on Leasing • Over 90% of RGS’ customers enjoy the benefits of Investment Tax Credit (“ITC”) • In customer presentations, the IRR is high for cash/loan purchases resulting in a strong value proposition • Net Metering (customer receives credit from utility
Slide 13: Progress with Turnaround Set the Stage for the 2016 $10M Convertible Note Offering
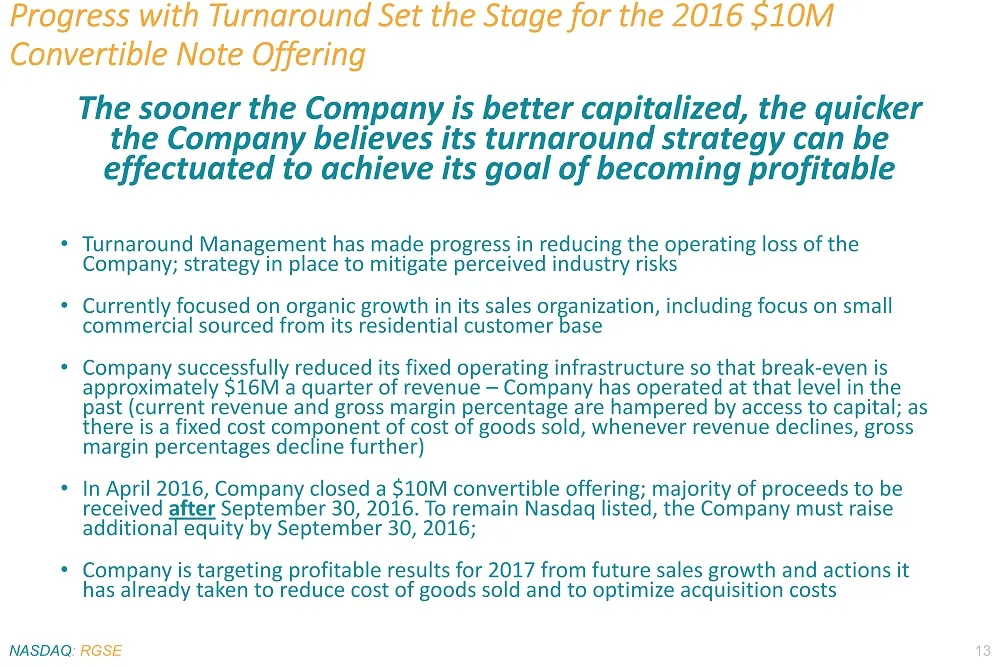
Progress with Turnaround Set the Stage for the 2016 $10M Convertible Note Offering The sooner the Company is better capitalized, the quicker the Company believes its turnaround strategy can be effectuated to achieve its goal of becoming profitable • Turnaround Management has made progress in reducin
Slide 14: Management Targeting Future Break-Even and Better Results
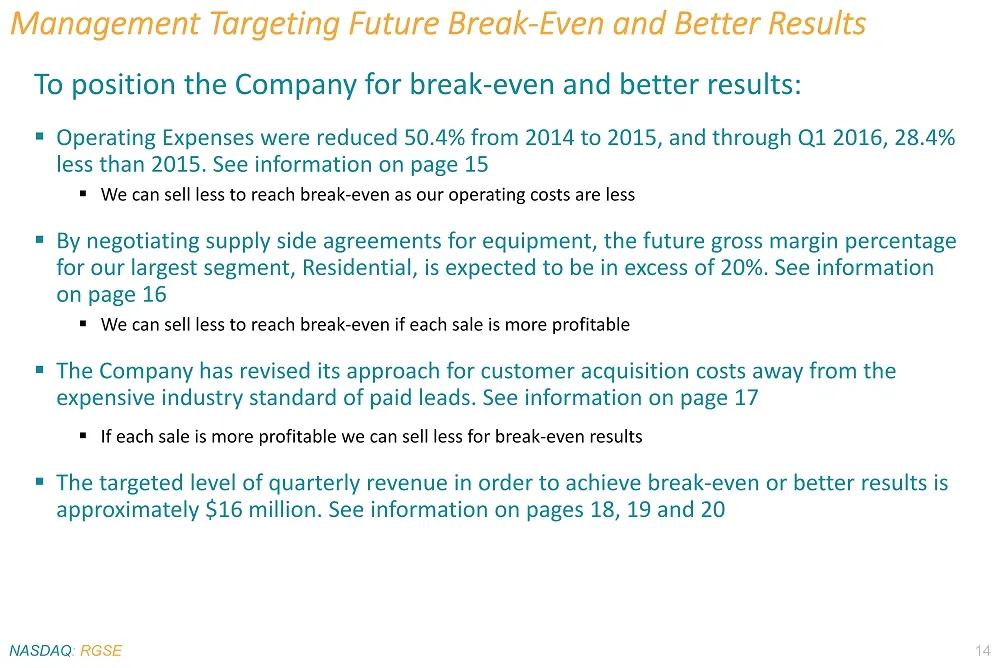
Management Targeting Future Break - Even and Better Results To position the Company for break - even and better results: ▪ Operating Expenses were reduced 50.4% from 2014 to 2015, and through Q1 2016, 28.4% less than 2015. See information on page 15 ▪ We can sell less to reach break - even as our op
Slide 15: Aggressive Actions Have Reduced Operating Expenses
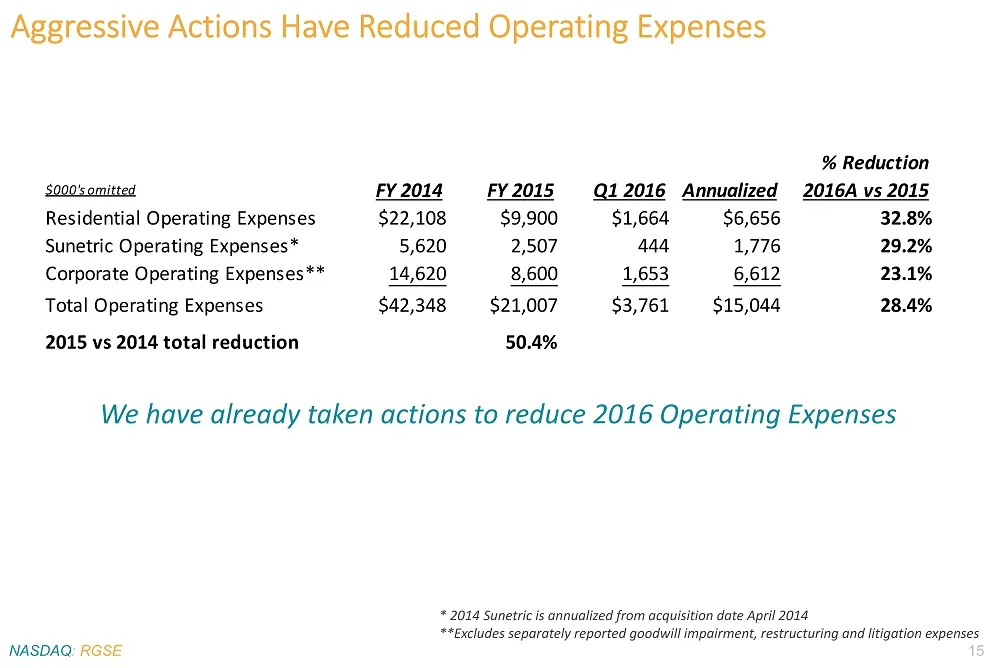
Aggressive Actions Have Reduced Operating Expenses We have already taken actions to reduce 2016 Operating Expenses NASDAQ : RGSE 15 * 2014 Sunetric is annualized from acquisition date April 2014 **Excludes separately reported goodwill impairment, restructuring and litigation expenses % Reduction $00
Slide 16: Targeting Improved Gross Margins
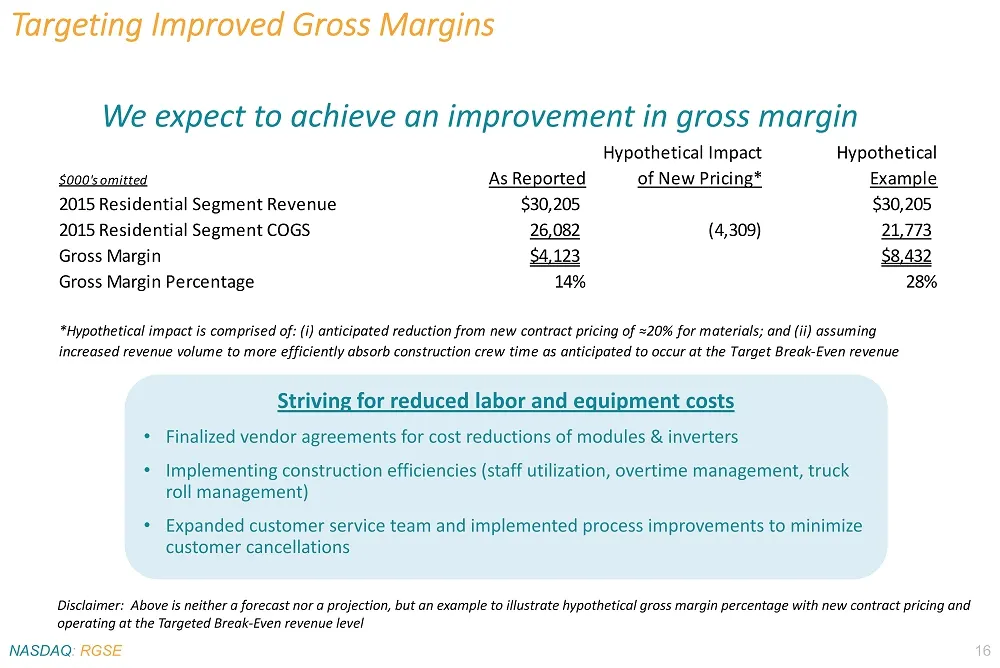
Targeting Improved Gross Margins We expect to achieve an improvement in gross margin NASDAQ : RGSE 16 Striving for reduced labor and equipment costs • Finalized vendor agreements for cost reductions of modules & inverters • Implementing construction efficiencies (staff utilization, overtime manageme
Slide 17: Targeting Reduced Customer Acquisition Costs
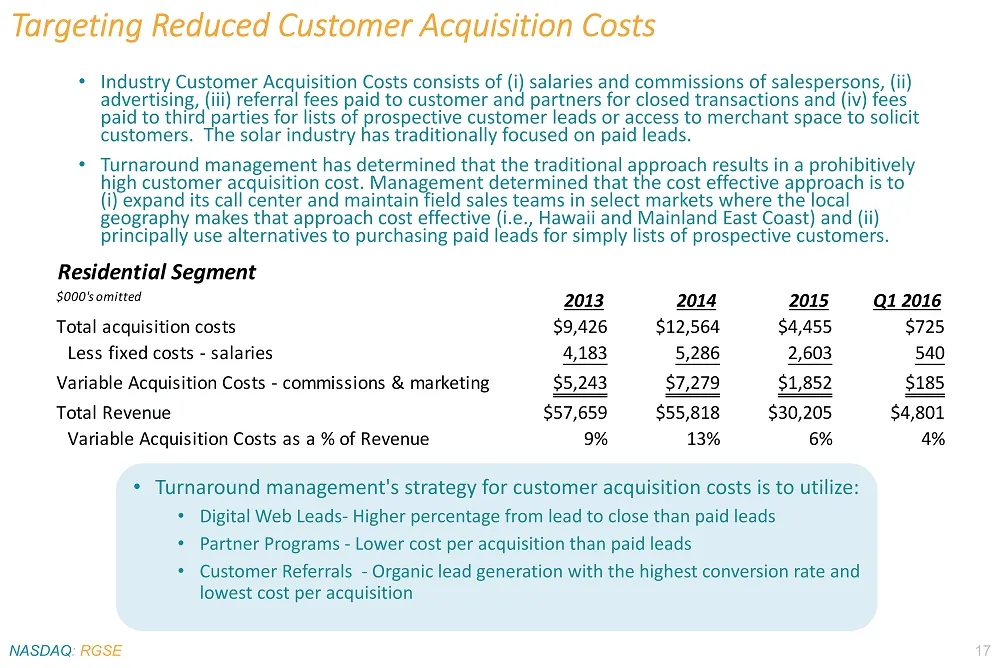
Targeting Reduced Customer Acquisition Costs • Industry Customer Acquisition Costs consists of (i) salaries and commissions of salespersons, (ii) advertising, (iii) referral fees paid to customer and partners for closed transactions and (iv) fees paid to third parties for lists of prospective custom
Slide 18: Targeted Revenue Break-Even Point Calculated on Segment Basis
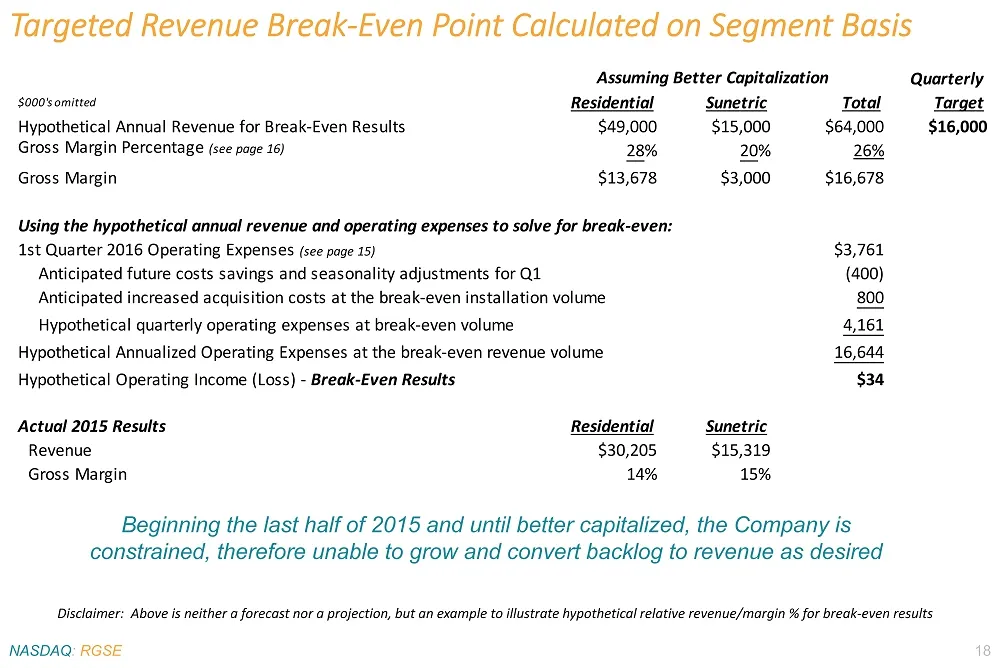
NASDAQ : RGSE 18 Targeted Revenue Break - Even Point Calculated on Segment Basis Disclaimer: Above is neither a forecast nor a projection, but an example to illustrate hypothetical relative revenue/margin % f or break - even results Beginning the last half of 2015 and until better capitalized, the C
Slide 19: Targeted Revenue Break-Even Calculated on a Per Watt Basis
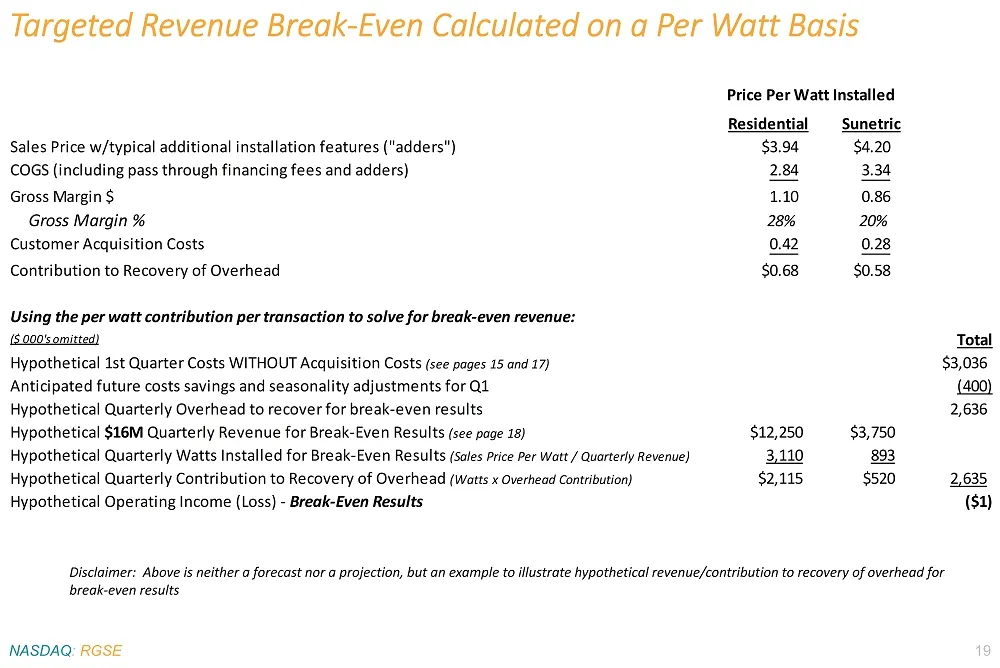
NASDAQ : RGSE 19 Targeted Revenue Break - Even Calculated on a Per Watt Basis Disclaimer: Above is neither a forecast nor a projection, but an example to illustrate hypothetical revenue/contribution to rec overy of overhead for break - even results Residential Sunetric Sales Price w/typical addition
Slide 20: Break-Even Revenue Target – Historical Lookback
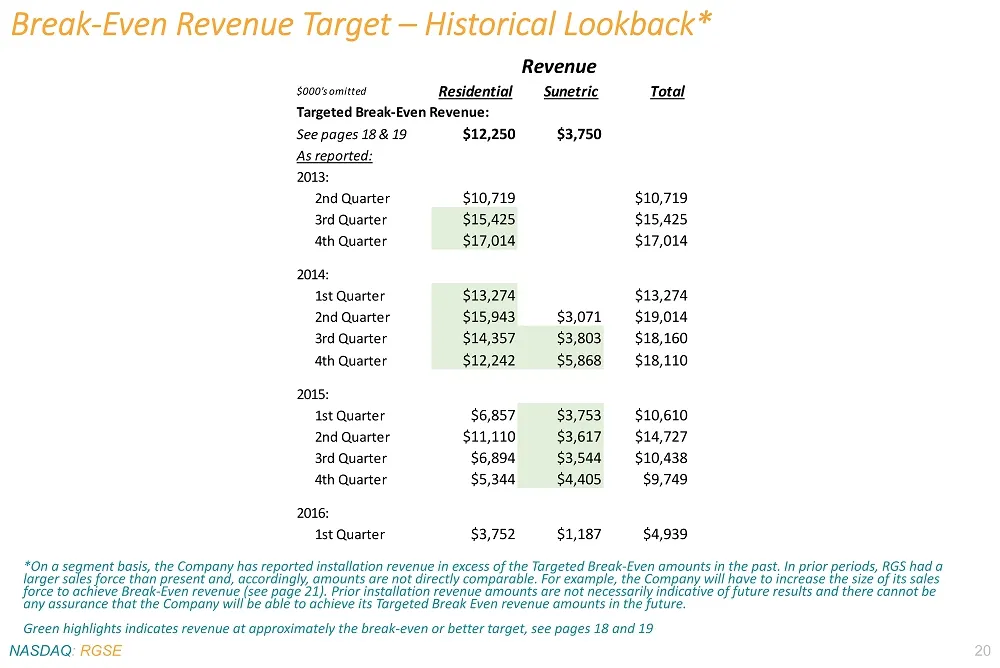
Break - Even Revenue Target – Historical Lookback* *On a segment basis, the Company has reported installation revenue in excess of the Targeted Break - Even amounts in the past. In prior periods, RGS had a larger sales force than present and, accordingly, amounts are not directly comparable. For exa
Slide 21: To Grow our Revenue, We Need to Increase The Size of Our Sales Organization
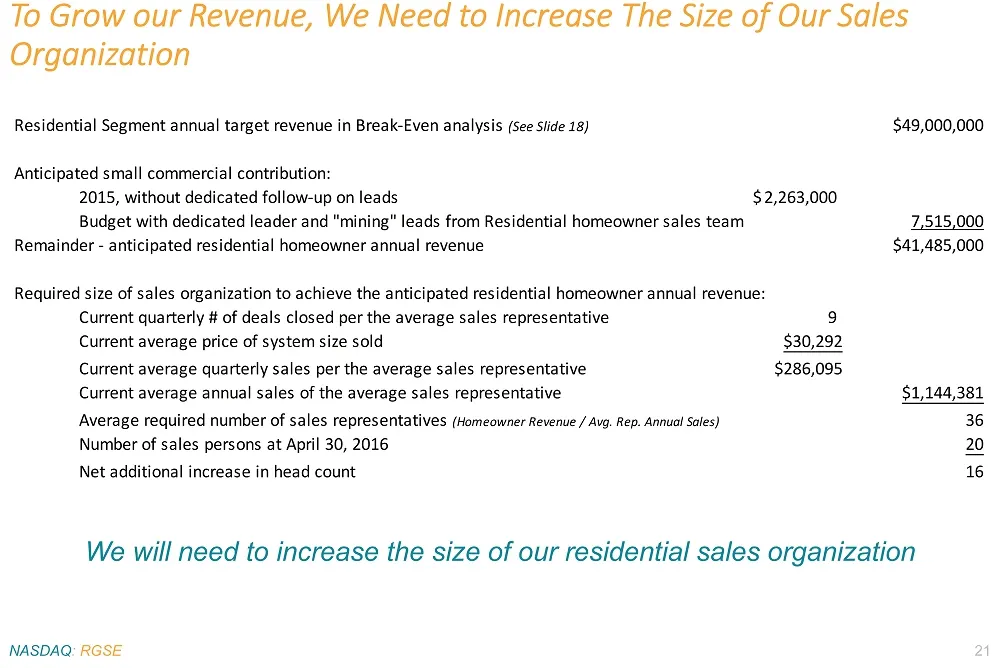
NASDAQ : RGSE 21 To Grow our Revenue, We Need to Increase The Size of Our Sales Organization We will need to increase the size of our residential sales organization Residential Segment annual target revenue in Break-Even analysis (See Slide 18) $49,000,000 Anticipated small commercial contribution:
Slide 22: Use of Proceeds - Become Better Capitalized and Grow Revenue
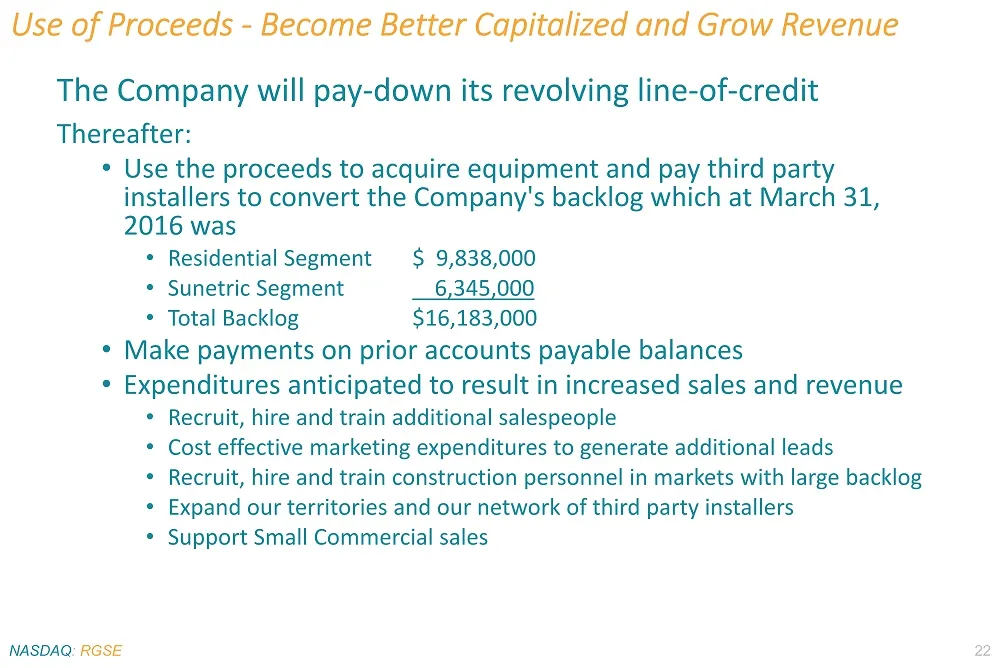
Use of Proceeds - Become Better Capitalized and Grow Revenue The Company will pay - down its revolving line - of - credit Thereafter: • Use the proceeds to acquire equipment and pay third party installers to convert the Company's backlog which at March 31, 2016 was • Residential Segment $ 9,838,000
Slide 23: Hypothetical Example - Bridge from Backlog and Future Sales to Break-Even Revenue
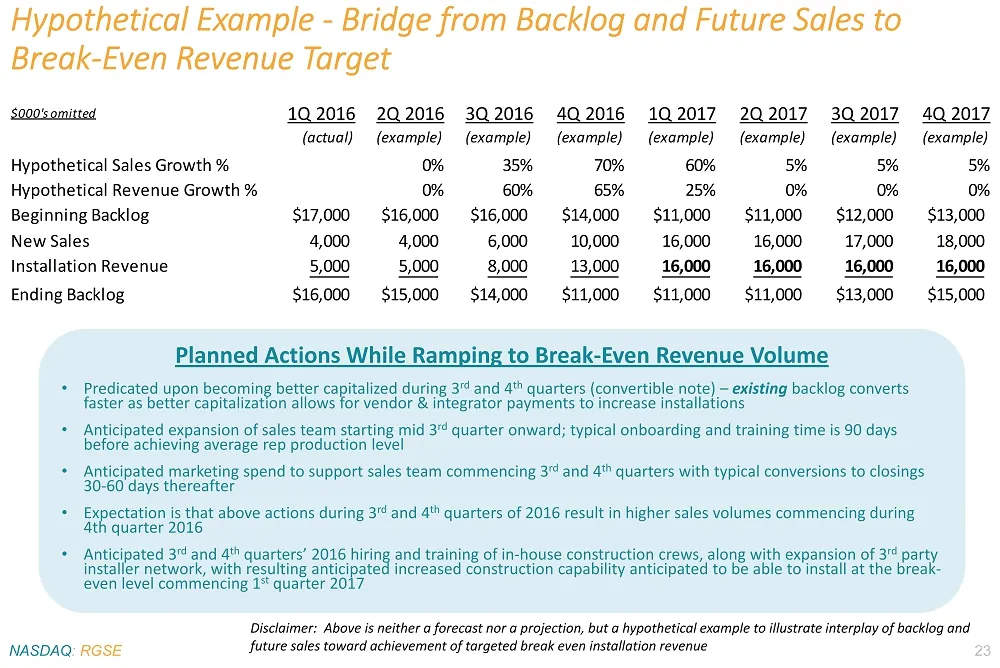
Hypothetical Example - Bridge from Backlog and Future Sales to Break - Even Revenue Target NASDAQ : RGSE 23 Planned Actions While Ramping to Break - Even Revenue Volume • Predicated upon becoming better capitalized during 3 rd and 4 th quarters (convertible note) – existing backlog converts faster a
Slide 24: Quarterly Loss and Capital Available 2014-2016
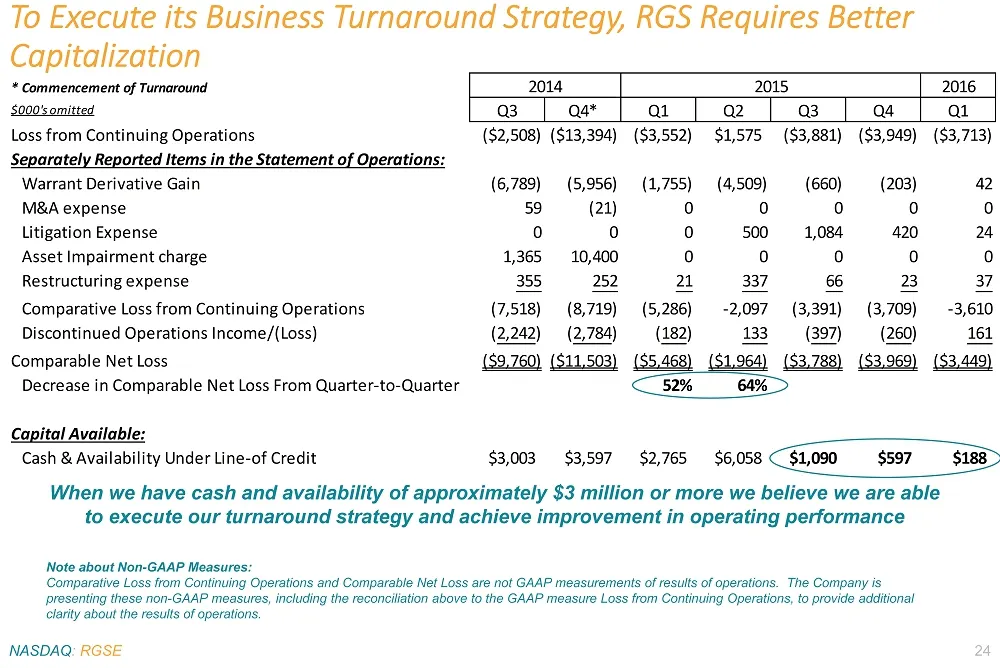
* Commencement of Turnaround 2016 $000's omitted Q3 Q4* Q1 Q2 Q3 Q4 Q1 Loss from Continuing Operations ($2,508)($13,394) ($3,552) $1,575 ($3,881) ($3,949) ($3,713) Separately Reported Items in the Statement of Operations: Warrant Derivative Gain (6,789) (5,956) (1,755) (4,509) (660) (203) 42 M&A exp
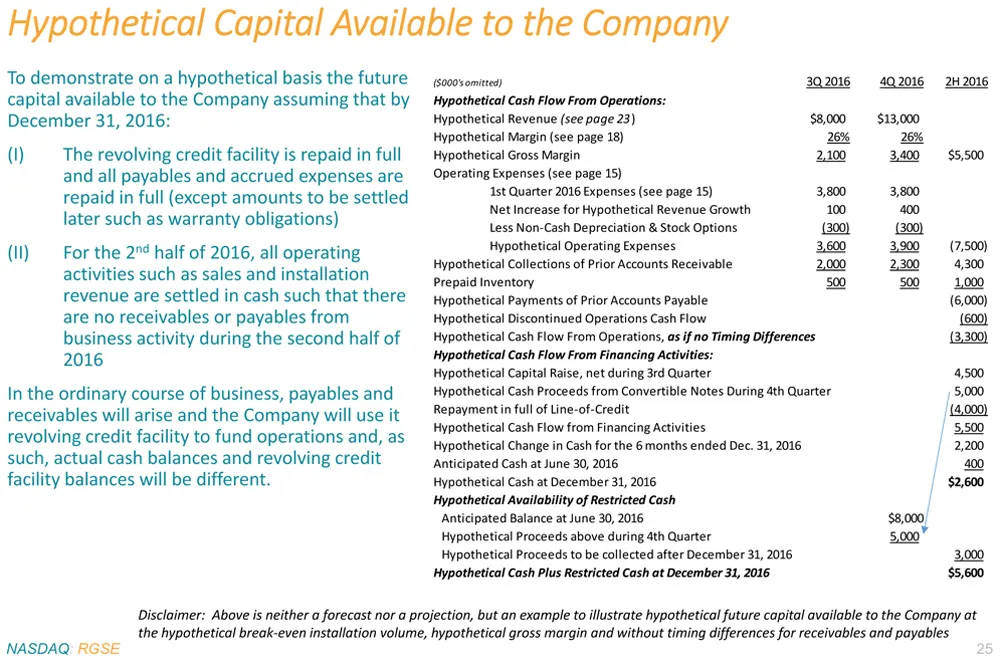
Slide 25: Hypothetical Capital Available to the Company
Hypothetical Capital Available to the Company To demonstrate on a hypothetical basis the future capital available to the Company assuming that by December 31, 2016: (I) The revolving credit facility is repaid in full and all payables and accrued expenses are repaid in full (except amounts to be sett
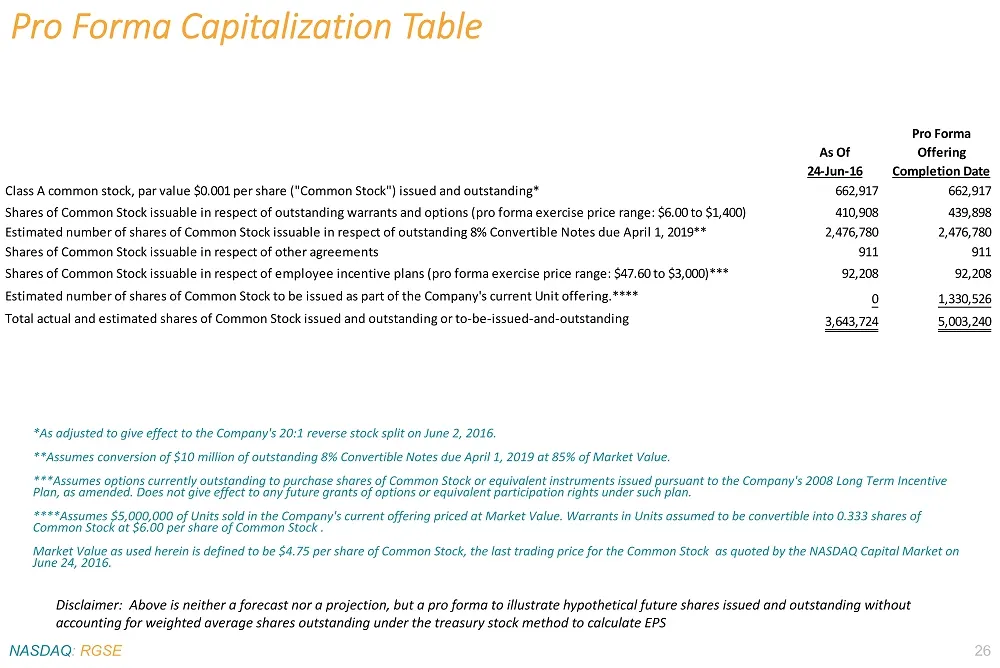
Slide 26: Pro Forma Capitalization Table
Pro Forma Capitalization Table *As adjusted to give effect to the Company's 20:1 reverse stock split on June 2, 2016. **Assumes conversion of $10 million of outstanding 8% Convertible Notes due April 1, 2019 at 85% of Market Value. ***Assumes options currently outstanding to purchase shares of Commo
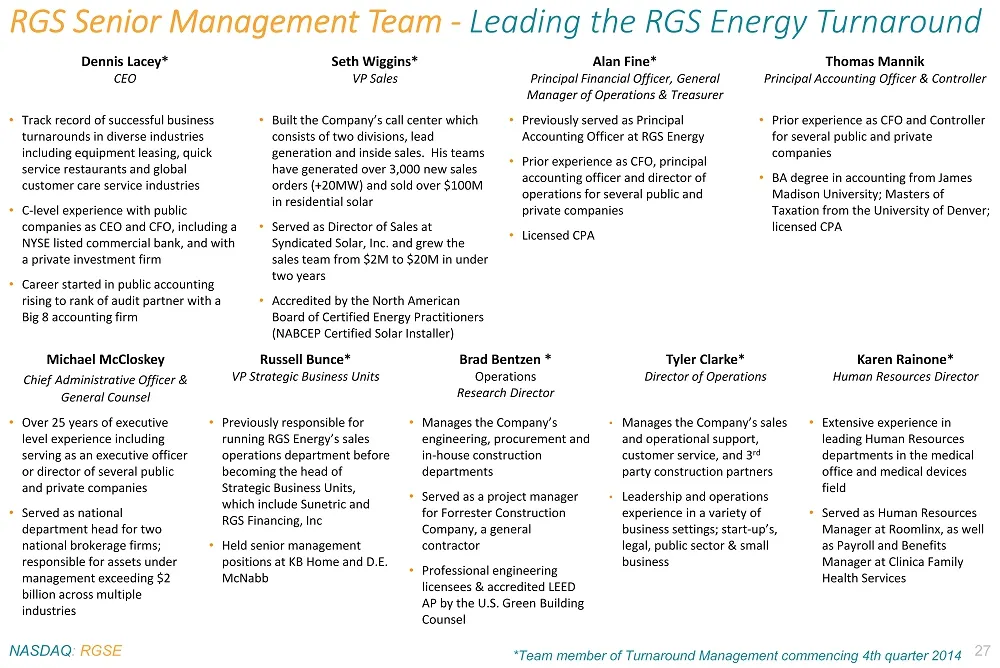
Slide 27: RGS Senior Management Team - Leading the RGS Energy Turnaround
NASDAQ : RGSE 27 RGS Senior Management Team - Leading the RGS Energy Turnaround Dennis Lacey* CEO Seth Wiggins* VP Sales Alan Fine* Principal Financial Officer, General Manager of Operations & Treasurer Thomas Mannik Principal Accounting Officer & Controller • Track record of successful business tur
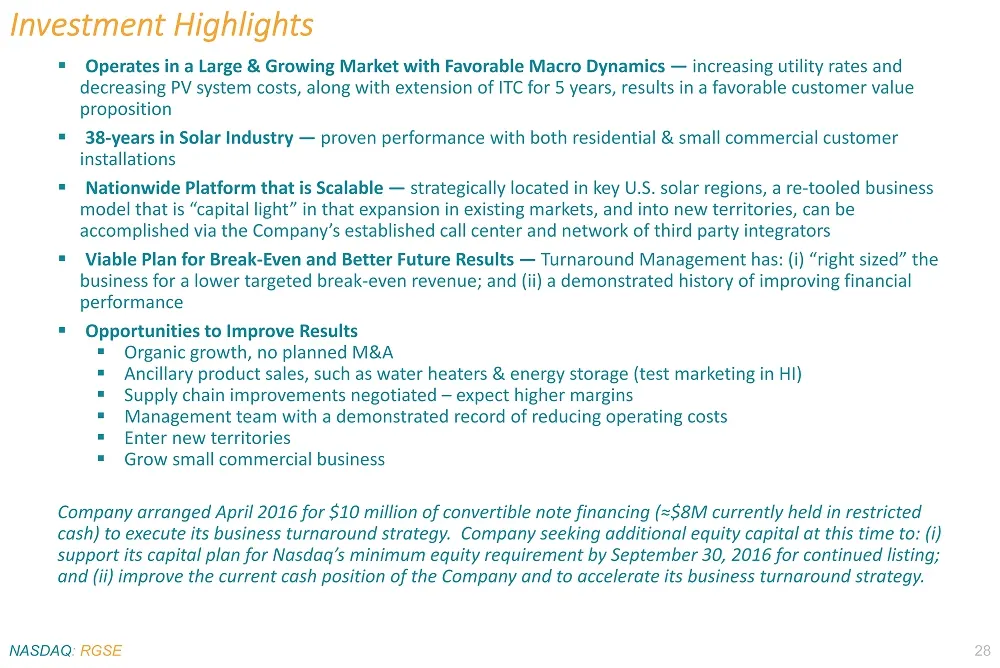
Slide 28: Investment Highlights
Investment Highlights ▪ Operates in a Large & Growing Market with Favorable Macro Dynamics — increasing utility rates and decreasing PV system costs, along with extension of ITC for 5 years, results in a favorable customer value proposition ▪ 38 - years in Solar Industry — proven performance with bo
Slide 29: Contact Us
RGS Energy 833 West South Boulder Road Louisville, CO 80027 Tel 303.222.8400 Dennis Lacey, CEO Investor Relations Liolios Group, Inc. Ron Both Tel 949.574.3860 [email protected] NASDAQ : RGSE 29 Contact Us RGS Energy (NASDAQ: RGSE) a residential and small commercial solar Company since 1978, the Comp
Source: SEC EDGAR · FWP filed Jun 28, 2016
More decks from Real Goods Solar Inc
 NIBA NY Conference November 201915 slides · November 2019
 Reg A Offering (November 2019)18 slides · November 2019
 Investor Presentation (September 2019)17 slides · Sep 5, 2019
 Investor Presentation (May 2019)12 slides · May 15, 2019
 Investor Presentation (October 2018)17 slides · Oct 1, 2018
 Investor Presentation (September 2018)17 slides · Sep 12, 2018