Altra Industrial Motion — Q2 2020 Earnings Presentation
16 slides from Altra Industrial Motion's earnings presentation, Jul 24, 2020
Slide 1: Second-Quarter 2020 Results
Second-Quarter 2020 Results July 24, 2020 Exhibit 99.2
Slide 2: Q2 2020 Conference Call Details
Q2 2020 Conference Call Details Live Webcast July 24, 2020 10:00 AM ET Dial-In Number (866) 209-9085 Domestic (647) 689-5687 International Webcast at www.altramotion.com Replay (800) 585-8367 Domestic* (416) 621-4642 International* Conference ID: 6459679 *Phone replay through August 7, 2020 Webcast
Slide 3: Safe Harbor Statement
Safe Harbor Statement Forward-Looking Statements All statements, other than statements of historical fact included in this release are forward-looking statements, as that term is defined in the Private Securities Litigation Reform Act of 1995. These statements include, but are not limited to, any st

Slide 4: Agenda and Speakers
Agenda and Speakers Executive Overview COVID-19 Response Market Review Q2 Financial Review & 2020 Guidance Concluding Remarks Q&A Carl Christenson Chairman & Chief Executive Officer Christian Storch Vice President & Chief Financial Officer 1. 2. 3. 4. 5. 6. [photo] [photo]
Slide 5: Q2 2020 Strategic Highlights
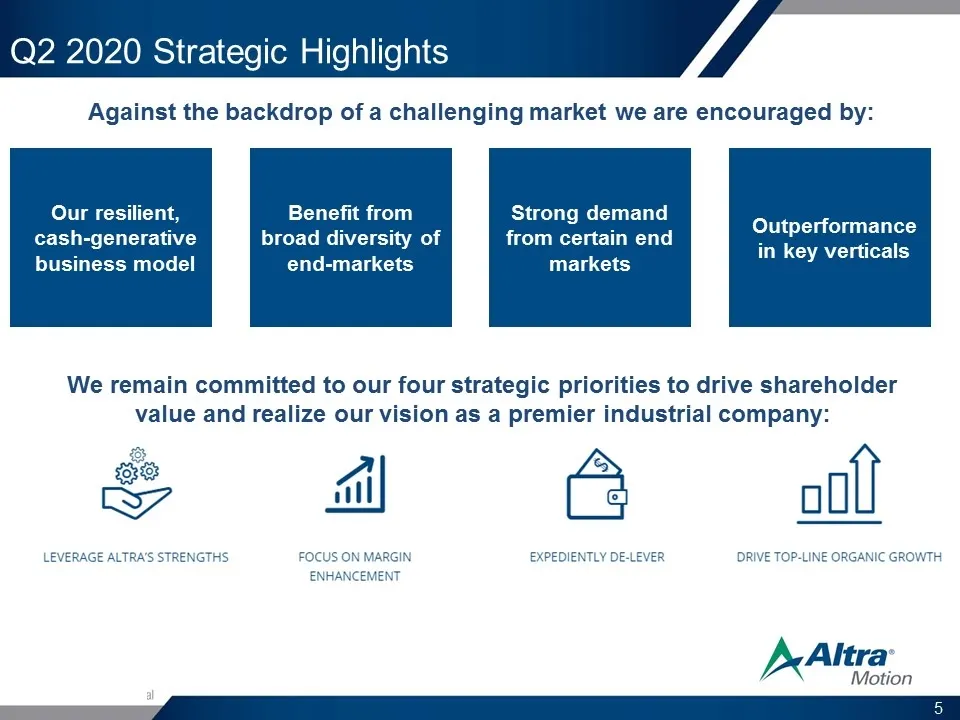
Q2 2020 Strategic Highlights We remain committed to our four strategic priorities to drive shareholder value and realize our vision as a premier industrial company: Our resilient, cash-generative business model Benefit from broad diversity of end-markets Strong demand from certain end markets Outper
Slide 6: Q2 2020 Performance Highlights
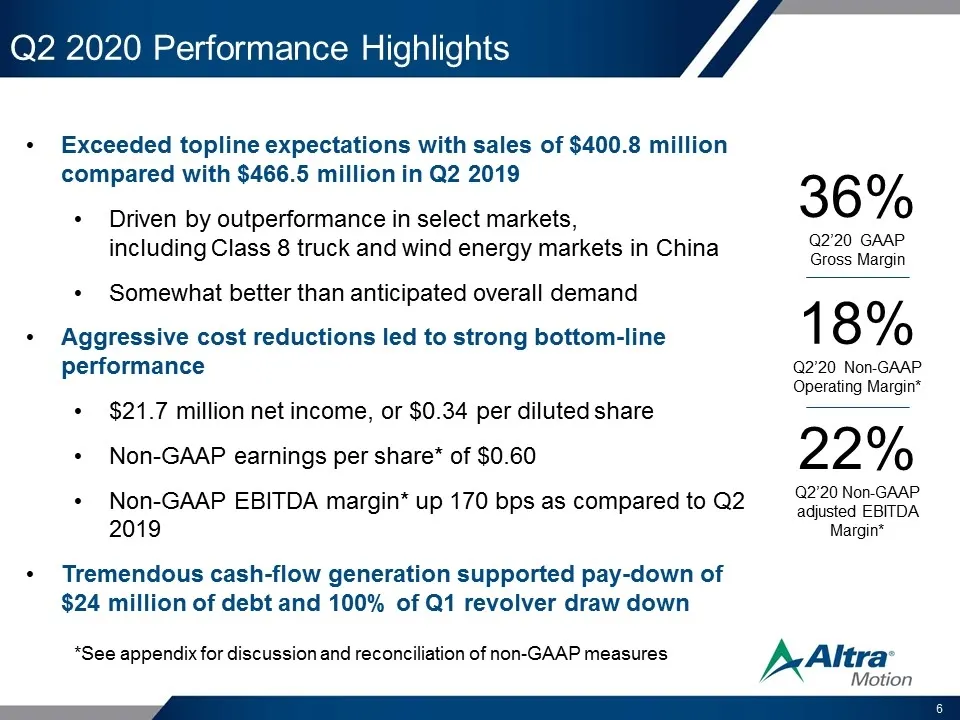
Q2 2020 Performance Highlights Exceeded topline expectations with sales of $400.8 million compared with $466.5 million in Q2 2019 Driven by outperformance in select markets, including Class 8 truck and wind energy markets in China Somewhat better than anticipated overall demand Aggressive cost reduc
Slide 7: Resilient and Nimble COVID-19 Response
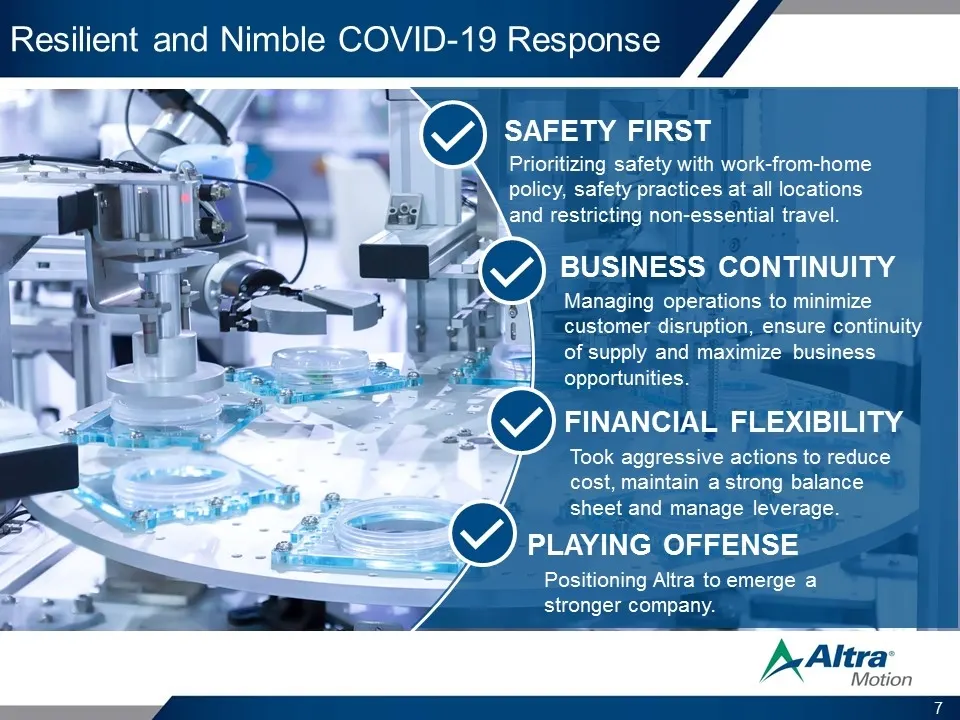
SAFETY FIRST FINANCIAL FLEXIBILITY Managing operations to minimize customer disruption, ensure continuity of supply and maximize business opportunities. Took aggressive actions to reduce cost, maintain a strong balance sheet and manage leverage. BUSINESS CONTINUITY Prioritizing safety with work-from
Slide 8: Q2 2020 Key End-Market Drivers
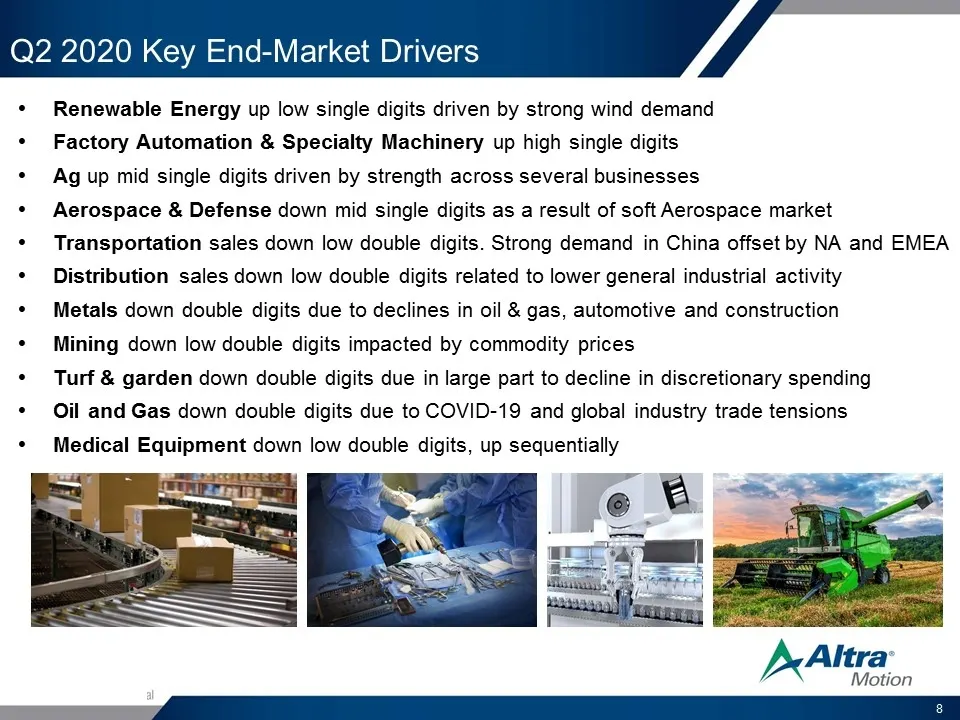
Q2 2020 Key End-Market Drivers Renewable Energy up low single digits driven by strong wind demand Factory Automation & Specialty Machinery up high single digits Ag up mid single digits driven by strength across several businesses Aerospace & Defense down mid single digits as a result of soft Aerospa
Slide 9: Q2 2020 Financial Highlights
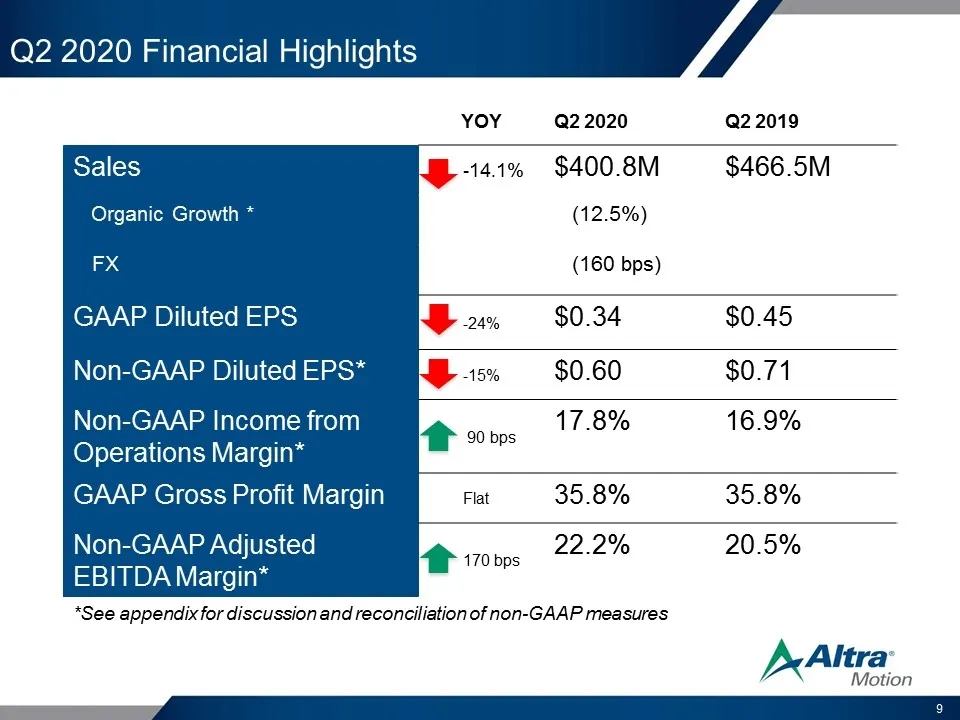
Q2 2020 Financial Highlights YOY Q2 2020 Q2 2019 Sales -14.1% $400.8M $466.5M Organic Growth * (12.5%) FX (160 bps) GAAP Diluted EPS -24% $0.34 $0.45 Non-GAAP Diluted EPS* -15% $0.60 $0.71 Non-GAAP Income from Operations Margin* 90 bps 17.8% 16.9% GAAP Gross Profit Margin Flat 35.8% 35.8% Non-GAAP A
Slide 10: Balance Sheet Highlights
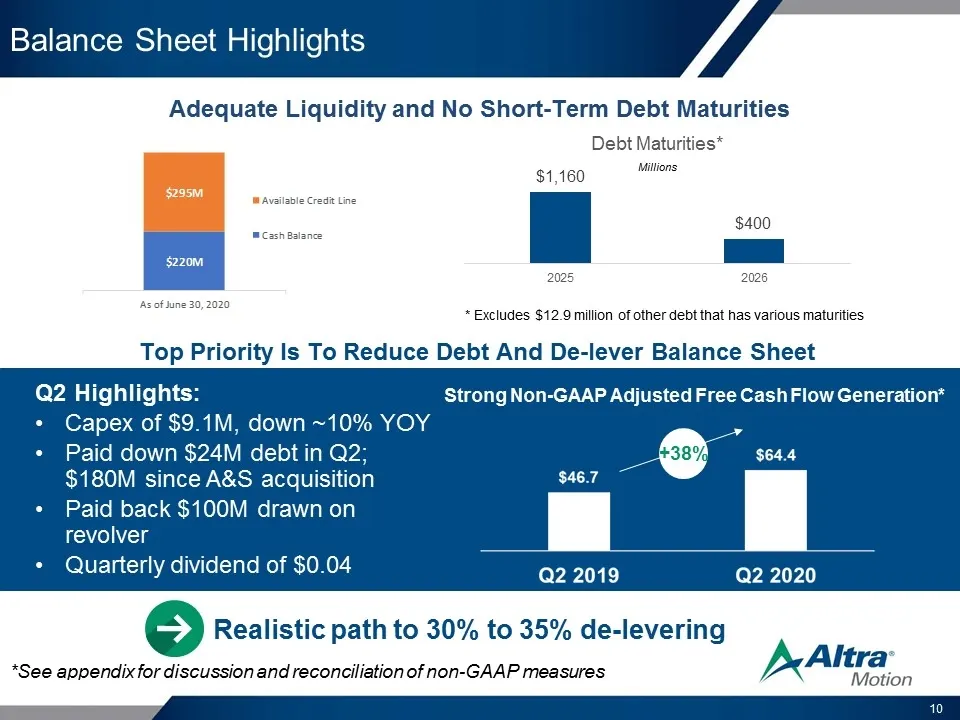
Balance Sheet Highlights Top Priority Is To Reduce Debt And De-lever Balance Sheet Adequate Liquidity and No Short-Term Debt Maturities * Excludes $12.9 million of other debt that has various maturities Millions Q2 Highlights: Capex of $9.1M, down ~10% YOY Paid down $24M debt in Q2; $180M since A&S
Slide 11: 2020 Guidance – Updated 7/24/2020
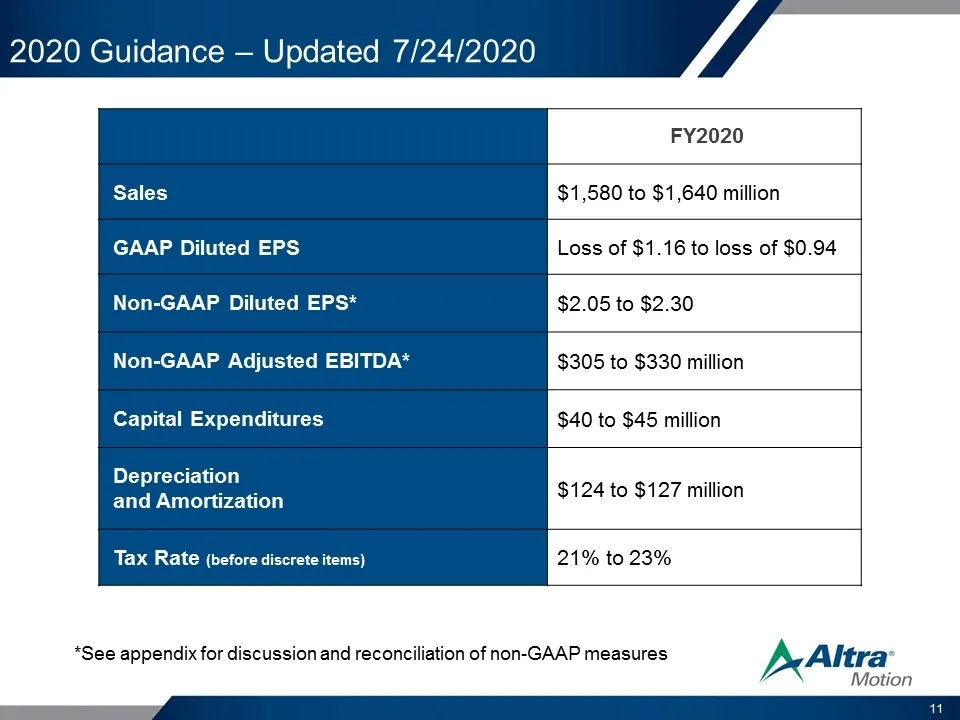
2020 Guidance – Updated 7/24/2020 FY2020 Sales $1,580 to $1,640 million GAAP Diluted EPS Loss of $1.16 to loss of $0.94 Non-GAAP Diluted EPS* $2.05 to $2.30 Non-GAAP Adjusted EBITDA* $305 to $330 million Capital Expenditures $40 to $45 million Depreciation and Amortization $124 to $127 million Tax R
Slide 12: Positioned to Deliver Sustainable Value
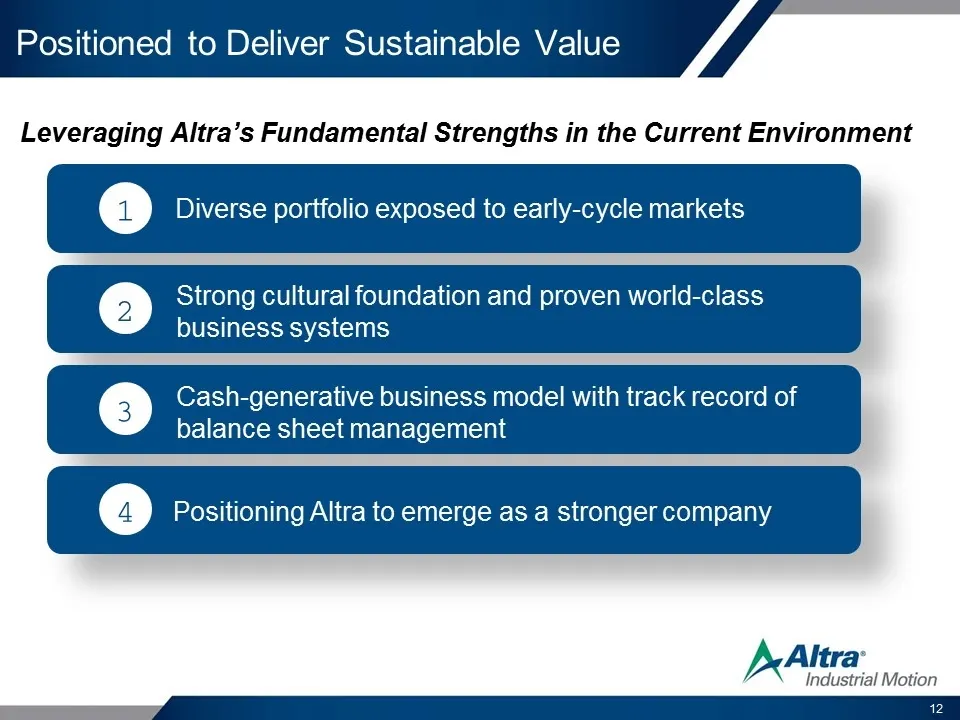
Diverse portfolio exposed to early-cycle markets 1 Strong cultural foundation and proven world-class business systems 2 Cash-generative business model with track record of balance sheet management 3 Positioning Altra to emerge as a stronger company 4 Positioned to Deliver Sustainable Value Leveragin
Slide 13: Discussion of Non-GAAP Measures
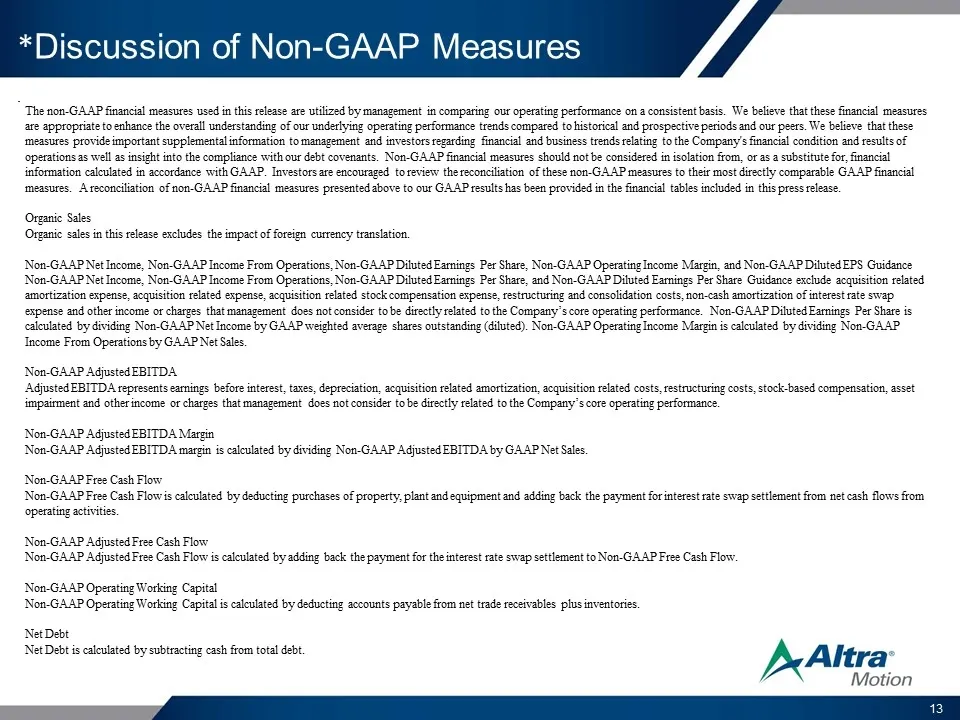
*Discussion of Non-GAAP Measures . The non-GAAP financial measures used in this release are utilized by management in comparing our operating performance on a consistent basis. We believe that these financial measures are appropriate to enhance the overall understanding of our underlying operating p
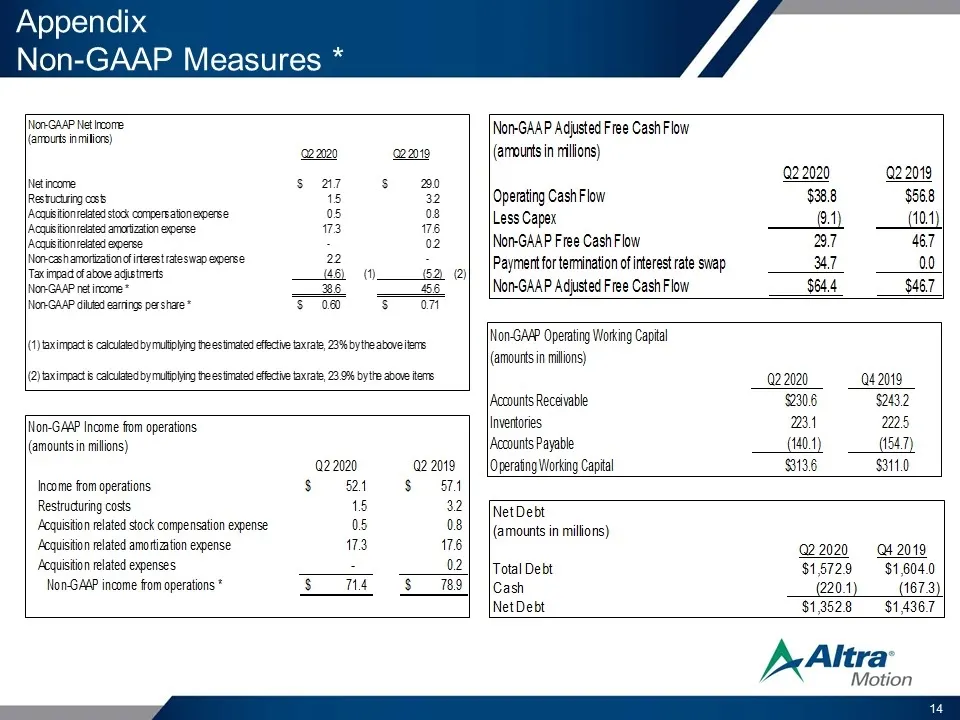
Slide 14: Appendix Non-GAAP Measures
Appendix Non-GAAP Measures * Non-GAAP Net Income (amounts in millions) Q2 2020 Q2 2019 Net income $21.7 $29.0 Restructuring costs 1.5 3.2 Acquisition related stock compensation expense 0.5 0.8 Acquisition related amortization expense 17.3 17.6 Acquisition related expense – 0.2 Non-cash amortization
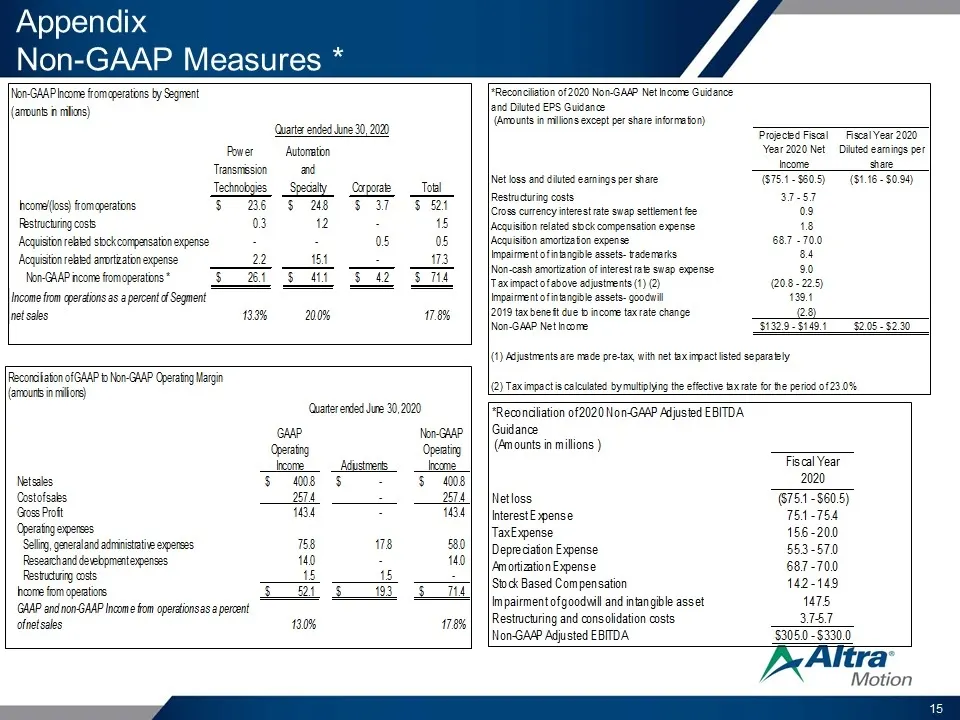
Slide 15: Appendix Non-GAAP Measures: Income from Operations by Segment
Appendix Non-GAAP Measures * Non-GAAP Income from operations by Segment (amounts in millions) Quarter ended June 30, 2020 Power Transmission Technologies Automation and Specialty Corporate Total Income/(loss) from operations $23.6 $24.8 $3.7 $52.1 Restructuring costs 0.3 1.2 - 1.5 Acquisition relate
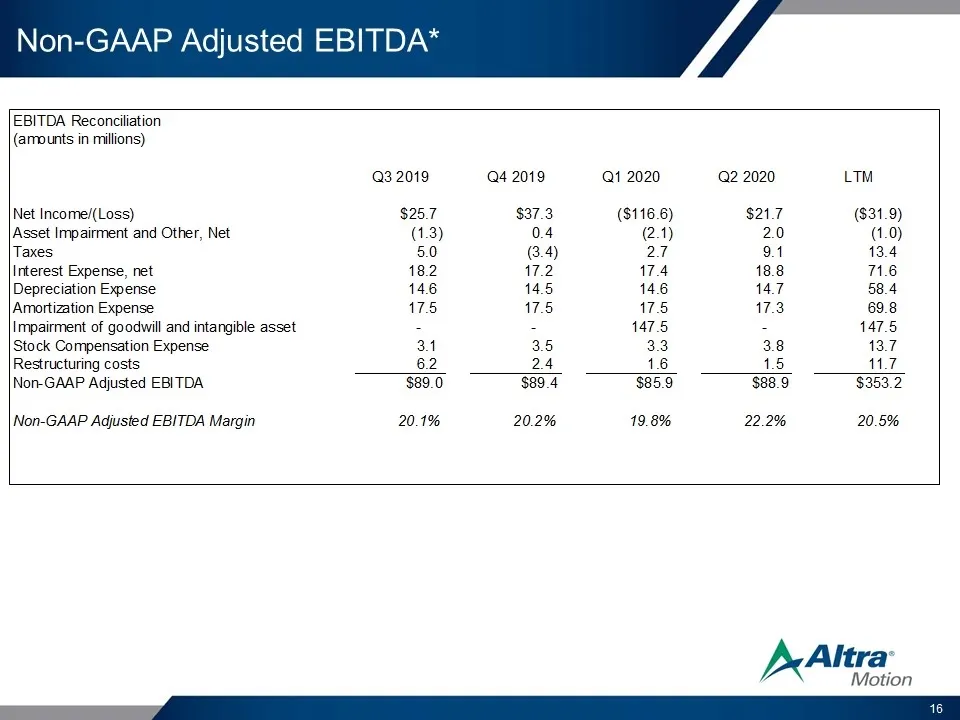
Slide 16: Non-GAAP Adjusted EBITDA Reconciliation
Non-GAAP Adjusted EBITDA* EBITDA Reconciliation (amounts in millions) Q3 2019 Q4 2019 Q1 2020 Q2 2020 LTM Net Income/(Loss) $25.7 $37.3 ($116.6) $21.7 ($31.9) Asset Impairment and Other, Net (1.3) 0.4 (2.1) 2.0 (1.0) Taxes 5.0 (3.4) 2.7 9.1 13.4 Interest Expense, net 18.2 17.2 17.4 18.8 71.6 Depreci
Source: SEC EDGAR · 8-K filed Jul 24, 2020
More decks from Altra Industrial Motion Corp
 Q2 2022 Earnings Presentation25 slides · Jul 28, 2022
 Q1 2022 Earnings Presentation25 slides · Apr 28, 2022
 Investor Day (March 2022)135 slides · Mar 11, 2022
 Q4 2021 Earnings Presentation17 slides · Feb 16, 2022
 Q3 2021 Earnings Presentation16 slides · Oct 22, 2021
 Q2 2021 Earnings Presentation16 slides · Jul 23, 2021