EP Energy — Barclays CEO Energy-Power Conference 2016
24 slides from EP Energy's conference presentation, Sep 7, 2016
Slide 1: Barclays CEO Energy-Power Conference
Barclays CEO Energy- Power Conference Brent Smolik Chairman, President and Chief Executive Officer EP Energy Corporation September 8, 2016
Slide 2: Cautionary Statement Regarding Forward-Looking Statements
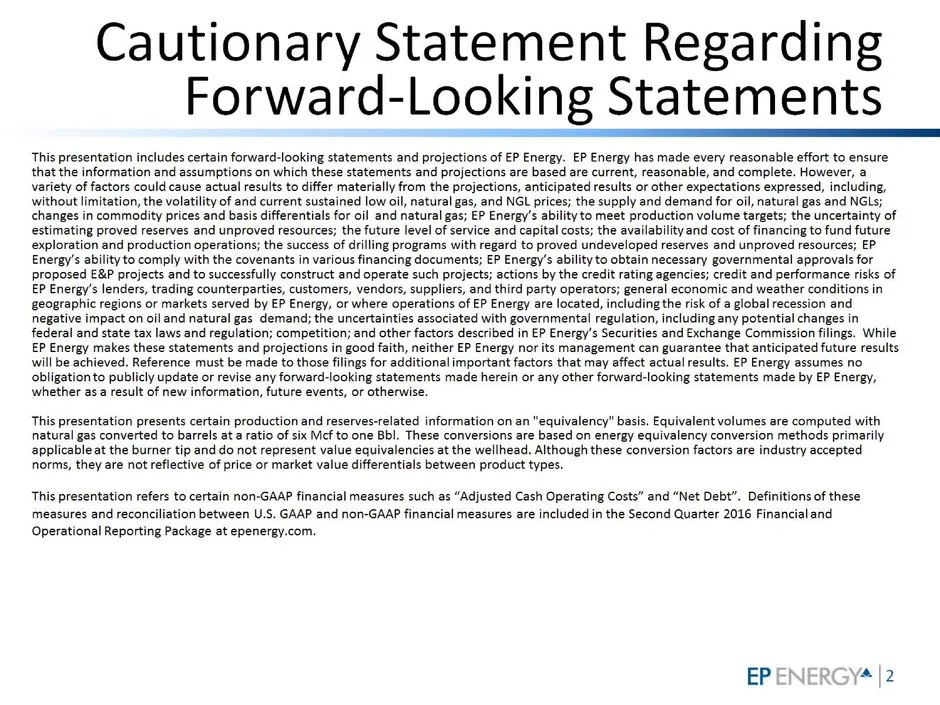
Cautionary Statement Regarding Forward-Looking Statements ay. EP Energ to ensure ble, and complete. However, a variety of ly from including, tural d NGL i ‘and natural gas; EP Energy’ success 8 EP propos ep feel emer ies, cust by EP Energy, or @ and ati By While EP Energy @ ll be achieved. Ref 8 ) n
Slide 3: EP Energy Corporation Overview and 2016 Key Initiatives
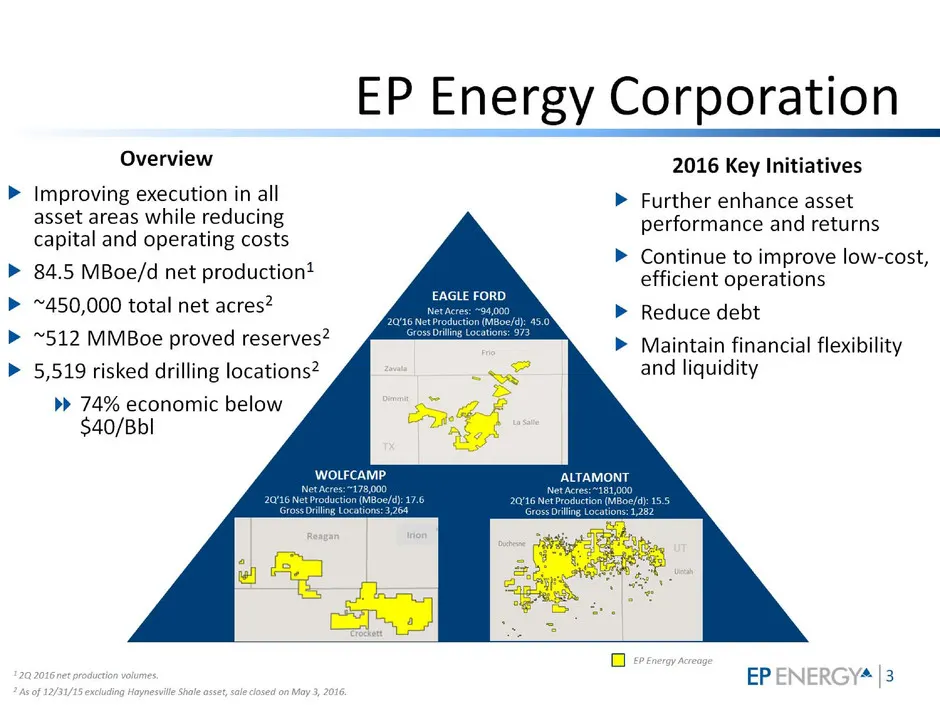
EP Energy Corporation Overview 2016 Key Initiatives Improving execution in all > Further enhance asset asset areas while reducing performance and returns capital and operating costs a > Continue to improve low-cost, 84.5 MBoe/d net production efficient operations ~450,000 total net acres? > Reduce d
Slide 4: Successfully Adding Value
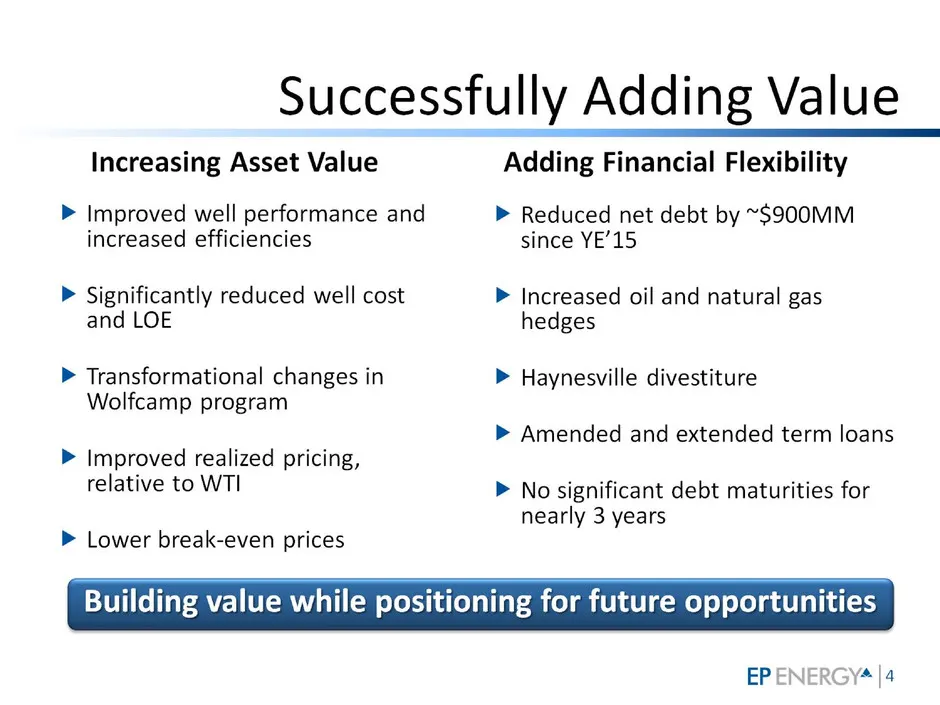
Successfully Adding Value Increasing Asset Value Adding Financial Flexibility > Improved well performance and > Reduced net debt by ~S900MM increased efficiencies since YE’15 > Significantly reduced well cost > Increased oil and natural gas and LOE edges > Transformational changes in > Haynesville d
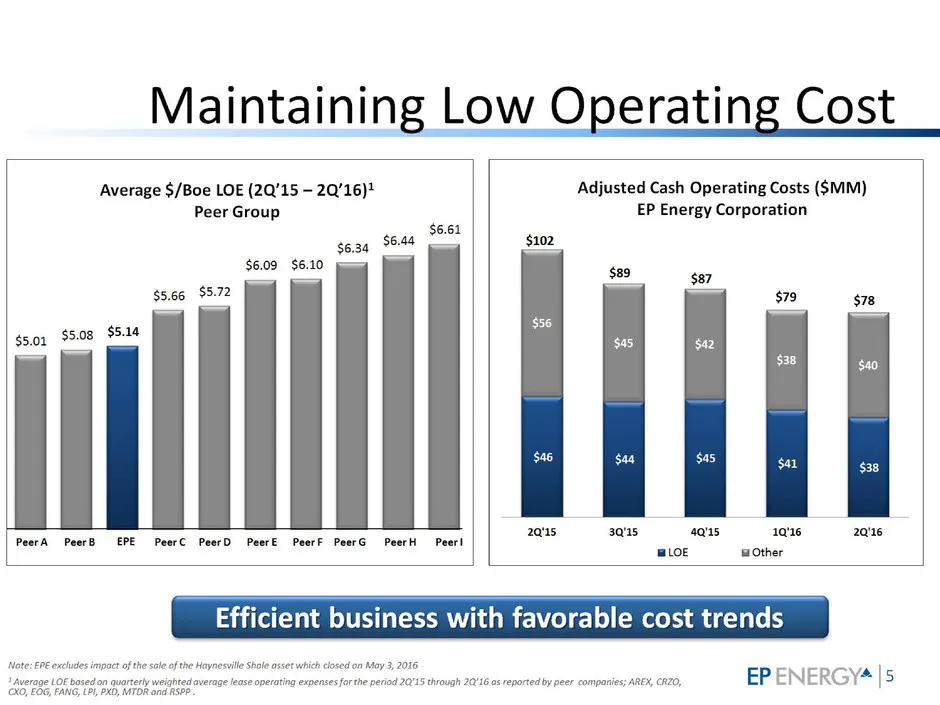
Slide 5: Maintaining Low Operating Cost
Maintaining Low Operating Cost ‘Average $/Boe LOE (2Q’15 - 2Q’16)* Adjusted Cash Operating Costs ($MM) P Energy Corporation $6.61 gosq S644 $6.09 $6.10 $89 ser $5.66 $5.72 } | $79 $78 $501 $5.08 $514 $45 $e $38 a saa $a a o 2015, 3015 4Q15, 1016 2016 PeerA PeerB EPE Perc PeerD PeerE PeerF PeerG Peer
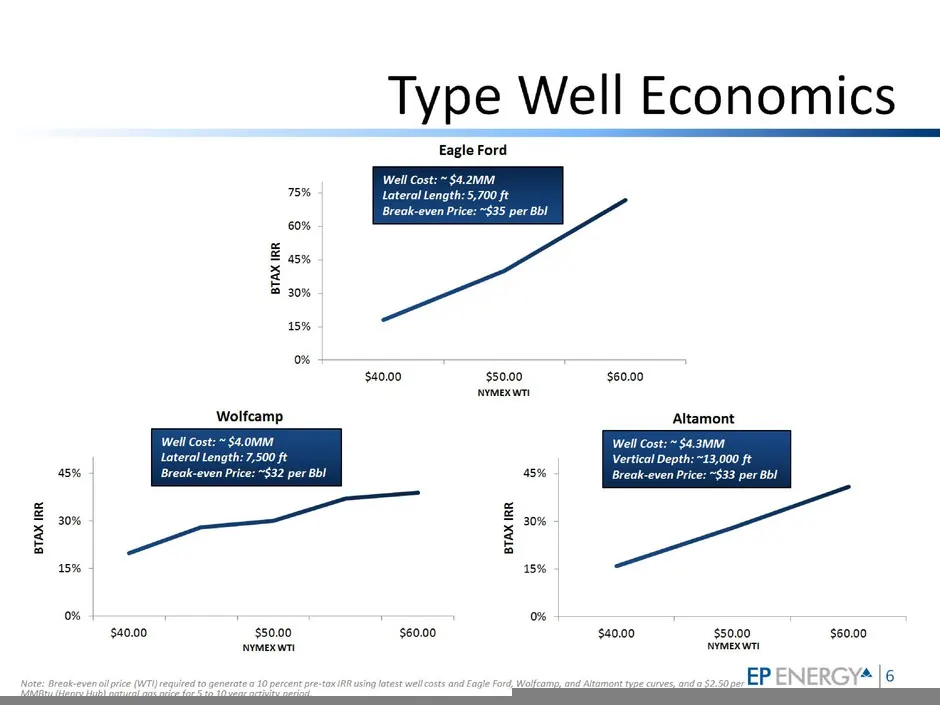
Slide 6: Type Well Economics
Type Well Economics Eagle Ford Well Cost: ~ $4.2MM 75% Lateral Length: 5,700 ft Break-even Price: ~$35 per Bb| 60% = 45% z 5 30% 15% o% $40.00 $50.00 $60.00 vwvmexwnt Wolfcamp Altamont Sees Vent Depth: 13 100 ft 45% Break-even. ne ey per Bbl 45% Break-even Price: ae per Bbl z z E son E aon 5 5 15% |
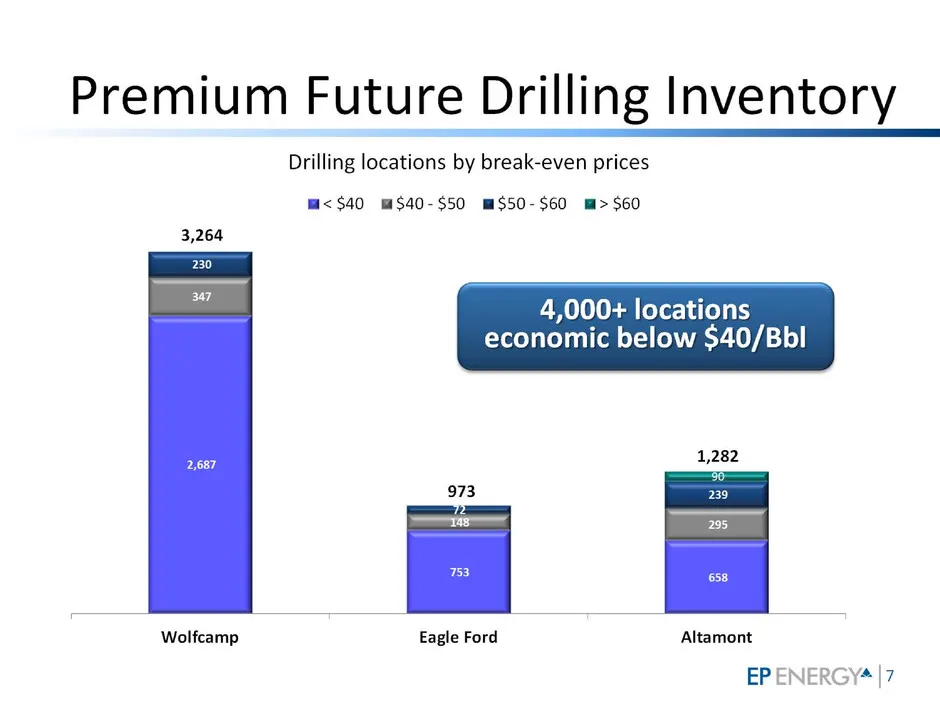
Slide 7: Premium Future Drilling Inventory
Premium Future Drilling Inventory Drilling locations by break-even prices m<$40 mS40-$50 m$50-$60 m>S$60 3,264 4,000+ locations economic below $40/Bbl 1,282 3 973 239 os 5 153 = Wolfcamp Eagle Ford Altamont EP ENERGY4 |7
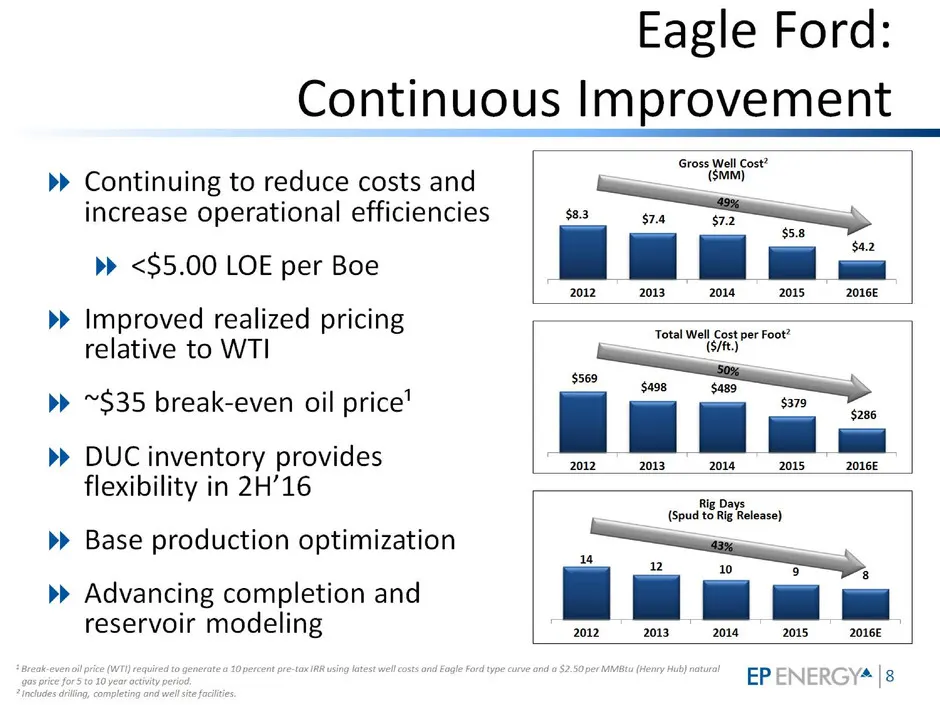
Slide 8: Eagle Ford: Continuous Improvement
Eagle Ford: Continuous Improvement >> Continuing to reduce costs and increase operational efficiencies >> <S5.00 LOE per Boe >> Improved realized pricing relative to WTI >> ~S35 break-even oil price’ >> DUC inventory provides flexibility in 2H’16 >> Base production optimization >> Advancing completi
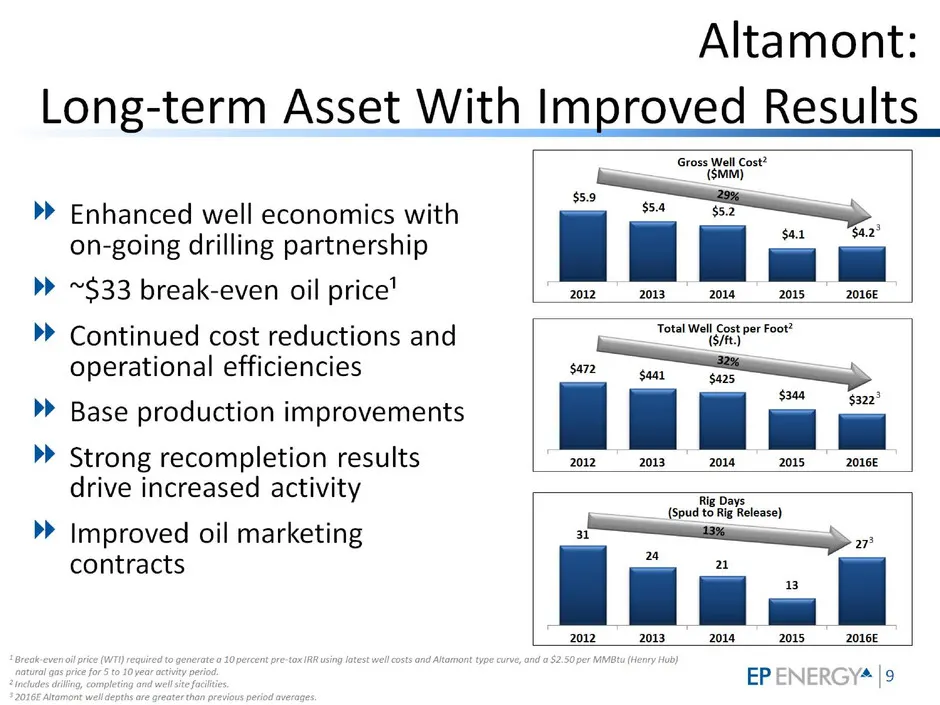
Slide 9: Altamont: Long-term Asset With Improved Results
Altamont: Long-term Asset With Improved Results Gross Well Cost? (SMM) : ‘ 2 ssa >> Enhanced well economics with 482 on-going drilling partnership a lel >> ~$33 break-even oil price’ 202-2013, 2ots— 01s 2016 >> Continued cost reductions and Leake ae operational efficiencies $344 322° >> Base product
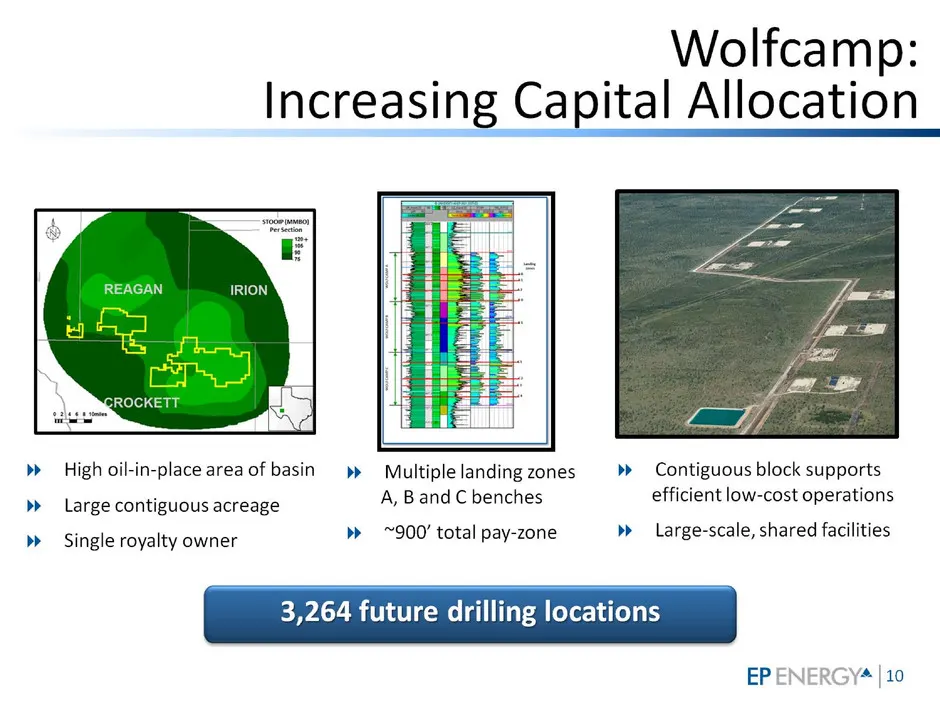
Slide 10: Wolfcamp: Increasing Capital Allocation
Wolfcamp: Increasing Capital Allocation REAGAN IRION >> High oil-in-place area of basin > ~Multiplelandingzones >» Contiguous block supports »> Large contiguous acreage A, Band C benches efficient low-cost operations >> Single royalty owner >» ~900’ total pay-zone >» Large-scale, shared facilities
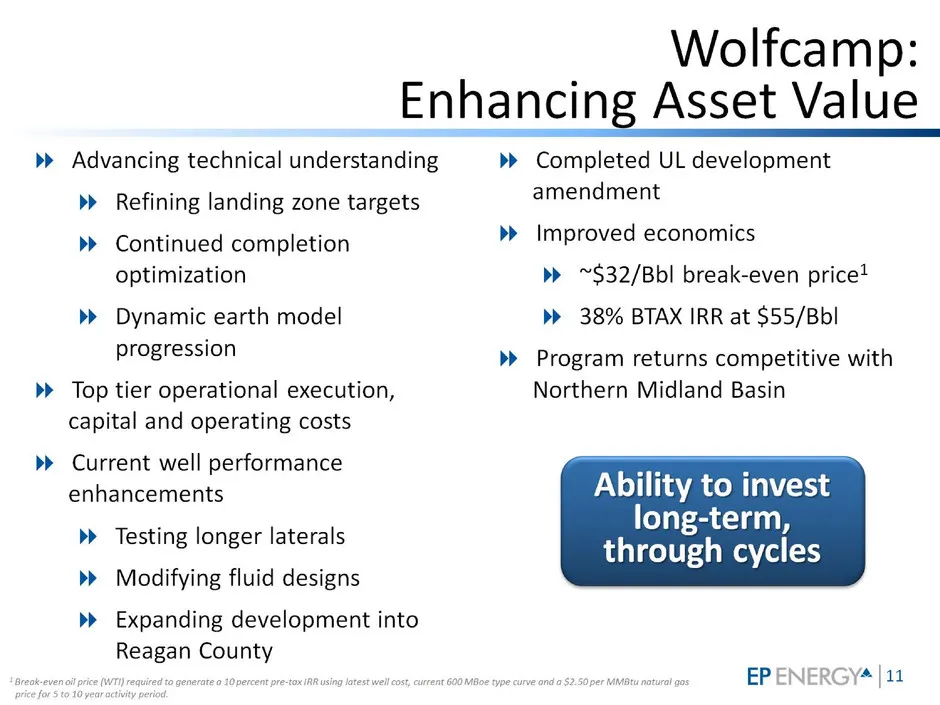
Slide 11: Wolfcamp: Enhancing Asset Value
Wolfcamp: Enhancing Asset Value_ >» Advancing technical understanding >> Completed UL development >» Refining landing zone targets amendment >> Continued completion »» Improved economics optimization >» ~$32/Bbl break-even price? >> Dynamic earth model >> 38% BTAX IRR at $55/Bbl progression ¥ Progra
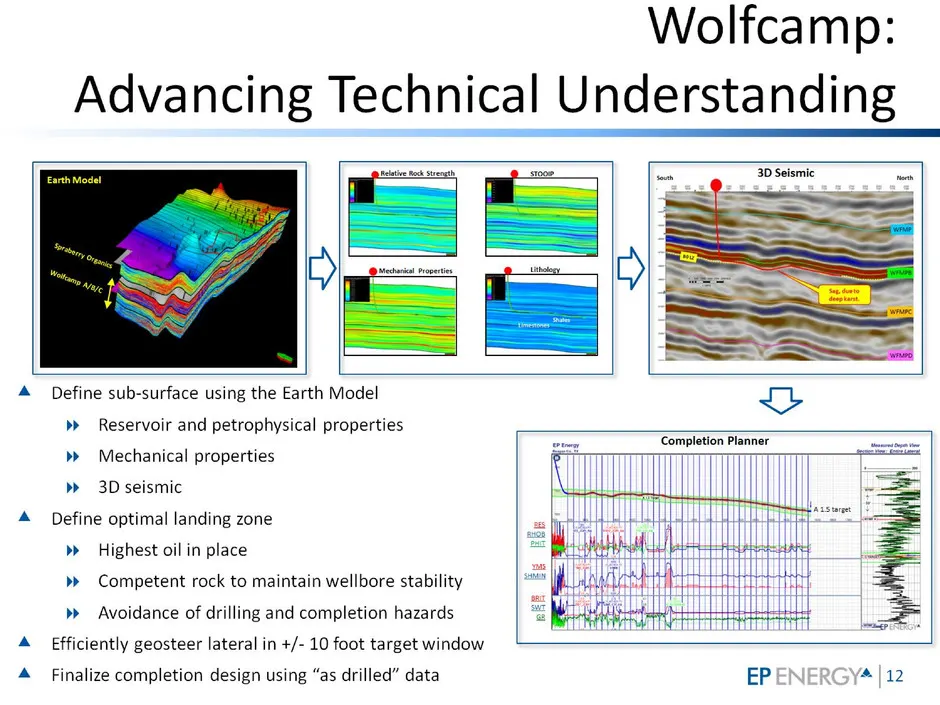
Slide 12: Wolfcamp: Advancing Technical Understanding
Wolfcamp: Advancing Technical Understanding y= > > >> Define sub-surface using the Earth Model >» Reservoir and petrophysical properties >» Mechanical properties >» 3D seismic Define optimal landing zone >» Highest oil in place >» Competent rock to maintain wellbore stability » Avoidance of drilling
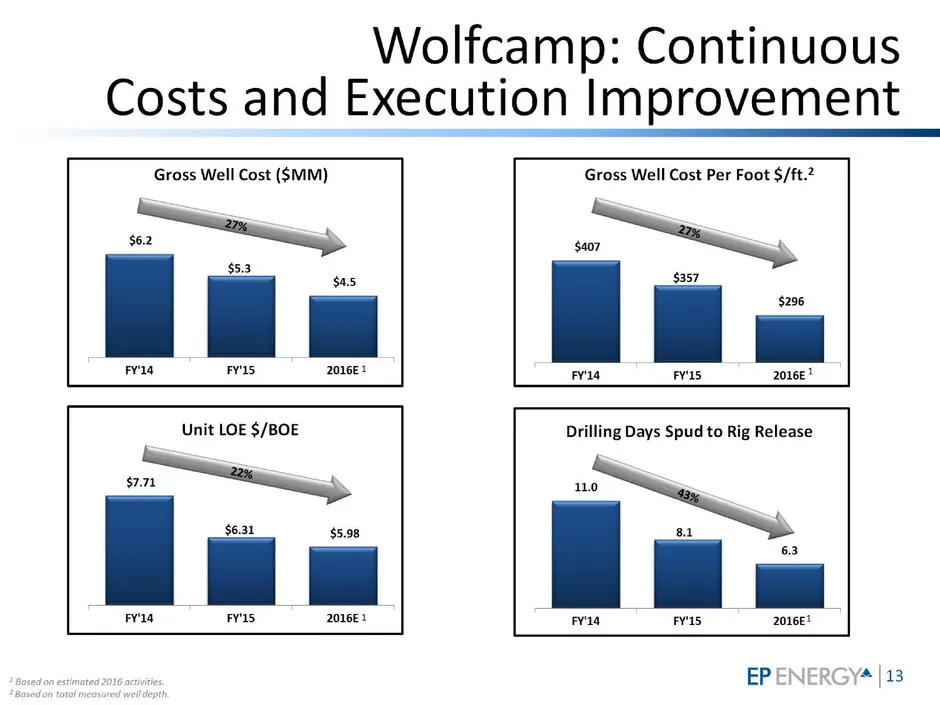
Slide 13: Wolfcamp: Continuous Costs and Execution Improvement
Wolfcamp: Continuous Costs and Execution Improvement Gross Well Cost ($MM) i $53 Load : Fy'14 FY'LS 2016E + Gross Well Cost Per Foot $/ft.? ay $357 Lal ~ Fa FIs 2016! Unit LOE $/BOE Drilling Days Spud to Rig Release o —, : | : 14 Fras 20168" 1 =a EP ENERGY | 13
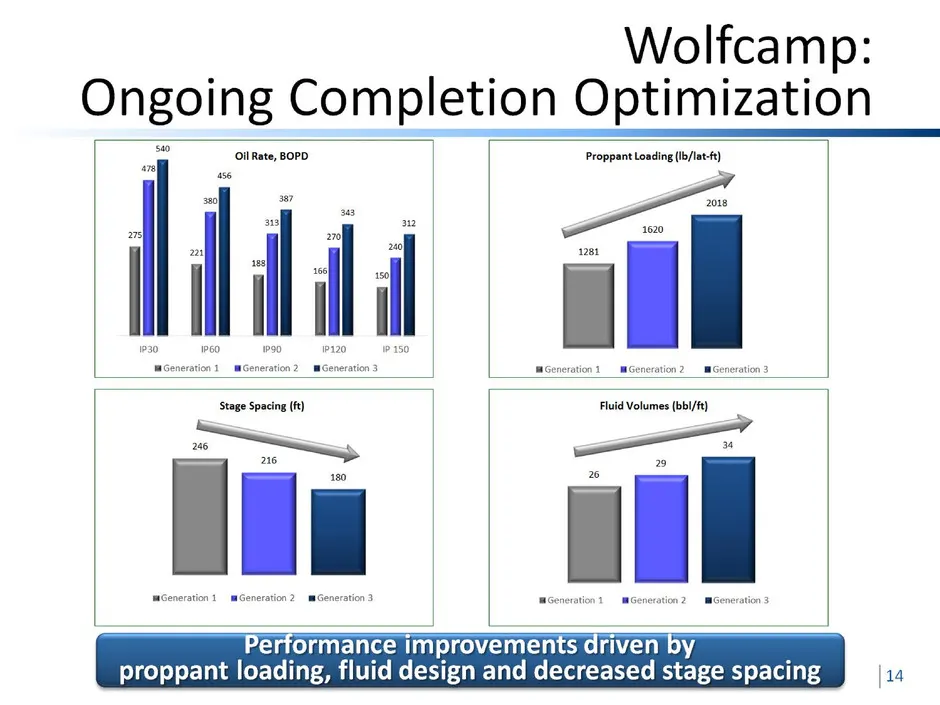
Slide 14: Wolfcamp: Completion Optimization
Wolfcamp: rogers Completion Optimization ll Rate, BOPD Proppant Loading (Ib/lat-t) 2018 1620 WI Md : a Generation 1_mGeneration 2_mGeneration 3 ‘Generation 1 mGeneration 2 mGeneration 3 — Spacing (ft) lui saGeneration 1 Performance improvements driven by proppant loading, fluid design and decreased
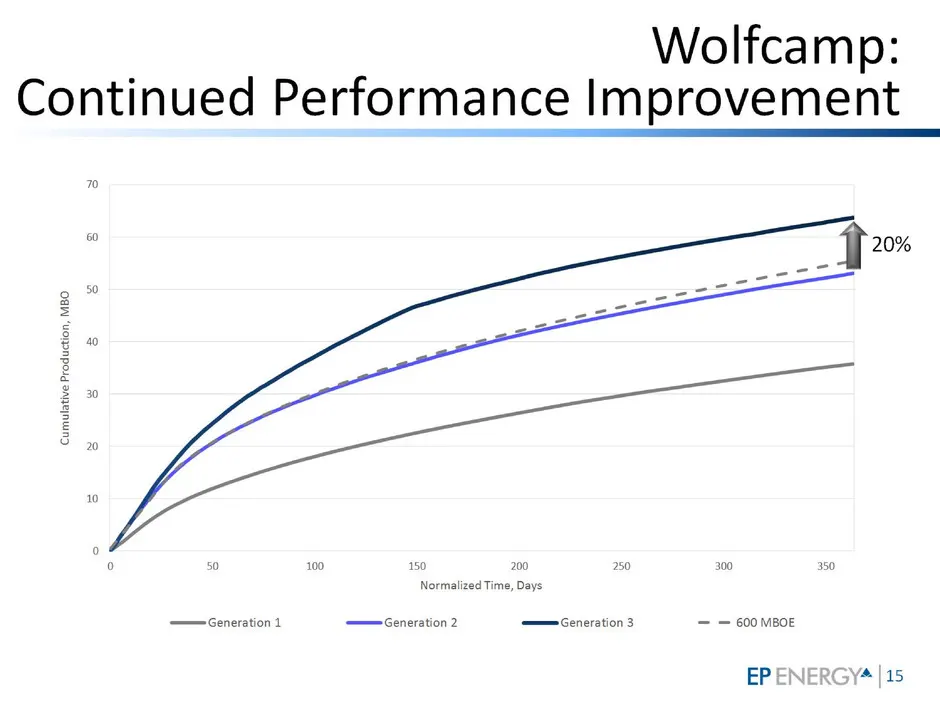
Slide 15: Wolfcamp: Continued Performance Improvement
Wolfcamp: Continued Performance Improvement
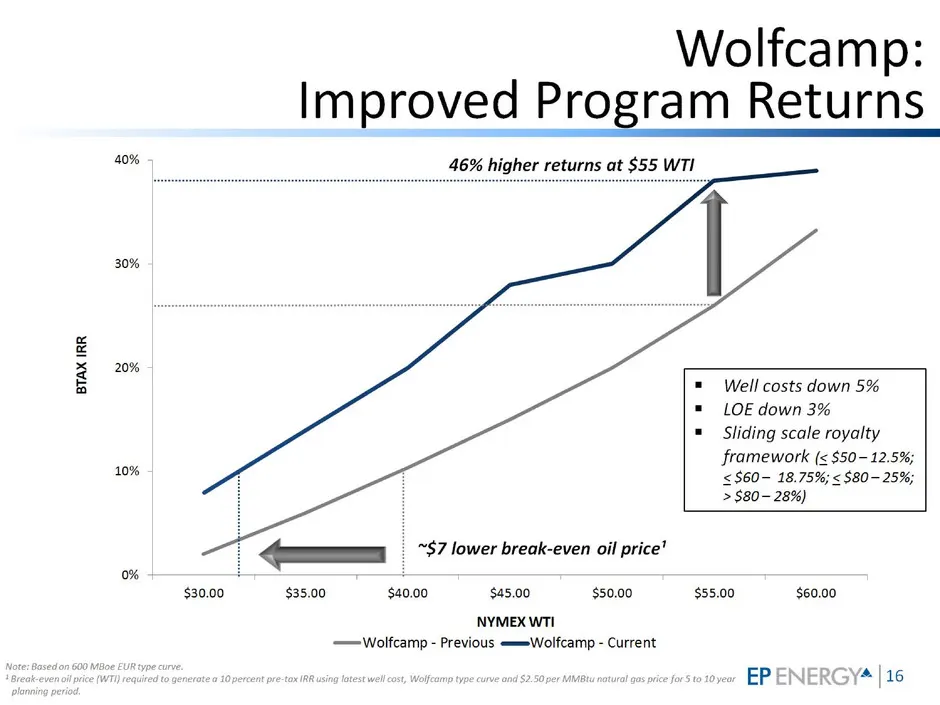
Slide 16: Wolfcamp: Improved Program Returns
BTAX IRR Wolfcamp: Improved Program Returns 46% higher returns at $55 WTI $30.00 = $35.00 ~$7 lower break-even oil price’ $40.00 $45.00 NYMEX WTI $50.00 Well costs down 5% LOE % Sliding scale royalty framework (< $50- 12.5%; <$60- 18.75%; < $80-25%; > $80- 28%) $55.00 $60.00
Slide 17: Wolfcamp: Success Attracts More Capital
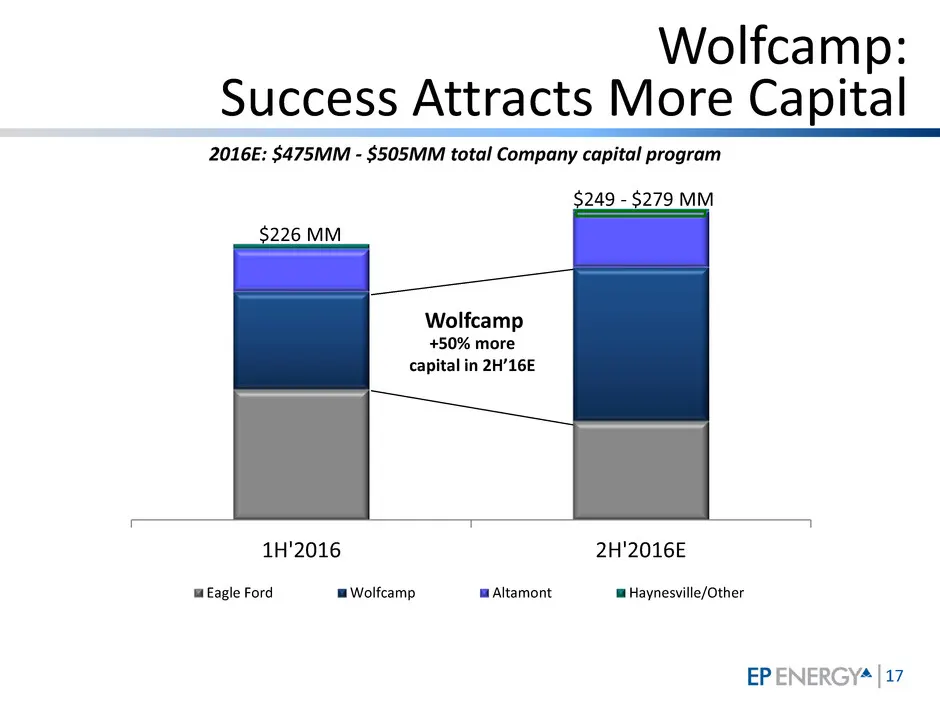
17 Wolfcamp: Success Attracts More Capital 2016E: $475MM - $505MM total Company capital program 1H'2016 2H'2016E Eagle Ford Wolfcamp Altamont Haynesville/Other +50% more capital in 2H’16E Wolfcamp $226 MM $249 - $279 MM
Slide 18: Industry Leading Hedge Program
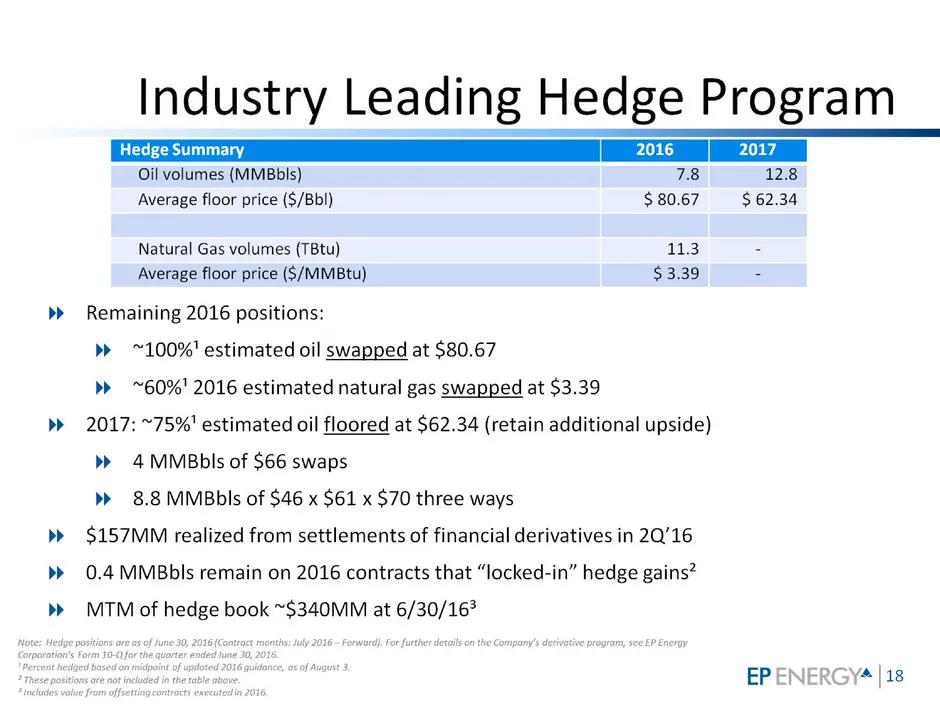
Industry Leading Hedge Program Oil volumes (MMBbIs) 78 12.8 ‘Average floor price ($/Bbl) $80.67 $62.34 Natural Gas volumes (TBtu) Aas Average floor price ($/MMBtu) $3.39 =" >> Remaining 2016 positions: >> ~100%' estimated oil swapped at $80.67 >> ~60%' 2016 estimated natural gas swapped at $3.39 >»
Slide 19: A Compelling Value Opportunity
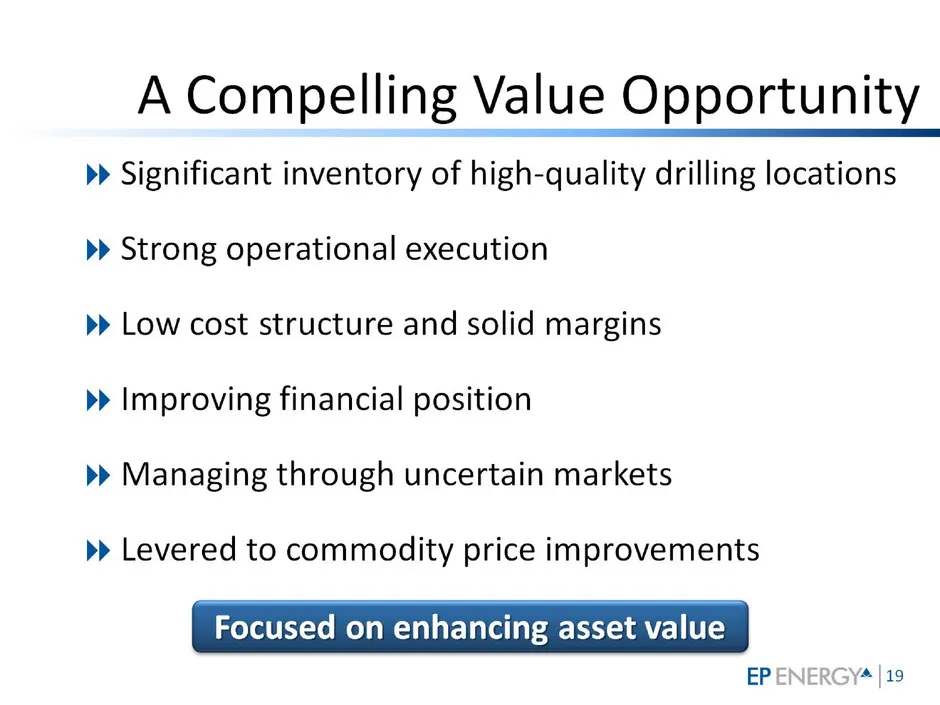
A Compelling Value Opportunity | >> Significant inventory of high-quality drilling locations >> Strong operational execution >> Low cost structure and solid margins >> Improving financial position >> Managing through uncertain markets >> Levered to commodity price improvements Focused on enhancing a
Slide 20: Barclays CEO Energy-Power Conference
Barclays CEO Energy- Power Conference Brent Smolik Chairman, President and Chief Executive Officer EP Energy Corporation September 8, 2016
Slide 21: Appendix
Slide 22: 2016 Outlook
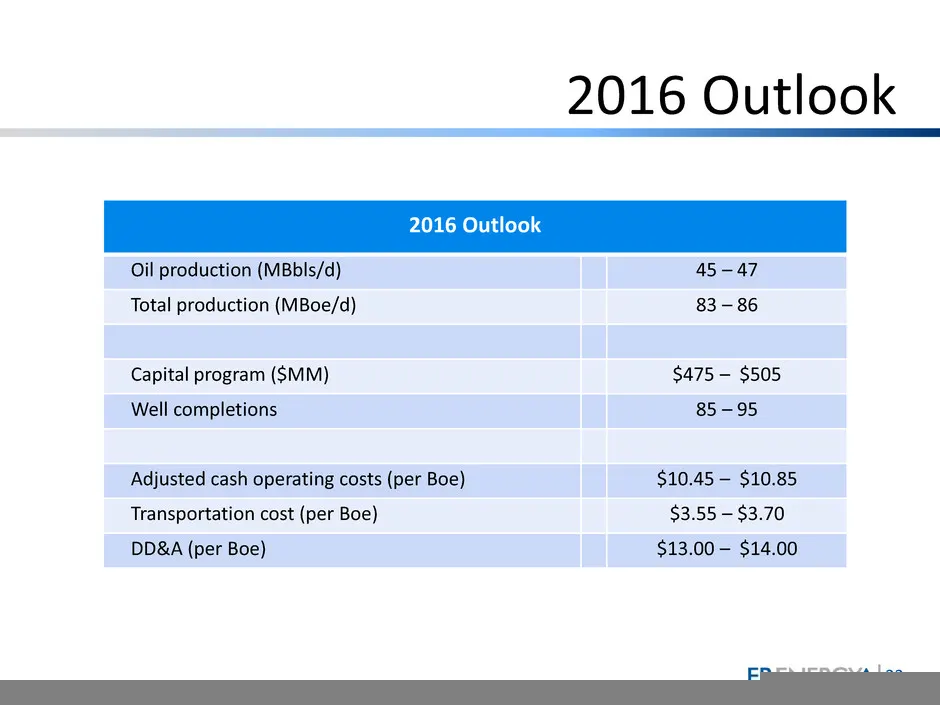
22 2016 Outlook 2016 Outlook Oil production (MBbls/d) 45 – 47 Total production (MBoe/d) 83 – 86 Capital program ($MM) $475 – $505 Well completions 85 – 95 Adjusted cash operating costs (per Boe) $10.45 – $10.85 Transportation cost (per Boe) $3.55 – $3.70 DD&A (per Boe) $13.00 – $14.00
Slide 23: Type Well Economics
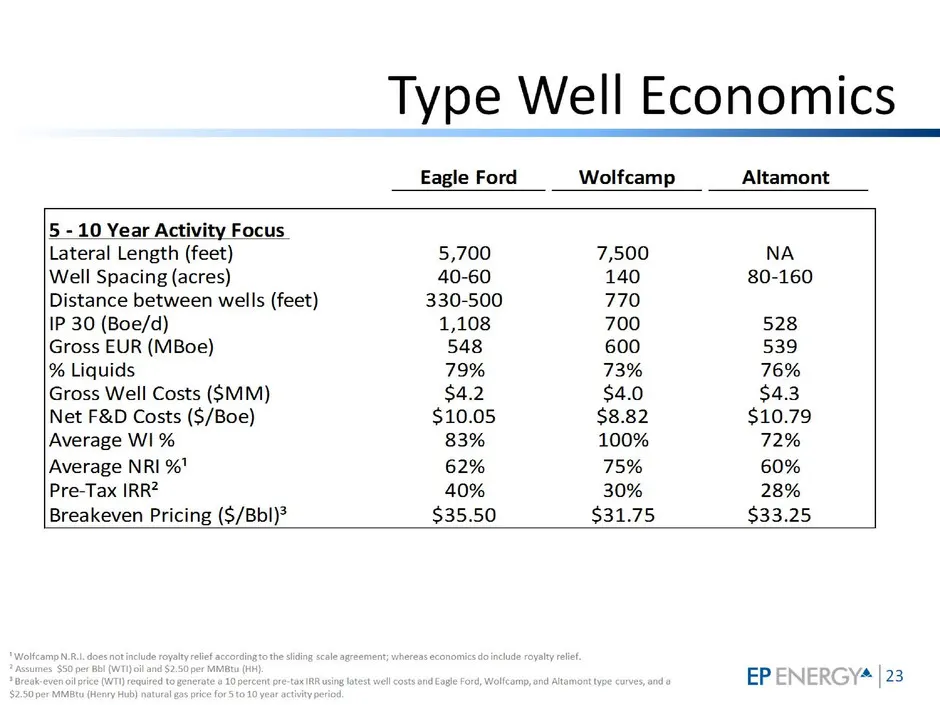
Type Well Economics Eagle Ford Wolfcamp Altamont 5 - 10 Year Activity Focus Lateral Length (feet) 5,700 7,500 NA Well Spacing (acres) 40-60 140 80-160 Distance between wells (feet) 330-500 770 IP 30 (Boe/d) 1,108 700 528 Gross EUR (MBoe) 548 600 539 % Liquids 79% 73% 76% Gross Well Costs (SMM) $4.2
Slide 24: Maintaining Financial Flexibility
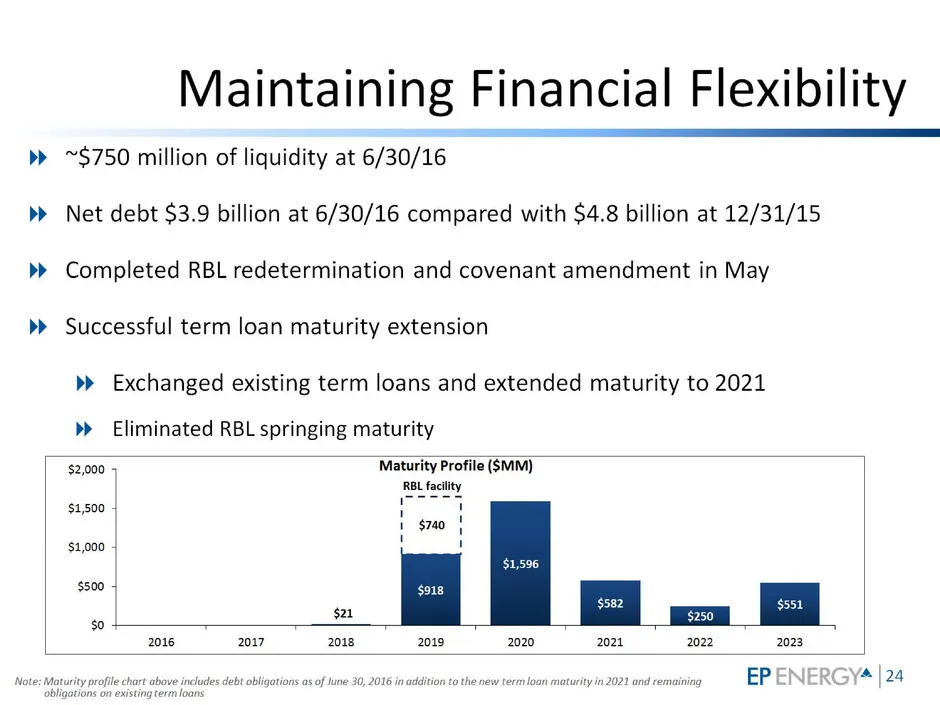
zy 4 yz yz 4 4 yz 4 Maintaining Financial Flexibility ~$750 million of liquidity at 6/30/16 Net debt $3.9 billion at 6/30/16 compared with $4.8 billion at 12/31/15 Completed RBL redetermination and covenant amendment in May Successful term loan maturity extension >» Exchanged existing term loans and
Source: SEC EDGAR · 8-K filed Sep 7, 2016
More decks from EP Energy Corp
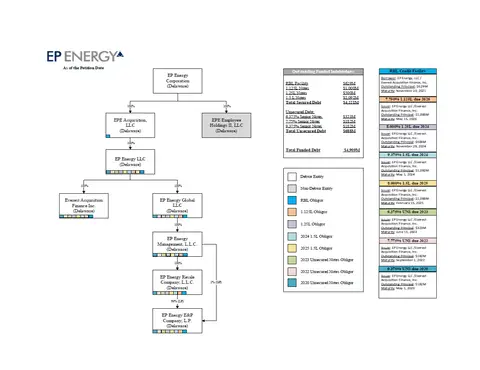 Presentation (January 2020)6 slides · Jan 9, 2020
 Investor Presentation (October 2019)83 slides · Oct 4, 2019
 IPO Roadshow (October 2019)5 slides · Oct 4, 2019
 Investor Presentation (September 2018)11 slides · Sep 5, 2018
 Debt Investor Presentation (May 2018)25 slides · May 17, 2018
 Credit Suisse Energy Summit 201724 slides · Feb 14, 2017