Provident Bankshares — Sandler O'Neill Financial Services Conference 2005
66 slides from Provident Bankshares's conference presentation, Nov 17, 2005

Slide 1: Sandler O'Neill Financial Services Conference
PROVIDENT BANKSHARES C O R P O R A T I O N Sandler O’Neill Financial Services Conference November 17, 2005 PROVIDENT BANKSHARES C O R P O R A T I O N Exhibit 99.1

Slide 2: Forward-Looking Statements and Risk Factors
FORWARD-LOOKING STATEMENTS AND RISK FACTORS This presentation, as well as other written communications made from time to time by Provident Bankshares Corporation and its subsidiaries (the “Corporation”) (including, without limitation, the Corporation’s 2004 Annual Report to Stockholders) and oral co

Slide 3: Agenda
• Introduction and Overview • Key Strategies • Financial Highlights • Peer Group Performance • Opportunities Agenda Agenda

Slide 4: Introduction and Overview
– Headquartered in Baltimore, Maryland – Total assets of $6.4 billion (as of 9/30/05) – Serves individuals, families, small businesses and larger companies in Baltimore, Washington and Richmond areas – Over 2,000 employees Introduction and Overview Introduction and Overview

Slide 5: Provident Bank History
Provident Bank History • 1886 Founded as a Mutual Thrift • 1987 Converted to Commercial Bank • 1993 Retail Banking Expansion • 1997 Citizen’s Savings Bank Merger • 2004 Southern Financial Merger Introduction Introduction
Slide 6: Banking Office Network 2005
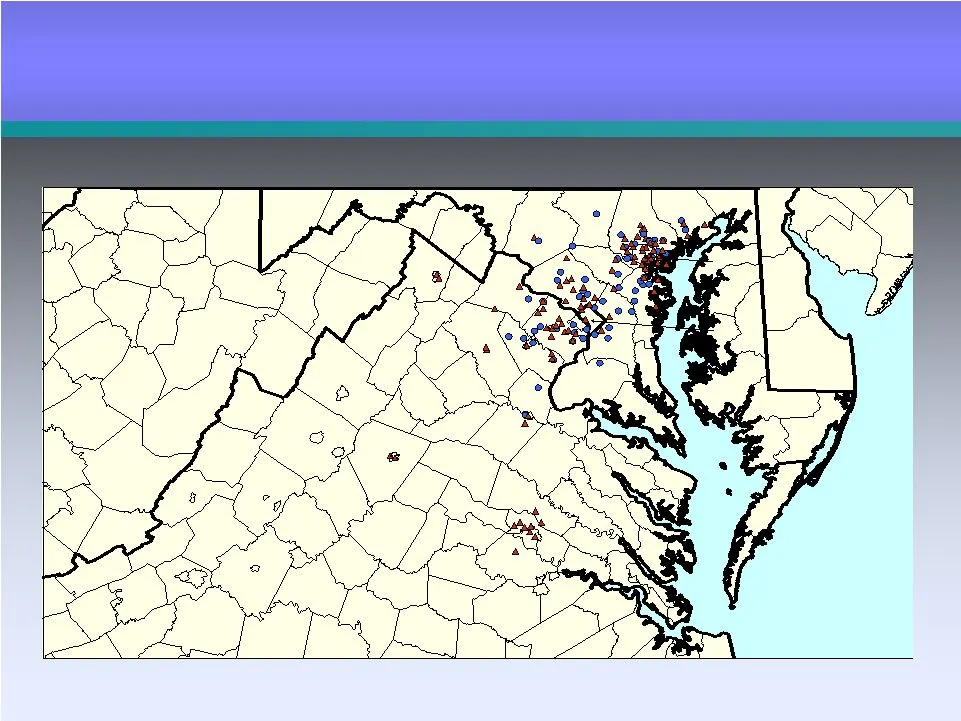
Banking Office Network 2005 Banking Office Network 2005 152 Branches 152 Branches Washington DC Baltimore Virginia Beach Winchester Charlottesville Richmond

Slide 7: Provident Bank Mission
Provident Bank’s mission is to exceed customer expectations by delivering superior service, products and banking convenience. Every employee’s commitment to serve our customers in this fashion will establish Provident Bank as the primary bank of choice of individuals, families, small businesses and

Slide 8: Provident Bank Vision
Provident Bank’s vision is to be chosen as our customers’ primary bank because we consistently execute our business as The Right Size Bank. Introduction Introduction Provident Bank Vision Provident Bank Vision

Slide 9: Provident Bank Core Values
Integrity Excellence Caring Partnership Results Driven Introduction Introduction Provident Bank Core Values Provident Bank Core Values

Slide 10: Provident Bank Key Strategies
– Maximize Provident’s Position as the “Right Size” Bank in the Marketplace – Grow and Deepen Consumer and Small Business Relationships in Maryland and Virginia – Grow and Deepen Commercial and Real Estate Relationships in Maryland and Virginia – Move from a Product Driven Organization to a Customer

Slide 11: Positioning Strategy
We will continue to provide the products and services of our largest competitors, while delivering the level of service found in only the best community banks. Provident Bank Provident Bank Positioning Strategy Positioning Strategy

Slide 12: Key Strategy #2: Consumer and Small Business Relationships
– Maximize Provident’s Position as the “Right Size” Bank in the Marketplace – Grow and Deepen Commercial and Real Estate Relationships in Maryland and Virginia – Move from a Product Driven Organization to a Customer Relationship Focused Sales Culture – Create a High Performance Culture that Focuses
Slide 13: Provident Bank Branches
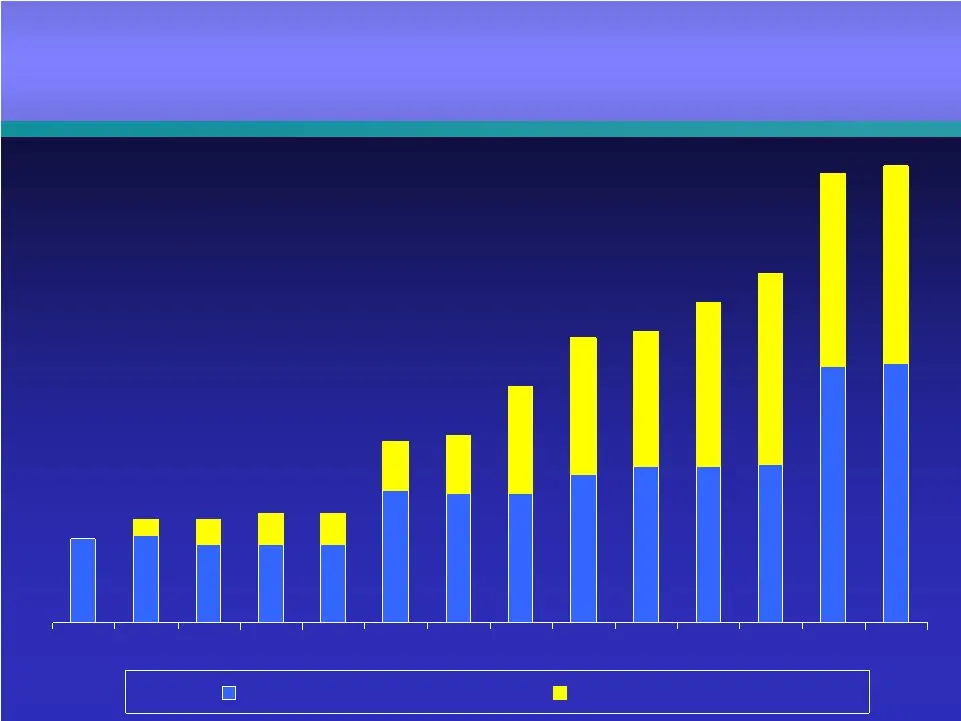
90 58 58 89 59 56 36 34 34 51 50 50 37 34 1992 1993 1994 1995 1996 1997 1998 1999 2000 2001 2002 2003 2004 3Q05 Traditional In-Store/ATM Plus Provident Bank Branches Provident Bank Branches TRADITIONAL/IN-STORE
Slide 14: Consumer Loan and Deposit Growth
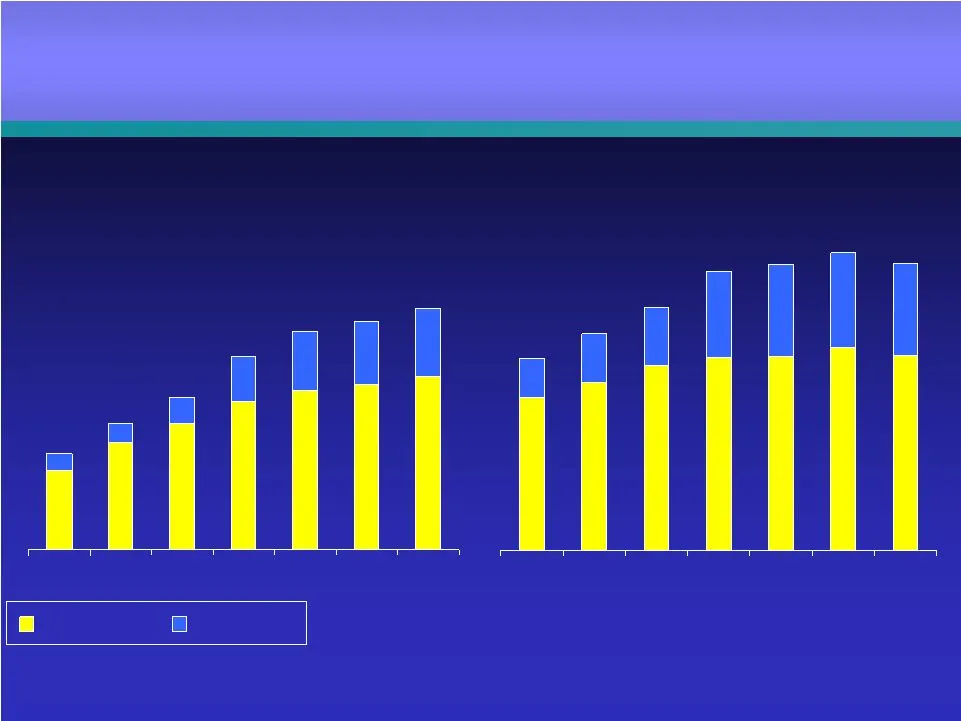
2001 2002 2003 2004 1Q05 2Q05 3Q05 Baltimore VA/Wash $663 $797 $906 LOANS 2001 2002 2003 2004 1Q05 2Q05 3Q05 $1,394 $1,536 $1,682 DEPOSITS (E xcluding CD/IRA ) $1,891 $1,089 $1,930 $1,194 $1,293 $1,997 $1,236 $1,935 Consumer Loan and Consumer Loan and Deposit Growth Deposit Growth Average Balances (
Slide 15: Retail DDA Fees
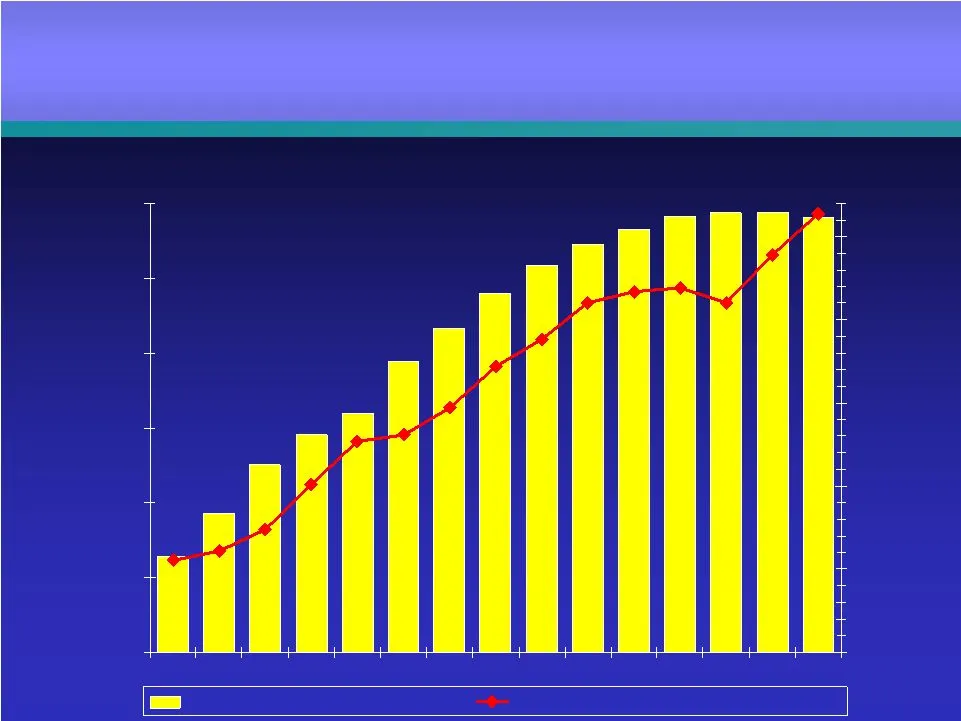
0 50,000 100,000 150,000 200,000 250,000 300,000 1993 1994 1995 1996 1997 1998 1999 2000 2001 2002 2003 2004 1Q052Q053Q05 $0 $50 $100 $150 $200 $250 Accounts on Hand Average Fee Income Per Consumer DDA Retail DDA Fees Retail DDA Fees Annual Fees Per Account Annual Fees Per Account
Slide 16: Consumer Loans
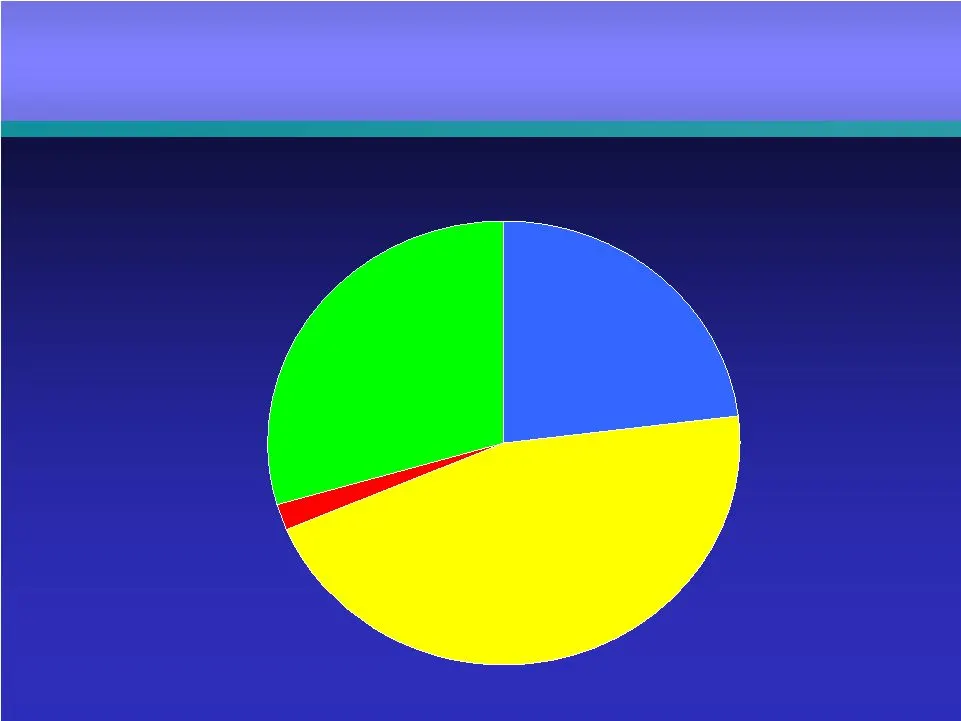
3Q05 Consumer Loans Consumer Loans Residential & Acquired 30% Other 2% Home Equity 45% Marine 23% Total Consumer Loans $1.8 Billion Average Balances
Slide 17: Home Equity
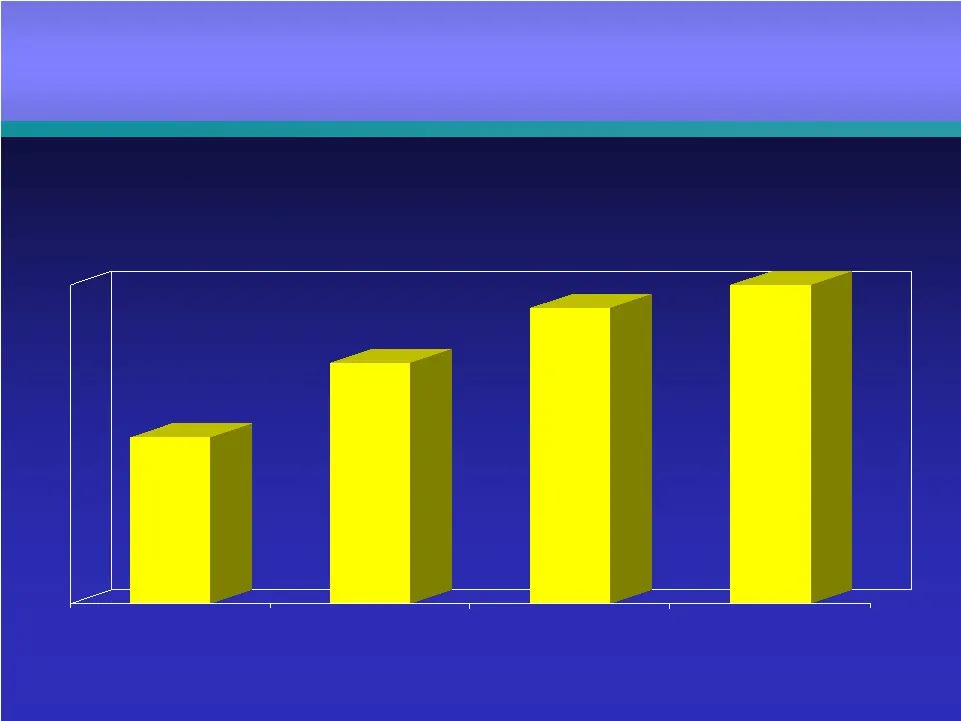
$433,194 $628,990 $772,558 $831,987 3Q03 3Q04 2Q 05 3Q 05 38.6% CAGR Home Equity Home Equity Quarterly Comparison Quarterly Comparison

Slide 18: Small Business Growth
Total Deposits $151 $420 Second Quarter Period End Balances ($ millions) Small Business Growth Small Business Growth Total Loans $ 15 $241 Customer Relationships 18,368 30,000 2001 2005

Slide 19: Key Strategy #3: Commercial and Real Estate Relationships
– Maximize Provident’s Position as the “Right Size” Bank in the Marketplace – Grow and Deepen Consumer and Small Business Relationships in Maryland and Virginia – Move from a Product Driven Organization to a Customer Relationship Focused Sales Culture – Create a High Performance Culture that Focuses
Slide 20: Commercial Loan and Deposit/Repo
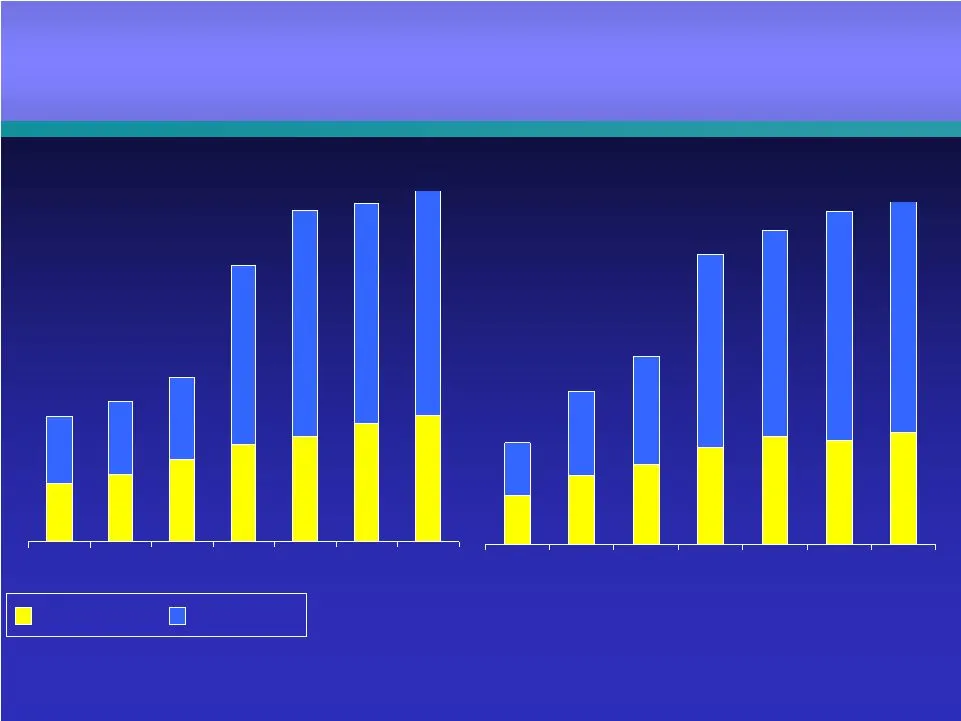
2001 2002 2003 2004 1Q05 2Q05 3Q05 Baltimore VA/Wash $791 $856 $961 2001 2002 2003 2004 1Q05 2Q05 3Q05 $426 $579 $680 $982 $1,444 $1,050 $1,684 $1,109 $1,714 $1,781 $1,182 Commercial Loan Commercial Loan and Deposit/Repo and Deposit/Repo Average Balances (millions) Loans exclude acquired loans LOANS
Slide 21: Commercial Loans
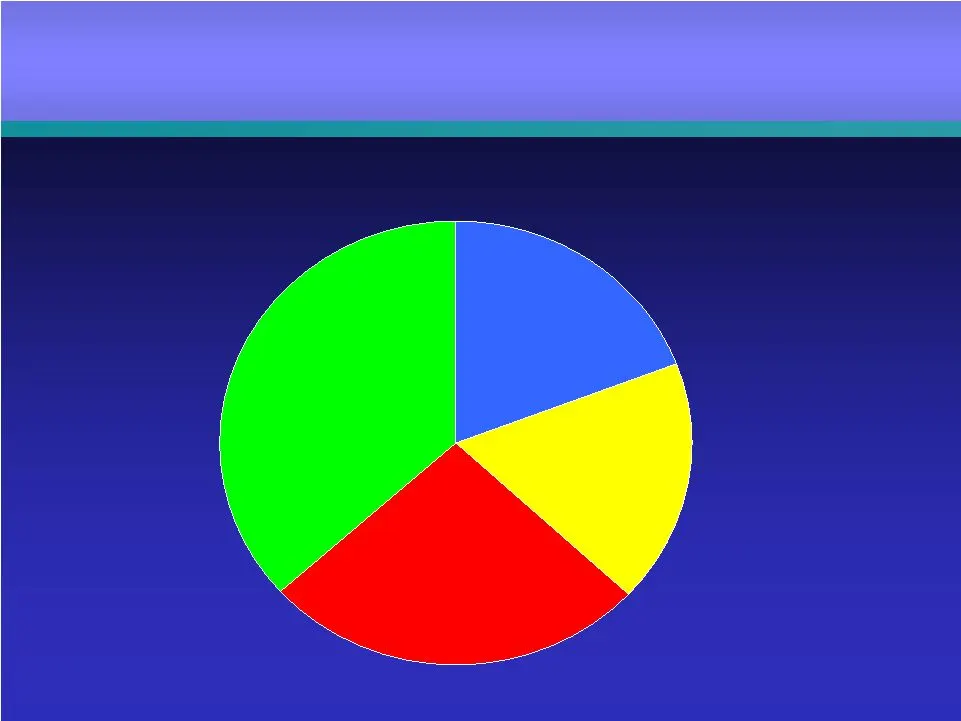
3Q05 Commercial Loans Commercial Loans Commercial Business 37% Commercial Mortgage 26% Commercial Construction 18% Residential Construction 19% Total Commercial Loans $1.8 Billion Average Balances
Slide 22: Real Estate Construction
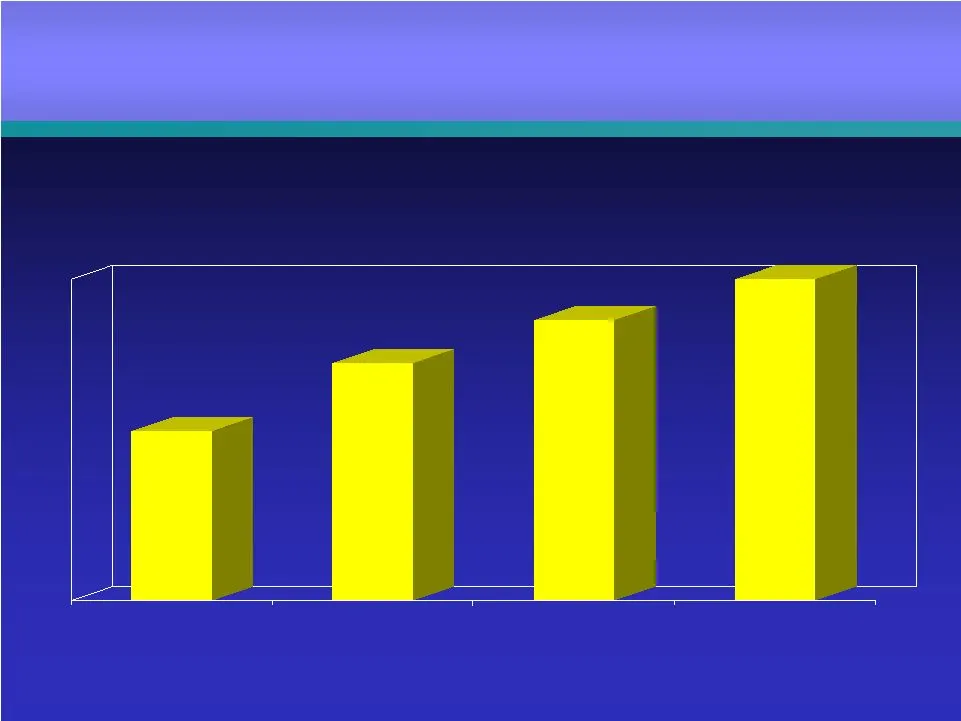
$351,546 $491,941 $580,594 $665,142 3Q 03 3Q04 2Q05 3Q05 37.5% CAGR Real Estate Construction Real Estate Construction Quarterly Comparison Quarterly Comparison

Slide 23: Key Strategy #4: Customer Relationship Focused Sales Culture
– Maximize Provident’s Position as the “Right Size” Bank in the Marketplace – Grow and Deepen Consumer and Small Business Relationships in Maryland and Virginia – Grow and Deepen Commercial and Real Estate Relationships in Maryland and Virginia – Create a High Performance Culture that Focuses on Emp

Slide 24: Customer Acquisition History
Customer Acquisition Customer Acquisition History History

Slide 25: Customer Acquisition Strategy
• 1993 Introduction –High Performance Checking –In-Store Banking –Exception Decisioning Customer Acquisition Strategy Customer Acquisition Strategy

Slide 26: Customer Acquisition: 12 Year Growth
$260 $50 Retail DDA Fees per Account 292,000 33,000 Retail Checking 152 36 Branches Customer Acquisition Customer Acquisition 2005 1993 12 Year Growth

Slide 27: Customer Relationship Strategy
Customer Relationship Customer Relationship Strategy Strategy

Slide 28: Provident Bank Vision
Provident Bank’s vision is to be chosen as our customers’ primary bank because we consistently execute our business as The Right Size Bank. Provident Bank Vision Provident Bank Vision
Slide 29: Relationship between Customer Momentum and Wallet
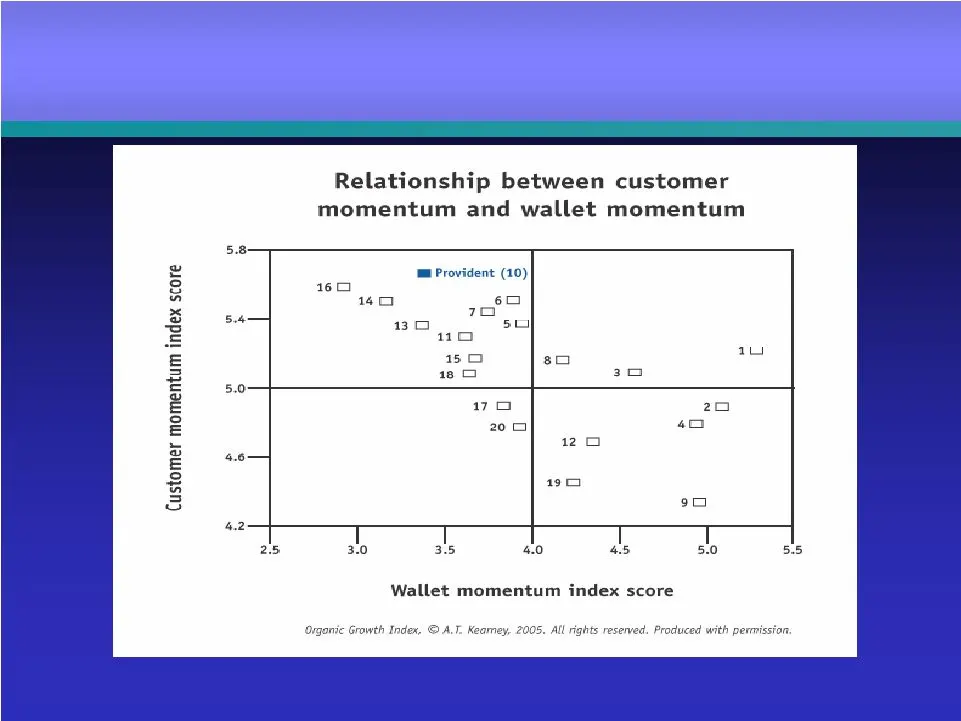
Relationship Relationship between between Customer Customer Momentum Momentum and and Wallet Wallet Momentum Momentum

Slide 30: Customer Relationship Strategy
Executing our Vision • Acquire • Enhance • Retain Customer Relationship Strategy Customer Relationship Strategy

Slide 31: Acquire Customer Relationships
Acquire different customers and acquire customers differently Success Factors: • Right size bank positioning • Unparalleled convenience • Value-oriented product line • Reputation for superior service Success Metric: Growth in Primary Bank Relationships Acquire Customer Relationships Acquire Customer

Slide 32: Enhance Customer Relationships: The Opportunity
2.82 304 Real Estate 2.99 796 Commercial 2.23 23,773 Small Business 2.77 267,102 Retail Enhance Customer Relationships Enhance Customer Relationships The Opportunity The Opportunity Provident Cross Sell Households

Slide 33: Enhance Customer Relationships
• Leverage customer segmentation methodology • Build a relationship sales culture • Roll-out sales and leadership training • Achieve CSBI relationship Success Metric: 1 More to 400,000 Enhance Customer Relationships Enhance Customer Relationships

Slide 34: Retain Customer Relationships
One additional product to a household with one product increases their retention from 83% to 92% • Utilize on-boarding program for all customers • Survey customers’ satisfaction quarterly • Build specific retention plans based on customer segmentation data Success Metric: Level of Customer Engagemen

Slide 35: Key Strategy #5: High Performance Culture
– Maximize Provident’s Position as the “Right Size” Bank in the Marketplace – Grow and Deepen Consumer and Small Business Relationships in Maryland and Virginia – Grow and Deepen Commercial and Real Estate Relationships in Maryland and Virginia – Move from a Product Driven Organization to a Customer

Slide 36: Employee Development and Retention
• Succession Planning Process • Goals & Compensation Team • Online Development Offerings Employee Development Employee Development and Retention and Retention

Slide 37: Key Strategy #6: Improve Financial Fundamentals
– Maximize Provident’s Position as the “Right Size” Bank in the Marketplace – Grow and Deepen Consumer and Small Business Relationships in Maryland and Virginia – Grow and Deepen Commercial and Real Estate Relationships in Maryland and Virginia – Move from a Product Driven Organization to a Customer

Slide 38: 3Q 2005 Financial Highlights
• Improved Earnings Quality • Improved Returns on Assets and Equity • Strong Revenue Growth • Higher Capital Level • Implementation of Initiatives • Continued Positive Fee Income Trend Performance Results Performance Results 3Q 2005 Financial Highlights 3Q 2005 Financial Highlights • Improved Financ

Slide 39: Improved Fundamentals
Improved Fundamentals Improved Fundamentals • Transformed Balance Sheet • Higher Absolute Earnings • Improved Earnings Quality
Slide 40: Components of Earning Assets
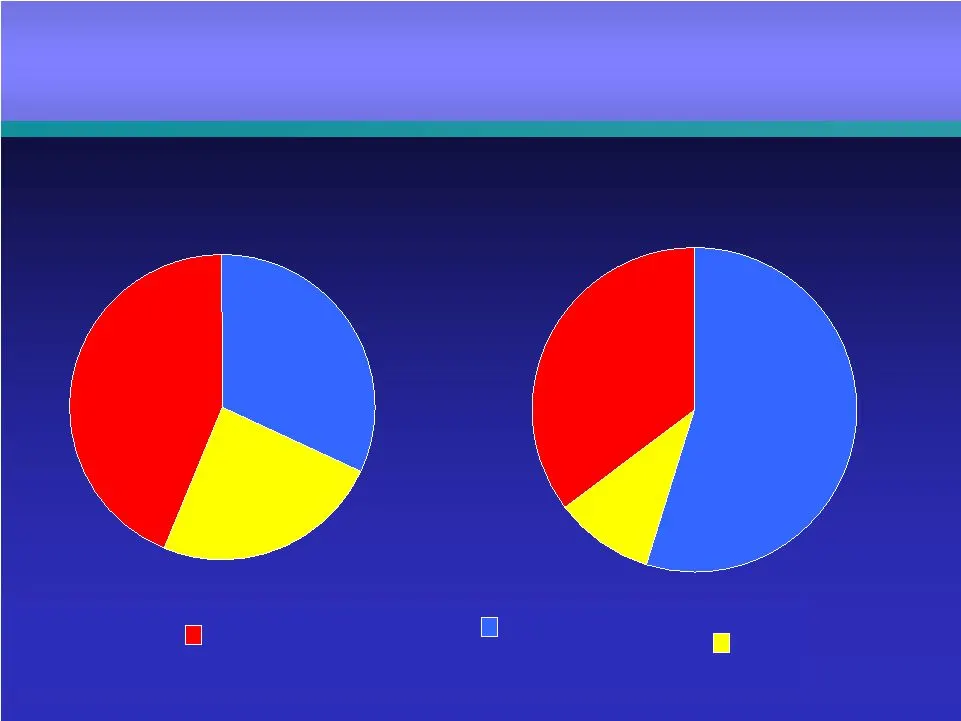
Investment Commercial/ Residential Securities Consumer Loans & Acquired Loans 3Q05 1995 Components of Earning Assets Components of Earning Assets 35% 55% 10% 32% 24% 44%
Slide 41: Total Return Comparison
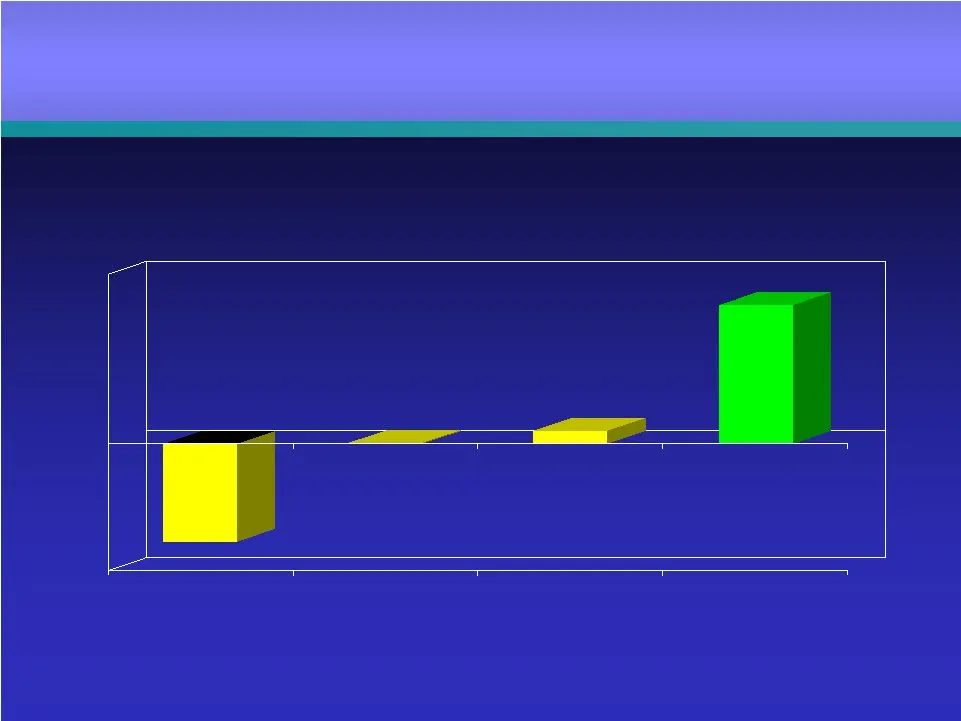
-6.97% 0.03% 0.90% 9.85% S&P Bank Index NASDAQ Bank Index Sandler Peer Group Provident Third Quarter 2005 Equity Summary Equity Summary Total Return Comparison Total Return Comparison

Slide 42: Equity Summary
Current yield: 3.35% Common shares: 32,912 million P/E ratio: 14.5 x Market Capitalization: $ 1.1 billion (Quarter End) Equity Summary Equity Summary Third Quarter 2005 Third Quarter 2005 • • • •

Slide 43: Restatement: SFAS
Restatement SFAS 133 Shortcut Methodology Reversed Long Haul Methodology Started Mark to Market Requirement Non-Cash

Slide 44: Restatement: Net Income and Cumulative Effect
Restatement SFAS 133 (000) Net Income Cumulative Effect ($ 947) 2004 $ 1,655 2005 ($2,602)

Slide 45: Restatement: Proven Effectiveness
Restatement SFAS 133 Proven Effectiveness No Introduced Volatility Mark to Market Recovery

Slide 46: Peer Group Comparison
Peer Group Comparison Peer Group Comparison

Slide 47: Peer Group
Commerce Bancshares Inc. (MO) First Midwest Bancorp, Inc. Fulton Financial Corporation Mercantile Bankshares Corporation Sky Financial Group, Inc. Susquehanna Bancshares, Inc. TCF Financial Corporation United Bankshares, Inc. Valley National Bancorp Peer Group Peer Group

Slide 48: Mid Cap Group
Am South Bancorporation Huntington Bancshares Inc. TD Banknorth Inc. Mercantile Bankshares Corp. Commerce Bancorp Inc. M&T Bank Corporation Compass Bancshares, Inc. North Fork Bancorporation, Inc. Comerica Incorporated South Financial Group, Inc Colonial BancGroup Inc. Synovus Financial Corp First H
Slide 49: Efficiency Ratio
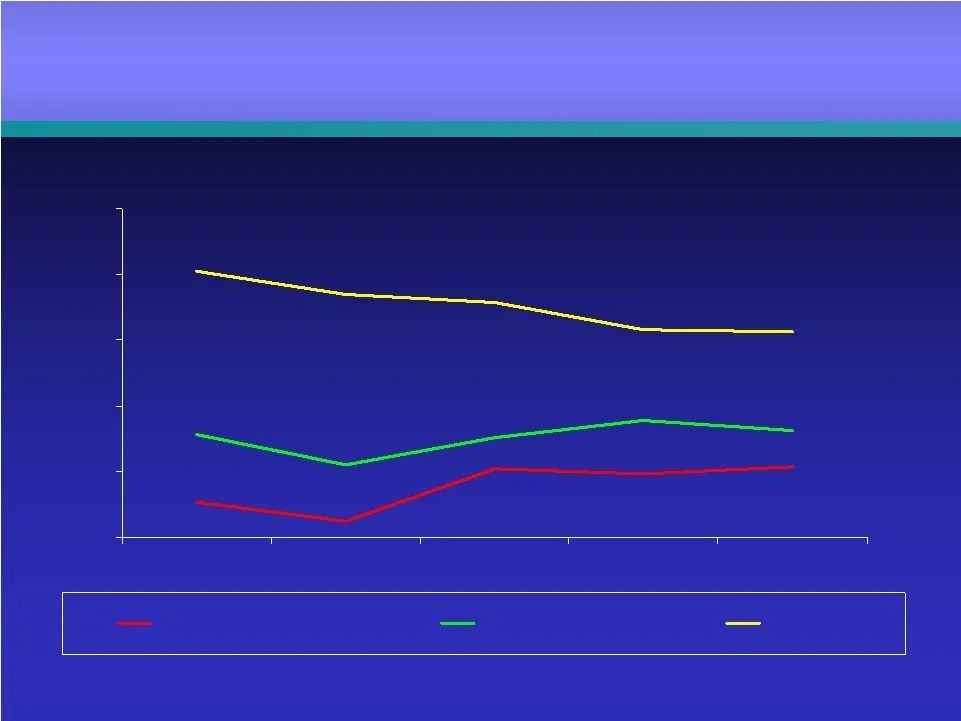
47% 52% 57% 62% 67% 72% 2001 2002 2003 2004 3Q05 YTD Sandler Peer Group Mid Cap Group Provident Efficiency Ratio Efficiency Ratio Note: Excludes restatement data Note: Excludes restatement data 62.79% 62.62% 52.36% 51.80% 52.19% 48.20% 49.65% 55.10% 55.93% 54.56% 52.55% 54.82% 64.90% 65.47% 67.27%
Slide 50: Net Charge-Offs / Average Loans
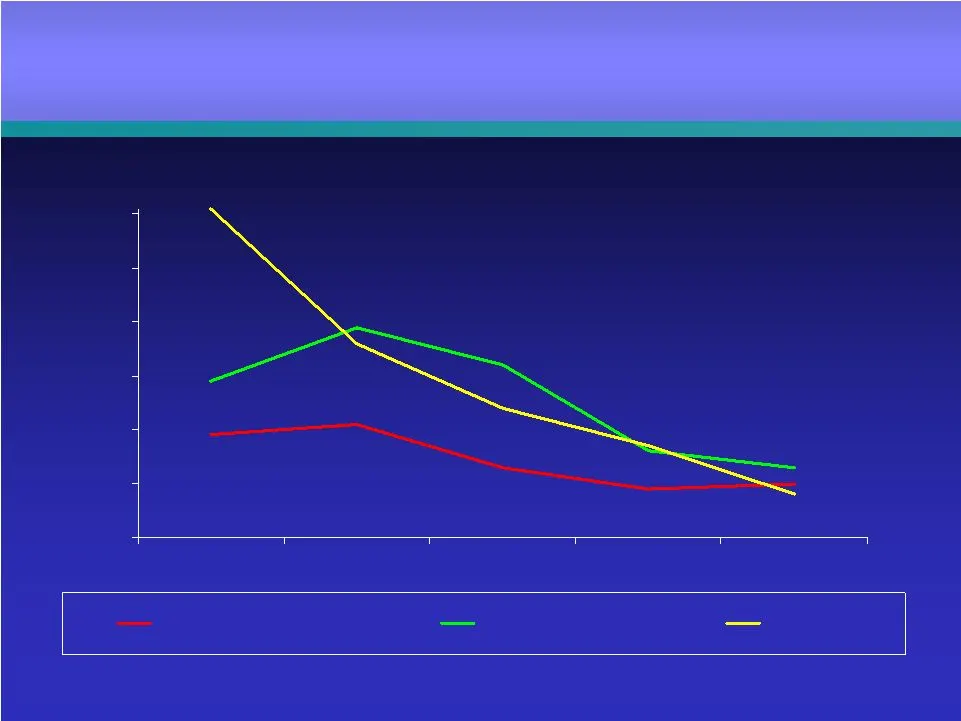
0.10% 0.20% 0.30% 0.40% 0.50% 0.60% 0.70% 2001 2002 2003 2004 3Q05 YTD Sandler Peer Group Mid Cap Group Provident Net Charge-Offs / Average Loans Net Charge-Offs / Average Loans 0.20% 0.19% 0.23% 0.31% 0.29% 0.23% 0.26% 0.42% 0.49% 0.39% 0.18% 0.27% 0.34% 0.46% 0.71%
Slide 51: Reserves / Loans
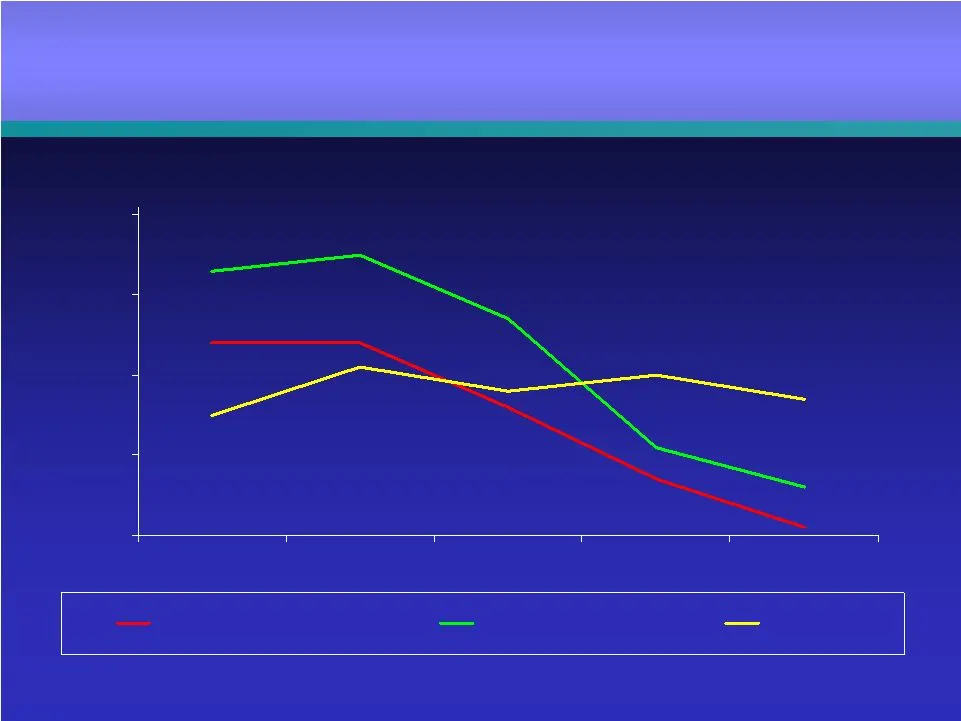
1.1% 1.2% 1.3% 1.4% 1.5% 2001 2002 2003 2004 3Q05 YTD Sandler Peer Group Mid Cap Group Provident Reserves / Loans Reserves / Loans 1.42% 1.44% 1.36% 1.24% 1.30% 1.25% 1.10% 1.33% 1.33% 1.16% 1.15% 1.20% 1.27% 1.26% 1.29%
Slide 52: Investments / Assets
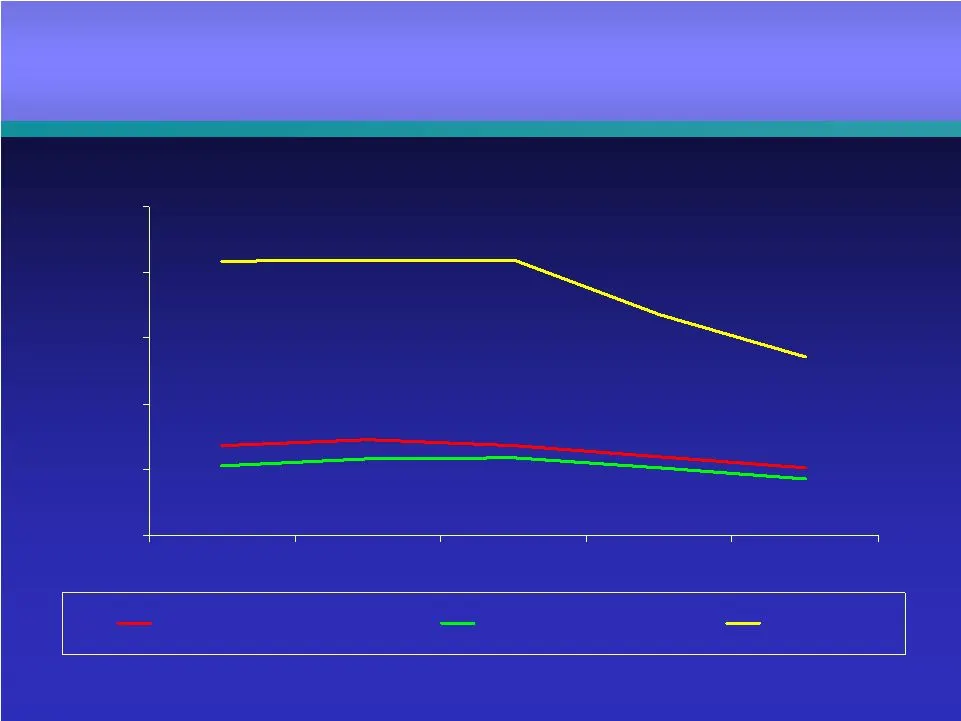
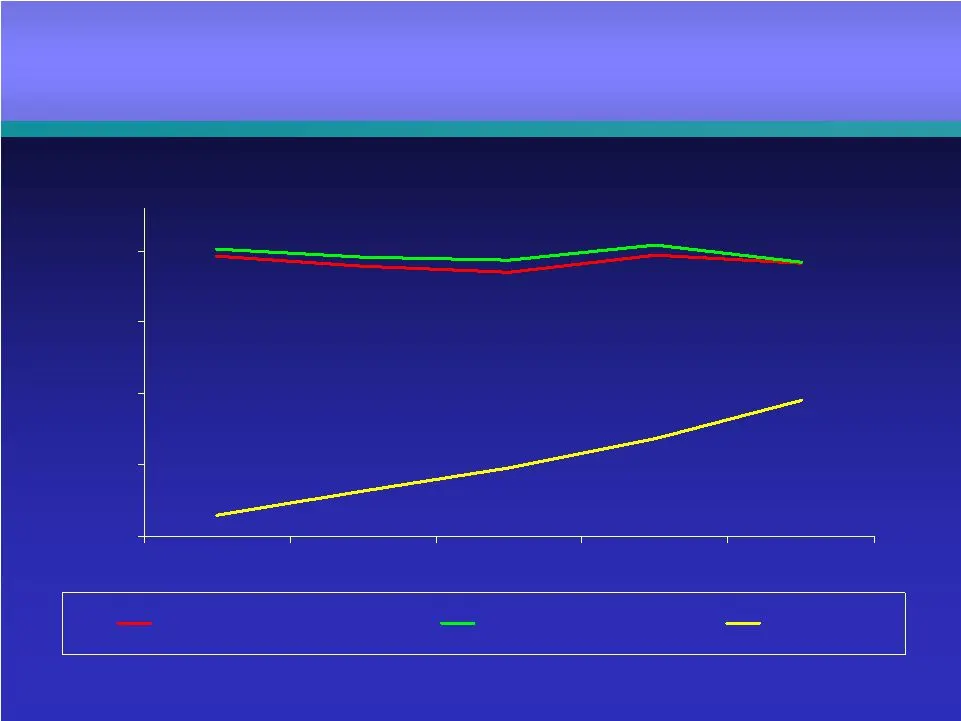
Investments / Assets Investments / Assets 23.6% 23.6% 22.0% 20.2% 20.3% 18.6% 51.7% 51.9% 51.8% 43.5% 37.1% 24.5% 21.8% 21.7% 20.6% 10.0% 20.0% 30.0% 40.0% 50.0% 60.0% 2001 2002 2003 2004 3Q05 YTD Sandler Peer Group Mid Cap Group Provident
Slide 53: Core Loans / Assets
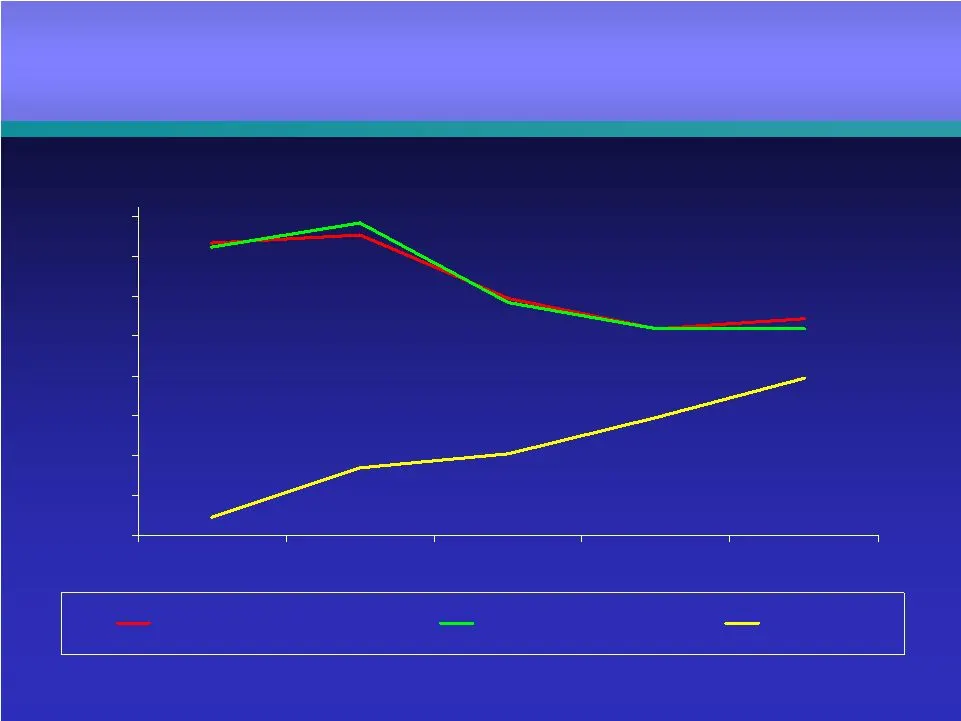
Core Loans / Assets Core Loans / Assets 69.2% 67.0% 69.4% 70.8% 32.9% 36.4% 39.6% 43.6% 49.0% 68.2% 67.8% 68.4% 68.6% 69.1% 70.2% 30.0% 40.0% 50.0% 60.0% 70.0% 2001 2002 2003 2004 3Q05 YTD Sandler Peer Group Mid Cap Group Provident
Slide 54: Net Interest Margin
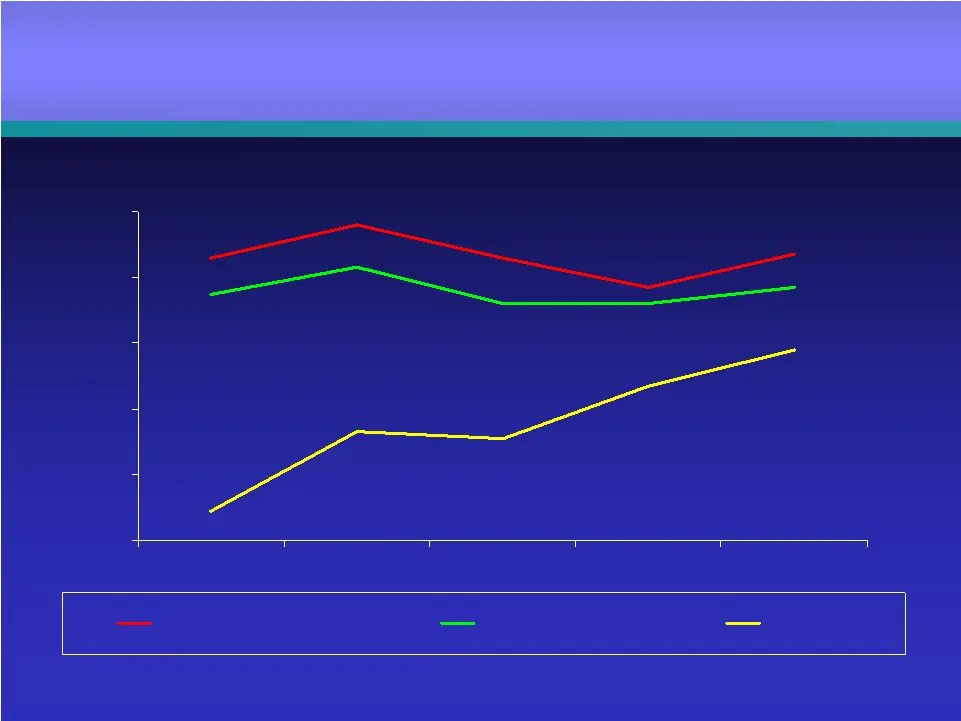
Net Interest Margin Net Interest Margin Note: Excludes restatement data Note: Excludes restatement data 3.99% 3.84% 3.89% 3.97% 3.84% 3.14% 3.21% 3.39% 4.31% 4.27% 3.84% 4.37% 4.25% 2.89% 3.59% 2.8% 3.0% 3.2% 3.4% 3.6% 3.8% 4.0% 4.2% 4.4% 2001 2002 2003 2004 3Q05 YTD Sandler Peer Group Mid Cap Group
Slide 55: Return on Assets
Return on Assets Return on Assets Note: Excludes restatement data Note: Excludes restatement data 1.47% 1.37% 1.46% 1.56% 1.46% 1.37% 1.32% 1.32% 1.43% 1.35% 1.18% 1.07% 0.91% 0.93% 0.69% 0.60% 0.80% 1.00% 1.20% 1.40% 1.60% 2001 2002 2003 2004 3Q05 YTD Sandler Peer Group Mid Cap Group Provident

Slide 56: Opportunities
Opportunities Opportunities • Footprint in growth markets of Maryland, Virginia and DC Metro • Regional economy • Small business • Continued balance sheet transformation
Slide 57: Virginia and Washington Metro Expansion
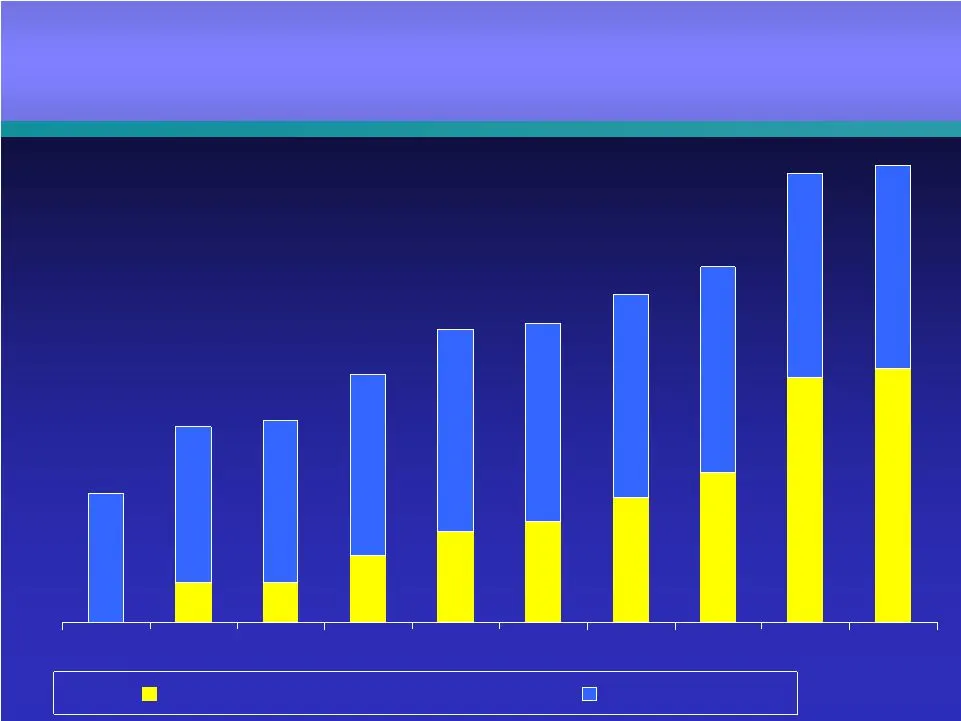
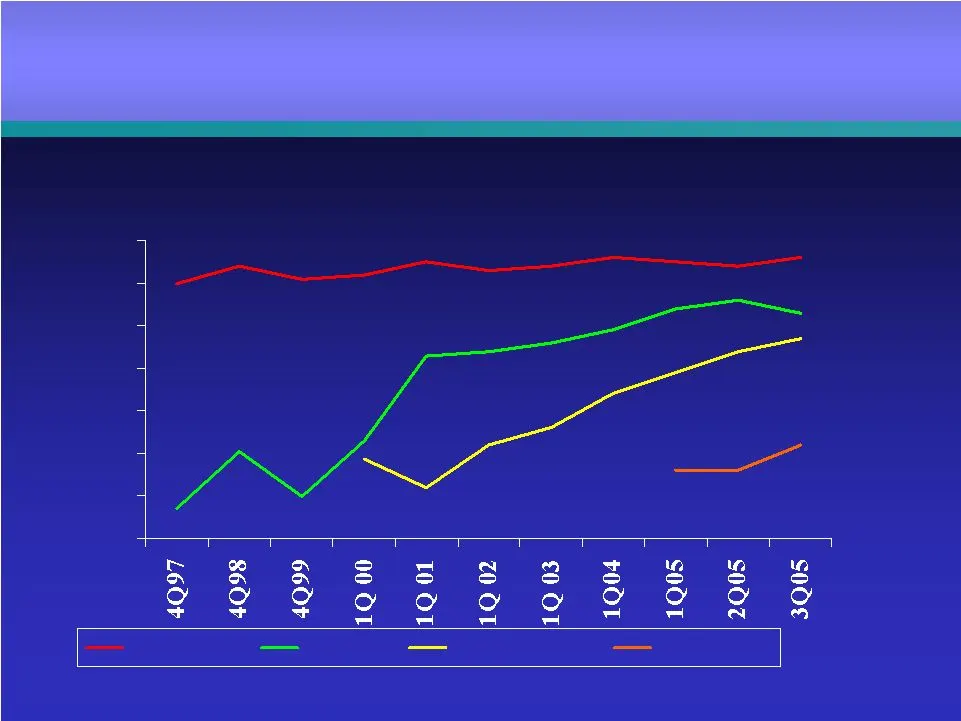
66 44 67 67 66 65 66 59 53 51 1996 1997 1998 1999 2000 2001 2002 2003 2004 3Q05 Washington Metro/VA Baltimore BRANCH NETWORK Virginia And Washington Virginia And Washington Metro Expansion Metro Expansion
Slide 58: Virginia and Washington Metro Expansion
30 40 50 60 70 80 90 100 Baltimore Sub MD Northern VA Richmond Virginia and Washington Virginia and Washington Metro Expansion Metro Expansion TOTAL AWARENESS

Slide 59: Office Vacancy
National 15.4% Richmond 10.3% Metro DC 10.5% Baltimore Metro 13.2% Office Vacancy Office Vacancy First Quarter 2005 First Quarter 2005

Slide 60: Regional Housing
Single Family Home Price Appreciation Virginia/DC/MD 28% Baltimore 14% United States 9% Housing Permit Growth Maryland 9% United States (5%) Regional Housing Regional Housing

Slide 61: Regional Employment
Unemployment Rate Virginia / DC 3.3% Maryland 4.3% Employment Growth* Virginia / DC 71,000 Maryland 42,000 * March 2005, Year over Year Regional Employment Regional Employment
Slide 62: Market Demographics
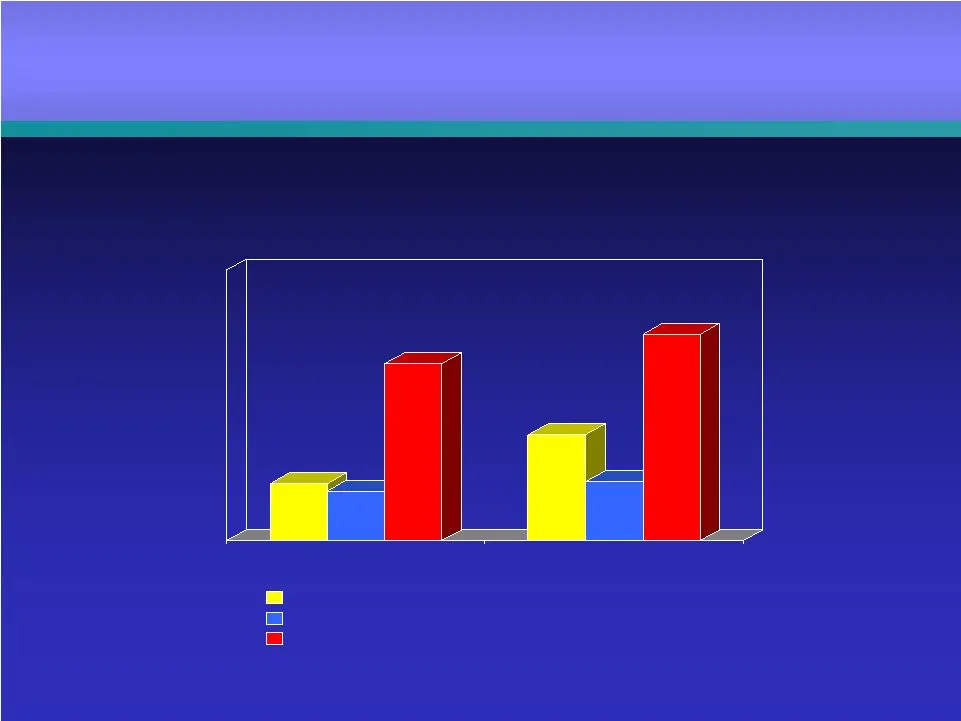
3.3% 3.0% 8.2% 5.3% 3.4% 9.4% 2000-2004 2004-2009 US Baltimore-Towson,MD Washington-Arlington-Alexandria Change in Population Market Demographics Market Demographics Market Demographics
Slide 63: Market Demographics
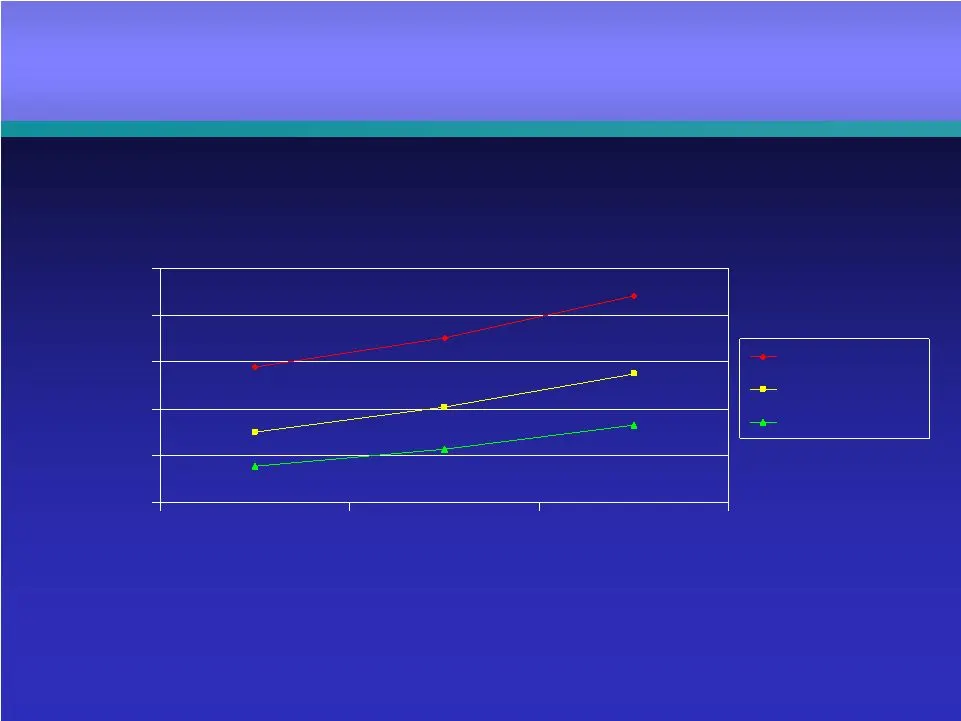
Median Household Income $35,000 $45,000 $55,000 $65,000 $75,000 $85,000 2000 2004 2009 Wash Metro Balto/Towson U.S. Market Demographics Market Demographics
Slide 64: Opportunities
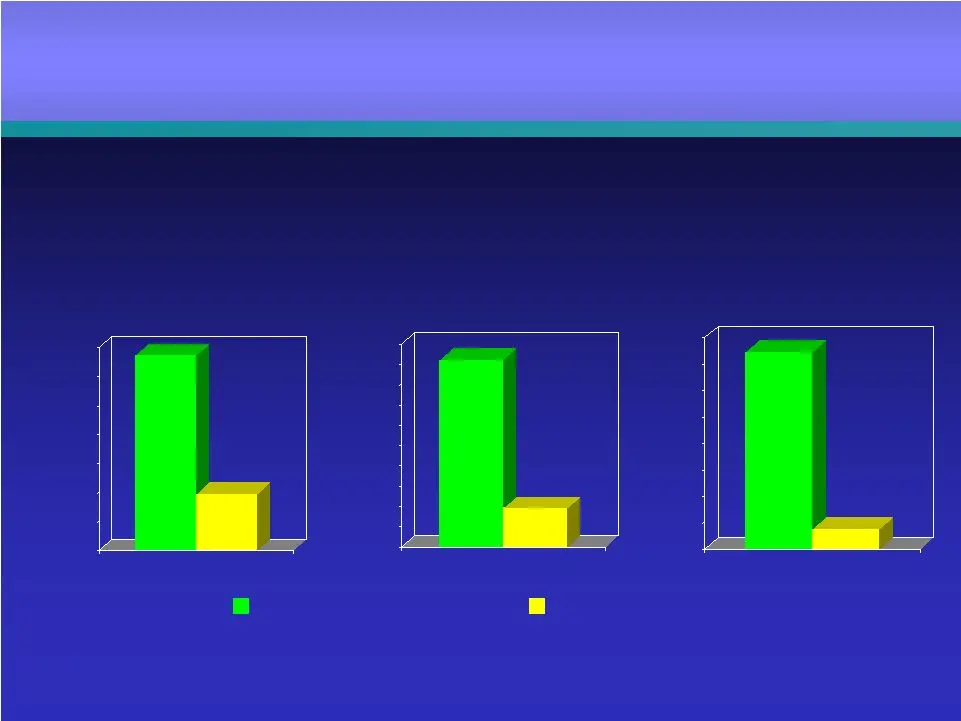
• Build relationships with existing customers • We have 53 “new” branches in Virginia “New VA” Branches MD Branches $33,682,000 $9,783,020 $0 $5,000,000 $10,000,000 $15,000,000 $20,000,000 $25,000,000 $30,000,000 $35,000,000 Deposits $4,595,000 $969,323 $0 $500,000 $1,000,000 $1,500,000 $2,000,000 $

Slide 65: Reconciliation
LOANS DEPOSITS 2001 2002 2003 2004 3Q05 Reconciliation Reconciliation Note: Excludes restatement data Note: Excludes restatement data Consumer & Commercial Loans $ 1.50 $ 1.70 $ 1.90 $ 2.53 $ 3.10 Acquired & Residential Loans 1.60 1.01 0.70 0.75 0.54 Total Loans $ 3.10 $ 2.71 $ 2.60 $ 3.28 $ 3.64 (a

Slide 66: Contact
PROVIDENT BANKSHARES C O R P O R A T I O N www.provbank.com Contact Media : Lillian Kilroy (410) 277-2833 Investment Community : Melissa Kelly (410) 277 - 2080 PROVIDENT BANKSHARES C O R P O R A T I O N
Source: SEC EDGAR · 8-K filed Nov 17, 2005
More decks from Provident Bankshares Corp
 Merger or Acquisition (December 2008)32 slides · Dec 19, 2008
 2007 Stifel Nicolaus Financial Institutions Investor Conference52 slides · Dec 6, 2007
 Investor Presentation (November 2007)49 slides · Nov 8, 2007
 FTN Midwest Small and Mid Cap Bank Conference 200757 slides · Sep 6, 2007
 Investor Presentation (May 2007)51 slides · May 8, 2007
 KBW Regional Bank Conference 200751 slides · Feb 28, 2007