Innophos — Investor Day (November 2011)
96 slides from Innophos's investor day presentation, Nov 8, 2011
Slide 1: Innophos Holdings, Inc. Investor Day
Innophos Holdings, Inc. Investor Day November 9, 2011
Slide 2: Safe Harbor
Safe Harbor During the course of this presentation, management may make forward-looking statements regarding financial performance and future events. We will attempt to identify these statements by use of words such as expect, believe, anticipate, intend, and other words that denote future events. Y
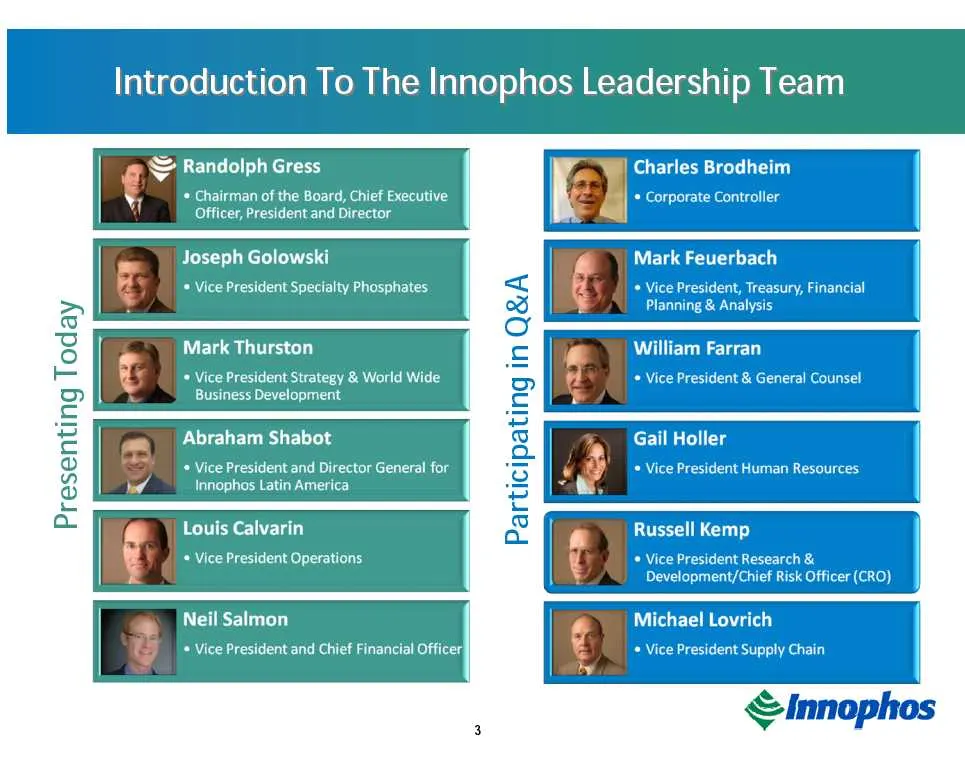
Slide 3: Introduction To The Innophos Leadership Team
Introduction To The Innophos Leadership Team — Randolph Gress Charles Brodheim * Chairman of the Board, Chief Executive © Corporate Controller Officer, President and Director Joseph Golowski r Mark Feuerbach * Vice President Specialty Phosphates * Vice President, Treasury, Financial Planning & Analy
Slide 4: Our Track Record Is Impressive, But Our Focus Is On The Future
Our Track Record Is Impressive, But Our Focus Is On The Future; Today You Will Hear How: Growth through product innovation and geographic expansion Maintain and improve our margins Strengthen our attractive strategic position Continue to generate strong cash flow SOc 6 All Of Which We Believe Create
Slide 5: Our Track Record And Our Goals
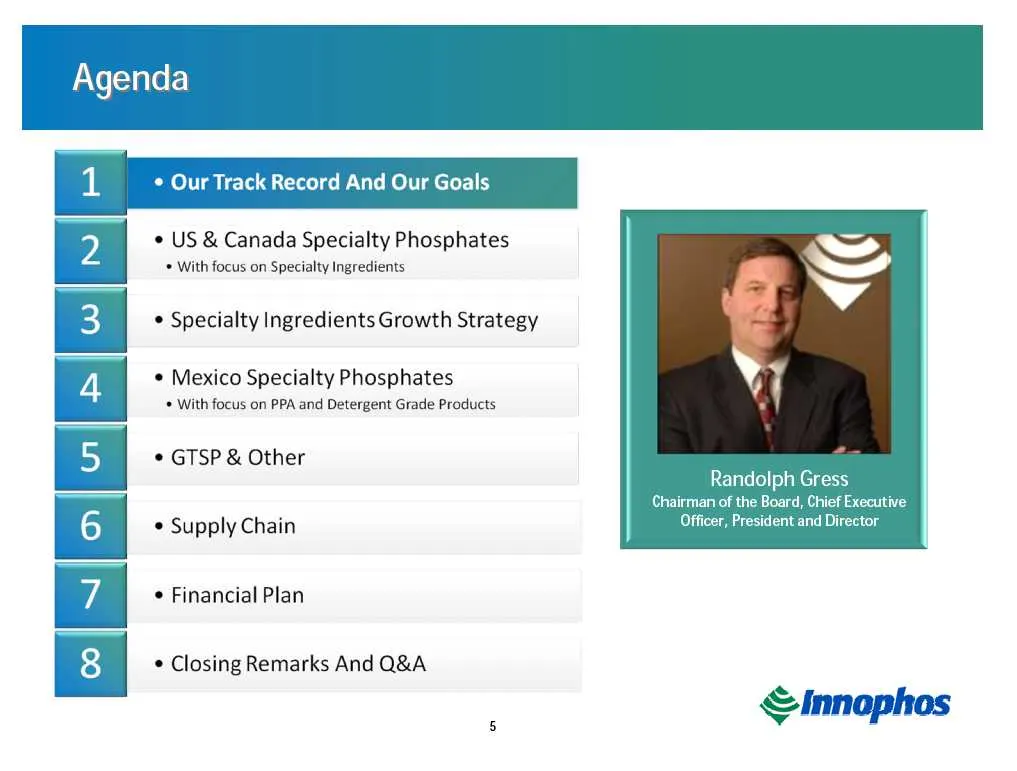
2 le a le 6 bi! rd And Our Goals * US & Canada Specialty Phosphates * With focus on Specialty Ingredients * Specialty Ingredients Growth Strategy * Mexico Specialty Phosphates * With focus on PPA and Detergent Grade Products © GTSP & Other Randolph Gress Chairman of the Board, Chief Executive * Supp
Slide 6: Overview Of Innophos
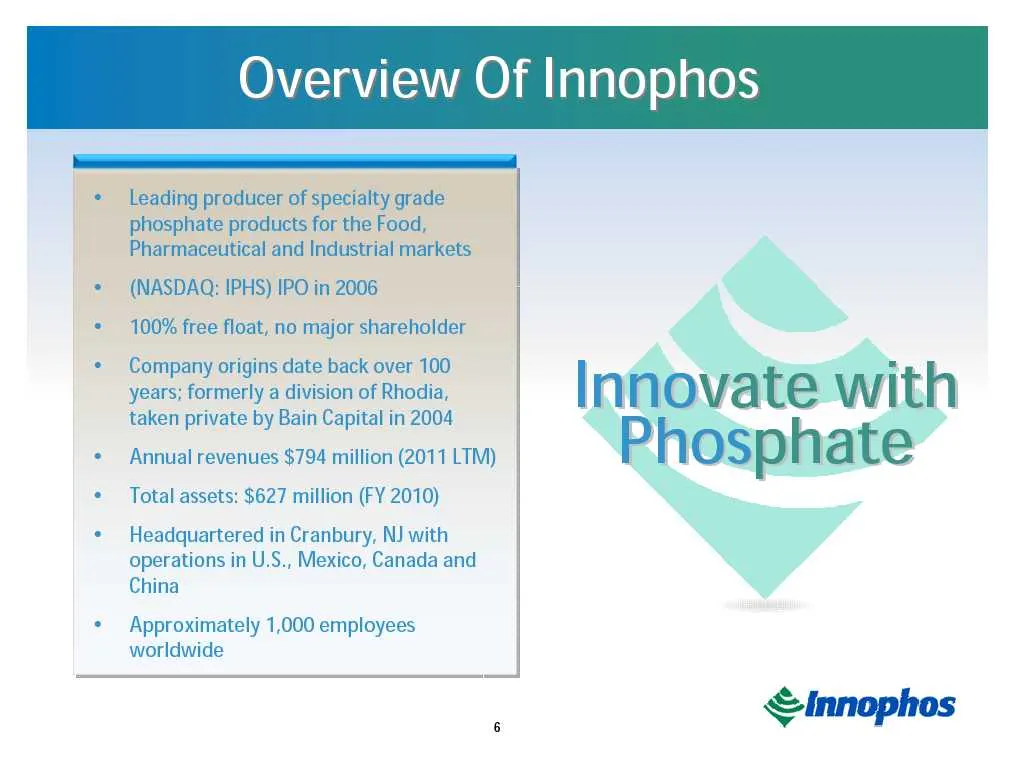
Overview Of Innophos Leading producer of specialty grade phosphate products for the Food, Pharmaceutical and Industrial markets (NASDAQ: IPHS) IPO in 2006 100% free float, no major shareholder Company origins date back over 100 years; formerly a division of Rhodia, taken private by Bain Capital in 2
Slide 7: Reporting Segments - Product Groups
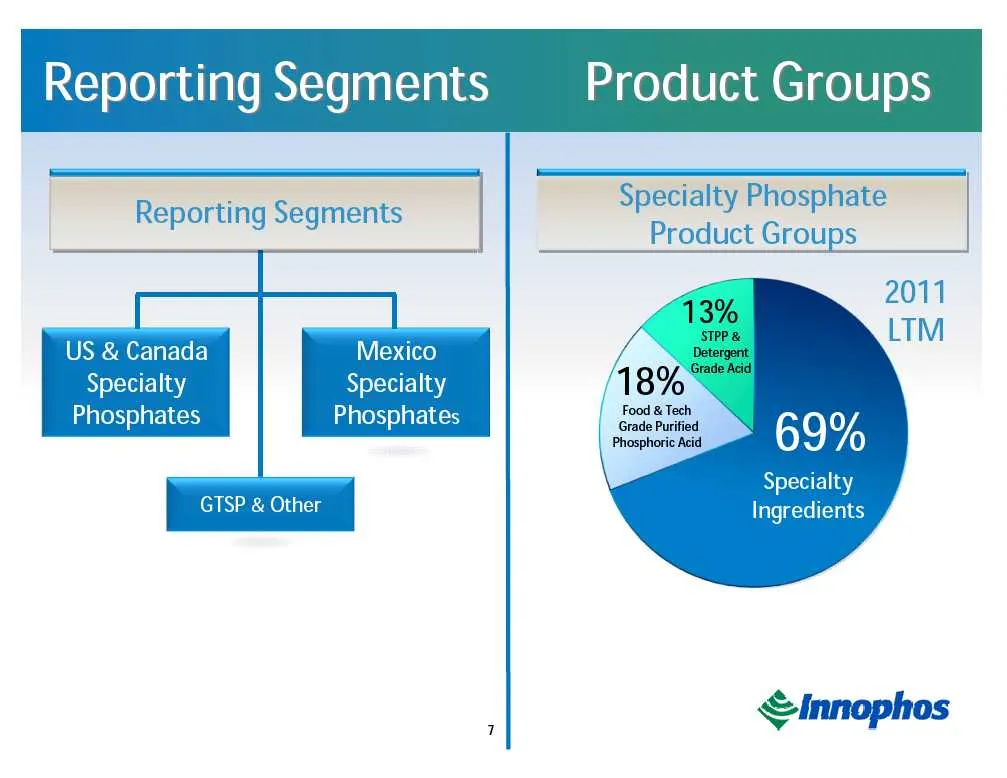
Reporting Segments —- Product Groups | . | Specialty Phosphate Reporting Segments ive ara ion TS - 2011 ! CTR LTM US & Canada Mexico i etre Specialty Specialty /18% Phosphates Phosphate: |, come p le ee 69% Specialty GTSP & Other Ingredients innophos
Slide 8: Our Goal Through 2015 Is Operating Income Growth
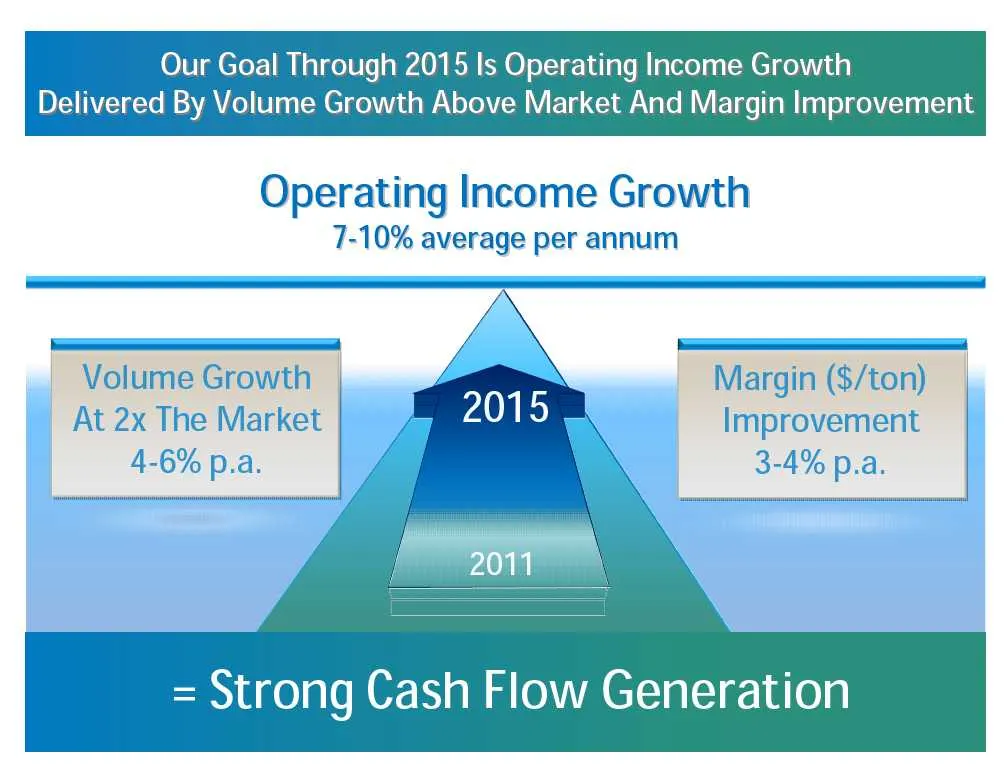
Our Goal Through 2015 Is Operating Income Growth red By Volume Growth Above Market And Margin Improvement Operating Income Growth 7-10% average per annum At 2x The Market 4-6% p.a. = Strong Cash Flow Generation
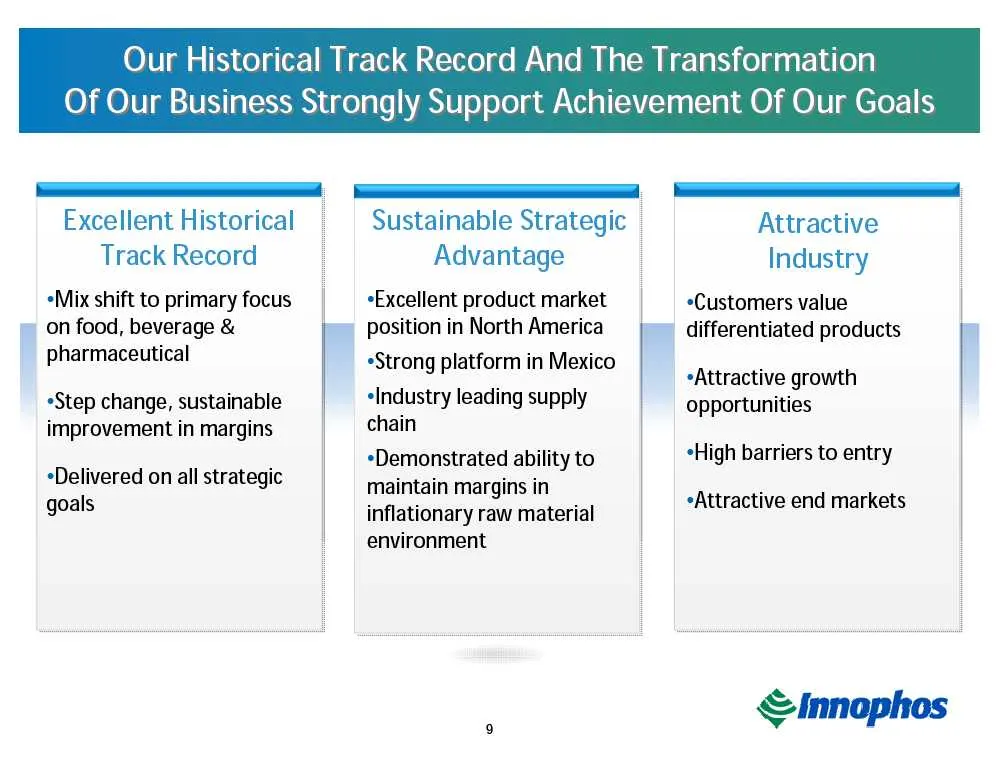
Slide 9: Our Historical Track Record And The Transformation Of Our Business
Our Historical Track Record And The Transformation Of Our Business Strongly Support Achievement Of Our Goals Excellent Historical Sustainable Strategic Attractive Track Record Advantage Industry «Mix shift to primary focus «Excellent product market «Customers value on food, beverage & = Position in

Slide 10: Ongoing Strong Cash Flow Generation Will Drive Growth And Cash Returns
Ongoing Strong Cash Flow Generation Will Drive Growth And Cash Returns To Shareholders
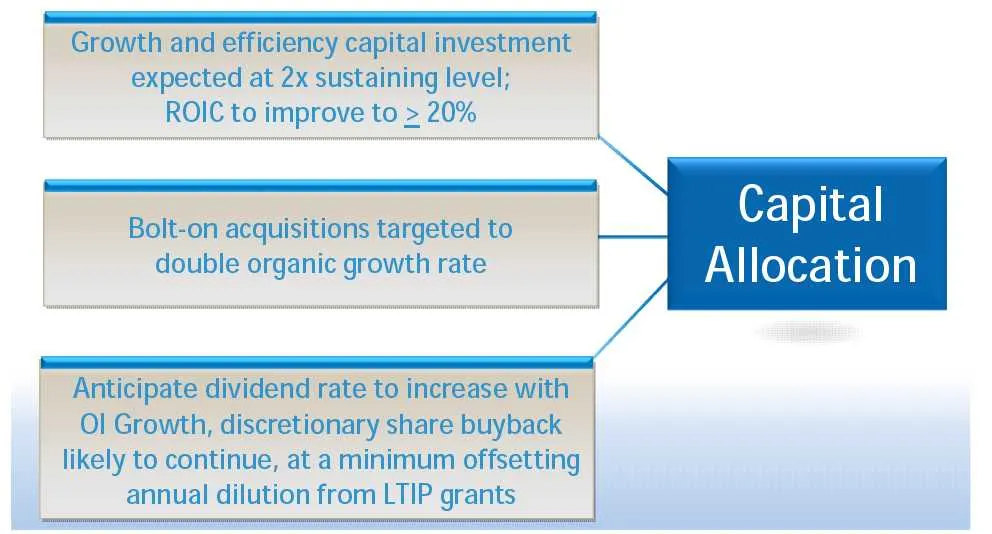
Slide 11: Capital Allocation
$$ Growth and efficiency capital investment expected at 2x sustaining level; ROIC to improve to > 20% aU REE . Bolt-on acquisitions targeted to Capital double organic growth rate Allocation Anticipate dividend rate to increase with Ol Growth, discretionary share buyback likely to continue, at a mini
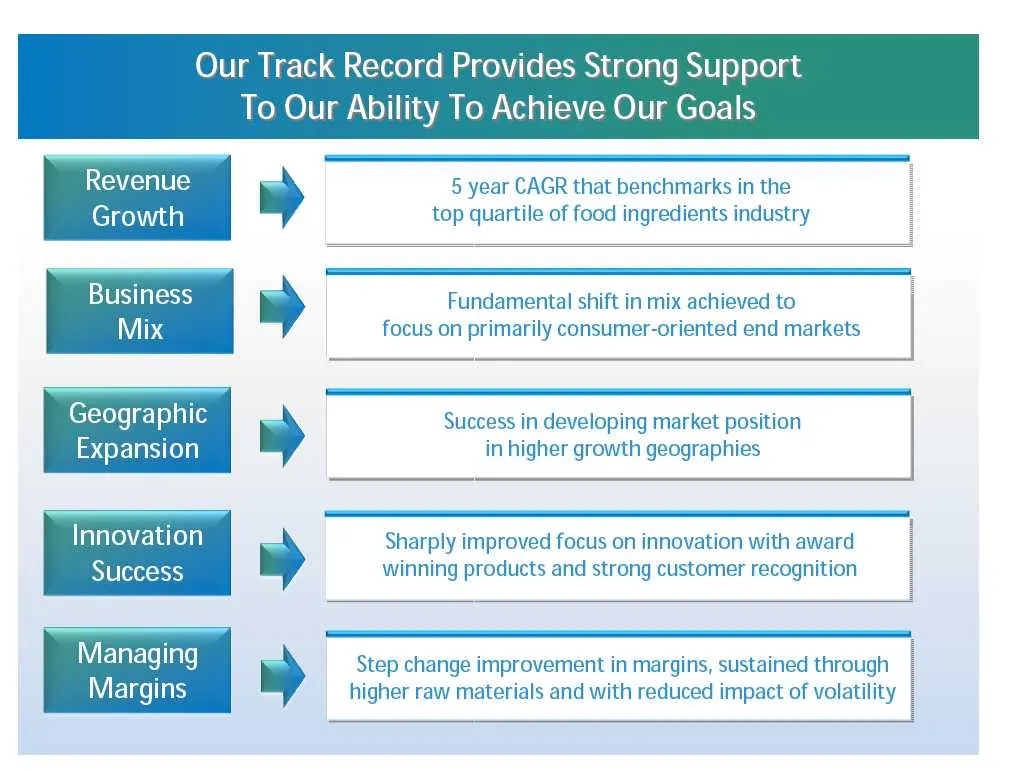
Slide 12: Our Track Record Provides Strong Support To Our Ability To Achieve Our Goals
Our Track Record Provides Strong Support To Our Ability To Achieve Our Goals 5 year CAGR that benchmarks in the top quartile of food ingredients industry Business Mix Fundamental shift in mix achieved to focus on primarily consumer-oriented end markets | Geographic Success in developing market posit
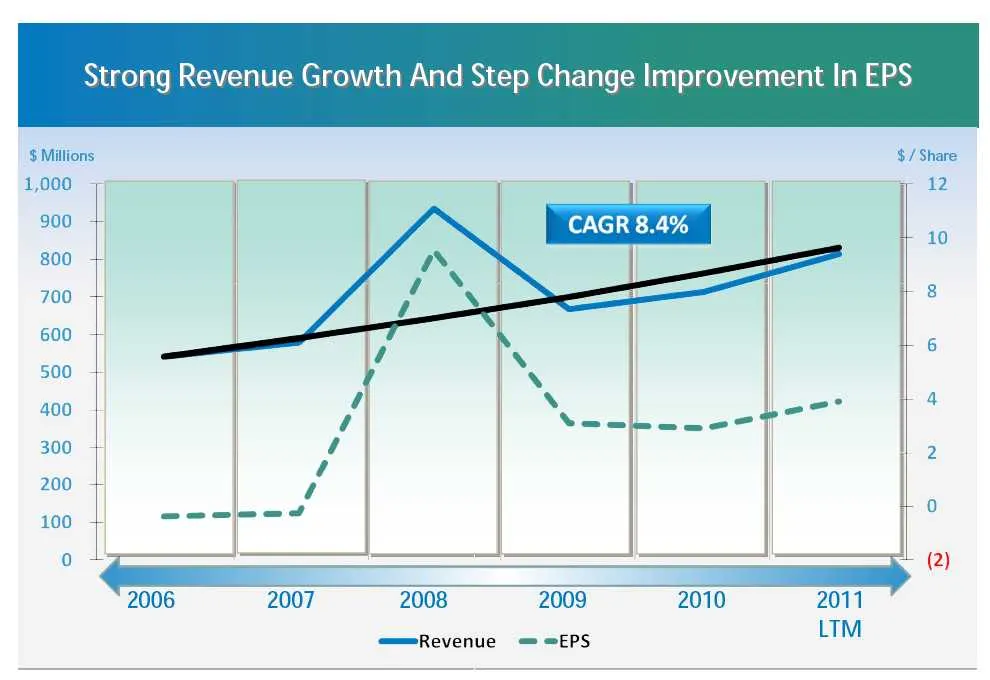
Slide 13: Strong Revenue Growth And Step Change Improvement In EPS
Strong Revenue Growth And Step Change Improvement In EPS $ Millions $/Share 1,000 12 300 + 10 goo 1 700 + 8 600 + lig 500 | 400 4 300 + 2 200 +) ar) 100 + ot L (2) 2006 2007 2008 2009 2010 2011 LTM Revenue = =EPS
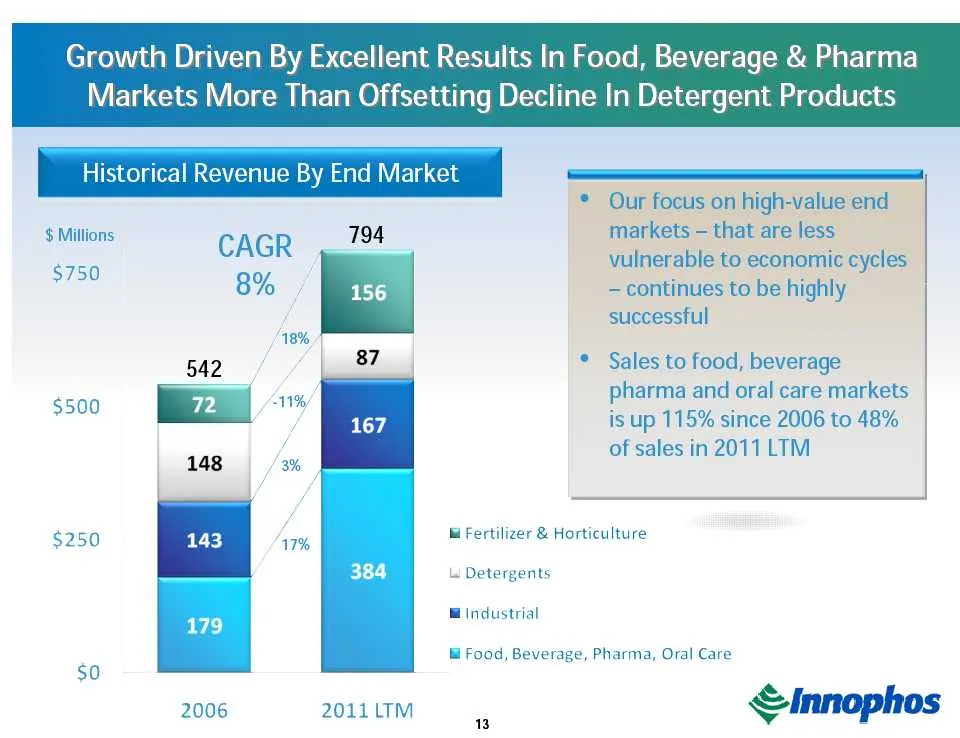
Slide 14: Growth Driven By Excellent Results In Food, Beverage & Pharma Markets
Growth Driven By Excellent Results In Food, Beverage & Pharma Markets More Than Offsetting Decline In Detergent Products Historical Revenue By End Market a $ Millions $750 $250 $0 CAGR 8% 2006 2011 LTM * Our focus on high-value end markets — that are less vulnerable to economic cycles - continues to
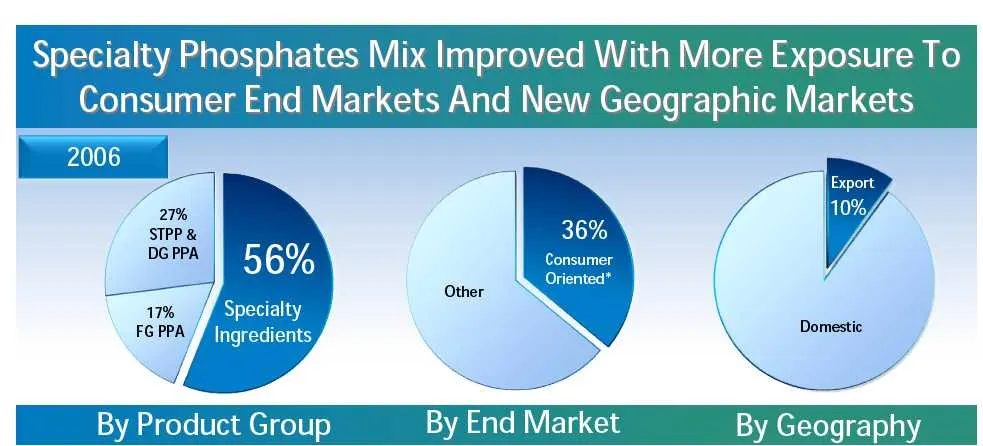
Slide 15: Product Group and End Market Growth
” : ty | ‘ B Pp Ta jr od . uct Pri G p ou I Bi yi End Ma G h ke t B yy eo g 'y
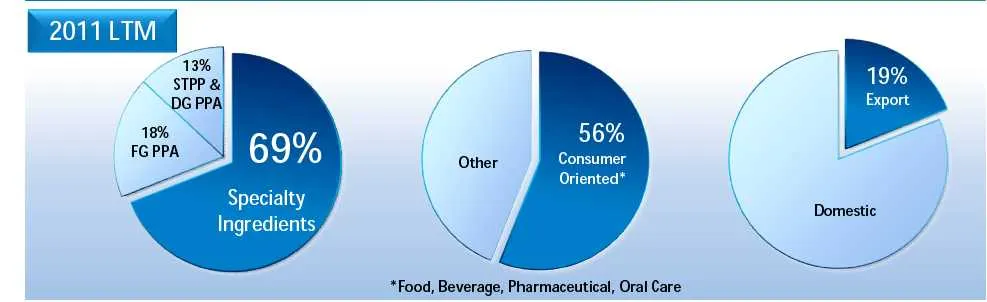
Slide 16: Specialty Ingredients
56% Consumer Oriented* Specialty Ingredients
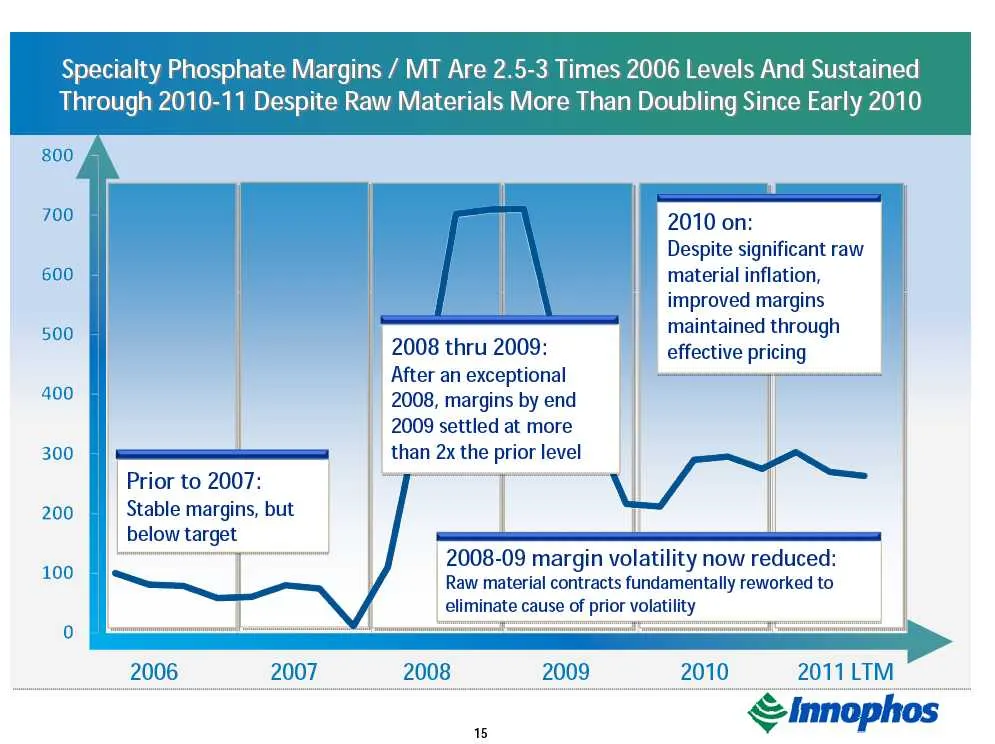
Slide 17: Specialty Phosphate Margins / MT Are 2.5-3 Times 2006 Levels
‘Specialty Phosphate Margins / MT Are 2.5-3 Times 2006 Levels And Sustained Through 2010-11 Despite Raw Materials More Than Doubling Since Early 2010 ; [ | 708 a 1) 2010 on: by | 1 Despite significant raw 600 ~ material inflation, | improved margins 500 oe oO maintained through 2008 thru 2009: effec
Slide 18: be a
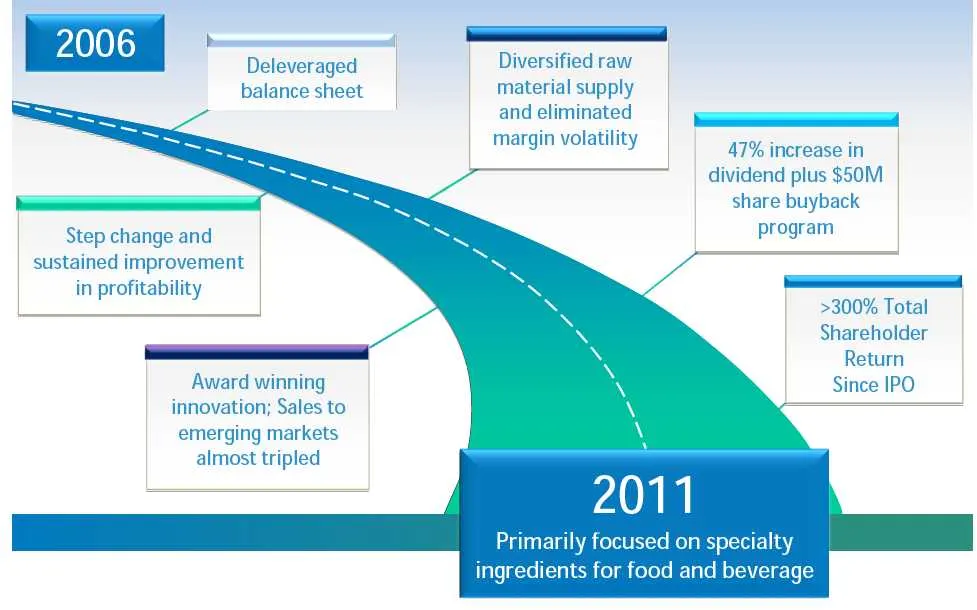
be a Deleveraged Diversified raw balance sheet material supply and eliminated margin volatility 47% increase in dividend plus $50M share buyback program Step change and sustained improvement in profitability $< $< | >300% Total | Shareholder Return Award winning Since IPO innovation; Sales to emergi
Slide 19: Our Track Record Is Impressive, But Our Focus Is On The Future
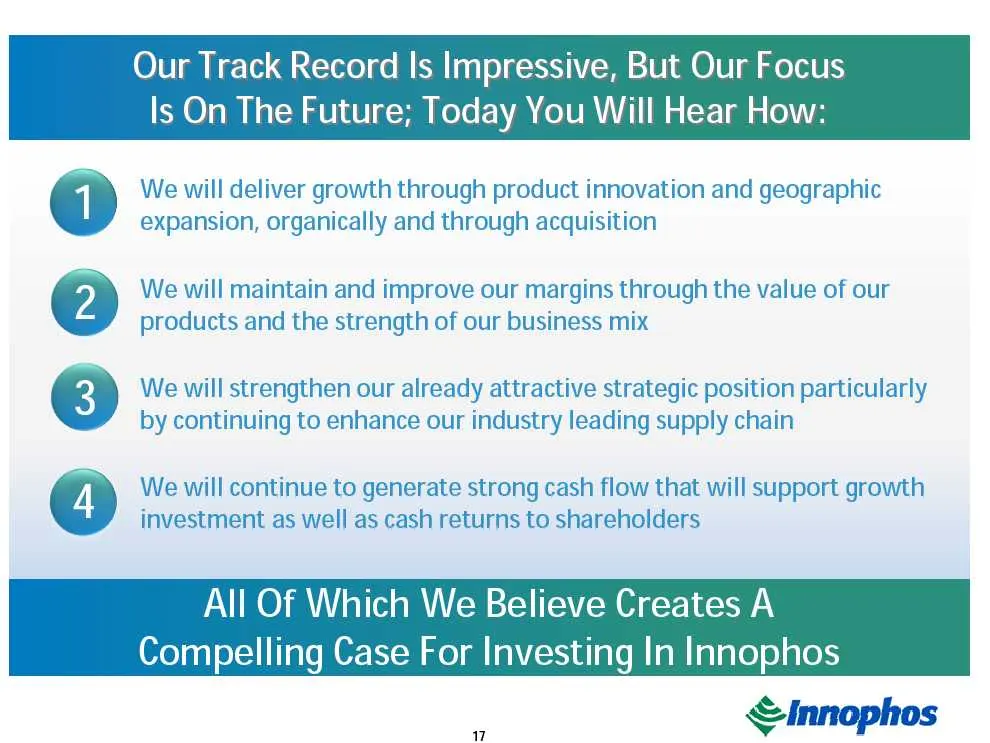
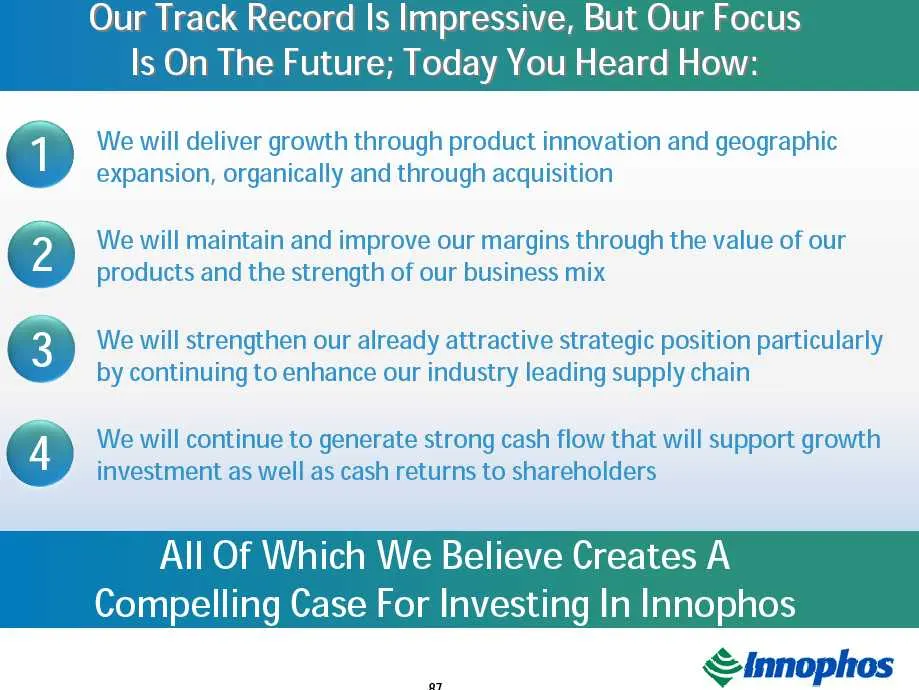
Our Track Record Is Impressive, But Our Focus Is On The Future; Today You Will Hear How: We will deliver growth through product innovation and geographic expansion, organically and through acquisition We will maintain and improve our margins through the value of our ew products and the strength of o
Slide 20: Agenda: Specialty Phosphates
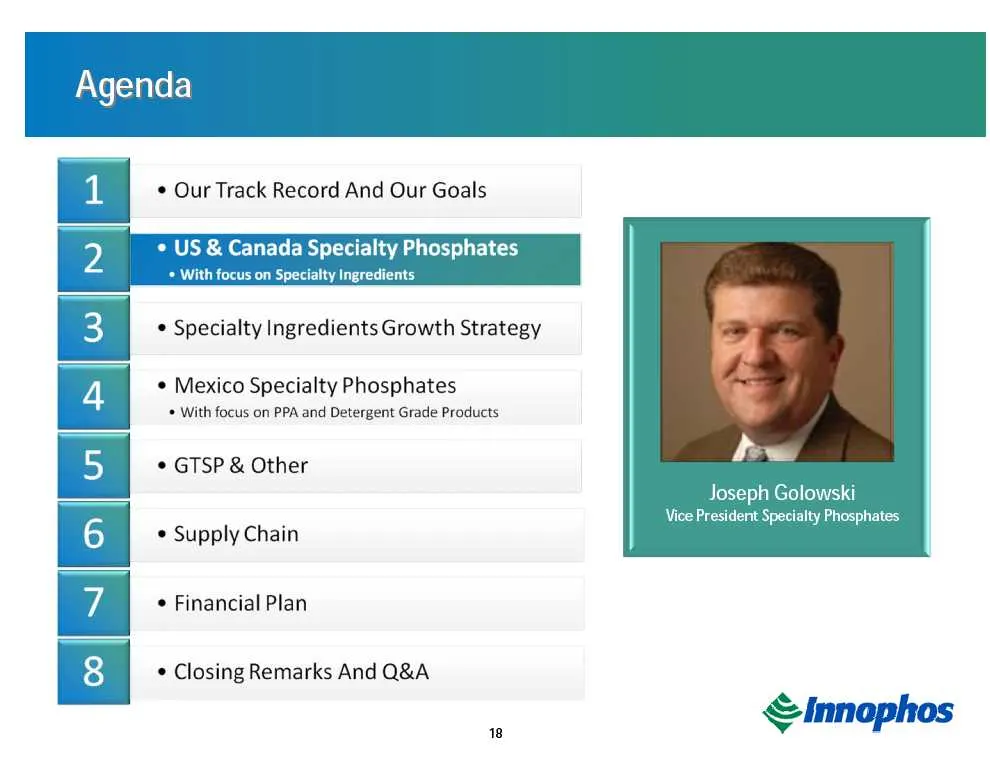
Ee ‘PEE a sil ai * Specialty Ingredients Growth Strategy * Mexico Specialty Phosphates * With focus on PPA and Detergent Grade Products he * GTSP & Other Joseph Golowski Vice President Specialty Phosphates * Supply Chain * Financial Plan * Closing Remarks And Q&A €innophos
Slide 21: US & Canada Specialty Phosphates: A Strong Portfolio Segment
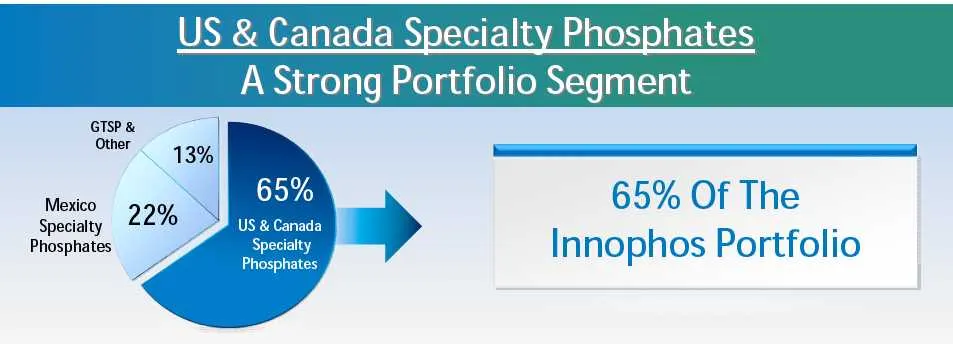
Canada Specialty Phosphates A Strong Portfolio Segment GTSP & | Other 13% a nd 65% Of The >» Innophos Portfolio Mexico 22% Y Specialty Phosphates
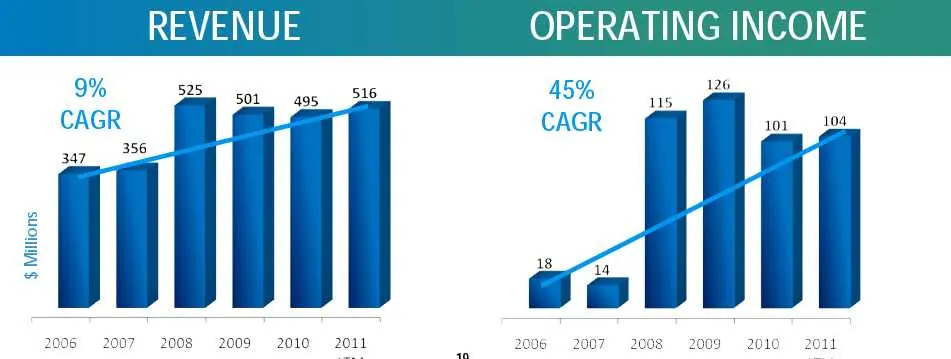
Slide 22: Revenue and Operating Income
525 0, CAGF 501 g95 SG ear | | | | 2006 ©2007 «2008 «200920102011 2006 $ Millions 2007 2008 ©2009-2010 2011
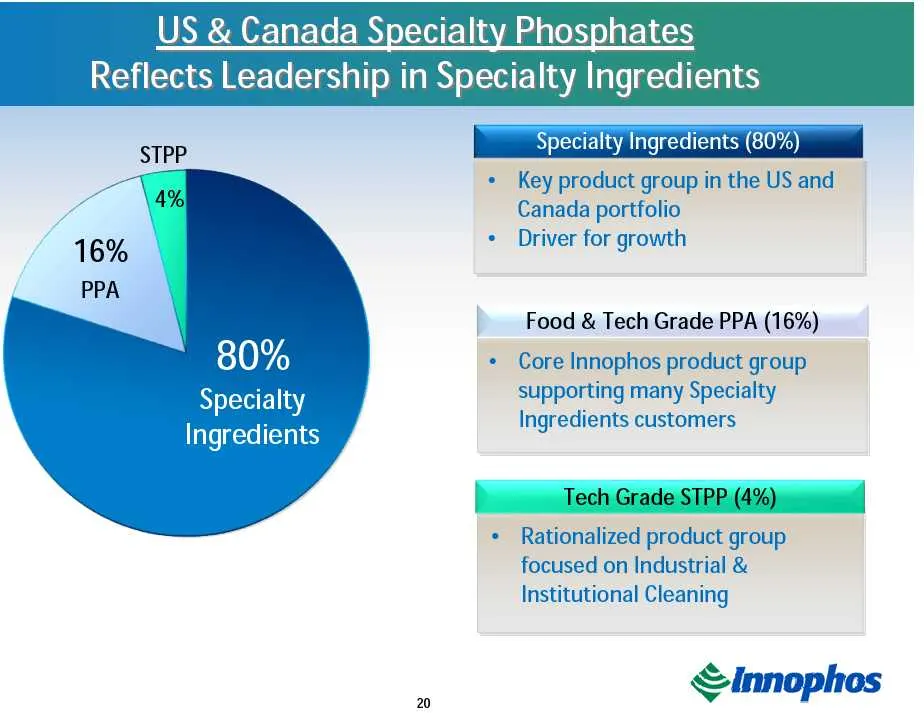
Slide 23: US & Canada Specialty Phosphates
US & Canada Specialty Phosphates Reflects Leadership in Specialty Ingredients 80% Specialty Ingredients 20 Specialty Ingredients (80%) Key product group in the US and Canada portfolio Driver for growth Food & Tech Grade PPA (16%) Core Innophos product group supporting many Specialty Ingredients cust
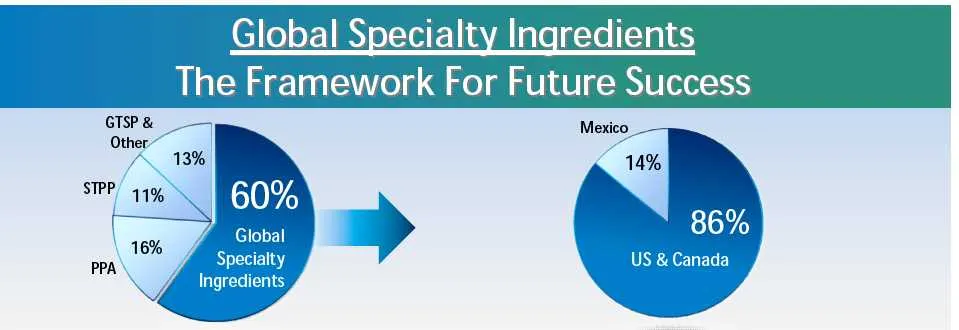
Slide 24: GTSP
GTSP ee | S\ 13%
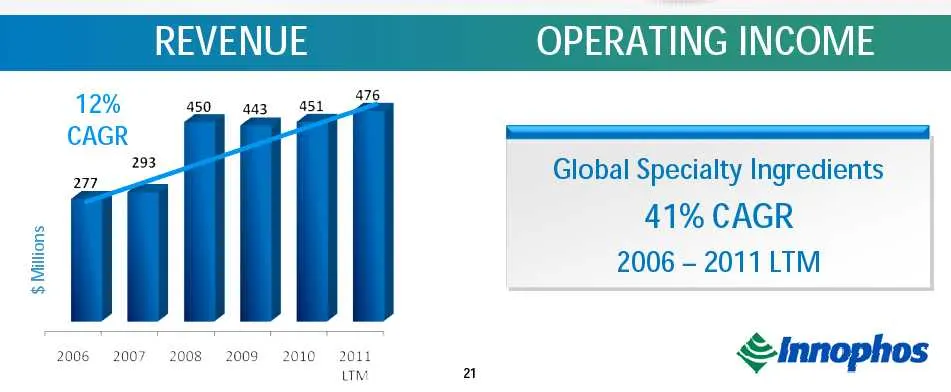
Slide 25: Operating Income: Global Specialty Ingredients
E OPERATING INCOME Global Specialty Ingredients 41% CAGR 2006 - 2011 LTM Innophos $ Millions 2010 2011 2006 ©2007 +2008 2009 uM
Slide 26: Specialty Ingredients: The Foundation For Attractive Margins
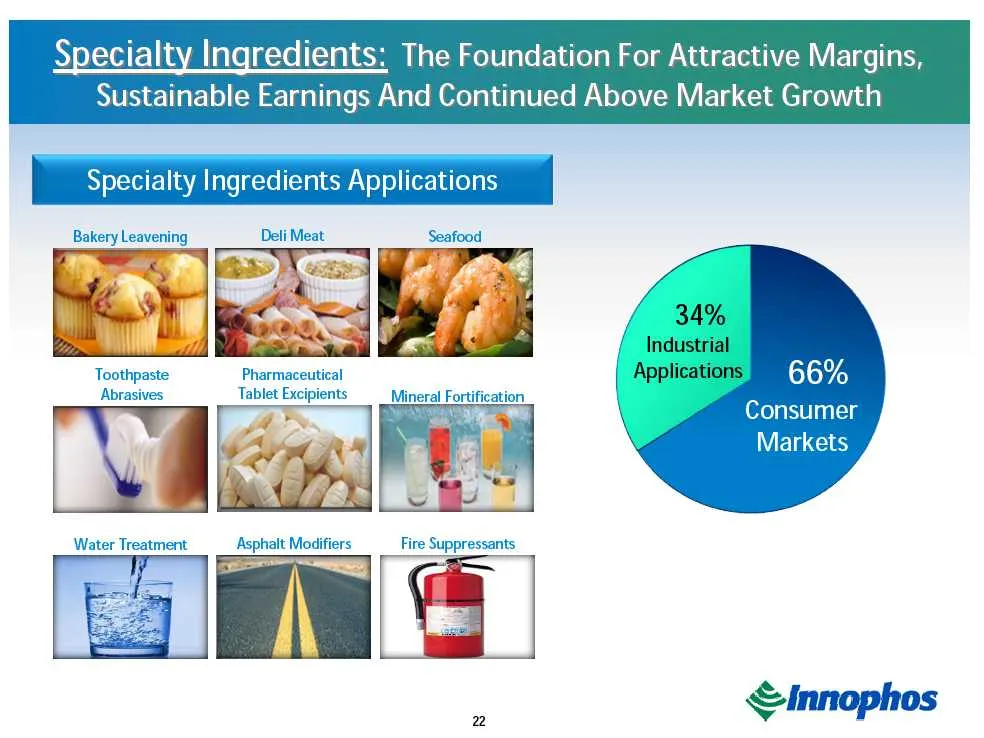
Specialty Ingredients: The Foundation For Attractive Margins, Sustainable Earnings And Continued Above Market Growth Specialty Ingredients Applications Deli Meat Bakery Leavening Toothpaste Pharmaceutical 66% Abrasives _ Tablet Excipients Mineral Fortification Consumer Markets Water Treatment Asphal
Slide 27: Specialty Ingredients: Attractive Margins, Sustainability Of Earnings
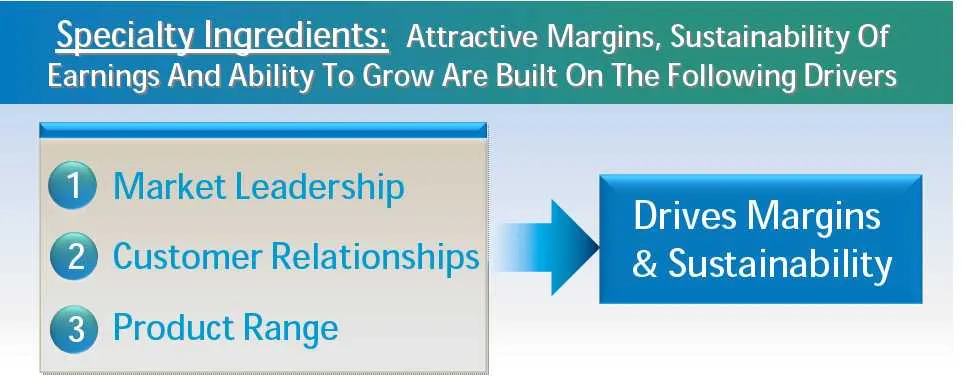
Specialty Ingredients: Attractive Margins, Sustainability Of Earnings And Ability To Grow Are Built On The Following Drivers 1) Market Leadership : . 3 Drives Margins @ Customer Relationships & Sustainability © Product Range
Slide 28: Geographic Expansion
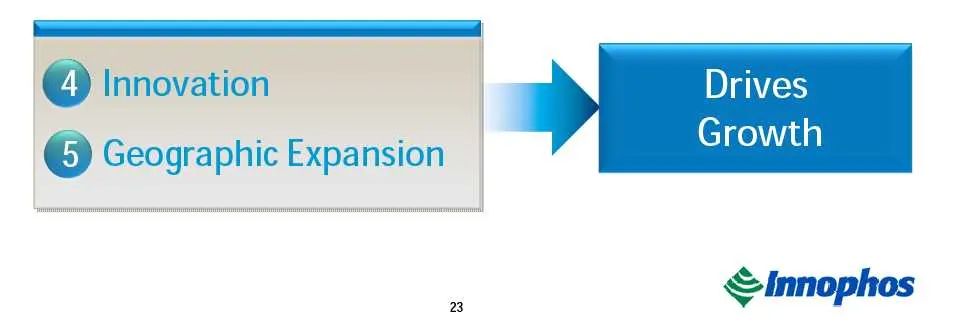
C5) Geographic Expansion ST innophos
Slide 29: Product Market Leadership: Global Specialty Phosphate Industry
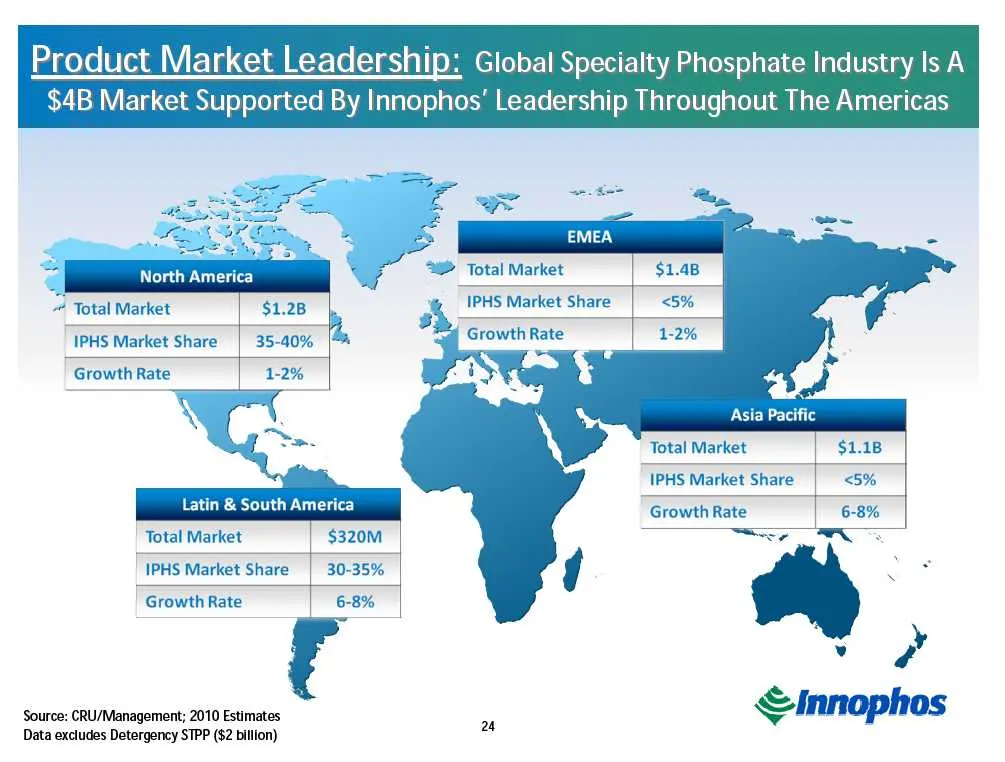
roduct Market Leadership: Global Specialty Phosphate Industry Is A _ $4B Market Supported By Innophos’ Leadership Throughout The Americas Total Market $1.28 eae IPHS Market Share 35-40% == NorthAmerica "Growth Rate 1-2% yy al Total Market % |PHS Market Share j Growth Rate ————— Asia Pacific Total Ma

Slide 30
Slide 31: Market leader in all key segments in North America
Market leader in all key segments in North America Leading product market position globally . ©Innophos
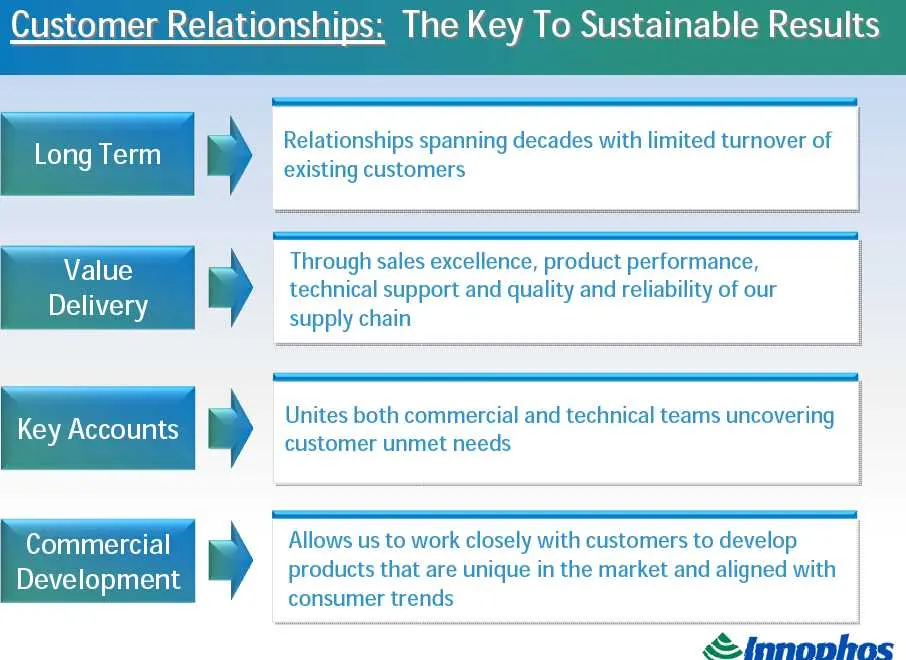
Slide 32: Customer Relationships To Sustainable Results
To Sustainable Results Relationships spanning decades with limited turnover of existing customers Value Through sales excellence, product performance, Deli technical support and quality and reliability of our ely) supply chain KevAcrounts Unites both commercial and technical teams uncovering y custo
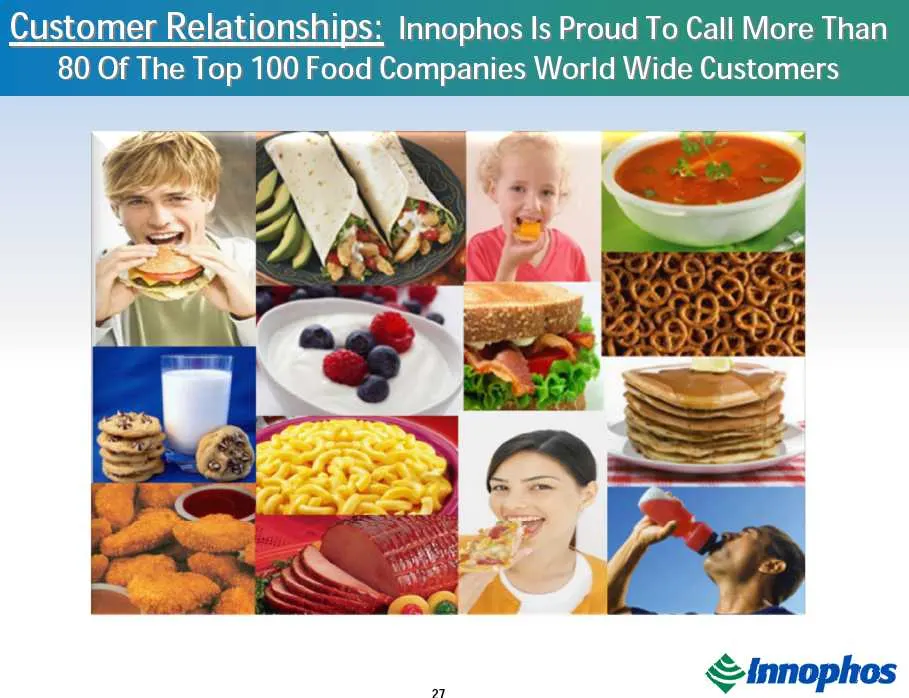
Slide 33: Customer Relationships: More Than 80 Of The Top 100 Food Companies
Customer Relationships: Innophos Is Proud To Call More Than 80 Of The Top 100 Food Companies World Wide Customers
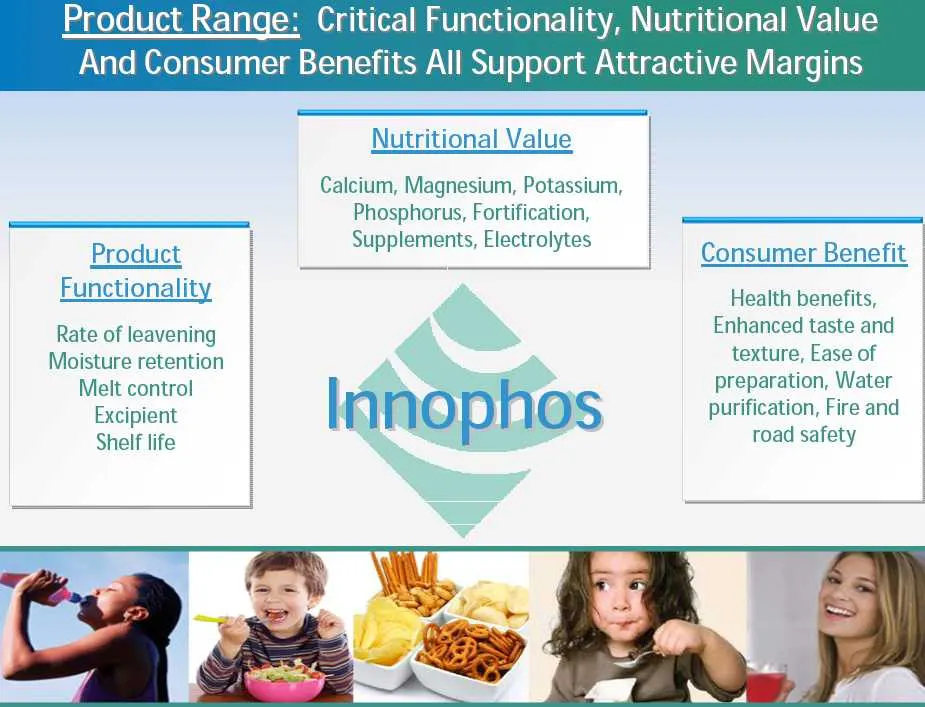
Slide 34: Product Range: Critical Functionality, Nutritional Value
Product Range: Critical Functionality, Nutritional Value Consumer Benefits All Support Attractive Margins Nutritional Value Calcium, Magnesium, Potassium, Phosphorus, Fortification, _—____________.. Supplements, Electrolytes Product Functionality Rate of leavening Moisture retention Consumer Benefit
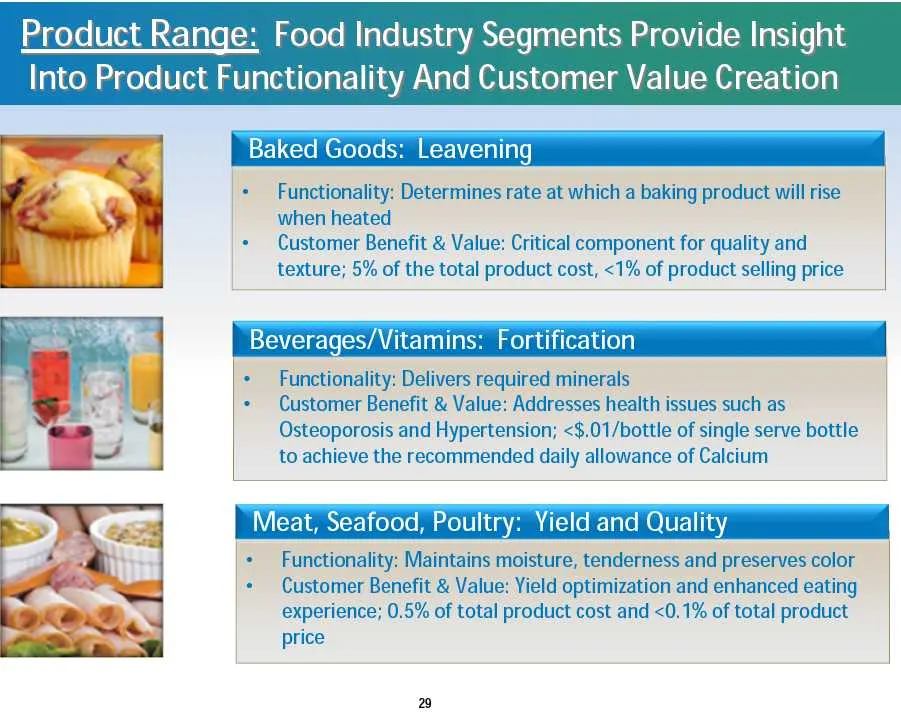
Slide 35: Food Industry Segments Provide Insight Into Functionality And Customer Value
Food Industry Segments Provide Insight unctionality And Customer Value Creation =d Goods: | fe Functionalit Determines rate at which a baking product will rise when heate + Customer Benefit & Value: Critical component for quality and texture; 5% of the total product cost, <1% of product selling pric
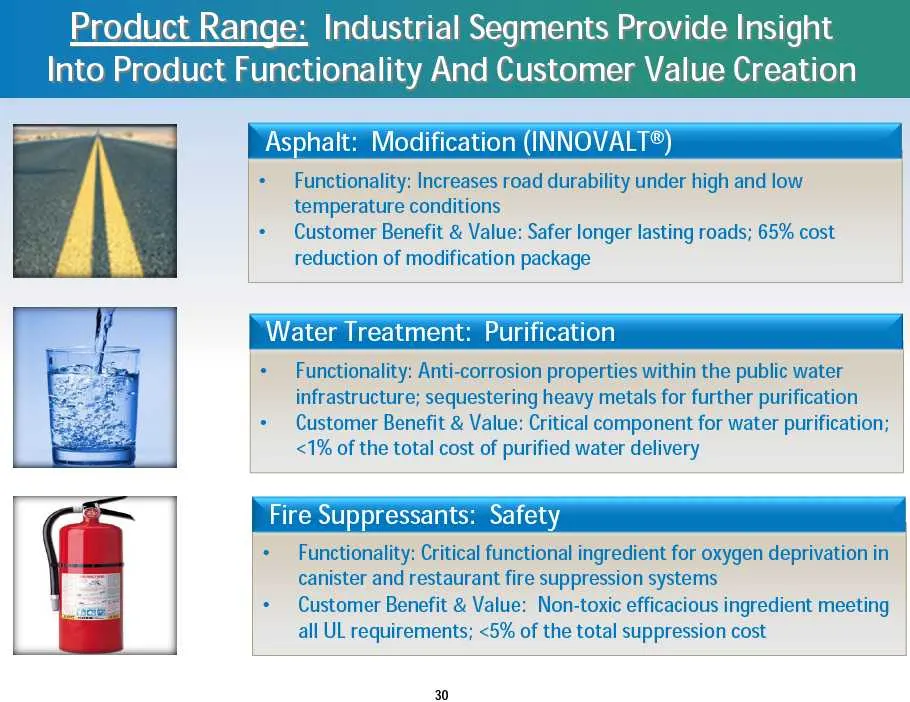
Slide 36: Industrial Applications And Customer Value
‘ oirinetoralij ts In | creases road durabi temperature: conditions Customer Benefit & Value: Safer longer lasting roads; 65% cost reduction of modification package — ‘high and I low Recueil it: Purification — Customer Benefit & Value: Critical component for water purification; <1% of the total cost
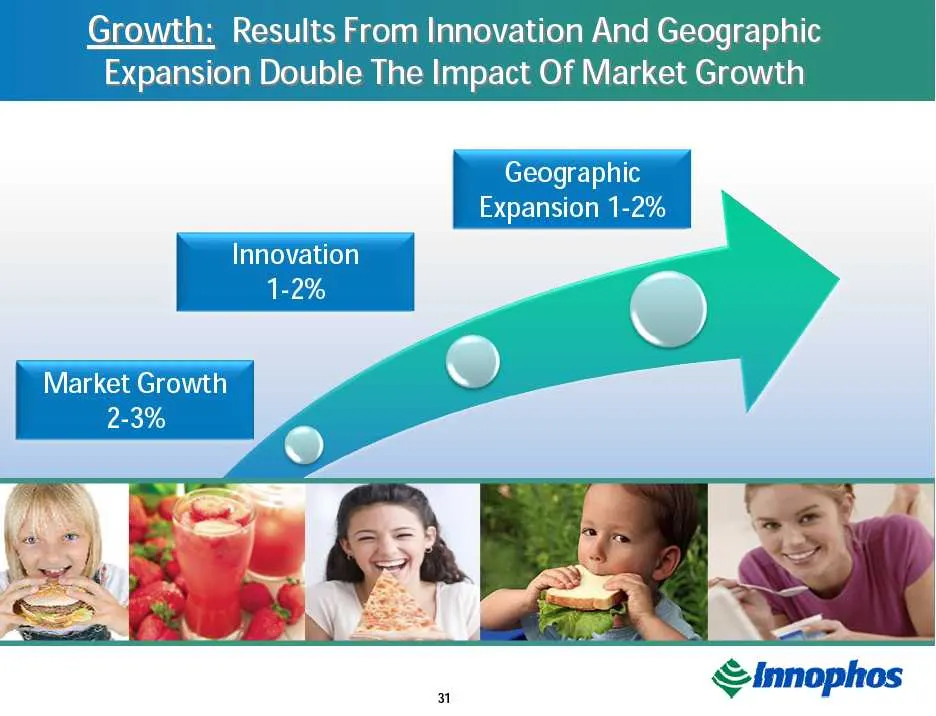
Slide 37: Growth From Innovation And Geographic Expansion
rom Innovation And Geographic le The Impact Of Market Growth ‘Geographic Expansion 1-2% ane ation” 1-25 1-2% | Market Growth 2-3% ©Innophos
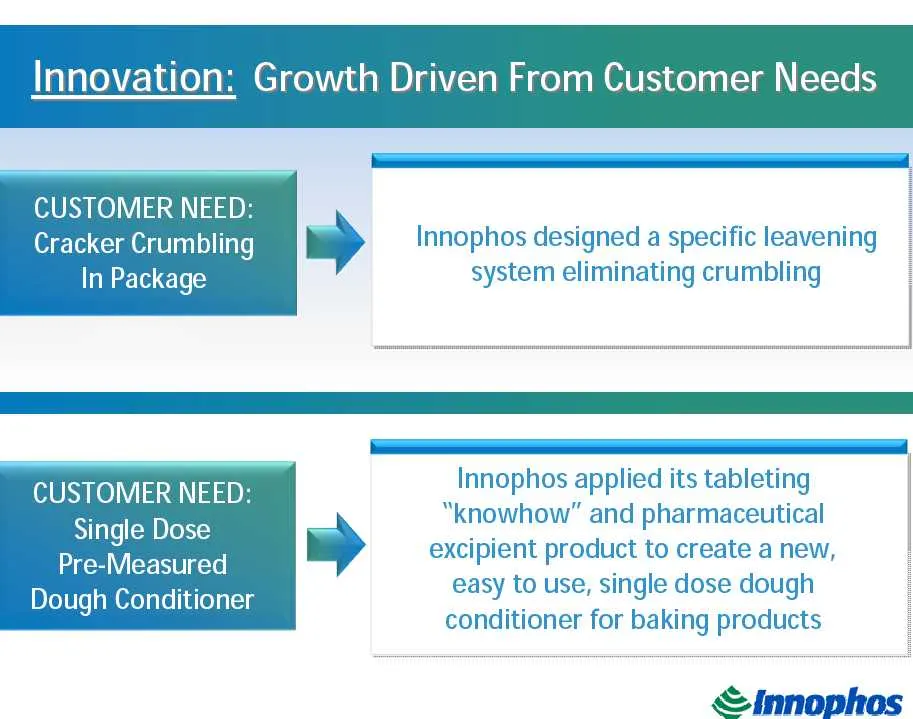
Slide 38: Customer Need Examples
CUSTOMER NEED: Cracker Crumbling by Innophos designed a specific leavening In Package system eliminating crumbling | CUSTOMER NEED: i Innophos applied its tableting Si knowhow” and pharmaceutical ingle Dose cae re 7 excipient product to create a new, easy to use, single dose dough conditioner for ba
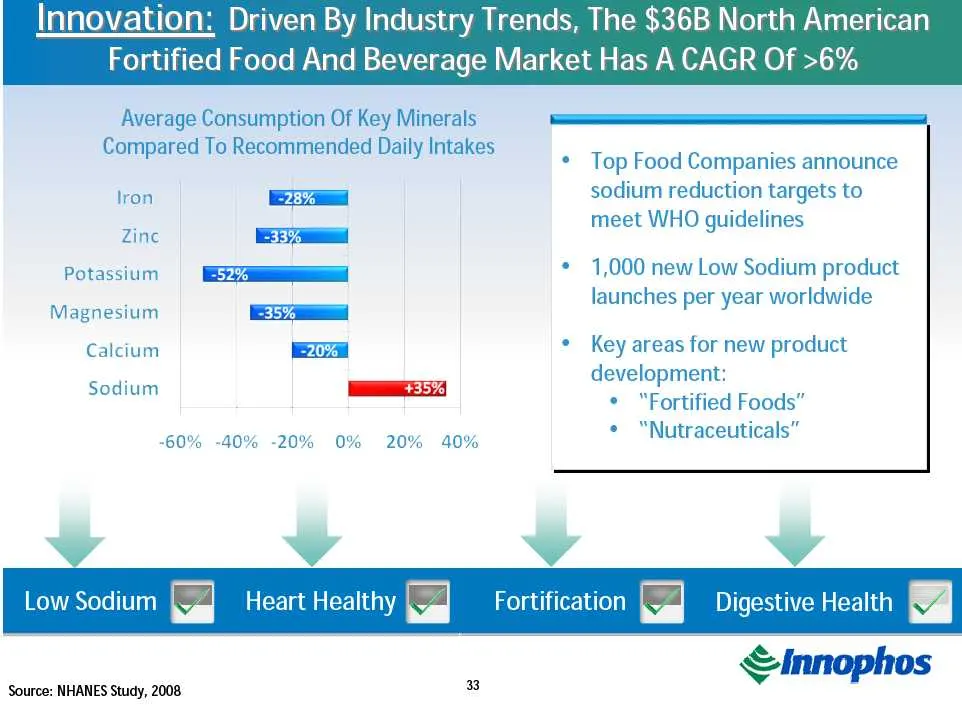
Slide 39: Innovation: Driven By Industry Trends
Innovation: Driven By Industry Trends, The $36B North American Fortified Food And Beverage Market Has A CAGR Of >6% Average Consumption Of Key Minerals $$ Compared To Recommended Daily Intakes *! ‘Top Foou Companies announce fron 28% | sodium reduction targets to . meet WHO guidelines Zinc ey! Potas
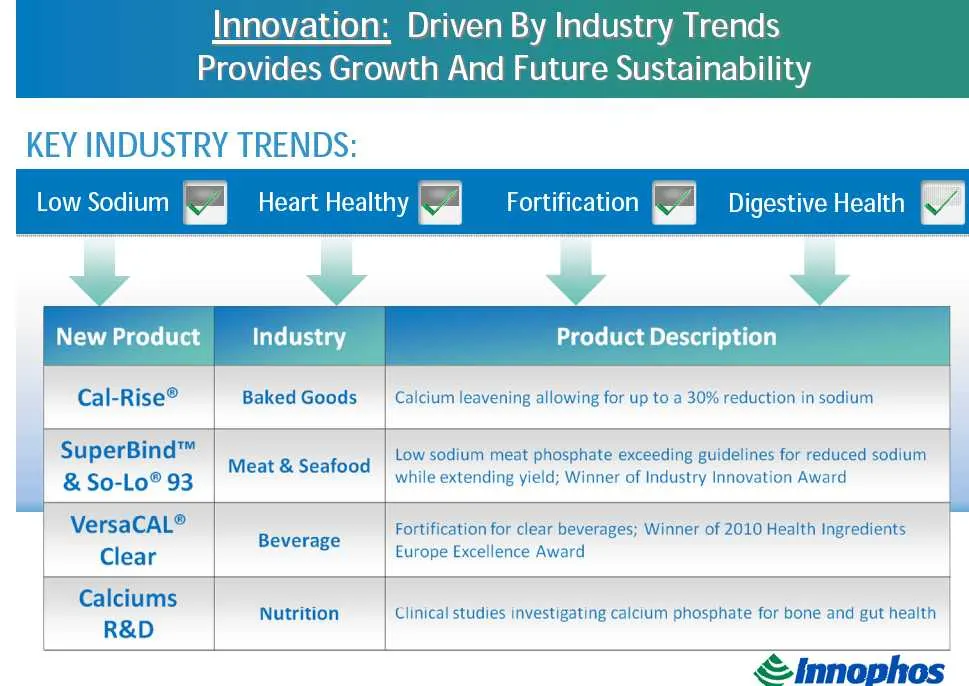
Slide 40: Innovation: Driven By Industry Trends
Innovation: Driven By Industry Trends Provides Growth And Future Sustainability KEY INDUSTRY TRENDS: Low Sodium Heart Healthy Fortification S| Digestive Health 4 bh 4 bh 4 bd New Product Industry Product Description | Cal-Rise® Baked Goods _| Calcium leavening allowing for up to a 30% reduction in s
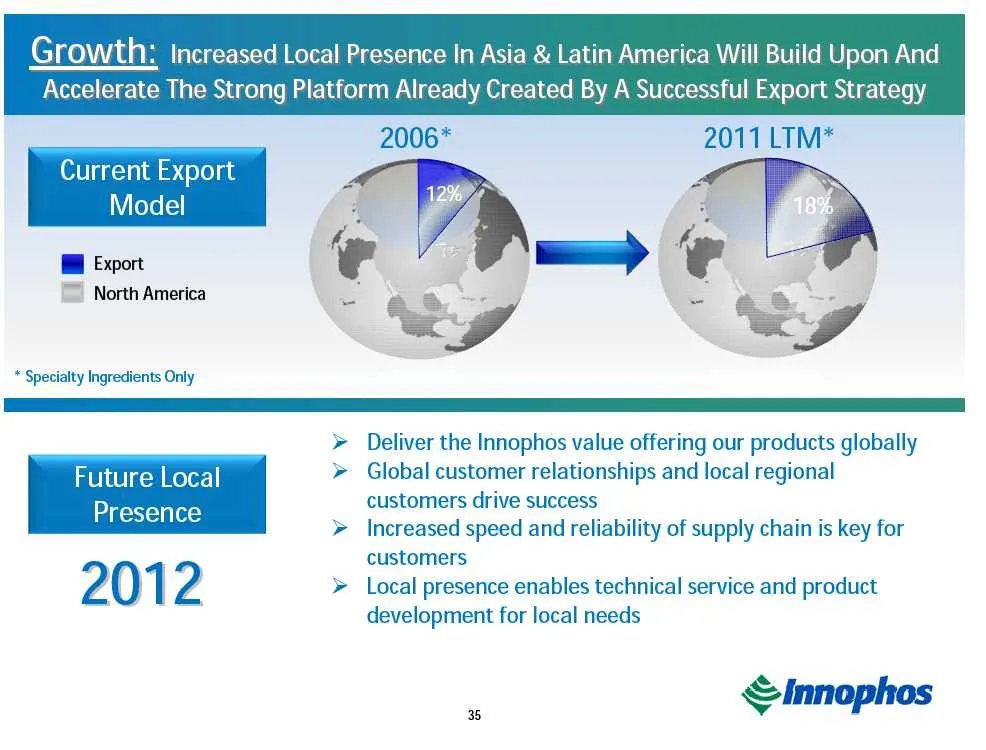
Slide 41: Growth: Increased Local Presence In Asia & Latin America
Growth: Increased Local Presence In Asia & Latin America Will Build Upon And Accelerate The Strong Platform Already Created By A Successful Export Strategy 2011 LTM* Current Export * | aN Model f ¢ £ BB Export > North America * Specialty Ingredients Only Deliver the Innophos value offering our produ
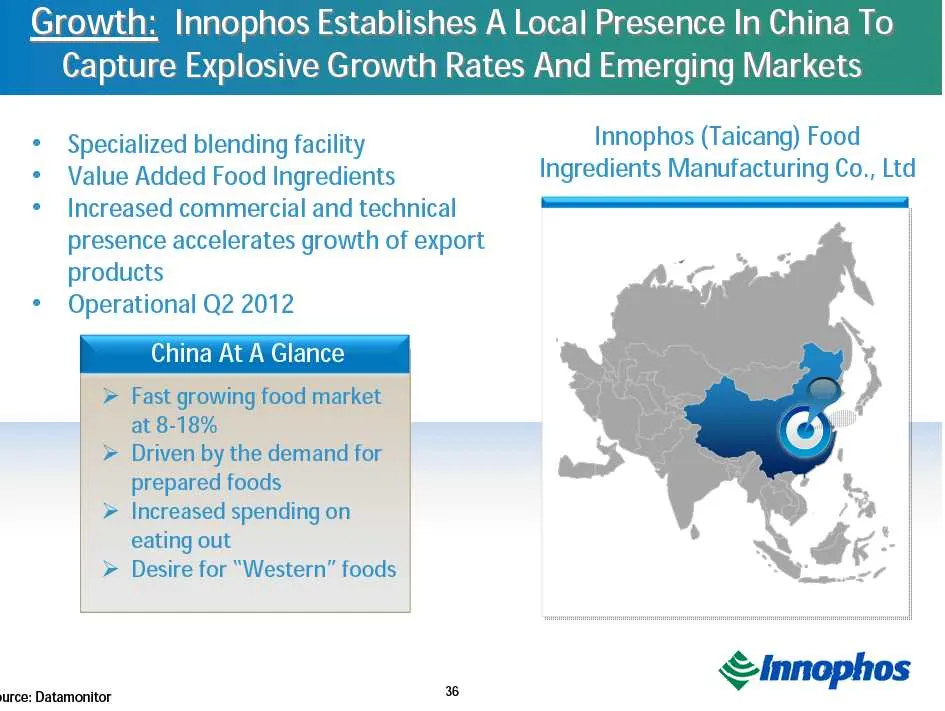
Slide 42: Innophos Establishes A Local Presence In China
h: Innophos Establishes A Local Presence In China Capture Explosive Growth Rates And Emerging Markets * Specialized blending facility Innophos (Taicang) Food * Value Added Food Ingredients Ingredients Manufacturing Co., Ltd * Increased commercial and technical presence accelerates growth of export p
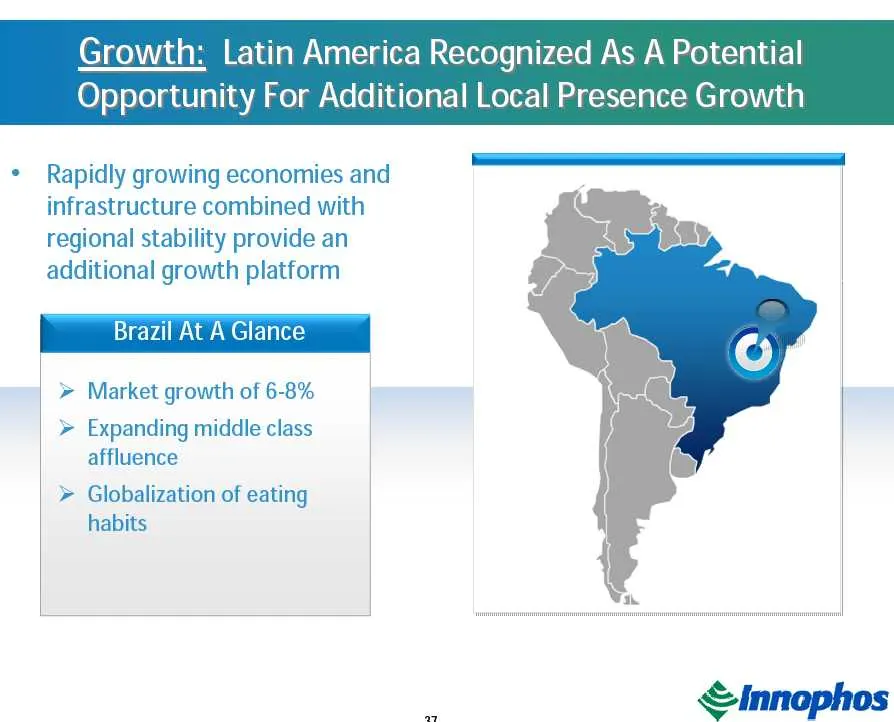
Slide 43: Growth: Latin America As A Potential Opportunity
Growth: Latin America Recognized As A Potential Opportunity For Additional Local Presence Growth * Rapidly growing economies and infrastructure combined with regional stability provide an additional growth platform Brazil At A Glance >» Market growth of 6-8% > Expanding middle class affluence > Glob
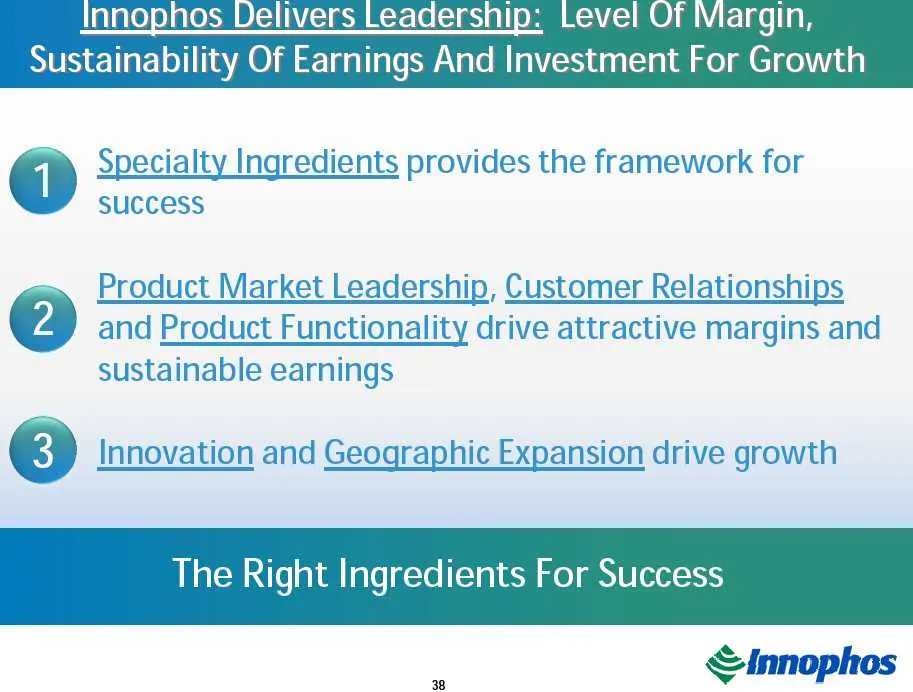
Slide 44: Innophos Delivers Leadership: Margin, Earnings Sustainability, Growth
Innophos Delivers Leadership: Level Of Margin, ustainability Of Earnings And Investment For Growth w Specialty Ingredients provides the framework for success Product Market Leadership, Customer Relationships and Product Functionality drive attractive margins and sustainable earnings Innovation and G
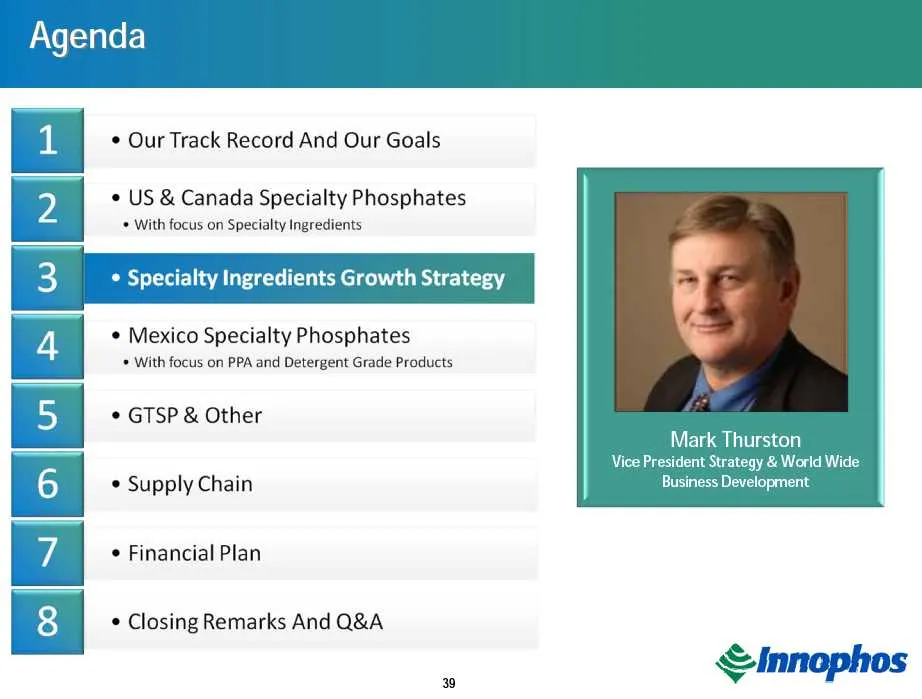
Slide 45: Our Track Record And Our Goals
"ey ¢ Our Track Record And Our Goals + With focus on Specialty Ingredients bs 2 ¢ US & Canada Specialty Phosphates lients Growth Strategy * Mexico Specialty Phosphates * With focus on PPA and Detergent Grade Products * GTSP & Other * Supply Chain ¢ Financial Plan * Closing Remarks And Q&A Mark Thurs
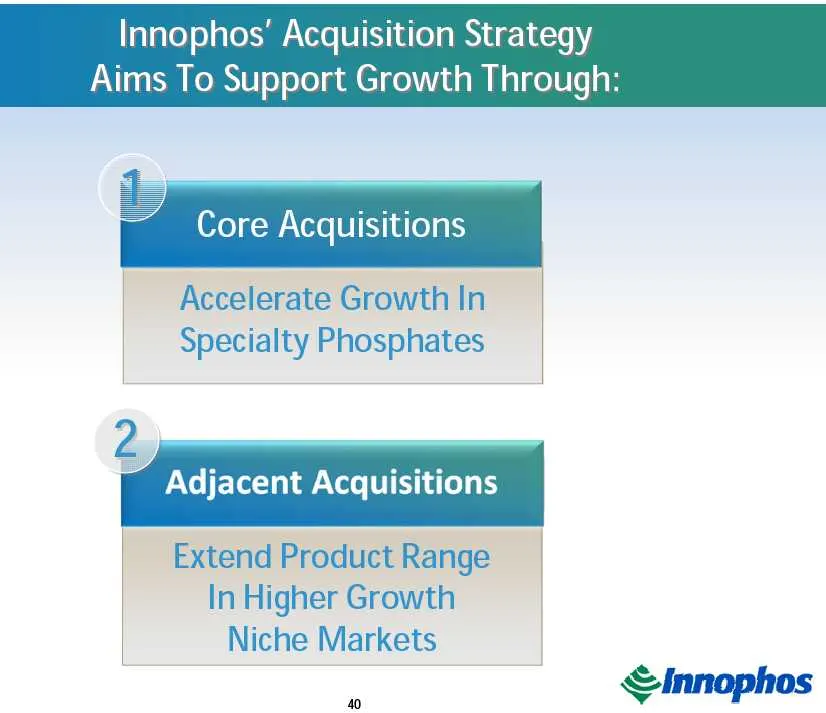
Slide 46: Innophos' Acquisition Strategy
Innophos’ Acquisition Strategy Aims To Support Growth Through: Core Acquisitions Accelerate Growth In Specialty Phosphates ~ Adjacent Acquisitions Extend Product Range In Higher Growth Niche Markets . ©innophos
Slide 47: Value In A Core Acquisition
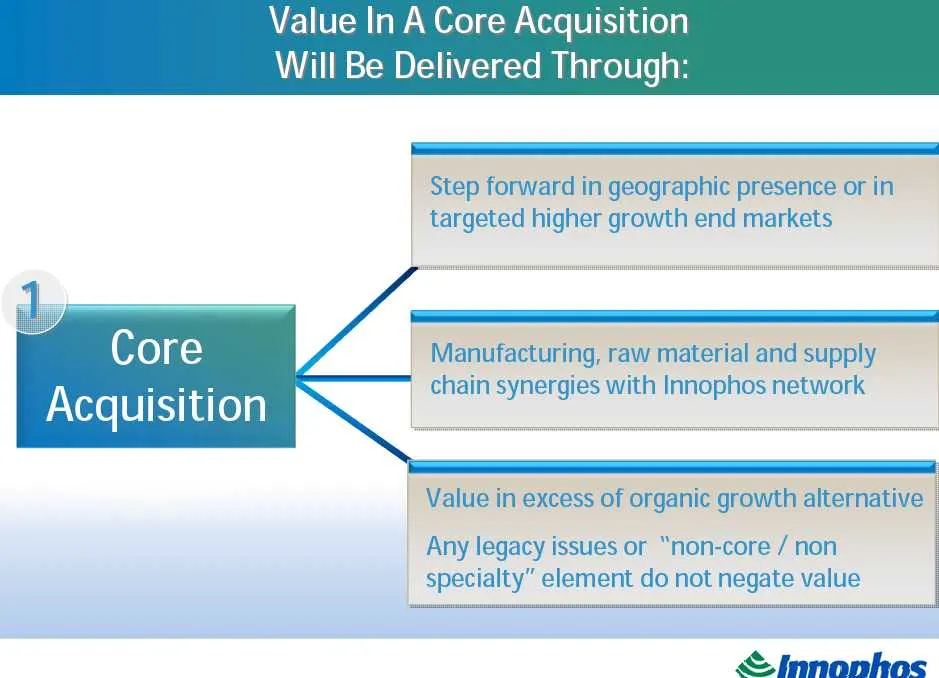
Value In A Core Acquisition Will Be Delivered Through: Step forward in geographic presence or in targeted higher growth end markets Manufacturing, raw material and supply | chain synergies with Innophos network | Core Acquisition | Value in excess of organic growth alternative | | Any legacy issues
Slide 48: Value In An Adjacent Acquisition
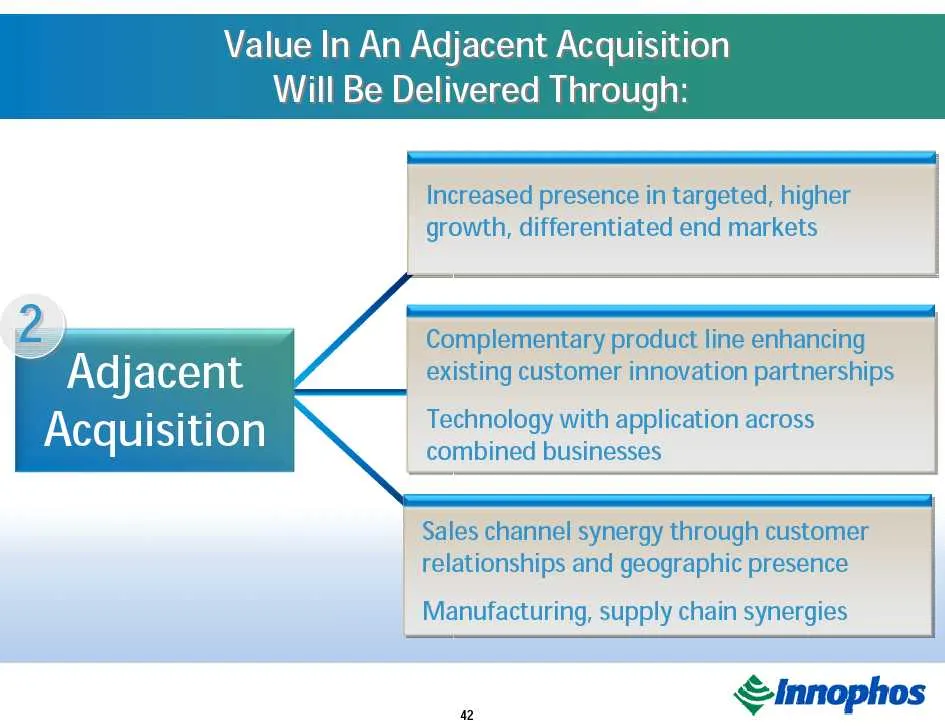
Value In An Adjacent Acquisition Will Be Delivered Through: Increased presence in targeted, higher growth, differentiated end markets | Complementary product line enhancing | existing customer innovation partnerships Adjacent Acquisition Technology with application across combined businesses Sales c
Slide 49: Food And Supplement Mineral Fortification Is A Targeted High Growth Market
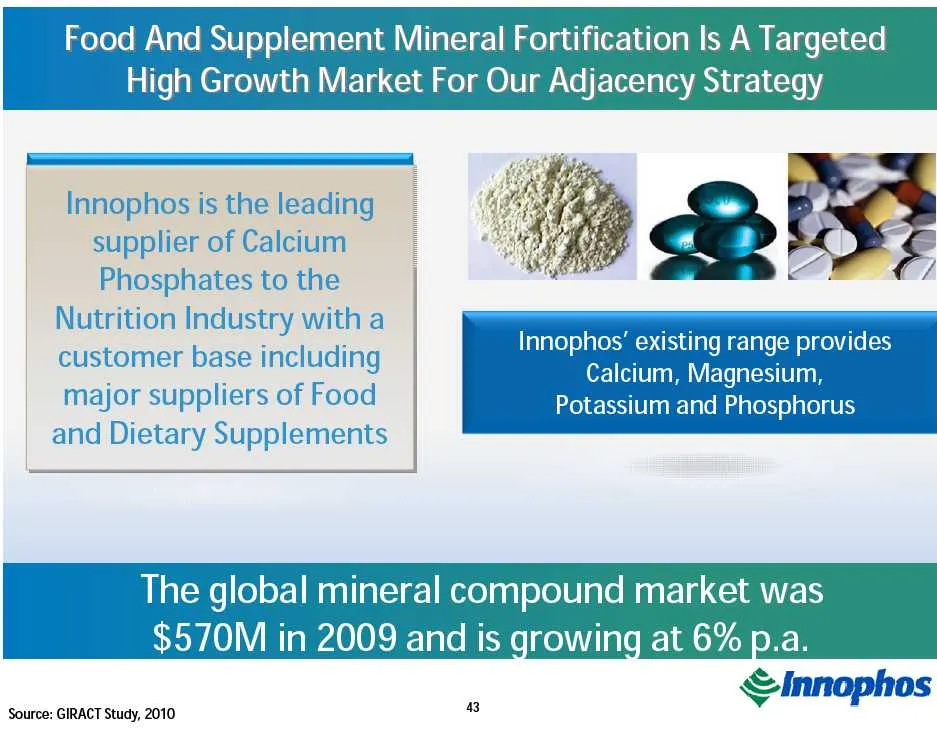
Food And Supplement Mineral Fortification Is A Targeted High Growth Market For Our Adjacency Strategy Innophos is the leading supplier of Calcium Phosphates to the Nutrition Industry with a —_ ' A : Innophos’ existing range provides customer base including : : Calcium, Magnesium, major suppliers of
Slide 50: id for fortification with
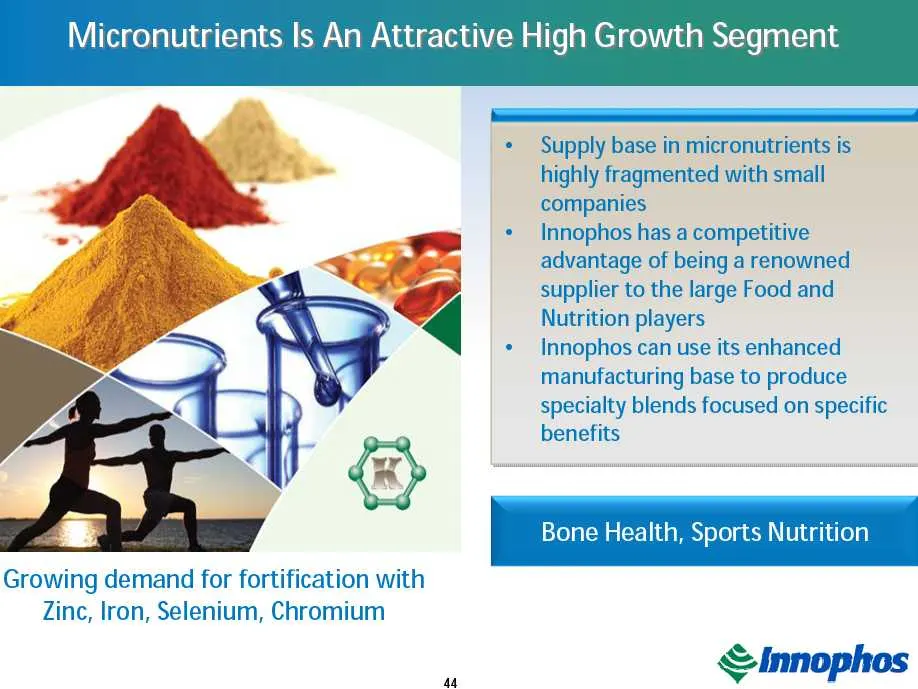
id for fortification with 4A Supply base in micronutrients is highly fragmented with sn anies hos has a compe’ tage of being a renowned ier to the large Food and Nutrition playe: Innophos can use its enhanced to fF F Is focused on sf
Slide 51: Adjacency Strategy: Kelatron
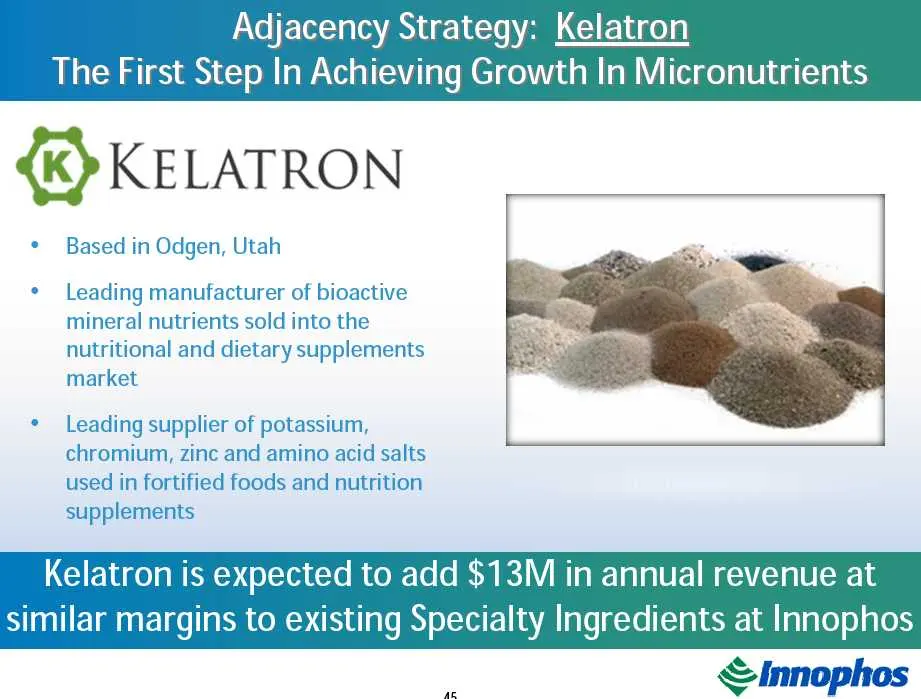
Adjacency Strategy: Kelatr The First Step In Achieving Growth In Micronutrients KELATRON Based in Odgen, Utah ¢ Leading manufacturer of bioactive mineral nutrients sold into the nutritional and dietary supplements market * Leading supplier of potassium, chromium, zinc and amino acid salts used in fo
Slide 52: Innophos' strong worldwide customer
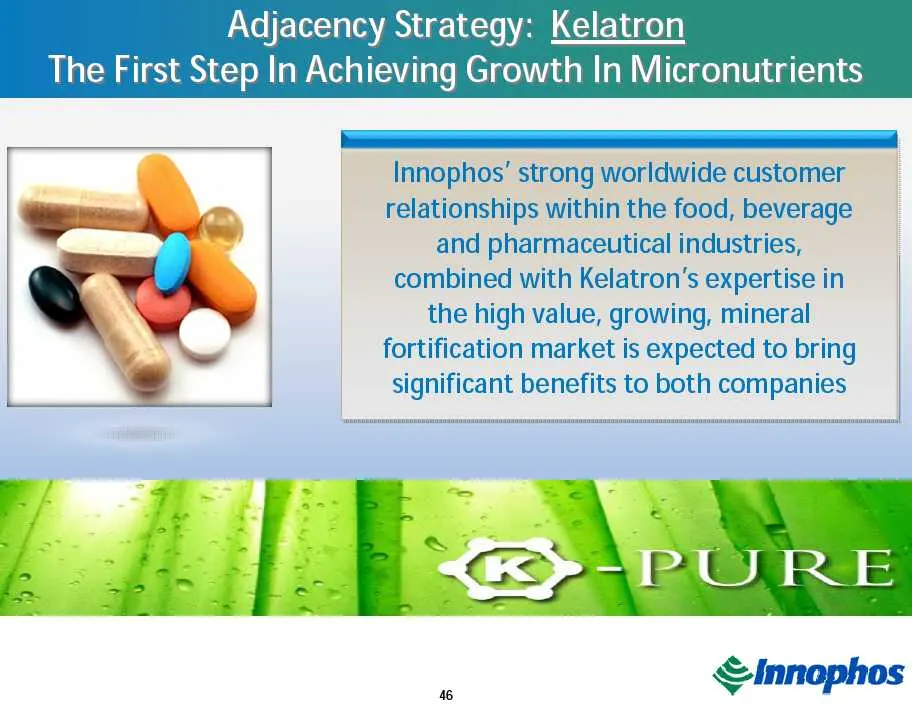
Innophos' strong worldwide customer relationships within the food, beverage and pharmaceutical industries, | combined with Kelatron’s expertise in the high value, growing, mineral fortification market is expected to bring significant benefits to both companies
Slide 53: Specialty Phosphates Within Overall Food Ingredients Market
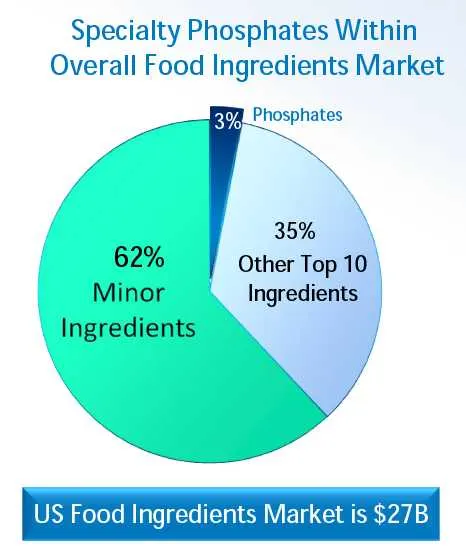
Specialty Phosphates Within Overall Food Ingredients Market Phosphates 62% Other Top 10 | Minor \ Ingredients — Ingredients US Food Ingredients Market is $27B
Slide 54: Growth Characteristics Of Food Ingredients
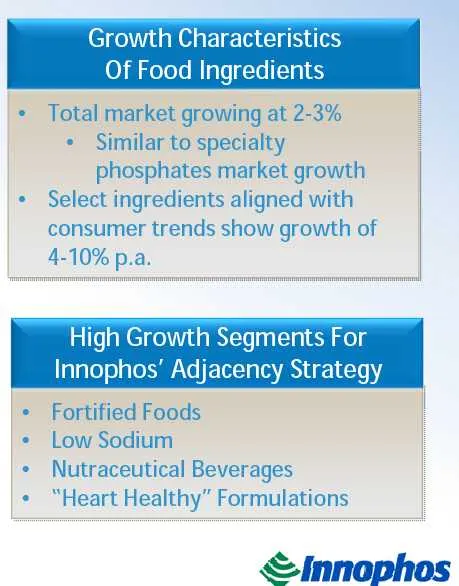
Growth Characteristics Of Food Ingredients * Total market growing at 2-3% * Similar to specialty phosphates market growth * Select ingredients aligned with consumer trends show growth of 4-10% p.a. High Growth Segments For Innophos’ Adjacency Strategy |+ Fortified Foods i Low Sodium | ¢ Nutraceutica
Slide 55: Our Track Record And Our Goals
ei * Our Track Record And Our Goals * US & Canada Specialty Phosphates * With focus on Specialty Ingredients * Specialty Ingredients Growth Strategy ity Phosphates etergent Grade Products | Abraham Shabot Vice President and Director General for * Supply Chain Innophos Latin America ¢ Financial Plan
Slide 56: Mexico Specialty Phosphates
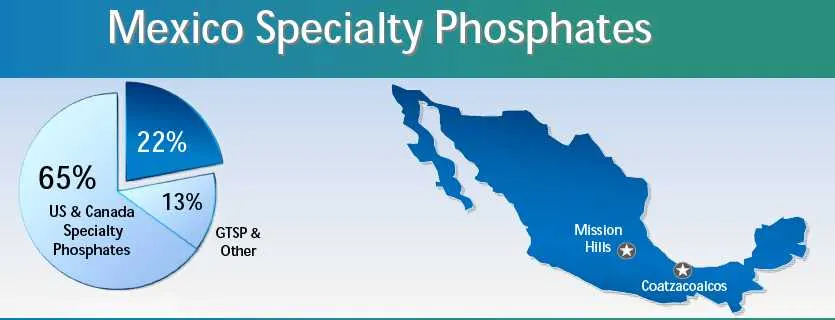
Mexico Specialty Phosphates a 2% 65% Specialty __ / GISP& _ Phosphates Y Other
Slide 57: Revenue and Operating Income
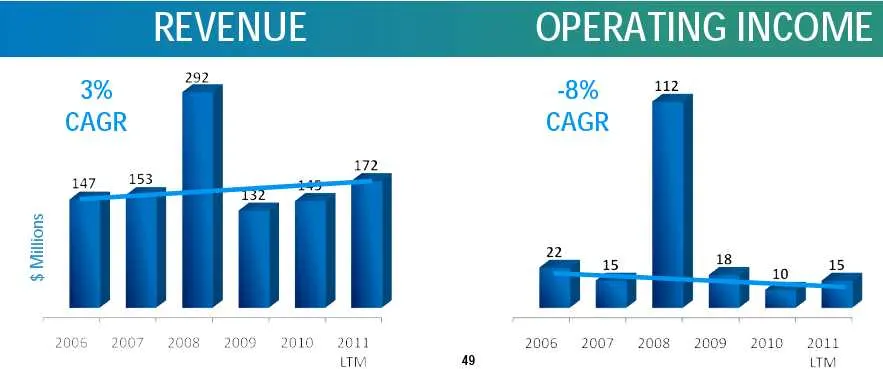
/ REVENUE OPERATING INCOM {ih trees 2010 2011 um 29, 7 YA lo Cc 147153, | 2006 ©2007 2008» 2009 $ Millions 2010 2011 2006 2007 2008 ©2009 um 49
Slide 58: Mexico Specialty Phosphates Product Mix
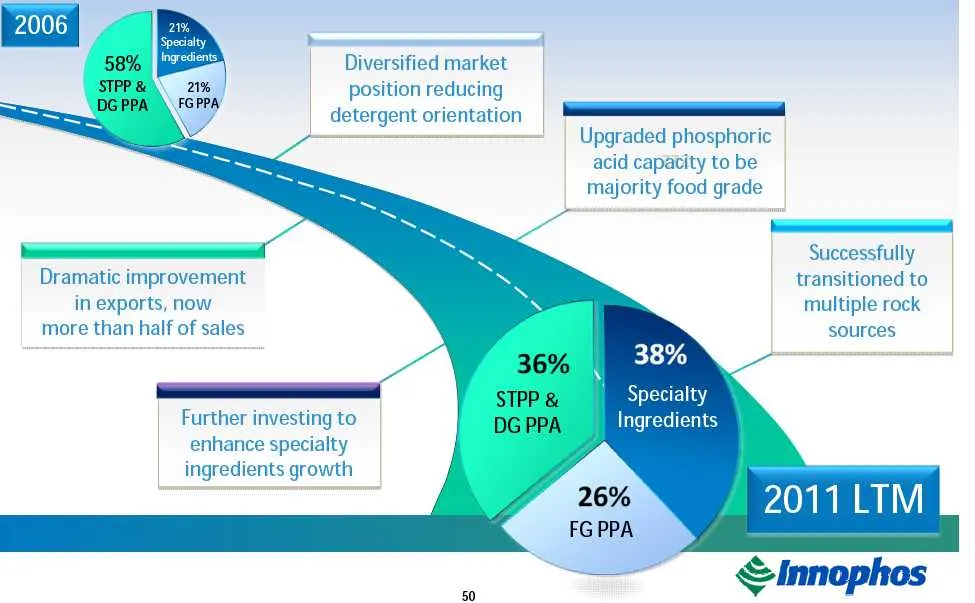
Specialty b 58% jie Diversified market STPP& 21% position reducing DGPPA \\FGPPA’ detergent orientation TT Upgraded phosphoric acid capacity to be majority food grade bi Successfully transitioned to multiple rock sources Dramatic improvement in exports, now more than half of sales y | 38% ed f > Spe
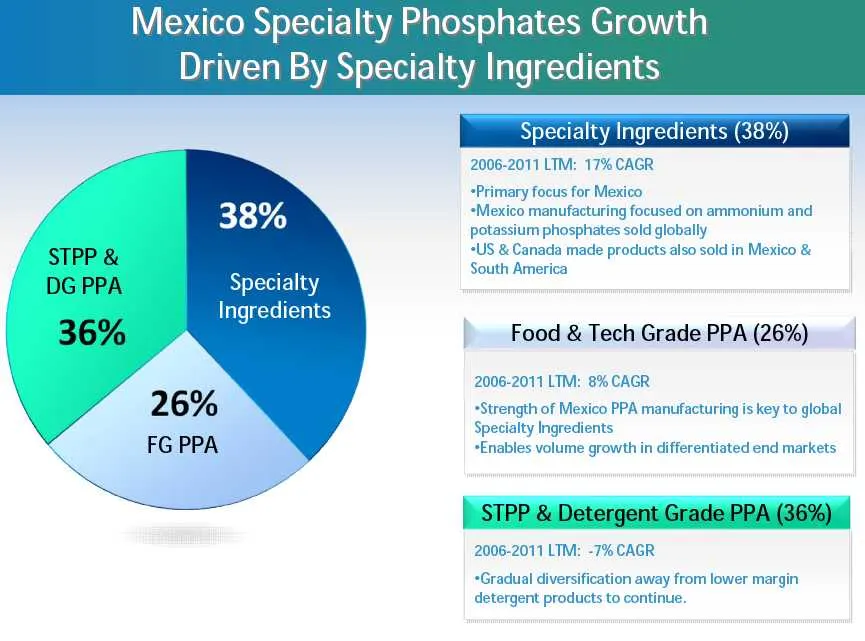
Slide 59: Mexico Specialty Phosphates Growth Driven By Specialty Ingredients
Mexico Specialty Phosphates Growth Driven By Specialty Ingredients Sper gredients (38%) ann 2006-2011 LIM: 17% CAGR y +Primary focus for Mexico A 3 8% +Mexico manufacturing focused on ammonium and f potassium phosphates sold globally US & Canada made products also sold in Mexico & STPP & . South Ame
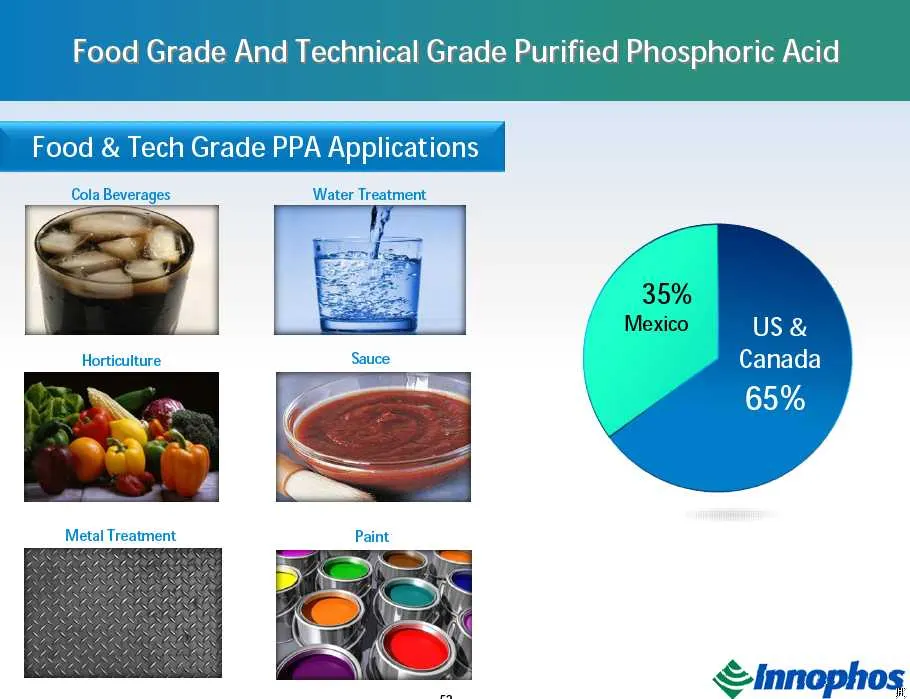
Slide 60: Inn
pf §, © innepno: Inn =
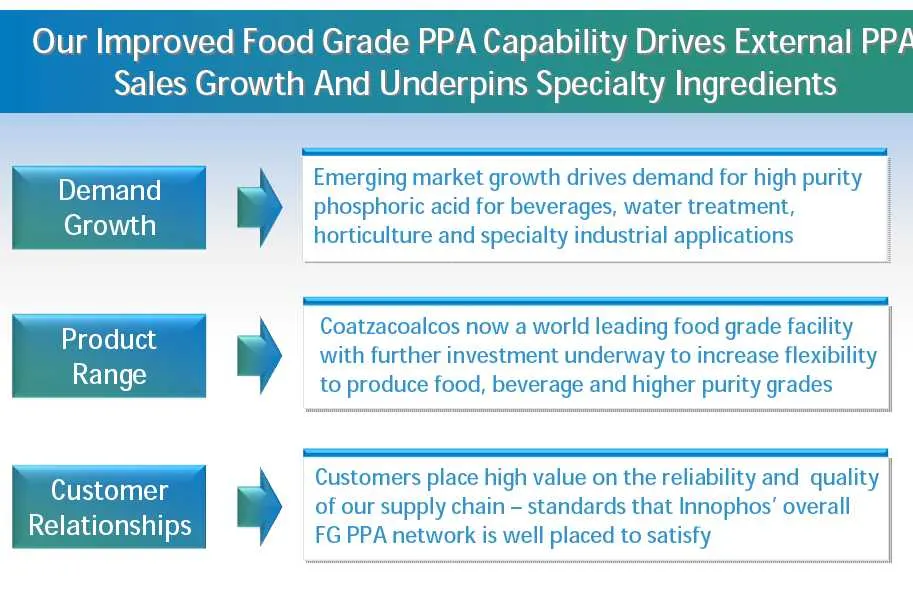
Slide 61: Improved Food Grade PPA Capability Drives External PPA Sales Growth
Improved Food Grade PPA Capability Drives External PPA Sales Growth And Underpins Specialty Ingredients . 4 Emerging market growth drives demand for high purity Demand nag phosphoric acid for beverages, water treatment, Growth horticulture and specialty industrial applications a ' Coatzacoalcos now
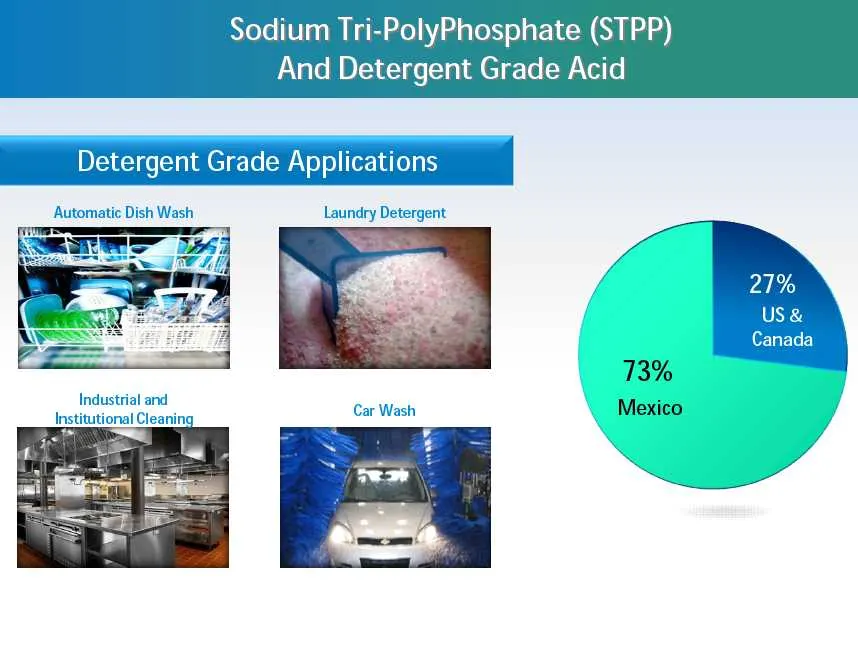
Slide 62: Sodium Tri-PolyPhosphate (STPP) And Detergent Grade Acid
Sodium Tri-PolyPhosphate (STPP) And Detergent Grade Acid
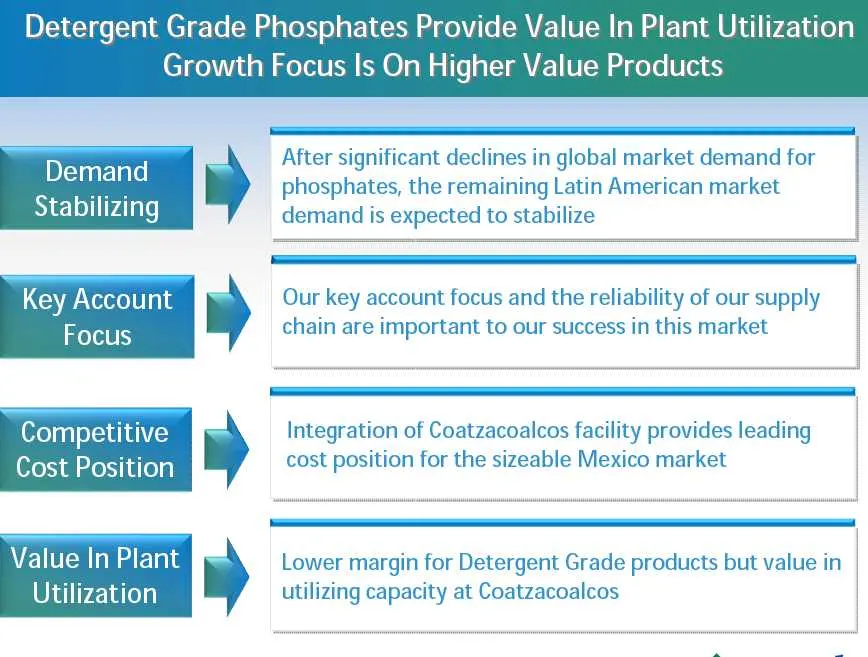
Slide 63: Detergent Grade Phosphates Provide Value In Plant Utilization
Detergent Grade Phosphates Provide Value In Plant Utilization Growth Focus Is On Higher Value Products Demand Stabilizing Competitive Cost Position Value In Plant Utilization After significant declines in global market demand for phosphates, the remaining Latin American market demand is expected to
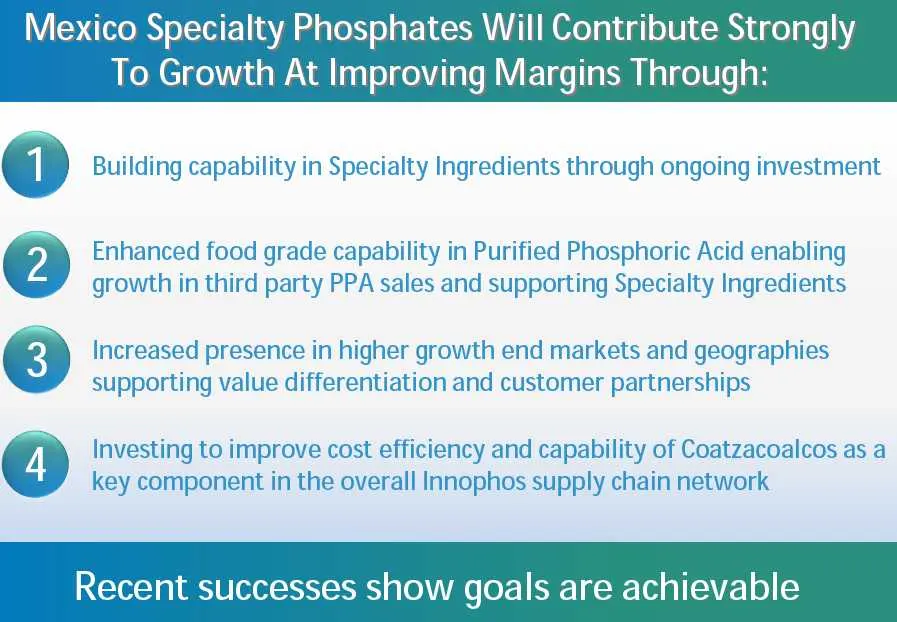
Slide 64: Mexico Specialty Phosphates Will Contribute Strongly To Growth
Mexico Specialty Phosphates Will Contribute Strongly To Growth At Improving Margins Through: i! Building capability in Specialty Ingredients through ongoing investment Enhanced food grade capability in Purified Phosphoric Acid enabling growth in third party PPA sales and supporting Specialty Ingredi
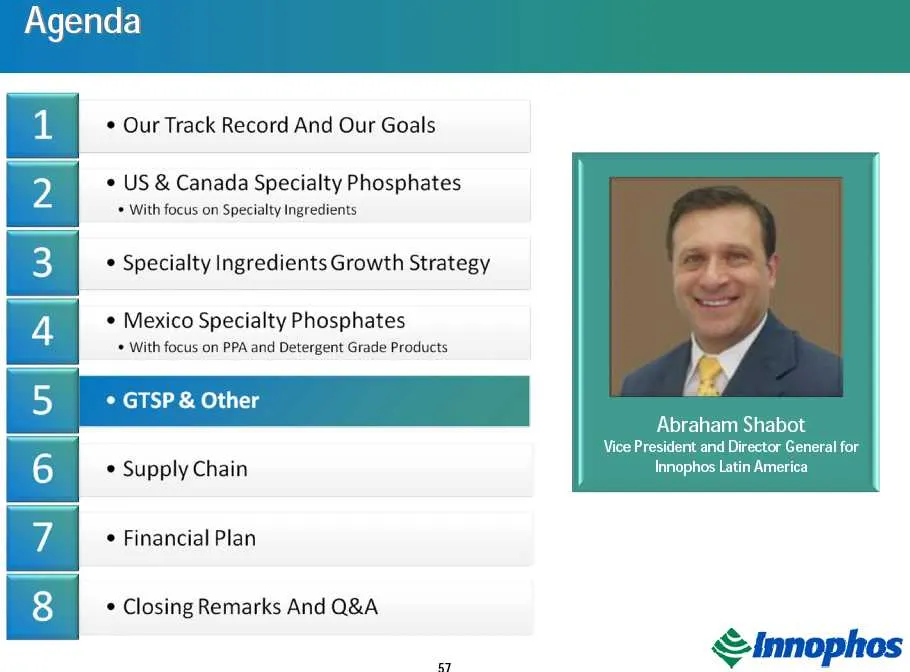
Slide 65: Our Track Record And Our Goals
* Our Track Record And Our Goals ¢ US & Canada Specialty Phosphates * With focus on Specialty Ingredients * Specialty Ingredients Growth Strategy * Mexico Specialty Phosphates * With focus on PPA and Detergent Grade Products + GTspa a z Abraham Shabot Vice President and Director General for * Supply
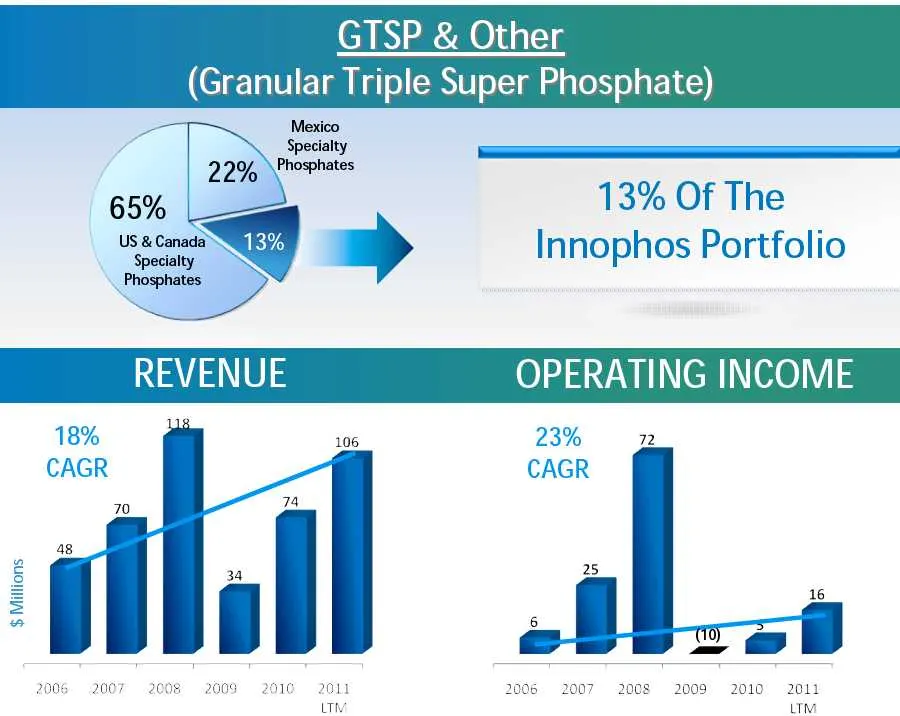
Slide 66: GTSP & Other
GTSP_& Other (Granular Triple Super Phosphate) ’ REVENUE OPERATING INCOME 370 22 65% 13% Of The >] > Innophos Portfolio 129 18% 106 CAGR — a La 48 f iJ iy 2006 2007 2008 © 2009 $ Millions 2010 2011 2006 «2007 «2008 ©=2009 2010-2011 LIM.

Slide 67: Value Generated Through GTSP Sales Is Important To Coatzacoalcos
ue Generated Through GTSP Sales Is Important To verall Optimization Of Coatzacoalcos Manufacturing SSS
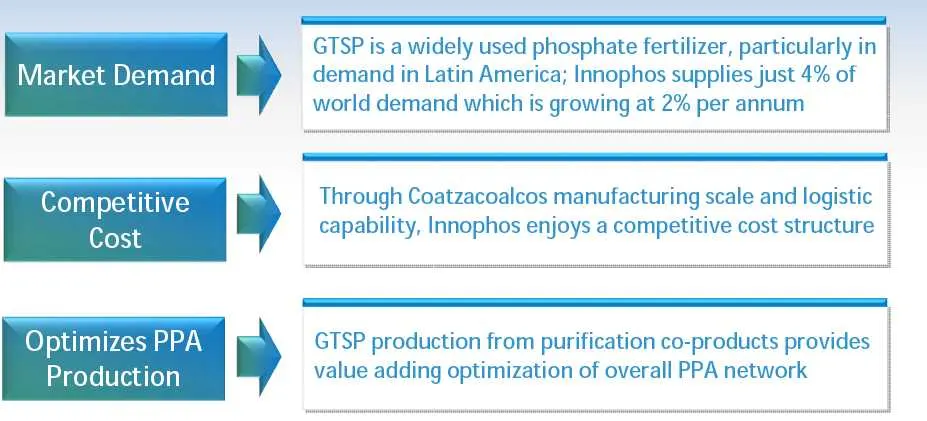
Slide 68: GTSP market demand, competitive cost and PPA optimization
GTSP is a widely used phosphate fertilizer, particularly in Market Dema demand in Latin America; Innophos supplies just 4% of world demand which is growing at 2% per annum Competitive Through Coatzacoalcos manufacturing scale and logistic Cost capability, Innophos enjoys a competitive cost structure
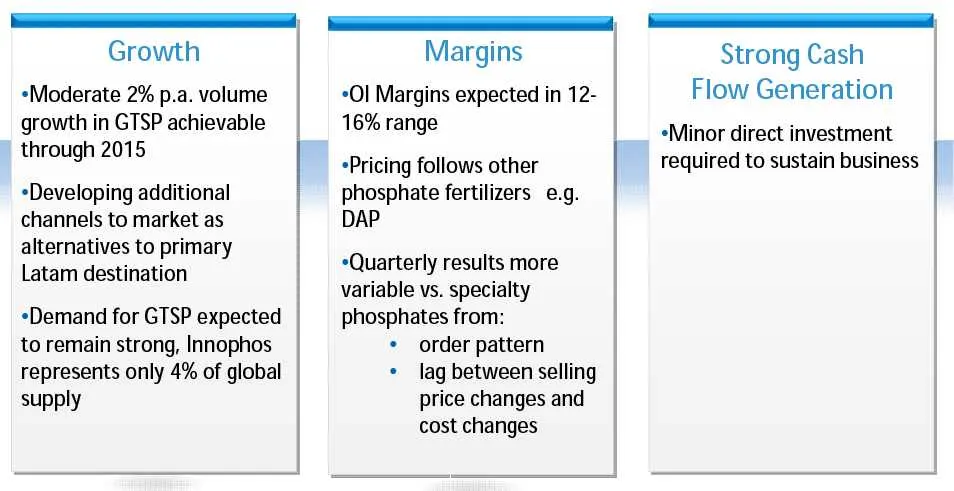
Slide 69: GTSP Growth, Margins and Cash Flow
Growth «Moderate 2% p.a. volume growth in GTSP achievable through 2015 «Developing additional channels to market as alternatives to primary Latam destination «Demand for GTSP expected to remain strong, Innophos represents only 4% of global supply Margins Ol Margins expected in 12- 16% range «Pricing
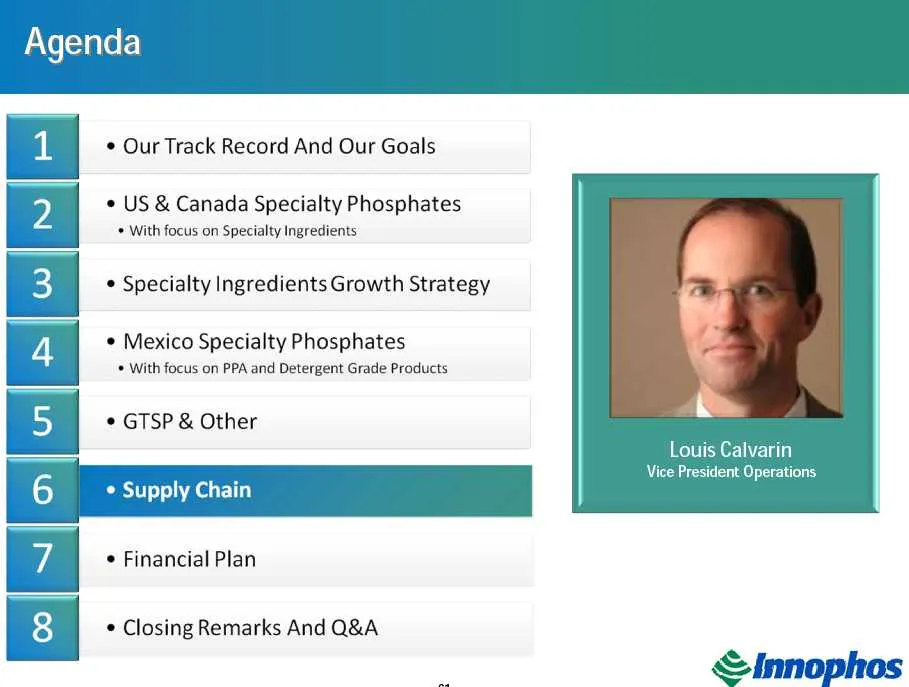
Slide 70: Agenda: Supply Chain
Agenda ¢ Our Track Record And Our Goals * US & Canada Specialty Phosphates * With focus on Specialty Ingredients * Specialty Ingredients Growth Strategy * Mexico Specialty Phosphates * With focus on PPA and Detergent Grade Products © GTSP & Other Louis Calvarin Vice President Operations Supply Chain
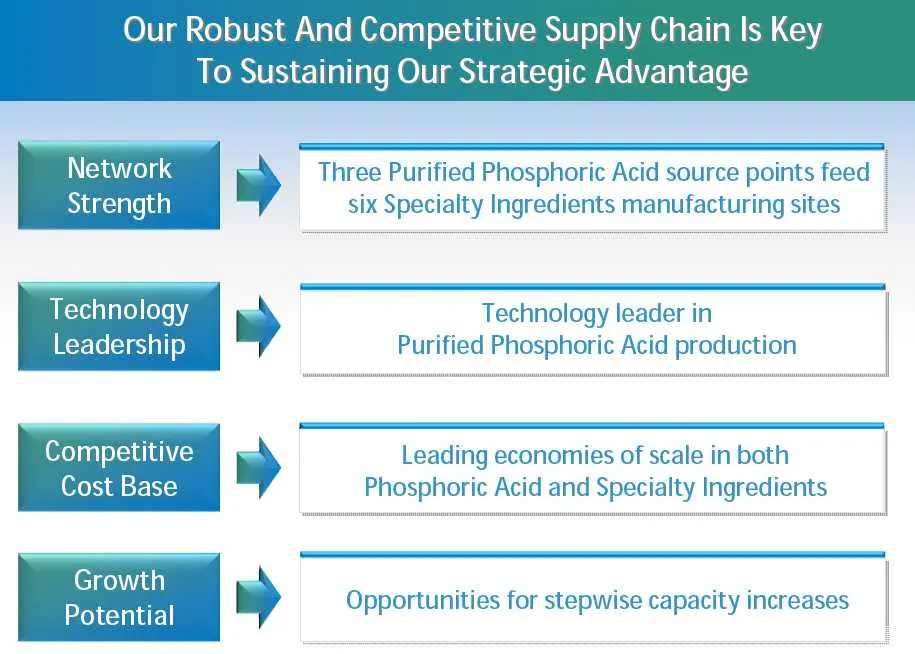
Slide 71: Our Robust And Competitive Supply Chain Is Key
Our Robust And Competitive Supply Chain Is Key To Sustaining Our Strategic Advantage Network bp Three Purified Phosphoric Acid source points feed Strength six Specialty Ingredients manufacturing sites Technology by Technology leader in Leadership Purified Phosphoric Acid production Competitive by Le
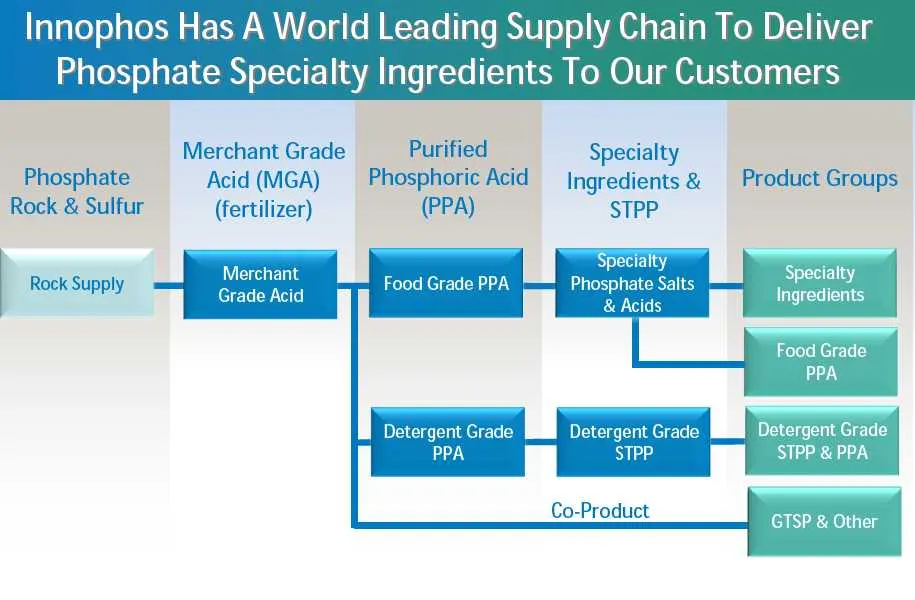
Slide 72: Innophos Has A World Leading Supply Chain
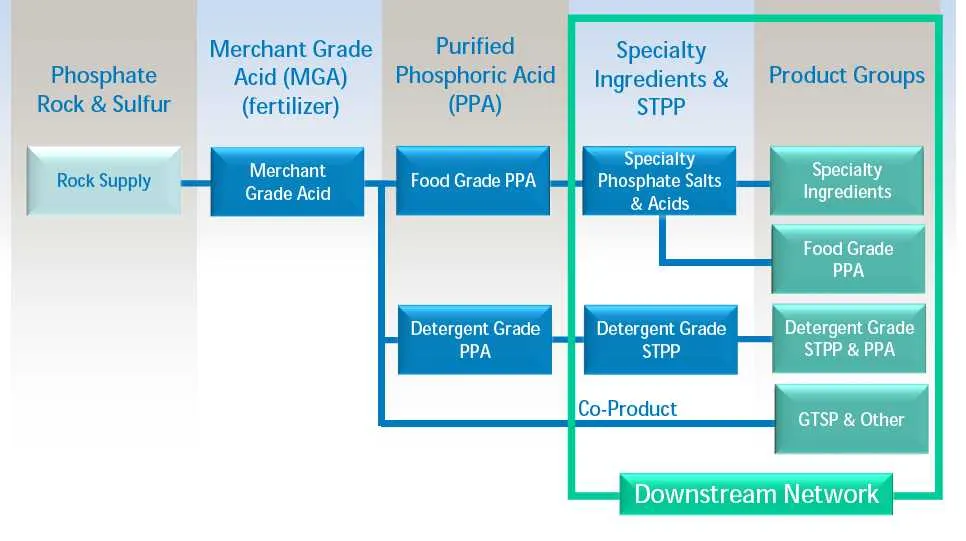
Innophos Has A World Leading Supply Chain To Deliver Phosphate Specialty Ingredients To Our Customers Merchant Grade Purified Specialty _ Phosphate Acid (MGA) Phosphoric Acid Ingredients & | Product Groups Rock & Sulfur (fertilizer) (PPA) STPP pecialty Phosphate Salts & Acids Merchant Grade Acid Roc
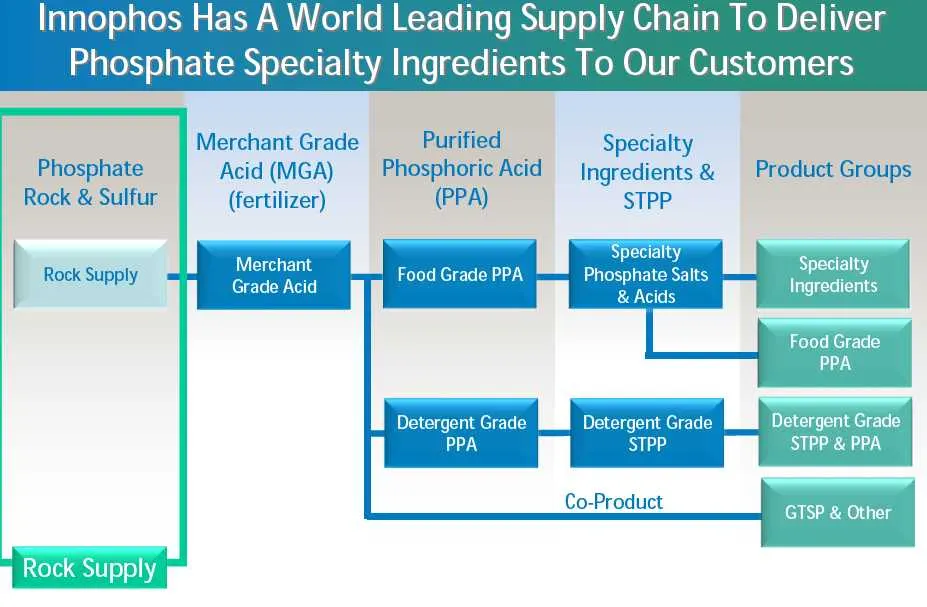
Slide 73: Innophos Has A World Leading Supply Chain
Innophos Has A World Leading Supply Chain To Deliver Phosphate Specialty Ingredients To Our Customers Merchant Grade Purified Specialty Phosphate Acid (MGA) Phosphoric Acid Ingredients & | Product Groups Rock & Sulfur (fertilizer) (PPA) STPP specialty Phosphate Salts & Acids Merchant Grade Acid Rock
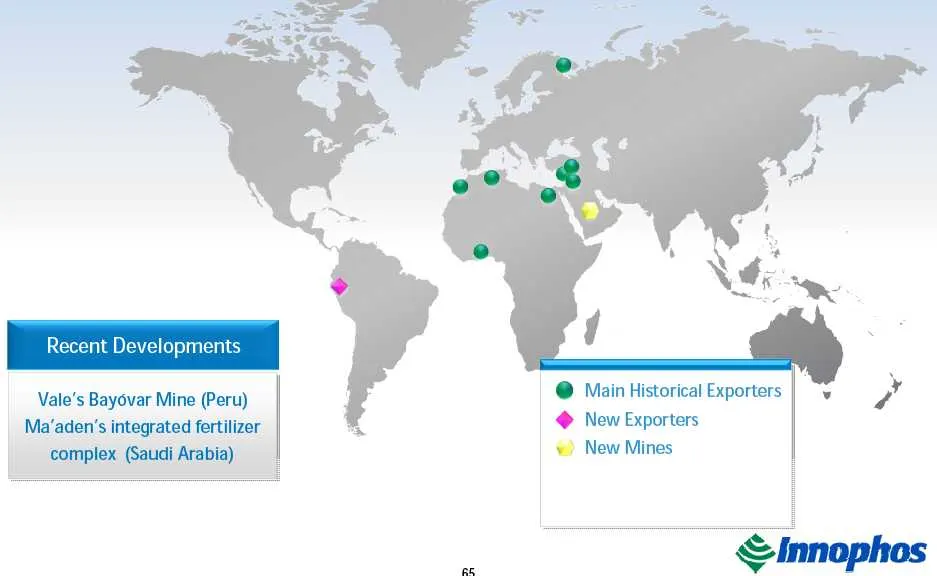
Slide 74: Vale's Bayovar Mine (Peru)
Vale's Bayovar Mine (Peru) Ma‘aden’s integrated fertilizer complex (Saudi Arabia) —_ @ Main Historical Exporters | “yy” New Exporters New Mines
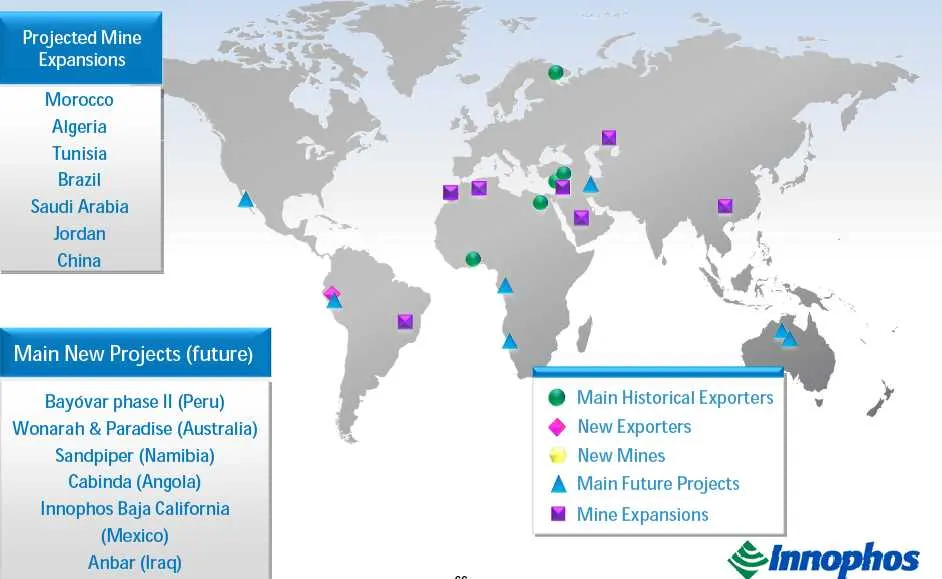
Slide 75: Projected Mine Expansions
Projected Mine E sions expansions ° Morocco | Algeria u Tunisia Brazil Y ue € A Saudi Arabia e w a Jordan China e A a x i 's (future) Bayovar phase II (Peru) @ Main Historical Exporters a ? Wonarah & Paradise (Australia) New Exporters Sandpiper (Namibia) New Mines. Cabinda (Angola) A Main Future Pro
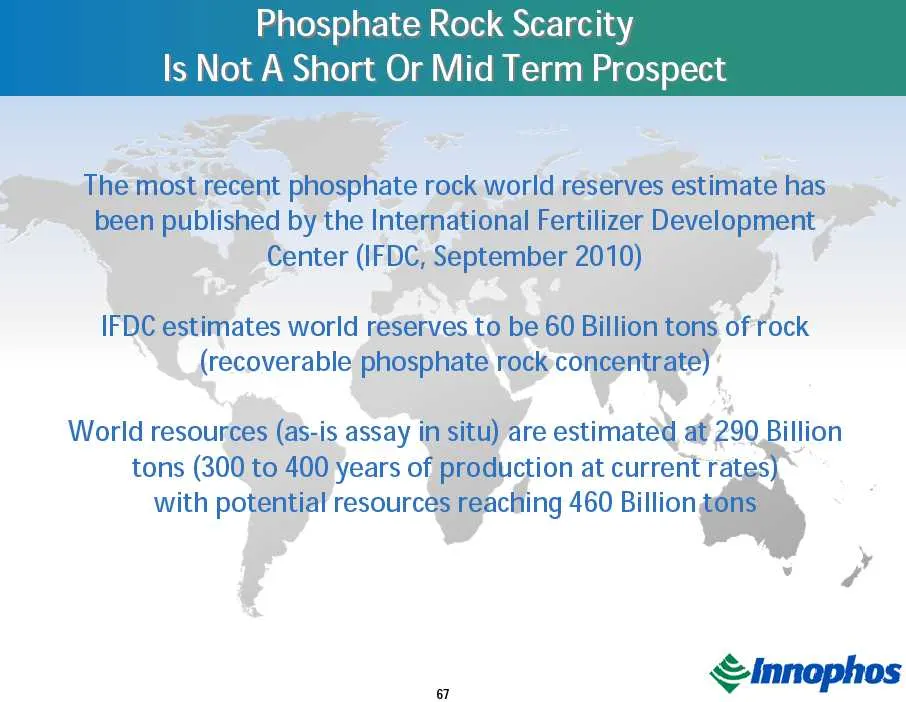
Slide 76: Phosphate Rock Scarcity Is Not A Short Or Mid Term Prospect
Phosphate Rock Scarcity Is Not A Short Or Mid Term Prospect eer rian tt i ee nal Center (IFDC, September 2010) IFDC estimates world reserves to be 60 (recoverable phosphate rock co tons (300: to. 400 years , luction at current rat with potential resources ri ching 460 Billion
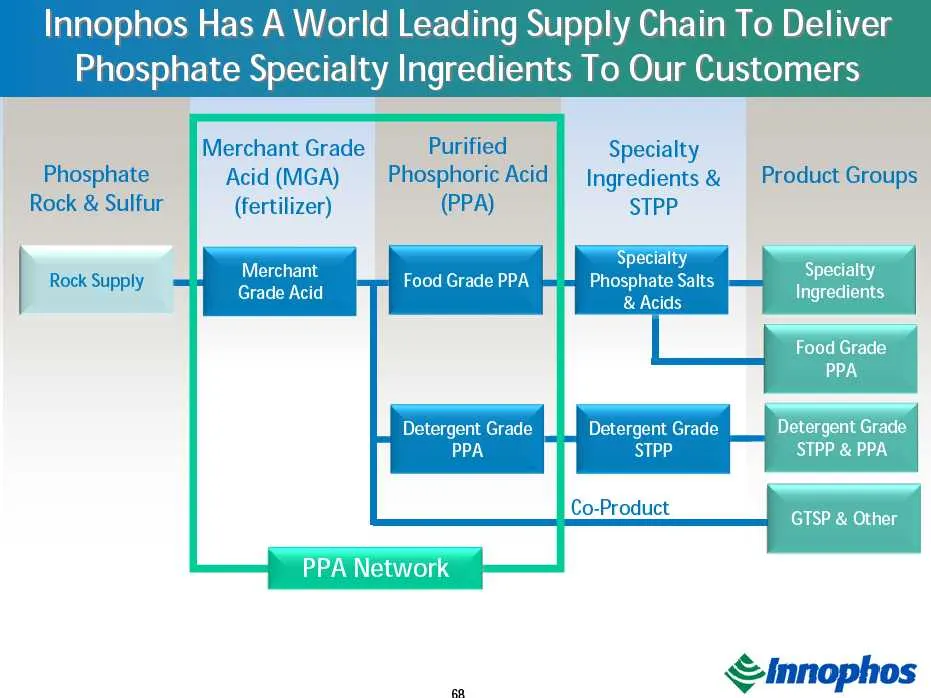
Slide 77: Innophos Has A World Leading Supply Chain
Innophos Has A World Leading Supply Chain To Deliver Phosphate Specialty Ingredients To Our Customers | Merchant Grade ‘Purified Specialty Phosphate Acid (MGA) Phosphoric Acid | ingredients & Product Groups Rock & Sulfur (fertilizer) (PPA) STPP Merchant Grade Acid rae Salts & Acids Rock Supply = Foo
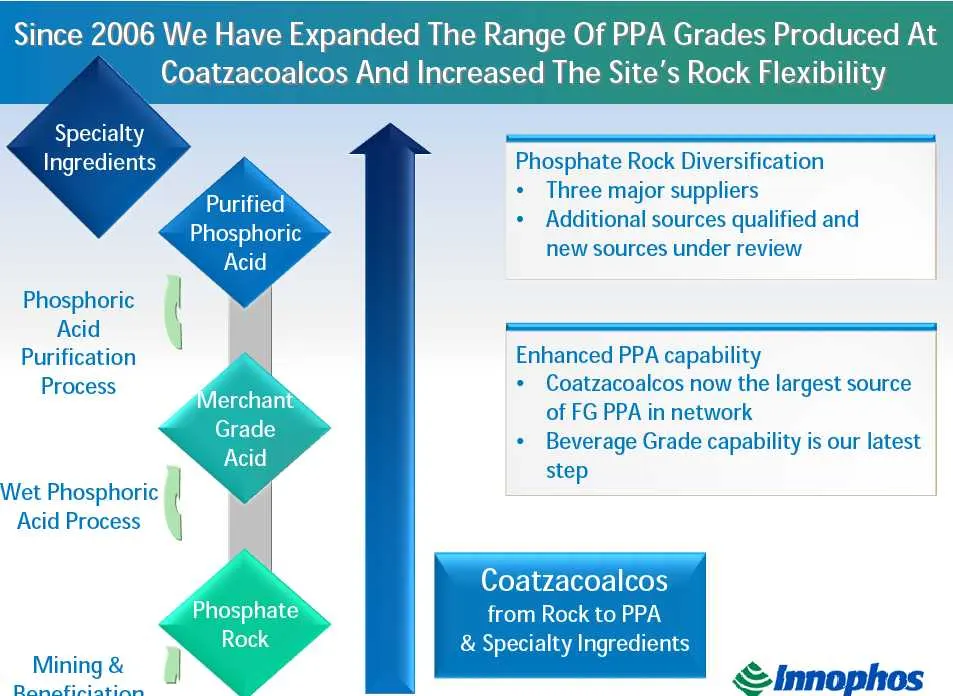
Slide 78: Expanded Range Of PPA Grades Produced At Coatzacoalcos
Since 2006 We Have Expanded The Range Of PPA Grades Produced At Coatzacoalcos And Increased The Site’s Rock Flexibility Specialty Ingredients Phosphate Rock Diversification ey ¢ Three major suppliers Runfiegs * Additional sources qualified and Phosphoric : ‘Acid new sources under review Phosphoric |
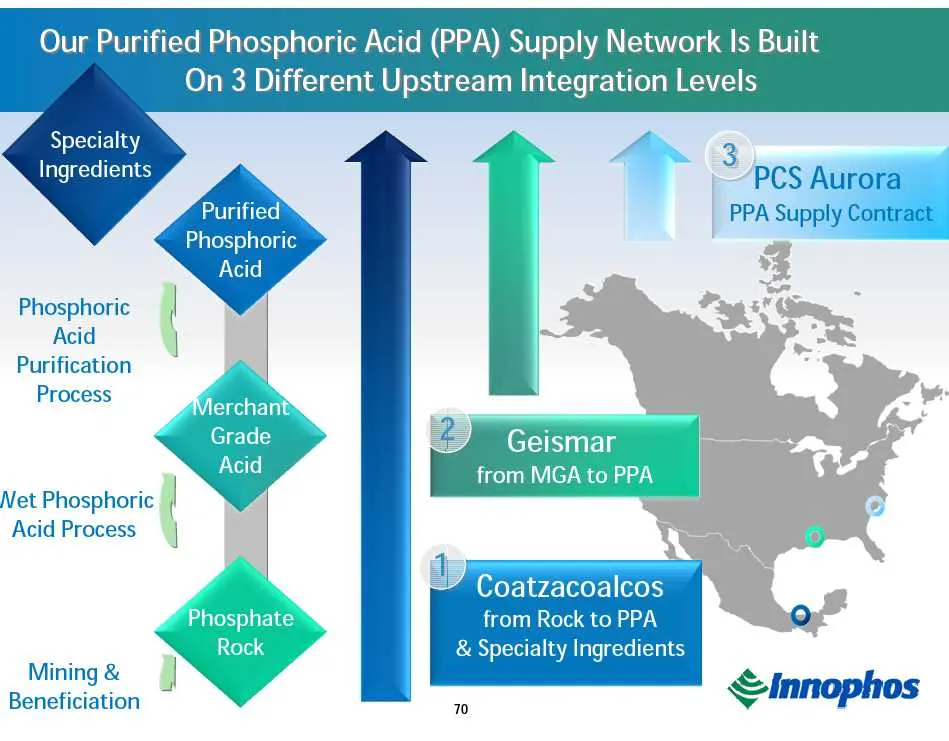
Slide 79: Our PPA Supply Network Is Built On 3 Different Upstream Integration Levels
Our Purified Phosphoric Acid (PPA) Supply Network Is Built On 3 Different Upstream Integration Levels Specialty Ingredients Purified Phosphoric Phosphoric Acid Purification Process Geismar 7 rom MGA to PPA Net Phosphoric || Acid Process = | Coatzacoalcos Phosphate from Rock to PPA Rock & Specialty I
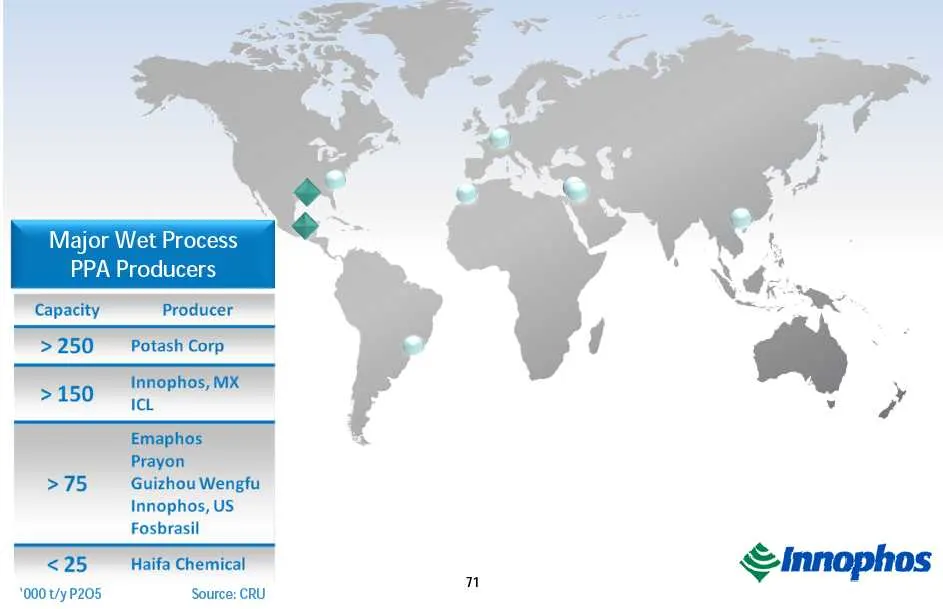
Slide 80: Major Wet Process PPA Producers
Major Wet Process PPA Producers Capacity Producer >250 Potash Corp Innophos, MX >150 ig Emaphos Prayon >75 Guizhou Wengfu Innophos, US Fosbrasil <25 Haifa Chemical '000 t/y P205 Source: CRU n
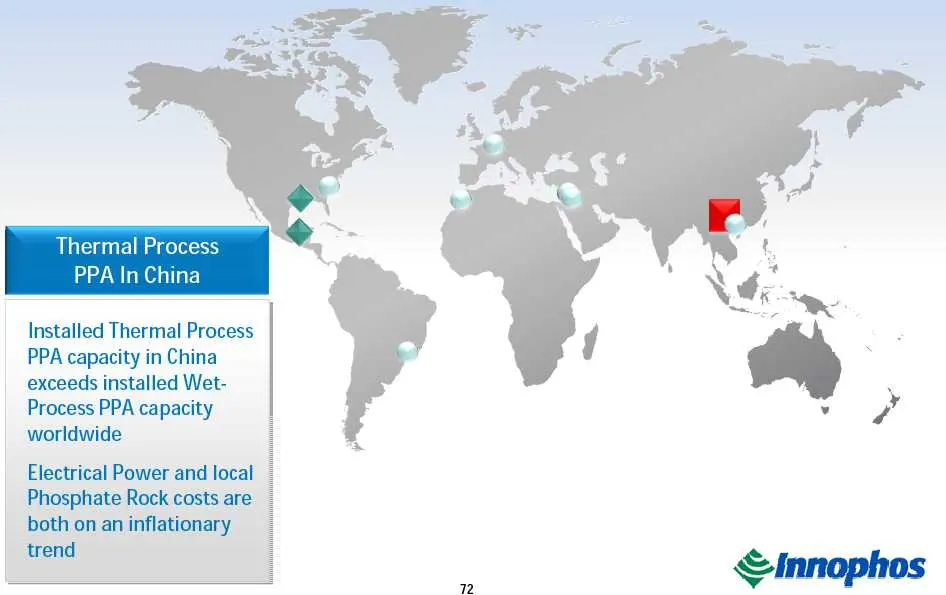
Slide 81
Slide 82
Slide 83
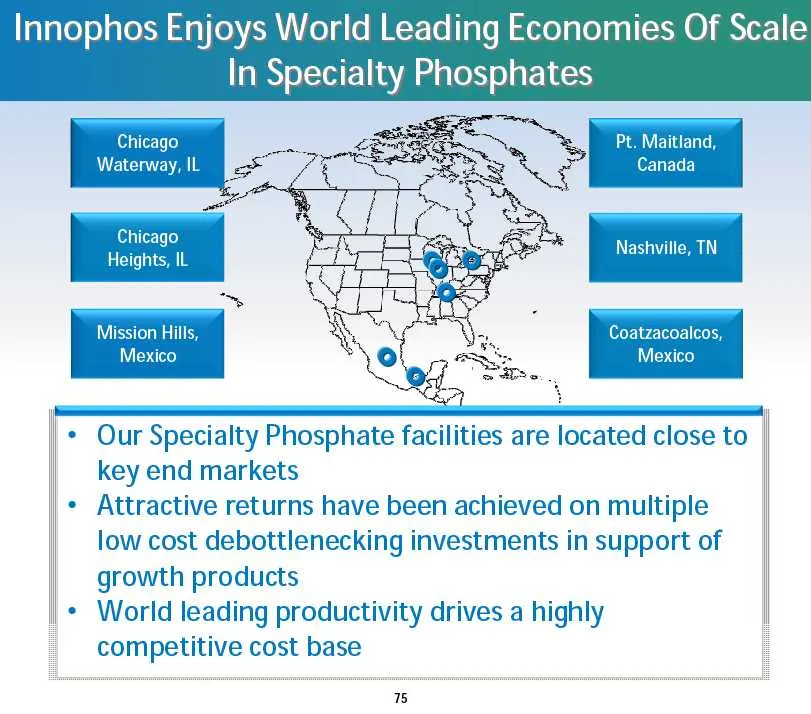
Slide 84
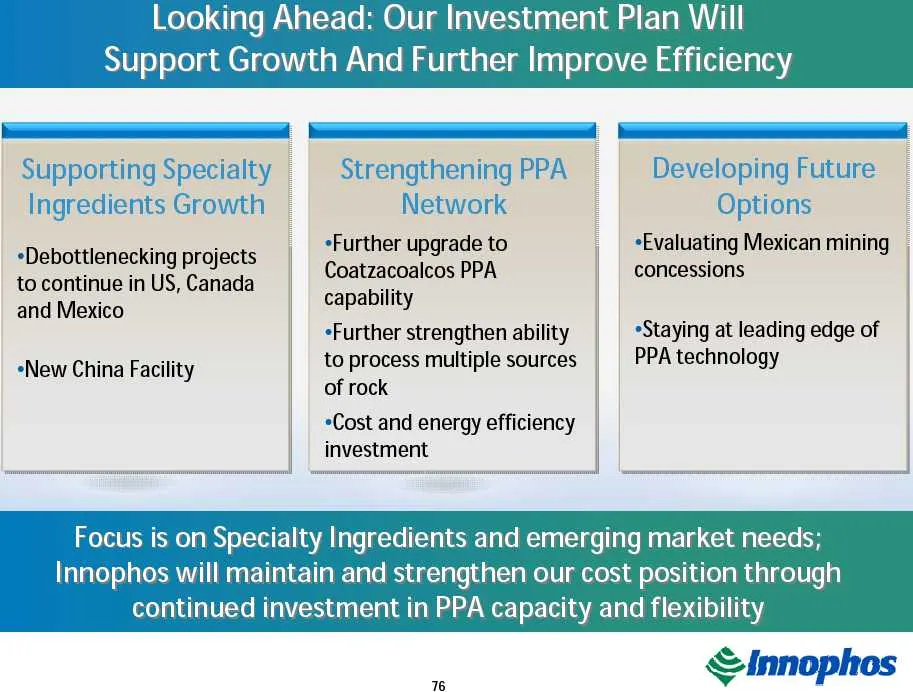
Slide 85
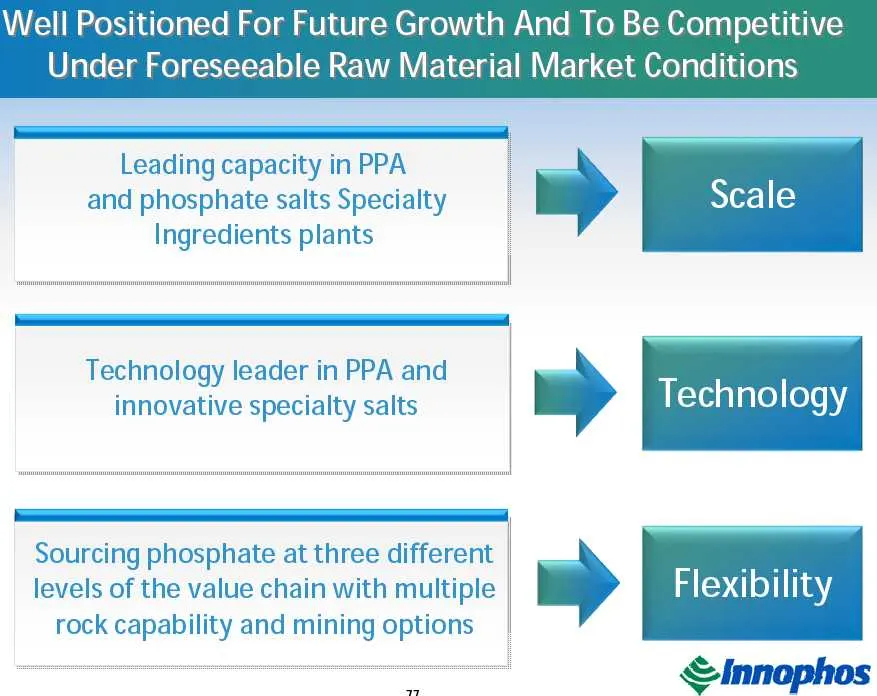
Slide 86
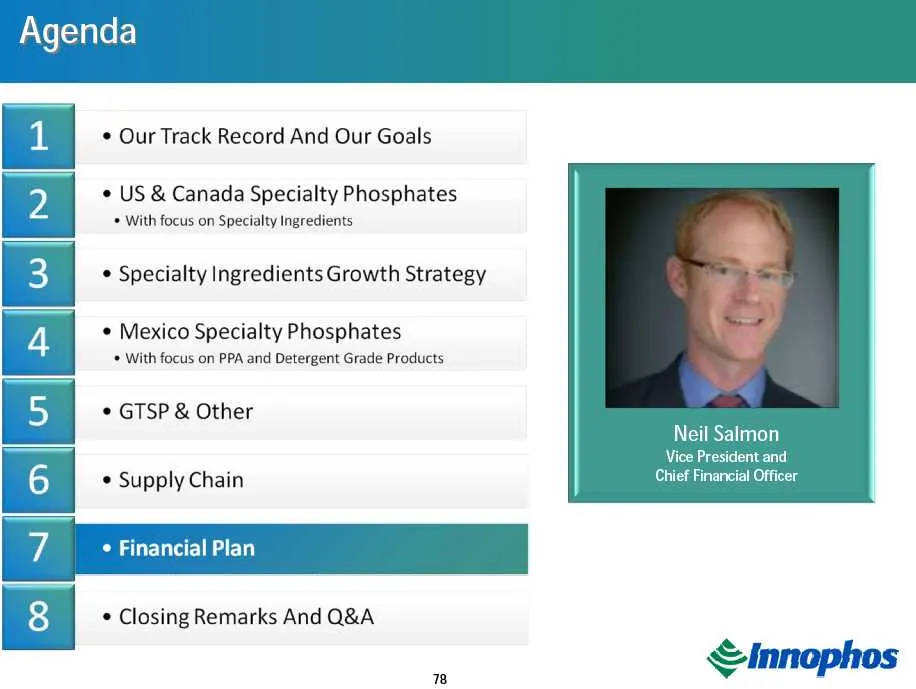
Slide 87
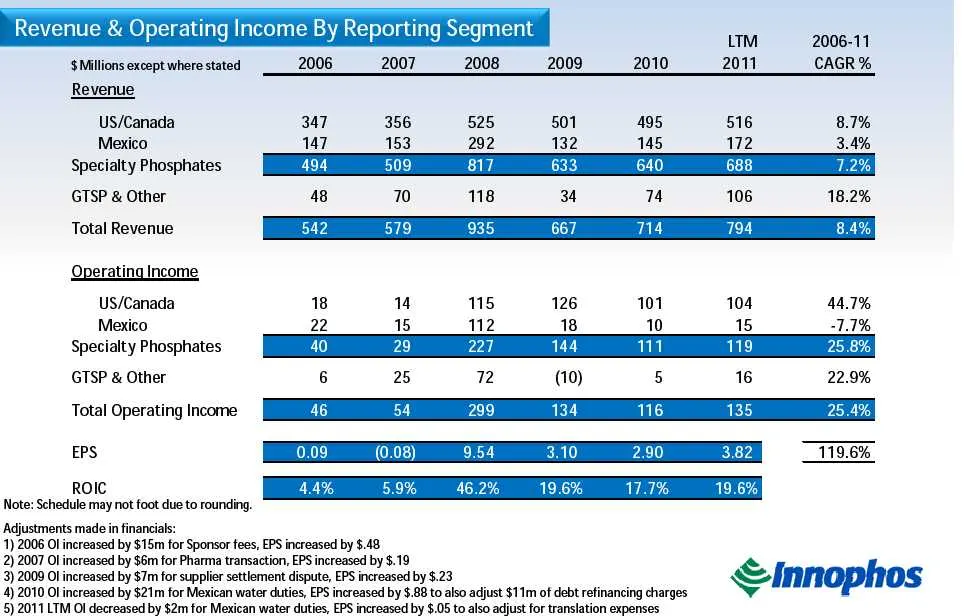
Slide 88
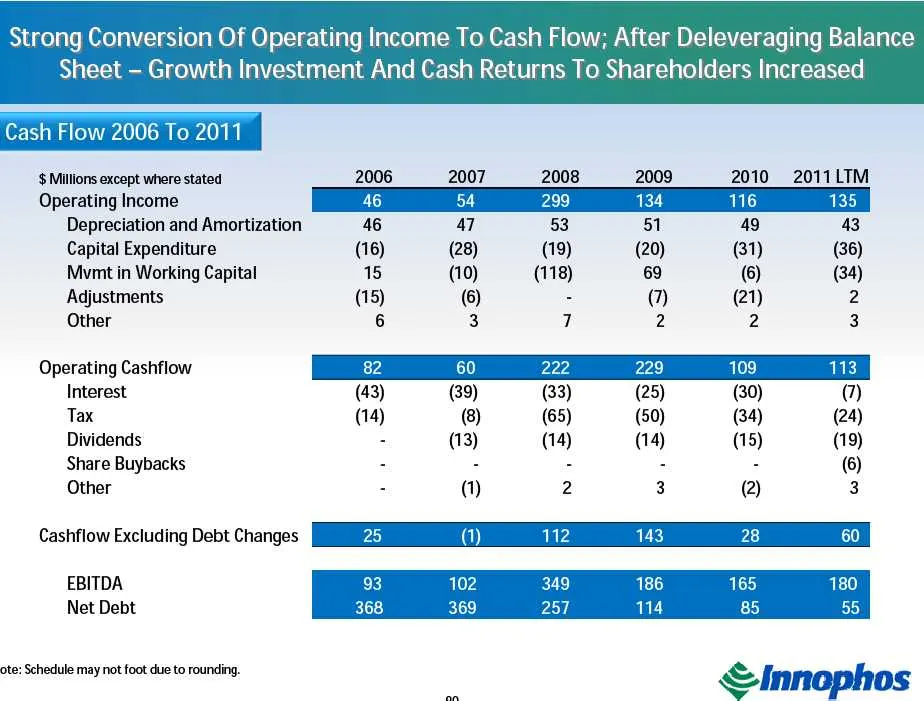
Slide 89
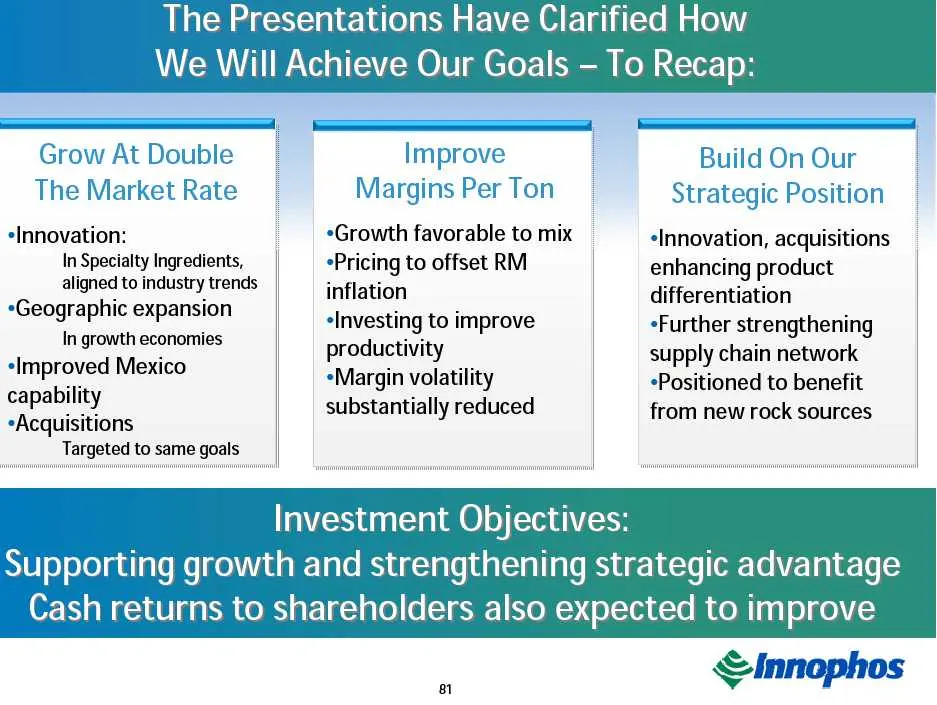
Slide 90
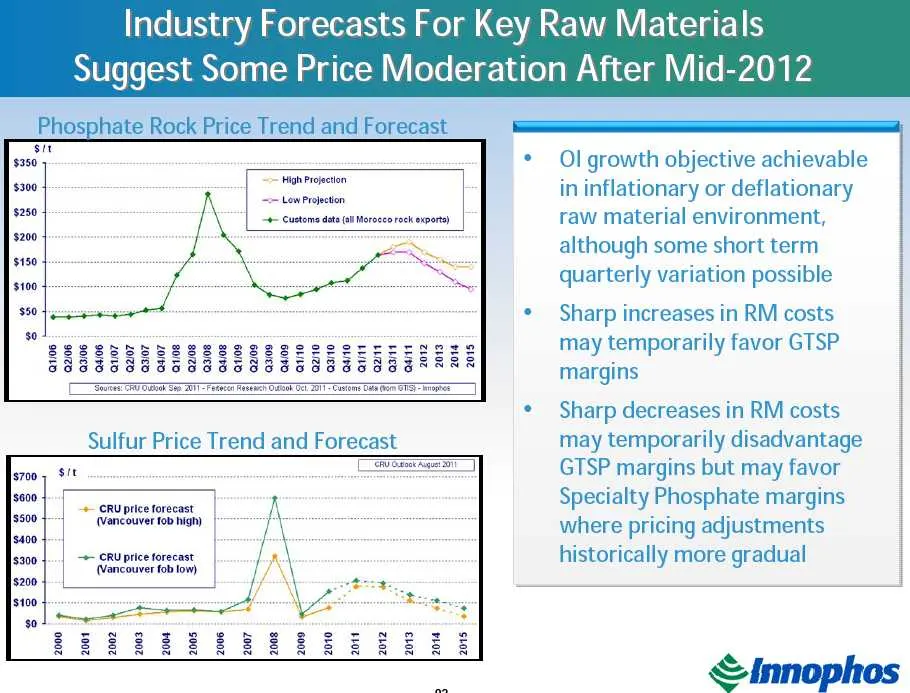
Slide 91
Slide 92
Slide 93
Slide 94
Slide 95
Slide 96
Source: SEC EDGAR · 8-K filed Nov 8, 2011
More decks from Innophos Holdings Inc
 Merger or Acquisition (August 2017)22 slides · Aug 1, 2017
 Investor Day (April 2017)105 slides · Apr 5, 2017
 Seventeenth Annual Institutional Investor Forum (March 2013)18 slides · Mar 18, 2013
 CJS Securities 12th Annual New Ideas For The New Year Conference (January 2012)18 slides · Jan 11, 2012
 Annual Industrials Conference 201122 slides · Sep 26, 2011
 March Industrial Investor Conferences 201019 slides · Mar 23, 2010