HMS — William Blair 2015 Growth Stock Conference
36 slides from HMS's conference presentation, Jun 9, 2015
Slide 1: William Blair 2015 Growth Stock Conference
William Blair 2015 Growth Stock Conference Bill Lucia, Chief Executive Officer June 10, 2015
Slide 2: Safe Harbor Statement
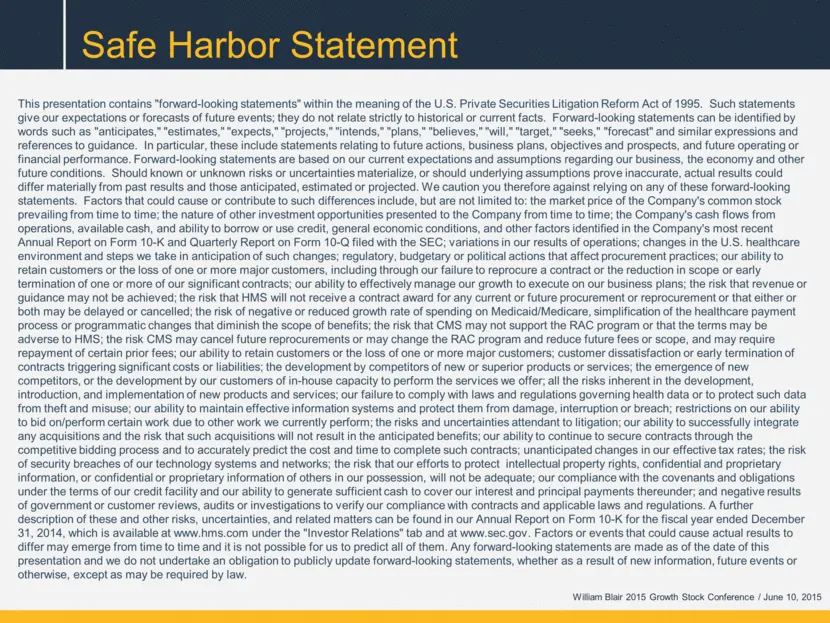
Safe Harbor Statement This presentation contains "forward-looking statements" within the meaning of the U.S. Private Securities Litigation Reform Act of 1995. Such statements give our expectations or forecasts of future events; they do not relate strictly to historical or current facts. Forward-look
Slide 3: Presentation Outline
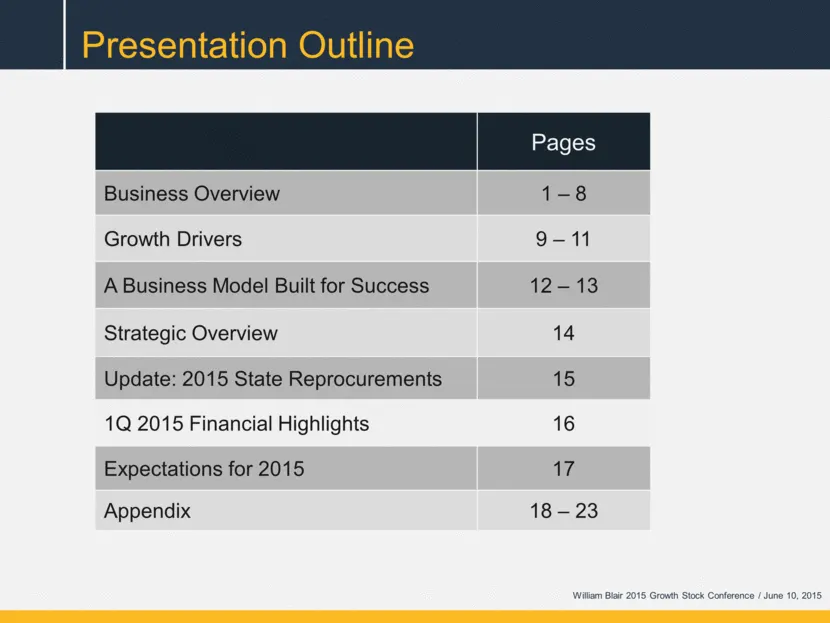
Presentation Outline Pages Business Overview 1 – 8 Growth Drivers 9 – 11 A Business Model Built for Success 12 – 13 Strategic Overview 14 Update: 2015 State Reprocurements 15 1Q 2015 Financial Highlights 16 Expectations for 2015 17 Appendix 18 – 23 William Blair 2015 Growth Stock Conference / June 1

Slide 4: Business Overview
Business Overview
Slide 5: Business Overview
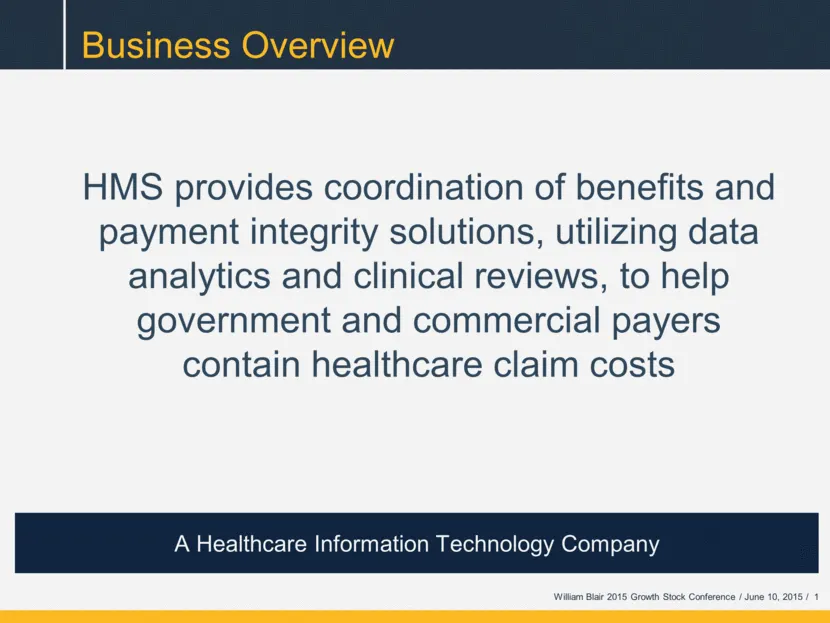
Business Overview HMS provides coordination of benefits and payment integrity solutions, utilizing data analytics and clinical reviews, to help government and commercial payers contain healthcare claim costs A Healthcare Information Technology Company William Blair 2015 Growth Stock Conference / Jun
Slide 6: Claims Payment Accuracy for Our Clients
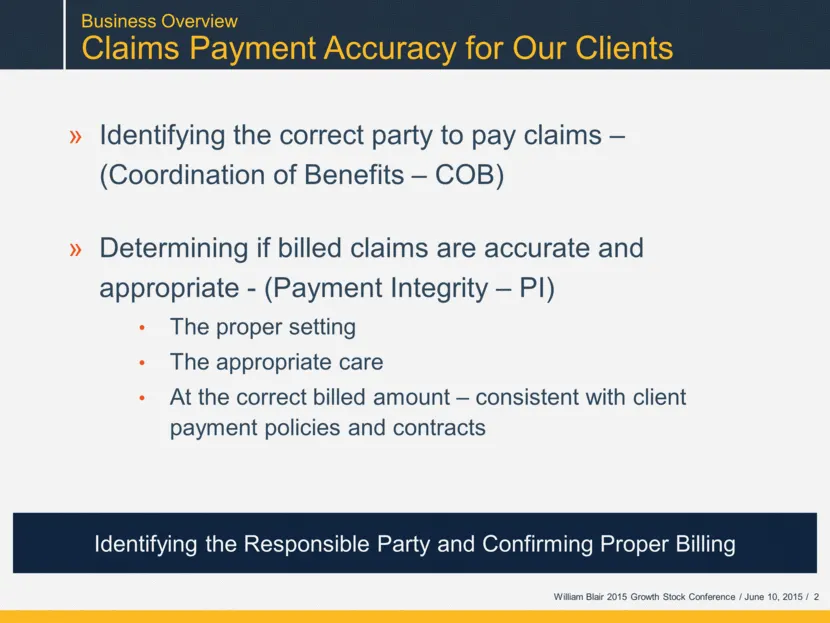
Business Overview Claims Payment Accuracy for Our Clients Identifying the correct party to pay claims – (Coordination of Benefits – COB) Determining if billed claims are accurate and appropriate - (Payment Integrity – PI) The proper setting The appropriate care At the correct billed amount – consist
Slide 7: Large Installed Client Base
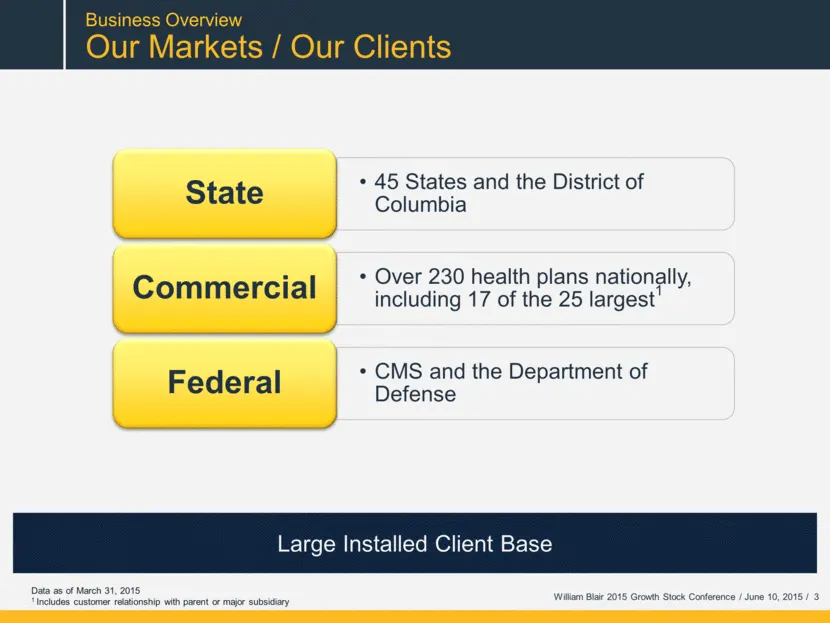
Large Installed Client Base Business Overview Our Markets / Our Clients Data as of March 31, 2015 1 Includes customer relationship with parent or major subsidiary William Blair 2015 Growth Stock Conference / June 10, 2015 / 3 45 States and the District of Columbia State Over 230 health plans nationa
Slide 8: We Serve Large and Growing Populations
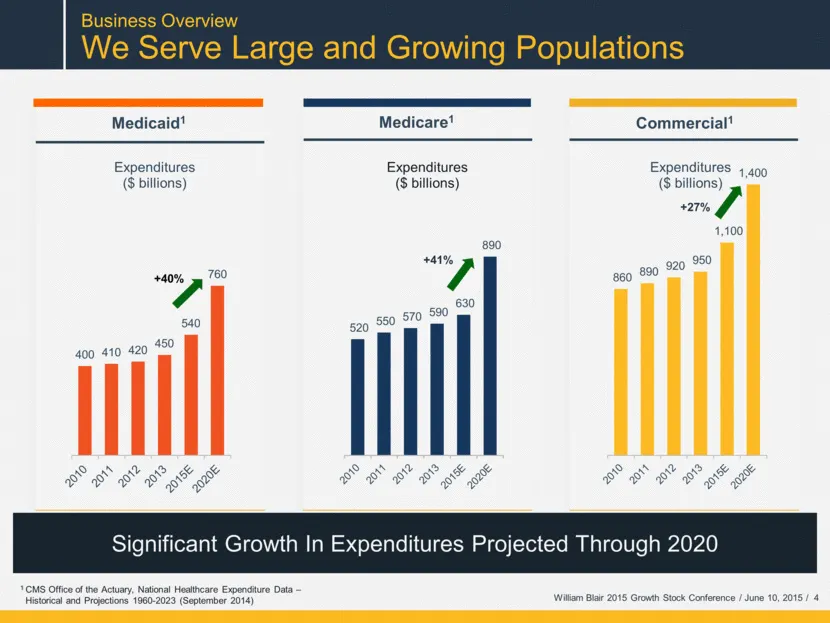
Medicaid1 1 CMS Office of the Actuary, National Healthcare Expenditure Data – Historical and Projections 1960-2023 (September 2014) Significant Growth In Expenditures Projected Through 2020 Business Overview We Serve Large and Growing Populations Medicare1 Commercial1 William Blair 2015 Growth Stock
Slide 9: Our Products: Coordination of Benefits
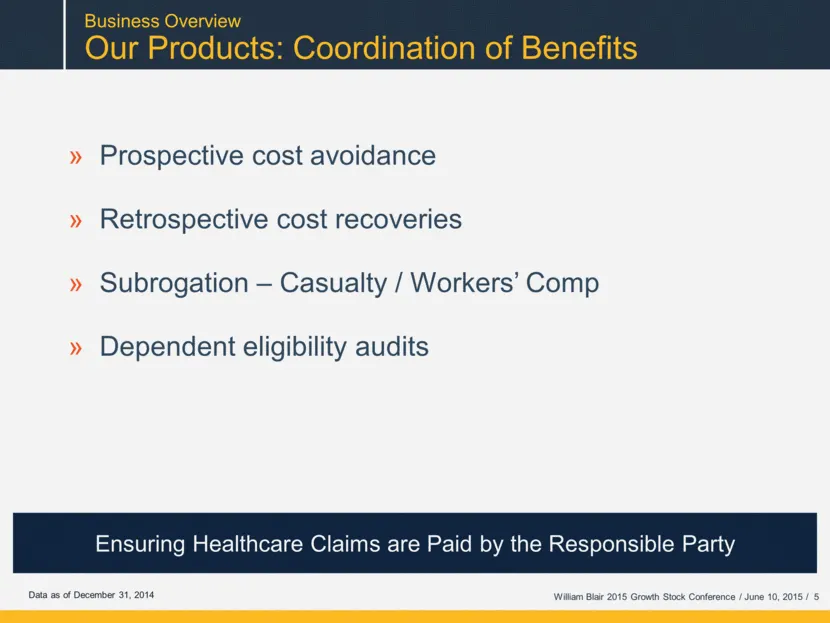
Business Overview Our Products: Coordination of Benefits Prospective cost avoidance Retrospective cost recoveries Subrogation – Casualty / Workers’ Comp Dependent eligibility audits Ensuring Healthcare Claims are Paid by the Responsible Party Data as of December 31, 2014 William Blair 2015 Growth St
Slide 10: Our Products: Payment Integrity
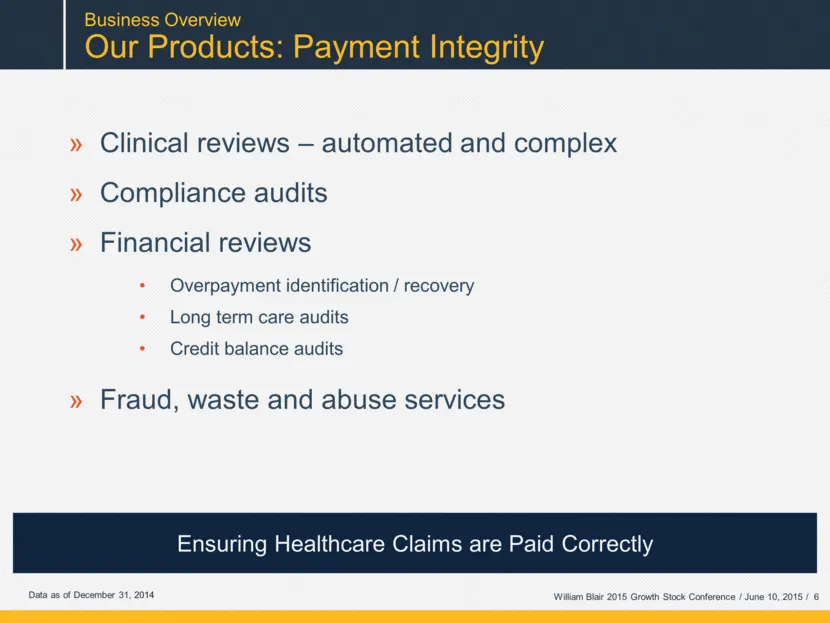
Business Overview Our Products: Payment Integrity Clinical reviews – automated and complex Compliance audits Financial reviews Overpayment identification / recovery Long term care audits Credit balance audits Fraud, waste and abuse services Ensuring Healthcare Claims are Paid Correctly Data as of De
Slide 11: Prepay Clinical Reviews
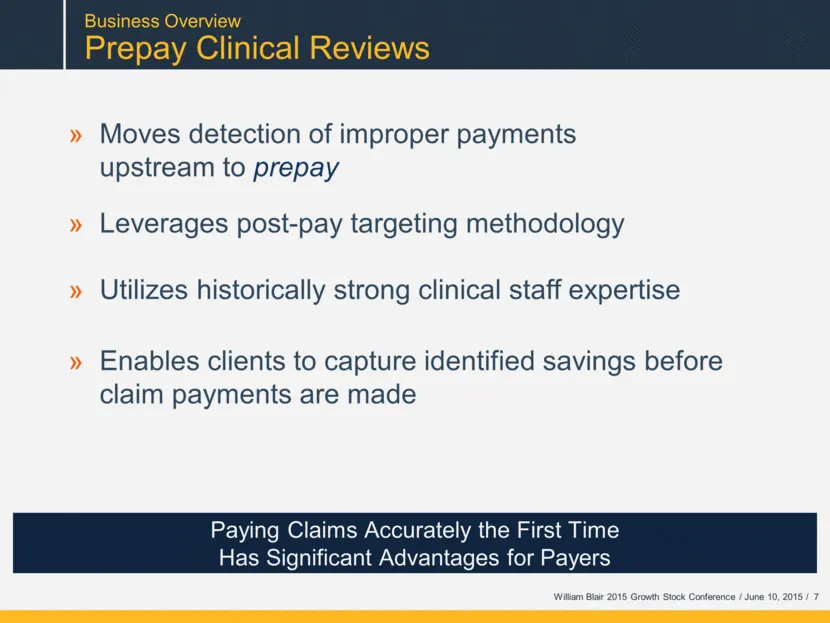
Business Overview Prepay Clinical Reviews Moves detection of improper payments upstream to prepay Leverages post-pay targeting methodology Utilizes historically strong clinical staff expertise Enables clients to capture identified savings before claim payments are made Paying Claims Accurately the F
Slide 12: Our Competitive Strengths
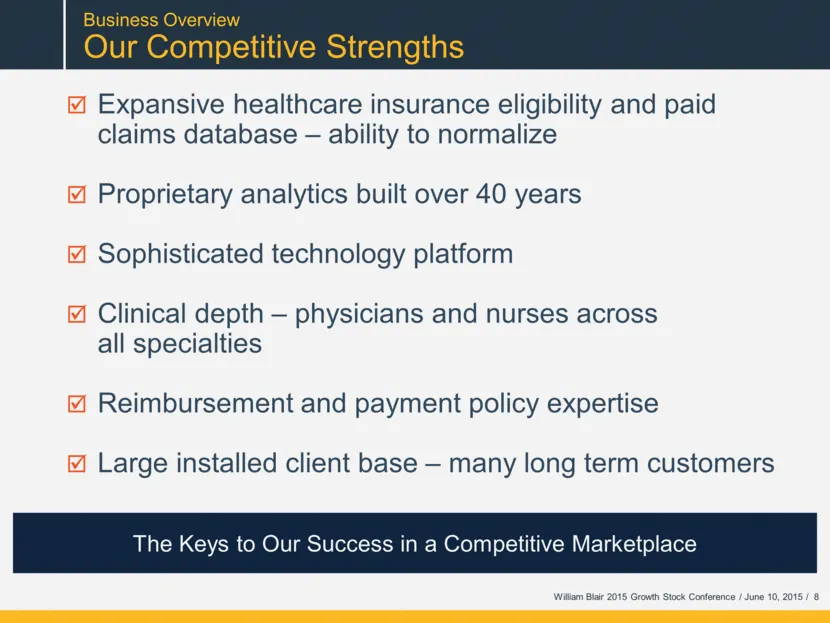
Business Overview Our Competitive Strengths Expansive healthcare insurance eligibility and paid claims database – ability to normalize Proprietary analytics built over 40 years Sophisticated technology platform Clinical depth – physicians and nurses across all specialties Reimbursement and payment p

Slide 13: Growth Drivers
Growth Drivers
Slide 14: The Addressable Error Opportunity
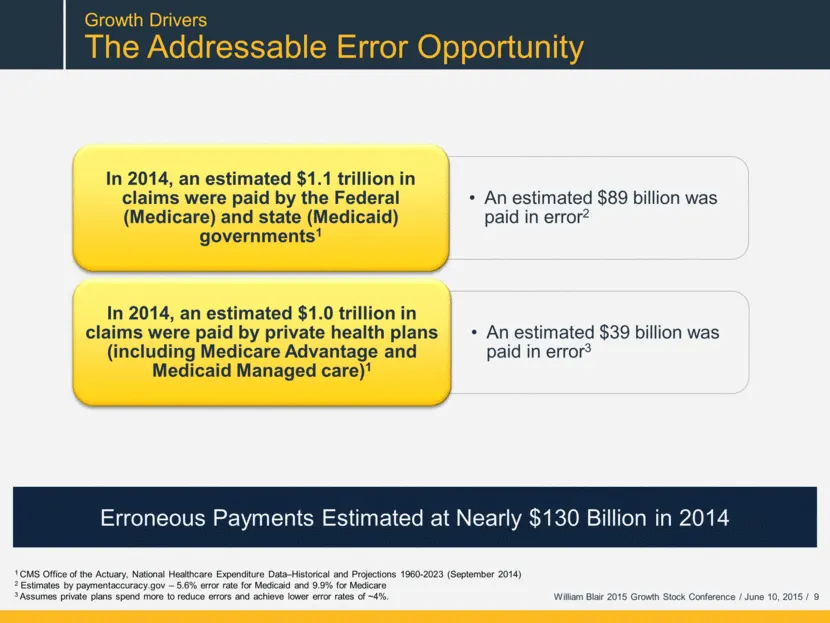
Erroneous Payments Estimated at Nearly $130 Billion in 2014 1 CMS Office of the Actuary, National Healthcare Expenditure Data–Historical and Projections 1960-2023 (September 2014) 2 Estimates by paymentaccuracy.gov – 5.6% error rate for Medicaid and 9.9% for Medicare 3 Assumes private plans spend mo
Slide 15: What is Fueling Our Growth?
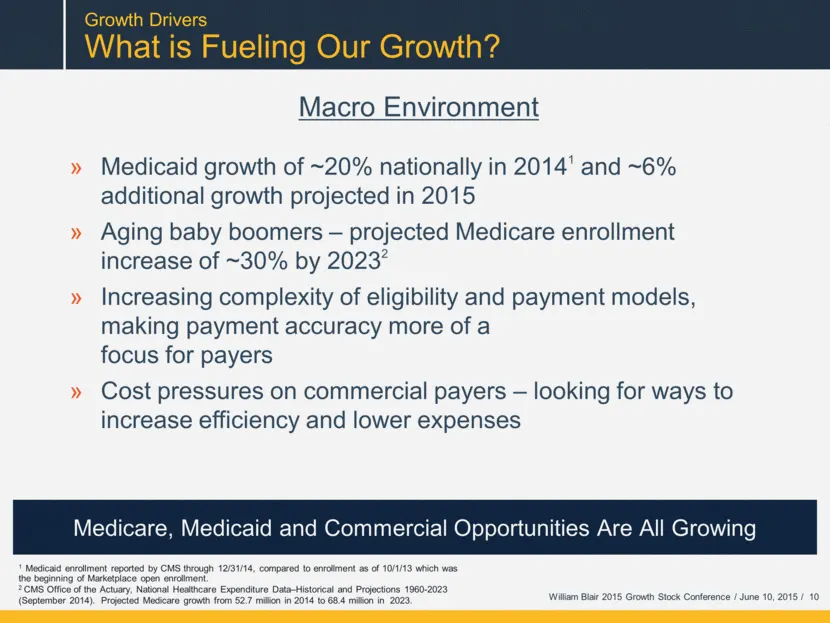
Growth Drivers What is Fueling Our Growth? Macro Environment Medicaid growth of ~20% nationally in 20141 and ~6% additional growth projected in 2015 Aging baby boomers – projected Medicare enrollment increase of ~30% by 20232 Increasing complexity of eligibility and payment models, making payment ac
Slide 16: What is Fueling Current Growth?
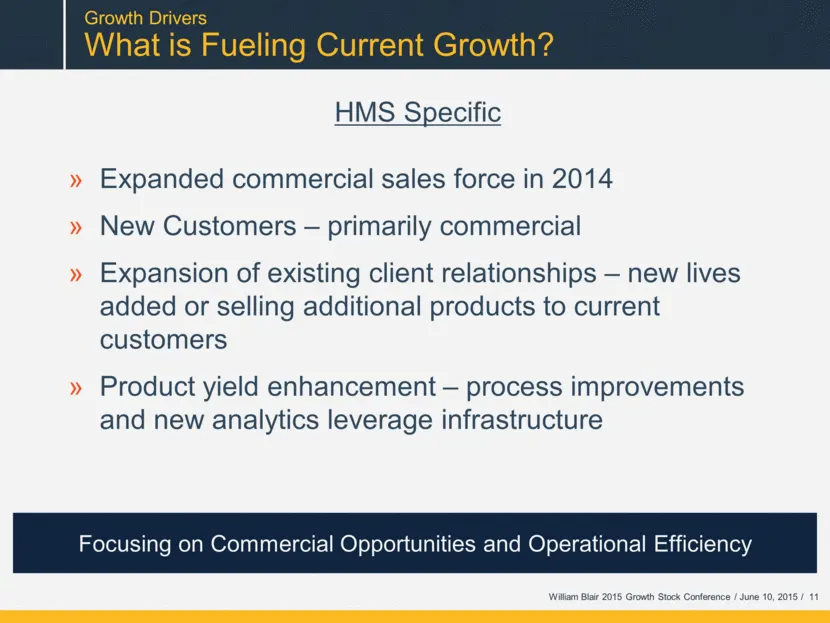
HMS Specific Expanded commercial sales force in 2014 New Customers – primarily commercial Expansion of existing client relationships – new lives added or selling additional products to current customers Product yield enhancement – process improvements and new analytics leverage infrastructure Focusi
Slide 17: A Business Model Built for Success
A Business Model Built for Success
Slide 18: What Makes The HMS Business Model Successful?
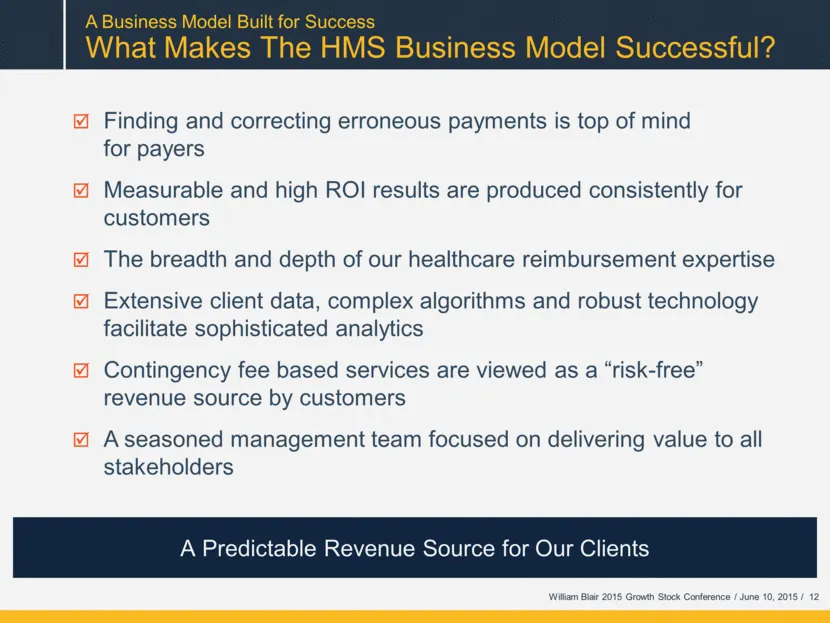
A Business Model Built for Success What Makes The HMS Business Model Successful? Finding and correcting erroneous payments is top of mind for payers Measurable and high ROI results are produced consistently for customers The breadth and depth of our healthcare reimbursement expertise Extensive clien
Slide 19: Our Value Proposition – High ROI for Clients
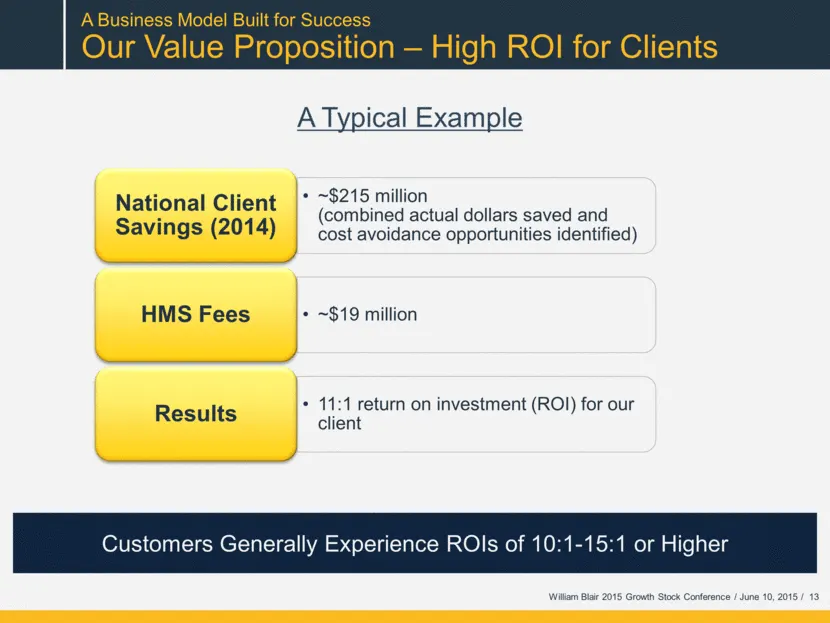
A Business Model Built for Success Our Value Proposition – High ROI for Clients A Typical Example Customers Generally Experience ROIs of 10:1-15:1 or Higher William Blair 2015 Growth Stock Conference / June 10, 2015 / 13 ~$215 million (combined actual dollars saved and cost avoidance opportunities i

Slide 20: Strategic Overview
Strategic Overview
Slide 21: Focusing on the Commercial Opportunity/Operational Efficiency
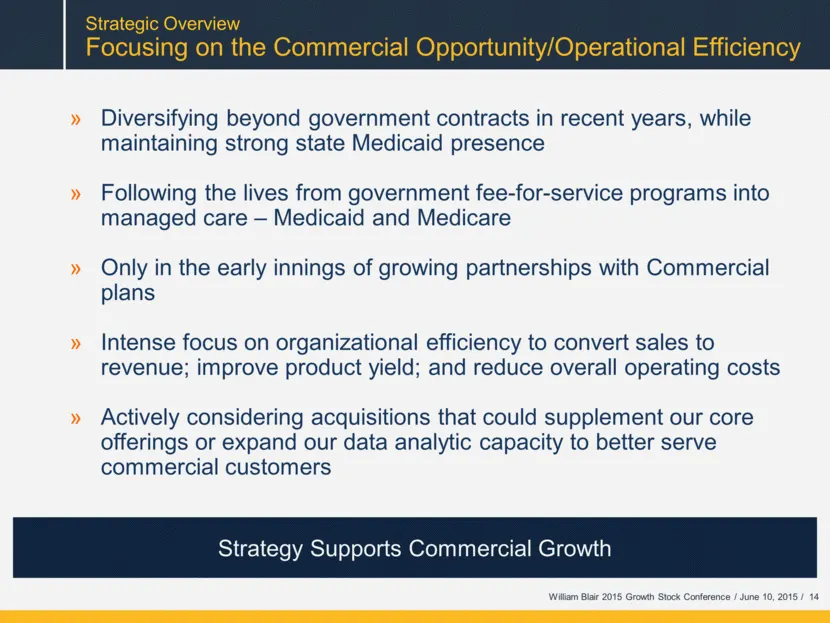
Strategic Overview Focusing on the Commercial Opportunity/Operational Efficiency Diversifying beyond government contracts in recent years, while maintaining strong state Medicaid presence Following the lives from government fee-for-service programs into managed care – Medicaid and Medicare Only in t
Slide 22: Update: 2015 State Reprocurements
Update: 2015 State Reprocurements
Slide 23: Update: 2015 State Reprocurements
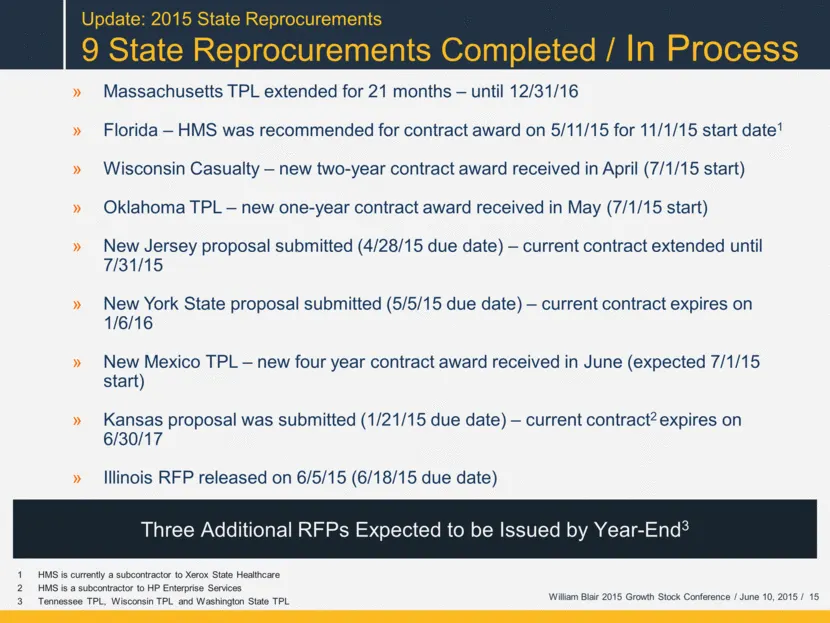
Massachusetts TPL extended for 21 months – until 12/31/16 Florida – HMS was recommended for contract award on 5/11/15 for 11/1/15 start date1 Wisconsin Casualty – new two-year contract award received in April (7/1/15 start) Oklahoma TPL – new one-year contract award received in May (7/1/15 start) Ne

Slide 24: 1Q 2015 Financial Highlights
1Q 2015 Financial Highlights
Slide 25: First Quarter 2015 Financial Performance
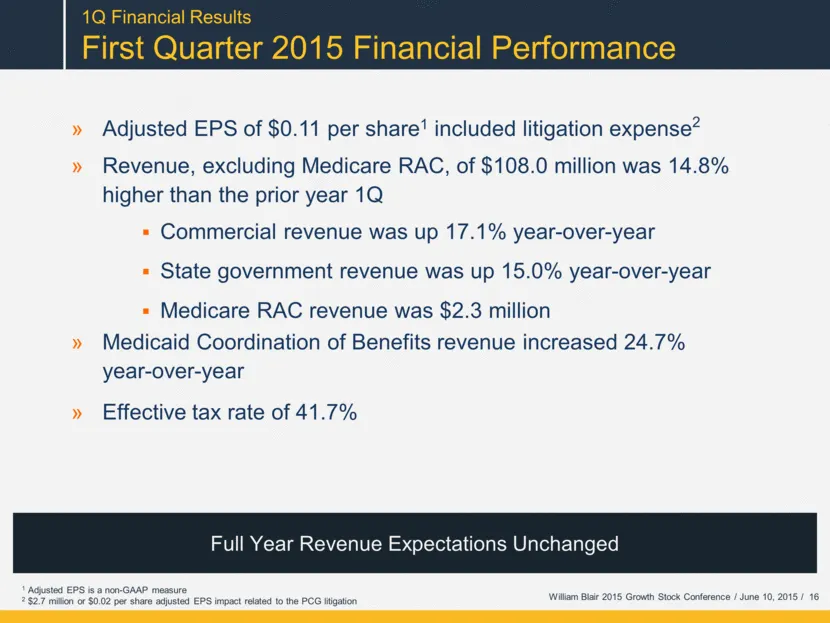
Adjusted EPS of $0.11 per share1 included litigation expense2 Revenue, excluding Medicare RAC, of $108.0 million was 14.8% higher than the prior year 1Q Commercial revenue was up 17.1% year-over-year State government revenue was up 15.0% year-over-year Medicare RAC revenue was $2.3 million Medicaid

Slide 26: Expectations for 2015
Expectations for 2015
Slide 27: Revenue Growth and Focus on Cost Savings
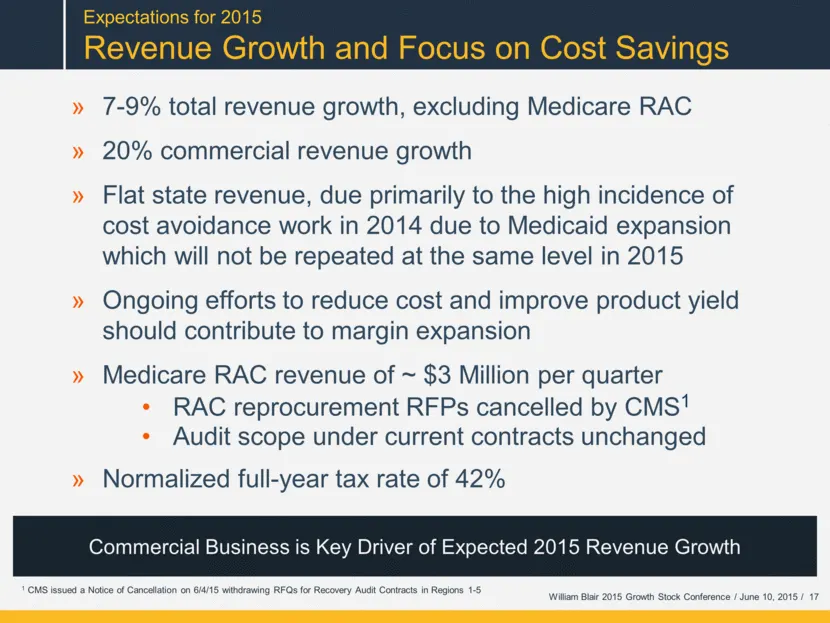
Expectations for 2015 Revenue Growth and Focus on Cost Savings 7-9% total revenue growth, excluding Medicare RAC 20% commercial revenue growth Flat state revenue, due primarily to the high incidence of cost avoidance work in 2014 due to Medicaid expansion which will not be repeated at the same level
Slide 28: Summing Up
Summing Up William Blair 2015 Growth Stock Conference / June 10, 2015
Slide 29: Appendix
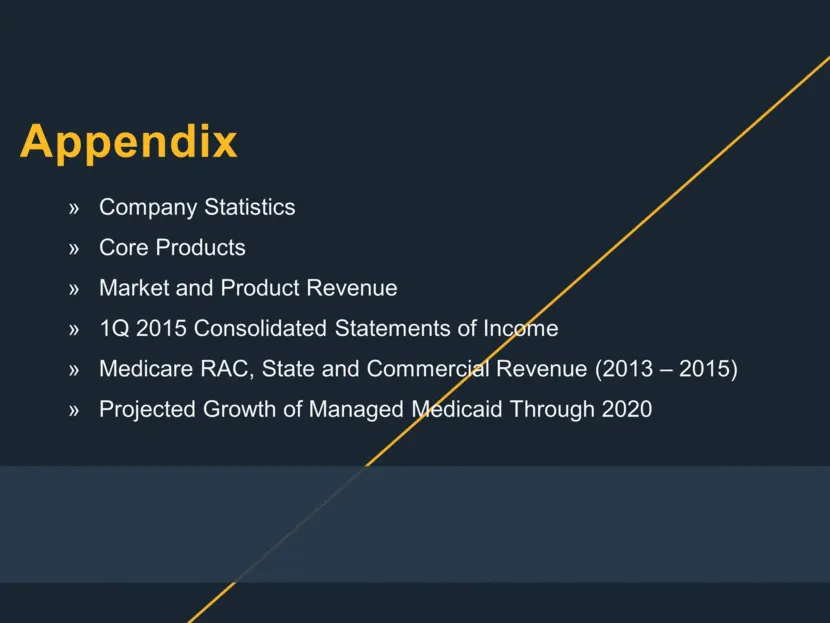
Appendix Company Statistics Core Products Market and Product Revenue 1Q 2015 Consolidated Statements of Income Medicare RAC, State and Commercial Revenue (2013 – 2015) Projected Growth of Managed Medicaid Through 2020
Slide 30: Company Statistics
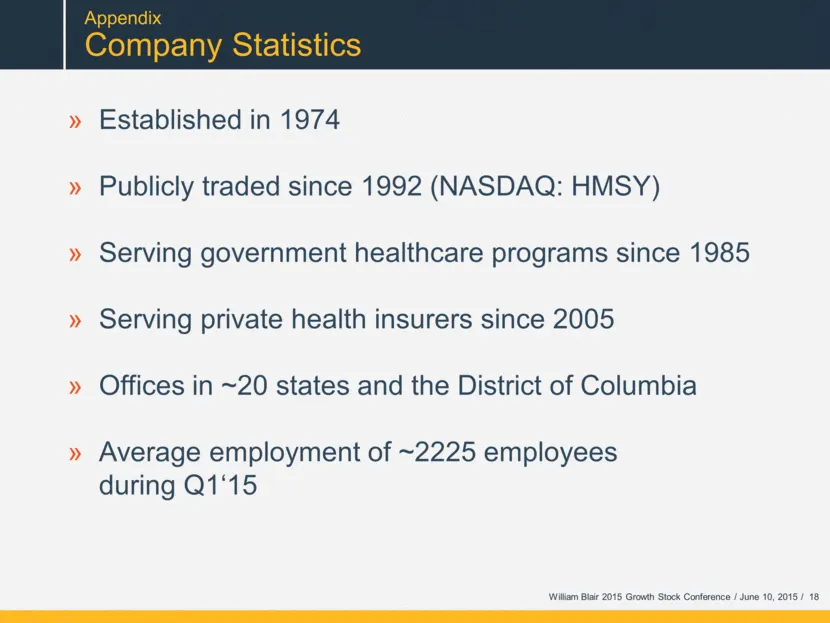
Appendix Company Statistics Established in 1974 Publicly traded since 1992 (NASDAQ: HMSY) Serving government healthcare programs since 1985 Serving private health insurers since 2005 Offices in ~20 states and the District of Columbia Average employment of ~2225 employees during Q1‘15 William Blair 2
Slide 31: Core Product Suite: Driving Payment Accuracy
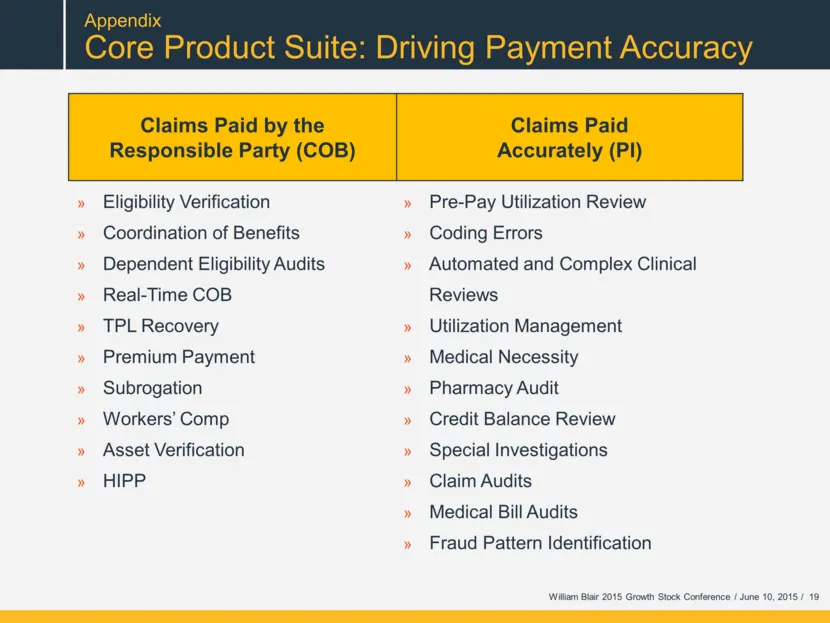
Claims Paid by the Responsible Party (COB) Claims Paid Accurately (PI) Appendix Core Product Suite: Driving Payment Accuracy Eligibility Verification Coordination of Benefits Dependent Eligibility Audits Real-Time COB TPL Recovery Premium Payment Subrogation Workers’ Comp Asset Verification HIPP Pre
Slide 32: Market and Product Revenue
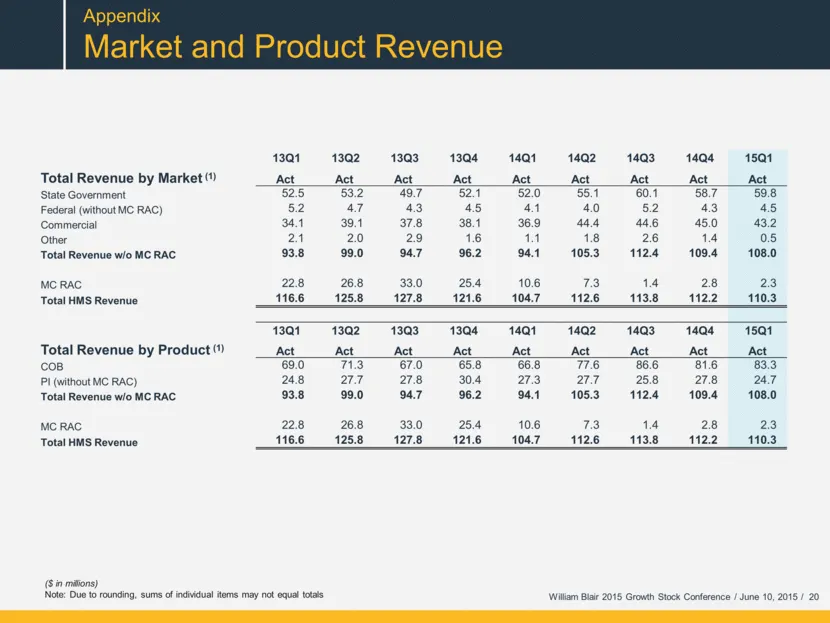
Appendix Market and Product Revenue ($ in millions) Note: Due to rounding, sums of individual items may not equal totals 13Q1 13Q2 13Q3 13Q4 14Q1 14Q2 14Q3 14Q4 15Q1 Total Revenue by Market (1) Act Act Act Act Act Act Act Act Act State Government 52.5 53.2 49.7 52.1 52.0 55.1 60.1 58.7 59.8 Federal
Slide 33: Consolidated Statements of Income
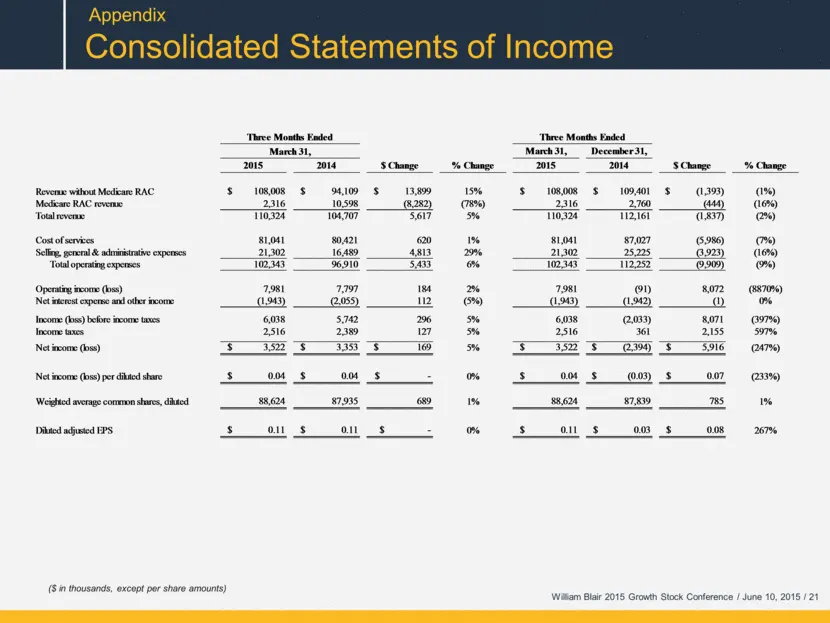
Appendix Consolidated Statements of Income ($ in thousands, except per share amounts) William Blair 2015 Growth Stock Conference / June 10, 2015 / 21 March 31, December 31, 2015 2014 $ Change % Change 2015 2014 $ Change % Change $ 108,008 $ 94,109 $ 13,899 15% $ 108,008 $ 109,401 $ (1,393) (1%) 2,31
Slide 34: Medicare RAC, State and Commercial Revenues (2013-2015)
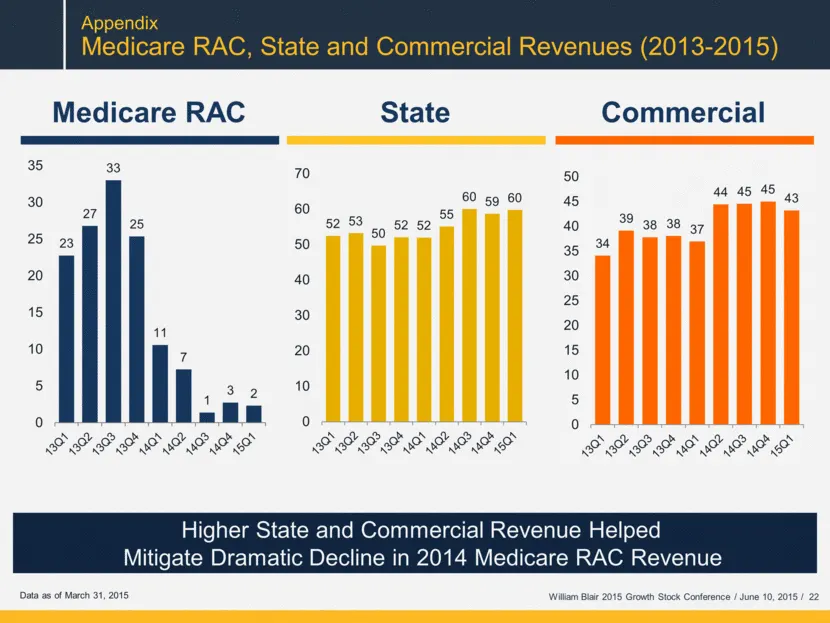
Medicare RAC Data as of March 31, 2015 Higher State and Commercial Revenue Helped Mitigate Dramatic Decline in 2014 Medicare RAC Revenue State Commercial Appendix Medicare RAC, State and Commercial Revenues (2013-2015) William Blair 2015 Growth Stock Conference / June 10, 2015 / 22 52 53 50 52 52 55
Slide 35: Managed Medicaid is Projected to Grow Through 2020
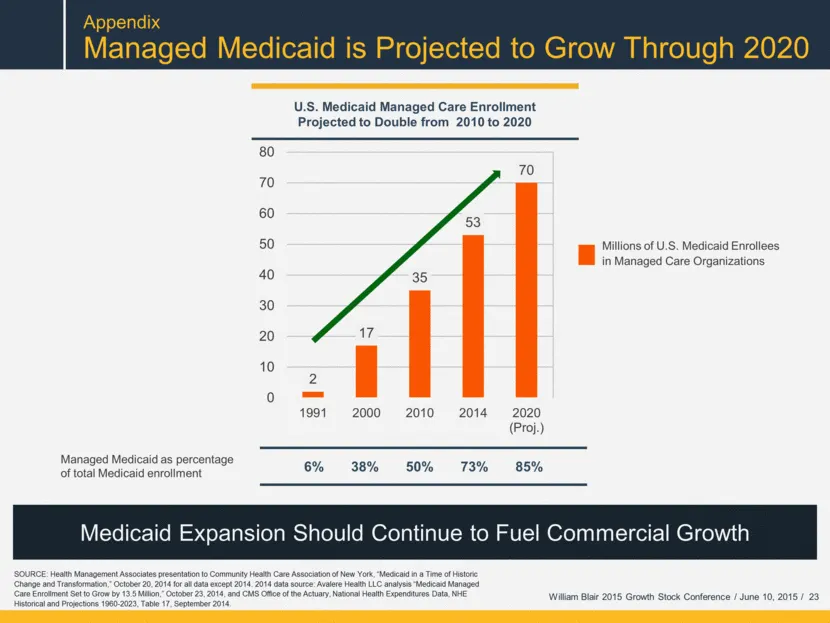
SOURCE: Health Management Associates presentation to Community Health Care Association of New York, “Medicaid in a Time of Historic Change and Transformation,” October 20, 2014 for all data except 2014. 2014 data source: Avalere Health LLC analysis “Medicaid Managed Care Enrollment Set to Grow by 13
Slide 36: Powering healthcare with integrity
@hms Powering healthcare with integrity
Source: SEC EDGAR · 8-K filed Jun 9, 2015
More decks from HMS Holdings Corp
 38th Annual J.P. Morgan Healthcare Conference (January 2020)28 slides · Jan 16, 2020
 37th Annual J.P. Morgan Healthcare Conference (January 2019)41 slides · Jan 7, 2019
 J.P. Morgan 36th Annual Healthcare Conference (January 2018)36 slides · Jan 8, 2018
 Q3 2017 Earnings Presentation12 slides · Nov 3, 2017
 Q2 2017 Earnings Presentation13 slides · Aug 4, 2017
 Q1 2017 Earnings Presentation16 slides · May 10, 2017