Enventis — Hickory Tech — Q1 2010 Earnings Presentation
13 slides from Enventis's earnings presentation, Apr 28, 2010

Slide 1: First Quarter 2010 Earnings Conference Call
First Quarter 2010 Earnings Conference Call April 27, 2010 NASDAQ: HTCO

Slide 2: “Safe Harbor” Statement
“Safe Harbor” Statement Information set forth in this presentation contains financial estimates and other forward-looking statements that are subject to risks and uncertainties; therefore, actual results might differ materially from such statements, whether as a result of new information, future eve

Slide 3: First Quarter 2010 Highlights
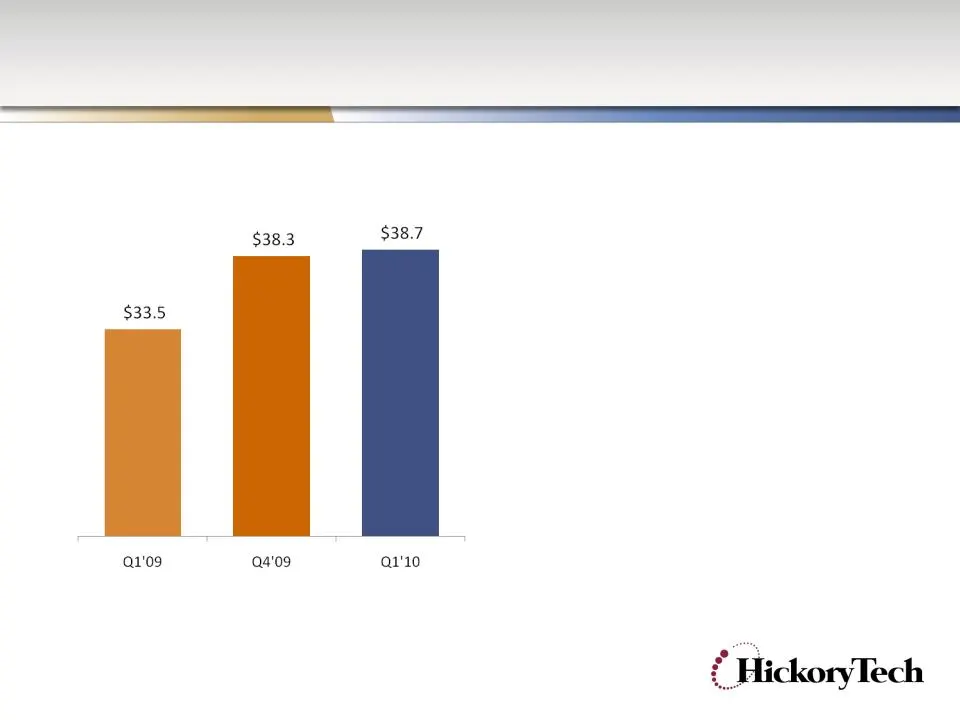
First Quarter 2010 Highlights • Revenue increased 16% to $38.7 million • Enventis fiber and data revenue increased 44 percent, equipment and services revenue increased 29 percent • Telecom broadband revenue grew 12 percent, digital TV subscribers increased 16 percent • Net income totaled $1.4 millio
Slide 4: Consolidated Revenue
Consolidated Revenue Q1’10 compared to Q1’09 • Enventis fiber and data revenue +44% • Enventis equipment & services revenue +29% • Telecom broadband revenue +12% • Telecom network access and local service revenues (-3%) (Dollars in Millions ) Quarterly Revenue
Slide 5: Earnings and Income
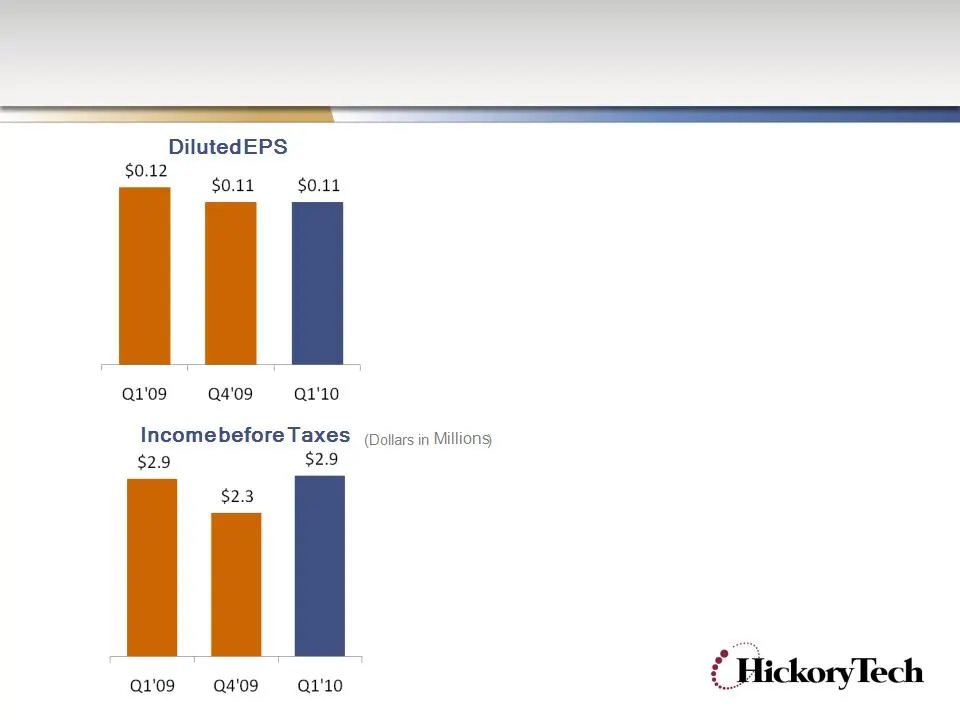
Earnings and Income Diluted EPS • Earnings impacted by a one-time expense of $279,000 related to the Healthcare Reconciliation Act of 2010 Income before Taxes (continuing operations) • Success in fiber & data, and broadband services offset network access and local service declines
Slide 6: Enventis Sector
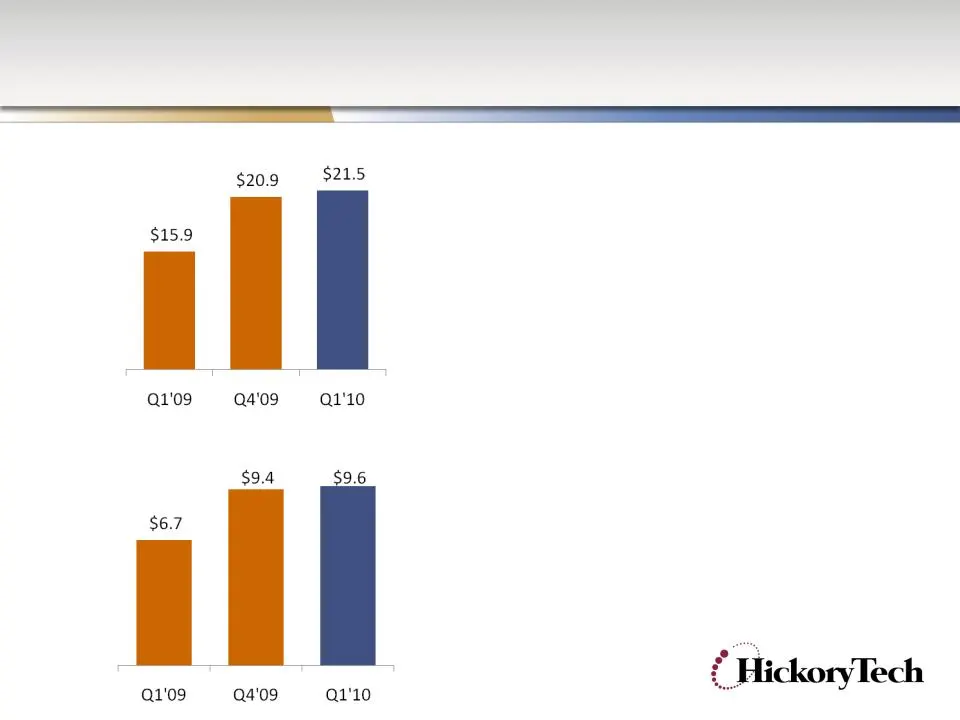
Enventis Sector Q1’10 compared to Q1’09 • Fiber and data revenues +44% • Equipment & services revenue +29% Fiber and Data • Continued growth from service providers (wireless, regional and national carriers) • Solid SMB customer segment sales results • Includes CP Telecom in Q1’10 and Q4’09 Quarterly
Slide 7: Telecom Sector
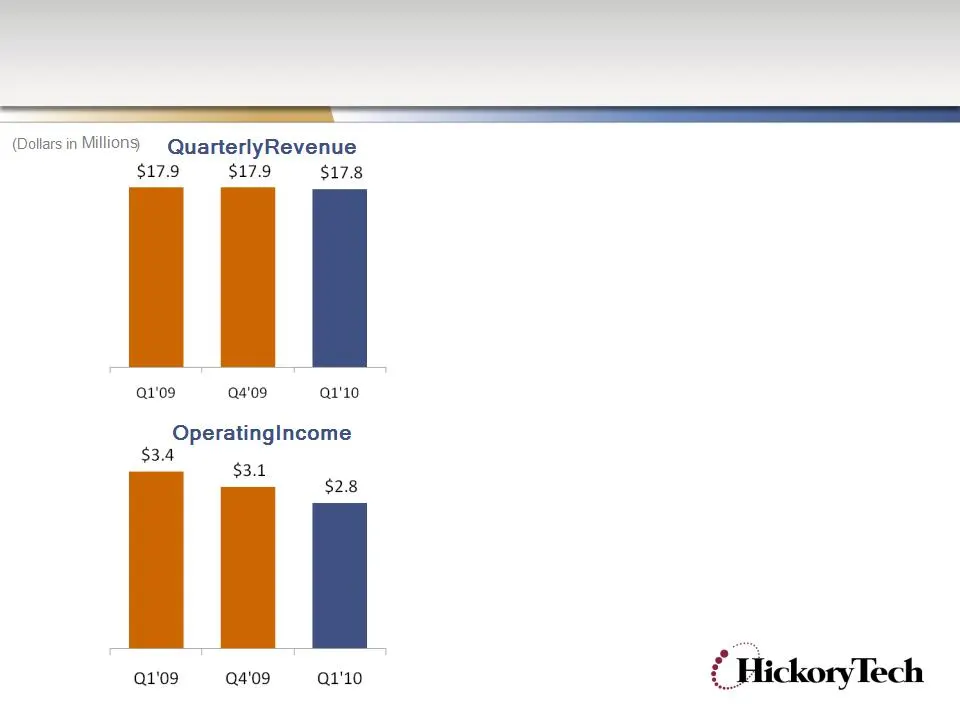
Telecom Sector Q1’10 compared to Q1’09 • Consistent Telecom revenue • Broadband revenue +12% Digital TV subscribers +16% DSL subscribers +3% • Network Access revenue -1% • Local Service revenue -5% Telecom Operating Income • Cost management and success in broadband services have moderated the declin
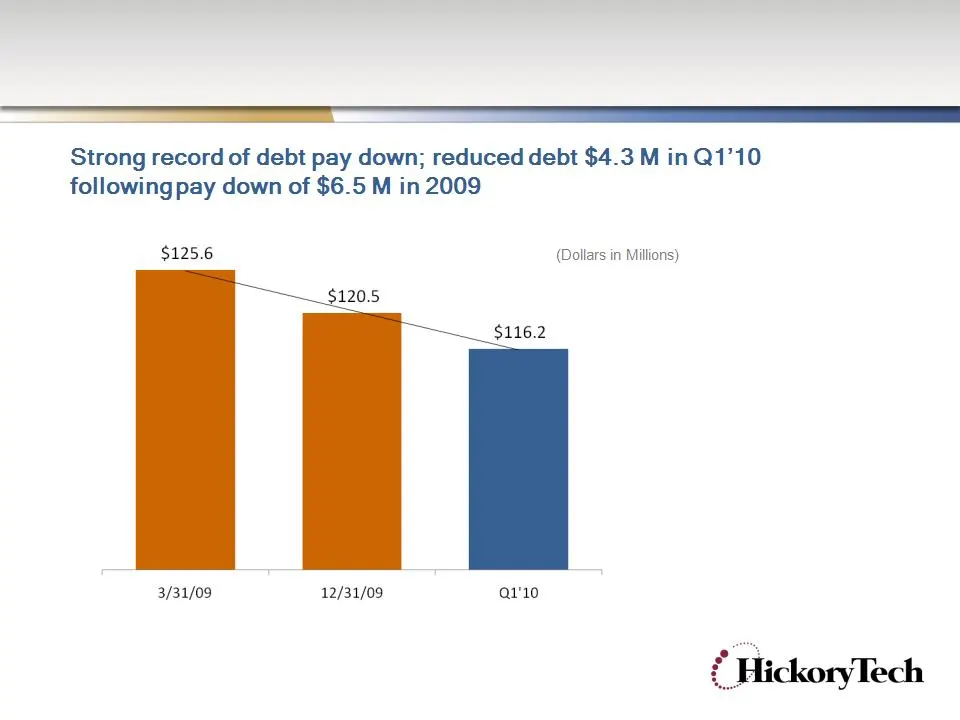
Slide 8: Debt Balance
Debt Balance 3/31/10 Debt to EBITDA ratio of 2.9 times at 3/31/10
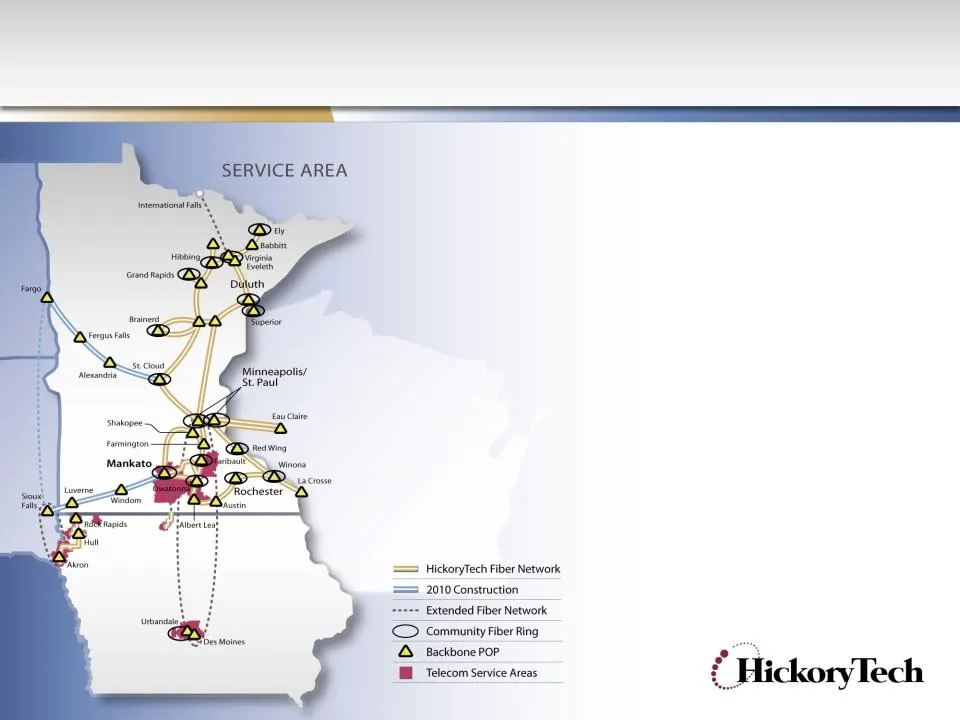
Slide 9: Fiber Network Expansion
Fiber Network Expansion 2010 Network Plans • Expansion of network to Sioux Falls, So. Dakota and Fargo, No. Dakota • Expansion of network capacity between Minnesota and Des Moines, Iowa • Add lit buildings, expand Mid-band Ethernet services and extend network for FTTT contracts.

Slide 10: 2010 Fiscal Outlook
2010 Fiscal Outlook Targets ranges as follows: • Revenue: $150 million to $158 million • Net Income: $8.7 million to $9.6 million (previously $8.2 to $9.1 million) • Capital spending: $22 million to $26 million • EBITDA: $40.5 million to $43 million • Debt balance (year-end): $117 million to $119 mi

Slide 11: 2010 Strategic Initiatives
2010 Strategic Initiatives • Increased investment and focus on growing business services Ø Fiber network expansion Ø Accelerate SMB market plan Ø Expand Mid-band Ethernet and data center services Ø Target FTTT and last-mile fiber builds • Grow broadband services and focus on customer retention • Inc

Slide 12: HTCO Strengths
HTCO Strengths • Strong cash flows • High level of recurring revenue, consistent operating income • Focused capital spending on strategic growth initiatives • Long-standing dividend return • 110+ year Company with strong financial track record
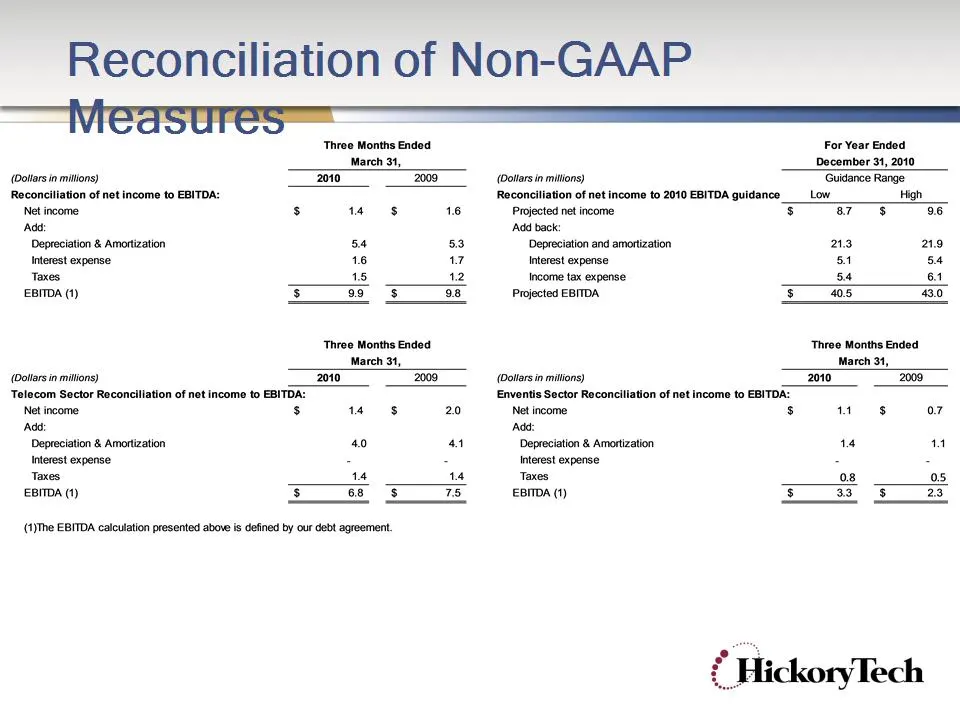
Slide 13: Reconciliation of Non-GAAP
Reconciliation of Non-GAAP MS LL ‘Three Months Ended March 31, (Botta in mitions) 2010 2008 Reconeiliation of net income to EBITDA: Net income s 4 § 16 Add Depreciation & Amortization 54 53 Interest expense 16 a7 Taxes 15 12 EBITDA (1) 5 ao oa ‘Three Months Ended March 31, (Pottars in mitions) 2010
Source: SEC EDGAR · 8-K filed Apr 28, 2010
More decks from Enventis Corp
 Merger or Acquisition (June 2014)12 slides · Jun 30, 2014
 Hickory Tech — Shareholder Meeting (May 2014)36 slides · May 7, 2014
 Hickory Tech — Q1 2014 Earnings Presentation16 slides · May 2, 2014
 Hickory Tech — Deutsche Bank Media, Internet and Telecom Conference 201431 slides · Mar 11, 2014
 Hickory Tech — Q4 2013 Earnings Presentation21 slides · Mar 4, 2014
 Hickory Tech — Q3 2013 Earnings Presentation16 slides · Nov 7, 2013