Dot Hill Systems — Singular Research 9th Annual Best of the Uncovereds (September 2014)
45 slides from Dot Hill Systems's conference presentation, Sep 22, 2014

Slide 1: Driving Growth
= Ait, -” £ > Fs ¥ > x eth, 38 > “Ay, = S > ip La Pd “ e 4 te th ie ie * lta 8 > see, “ on : ™= ge nick we Z Zp “DRIVING GROWTH" Lt NASDAQ:'HILL 30 YEARS Singular Research 9th Annual Best of the Uncovereds
Slide 2: Safe Harbor
Safe Harbor Hite tate It It d in this regarding matters that are not historical facts are “forward-looking statements” within the meaning of the Private Securities Litigation Reform Act. Because such statements are subject to risks and uncertainties, actual results may differ materially from those e
Slide 3: Dot Hill at a Glance
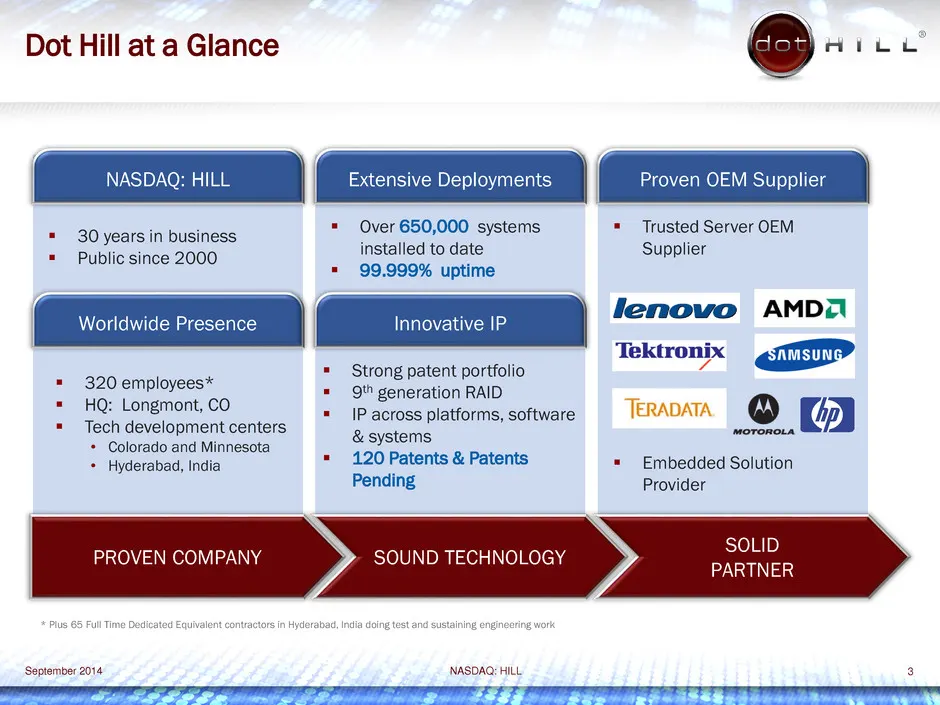
Dot Hill at a Glance for) dice NASDAQ: HILL Extensive Deployments Proven OEM Supplier 30 years in business eee ee Publ 2000 lees * 99,999% uptime Worldwide Presence Innovative IP lenovo AMDi\ Tektronix PSausuned = 320 employees* a Soret roe = HQ: Longmont, CO Senetaton Tt b j * IP across platforms,
Slide 4: Investment Highlights
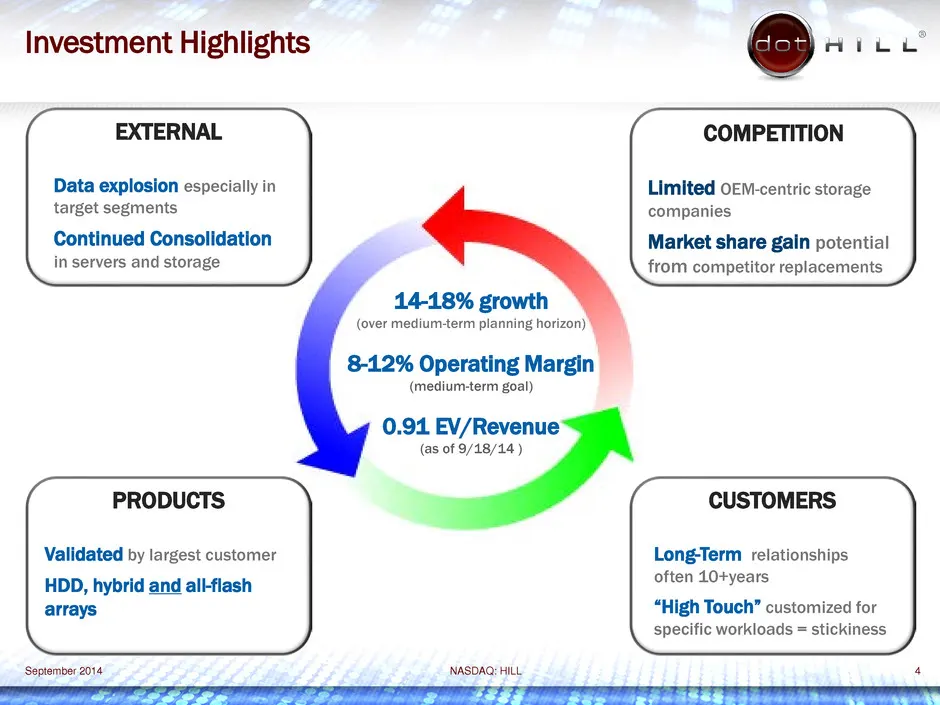
Investment Highlights 8 Hien EXTERNAL COMPETITION Data explosion especially in Limited o&M-centric storage target segments Continued Consolidation in servers and storage companies Market share gain potential from competitor replacements (over medium-term planning horizon) 8-12% Operating Margin I) (
Slide 5: Data Growth Facts
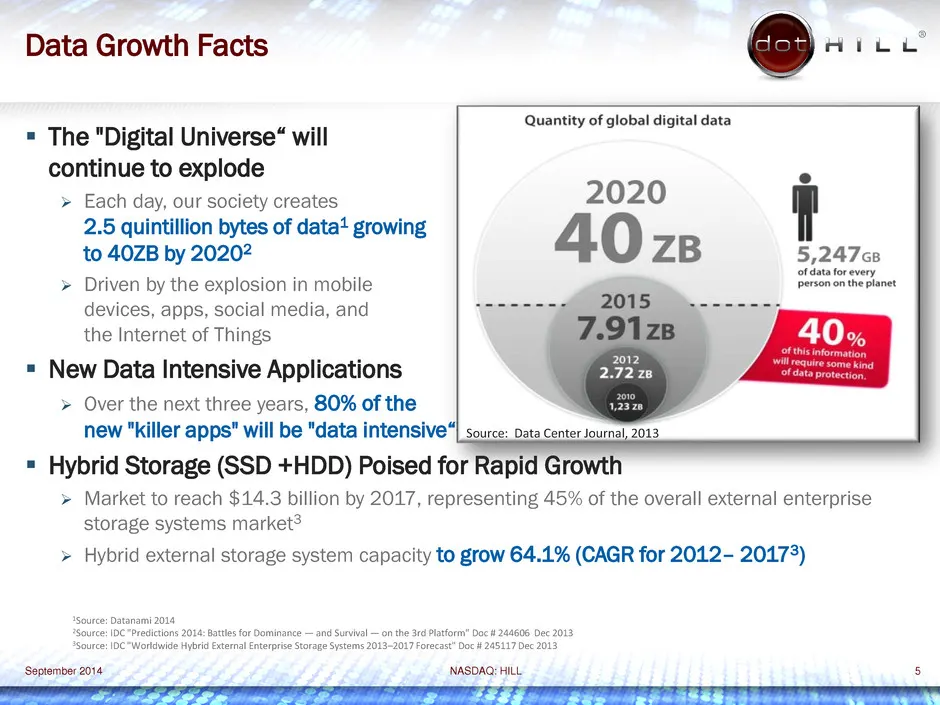
Data Growth Facts = The "Digital Universe“ will continue to explode > Each day, our society creates 2.5 quintillion bytes of data* growing to 40ZB by 20202 > Driven by the explosion in mobile devices, apps, social media, and the Internet of Things = New Data Intensive Applications > Over the next th
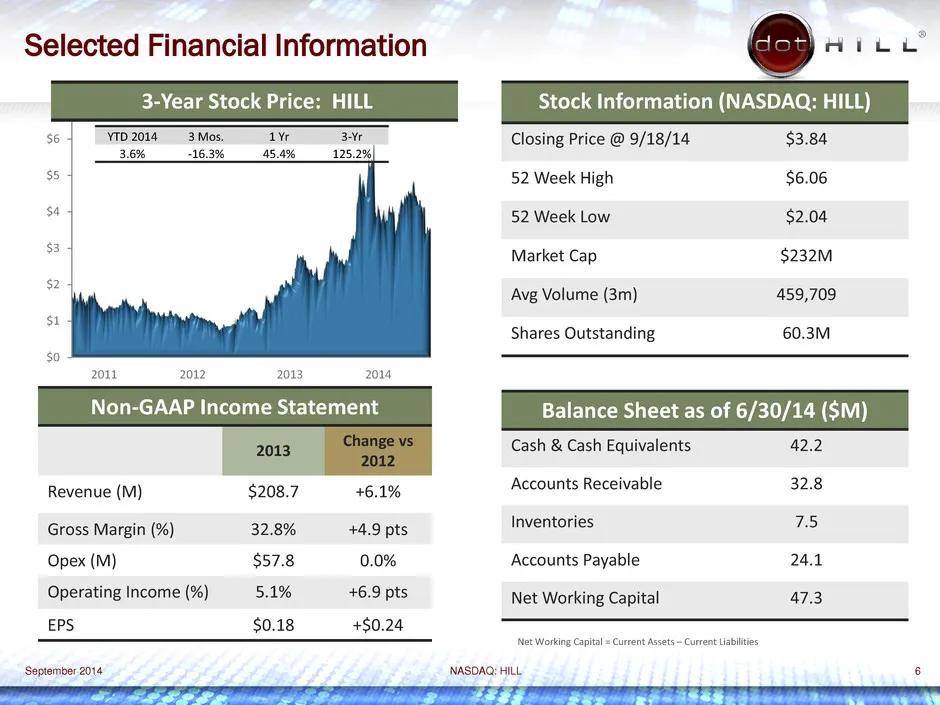
Slide 6: Selected Financial Information
Selected Financial Information 8 Hite’ 3-Year Stock Pric: Stock Information (NASDAQ: HILL) a Closing Price @ 9/18/14 $3.84 52 Week High $6.06 52 Week Low $2.04 Market Cap $232M Avg Volume (3m) 459,709 Shares Outstanding 60.3M Non-GAAP Income Statement Cash & Cash Equivalents 42.2 Revenue (M) $208.7
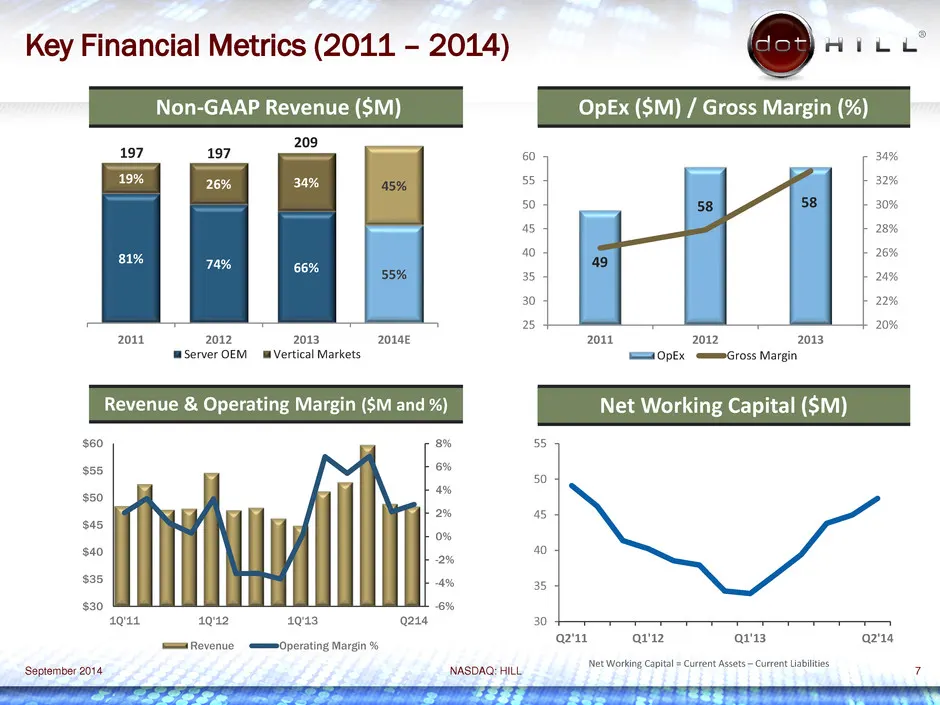
Slide 7: Key Financial Metrics (2011 - 2014)
Key Financial Metrics (2011 - 2014) dice’ Non-GAAP Revenue ($M) OpEx ($M) / Gross Margin (%) 197 197 iad 60 34% 55 32% 50 30% 45 28% 40 26% 35 24% 30 2% 25 20% 2011 20148 2011 13 2012 2013 mServer OEM mi Vertical Markets 2012 20: KEIOpEX emmmGross Margin Revenue & Operating Margin ($M and %) Net Wor
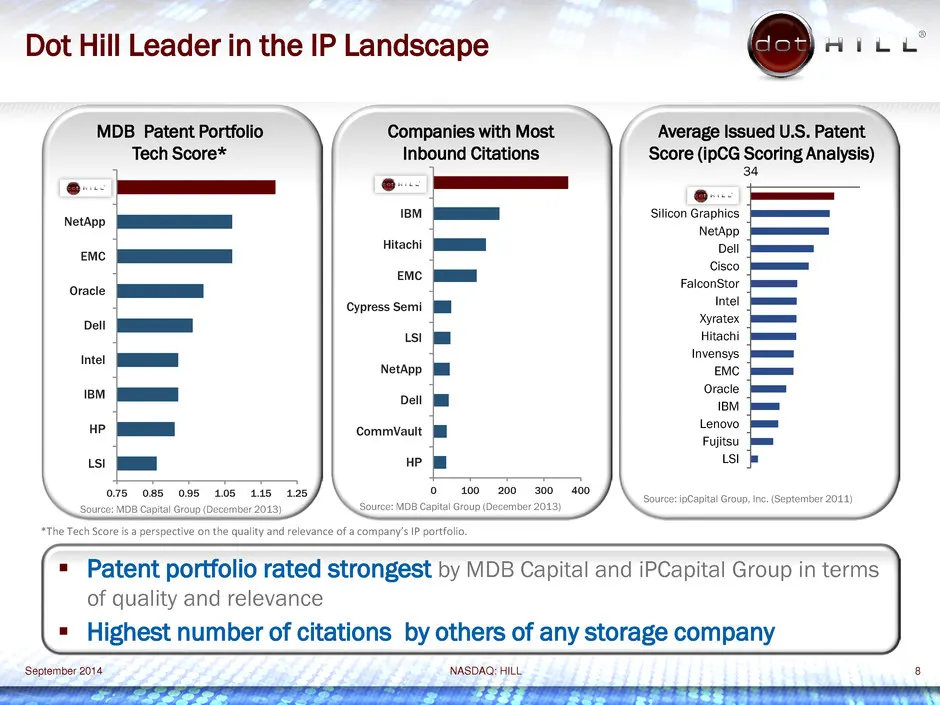
Slide 8: Dot Hill Leader in the IP Landscape
Dot Hill Leader in the IP Landscape 8 Hite MDB Patent Portfolio Companies with Most Average Issued U.S. Patent Tech Score* 34 Oo — e- vey) a Silicon Graphics p> emo Hitachi ane —- ec FalconStor cypress Semi ll we ratex oo! ls) Hitachi net ‘aes a imensys a oa be ovat | CommVault il Pale Fujitsu: ist
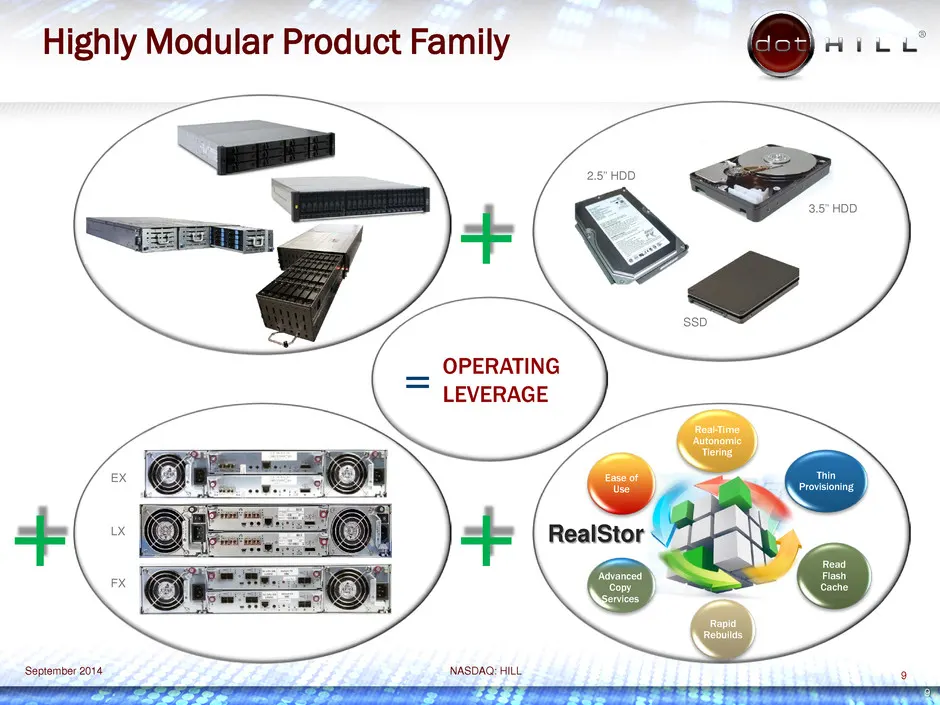
Slide 9: Highly Modular Product Family
Highly Modular Product Family 8 ica _ OPERATING ~~ LEVERAGE ‘September 2014 NASDAQ: HILL °
Slide 10: Industry Consolidation Expands Market Opportunity
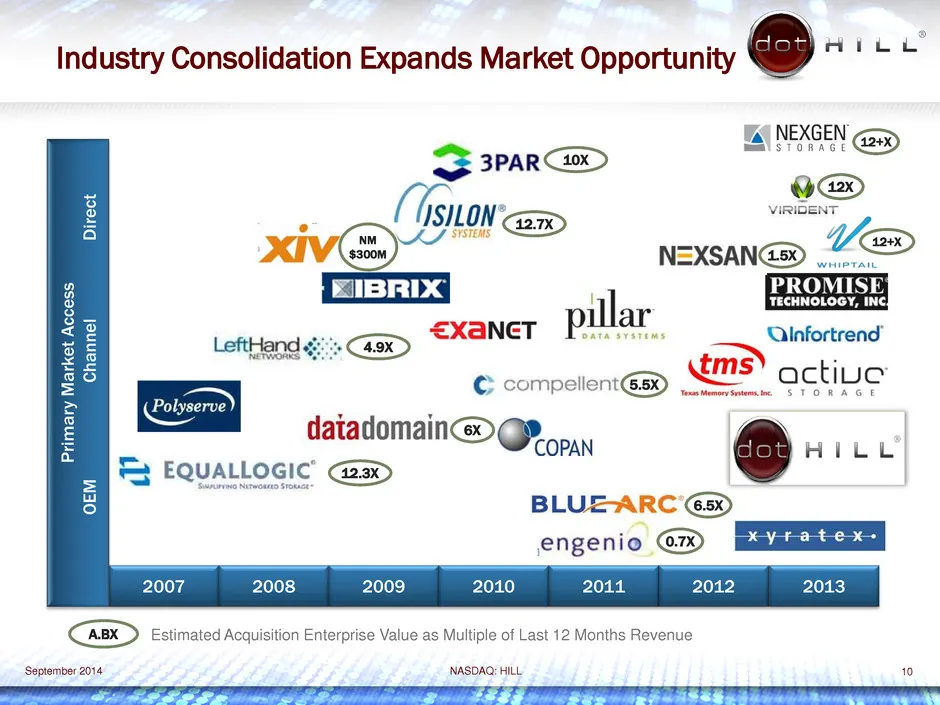
Industry Consolidation Expands Market Opportunity 8 rey EA NEXGEN GD S 3PAR@D ae 2 2 * LEE Ga >) 4 N=XSANGD KH 5 IBRD dl FROM 24 ar ce exaner Pular’ Olnfortrend ts © compoione SMS’ active 5 i YN E datadomain > QR oo. | HILL J Gx fe BLUEARC Gs) engenio G® 2008 2009 2010 2011 2012 Estimated Acquisitio
Slide 11: Dot Hill Business Model
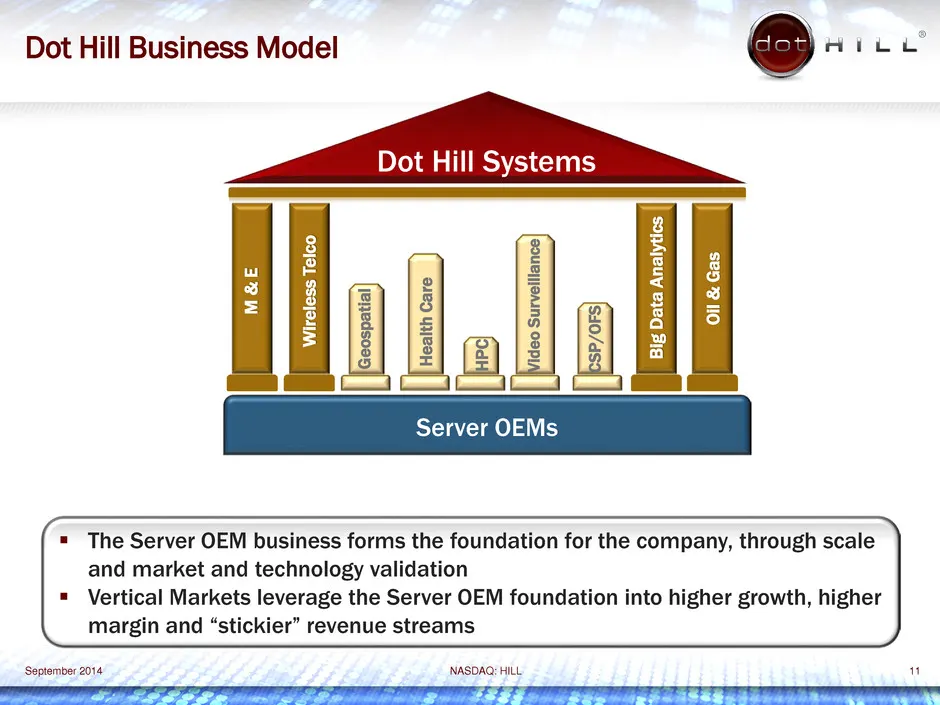
Dot Hill Business Model 8 ice Dot Hill Systems Oil & Gas Wireless Telco Big Data Analytics Jed 2 2 et Server OEMs The Server OEM business forms the foundation for the company, through scale and market and technology validation Vertical Markets leverage the Server OEM foundation into higher growth, h
Slide 12: Server OEM vs. Vertical Markets
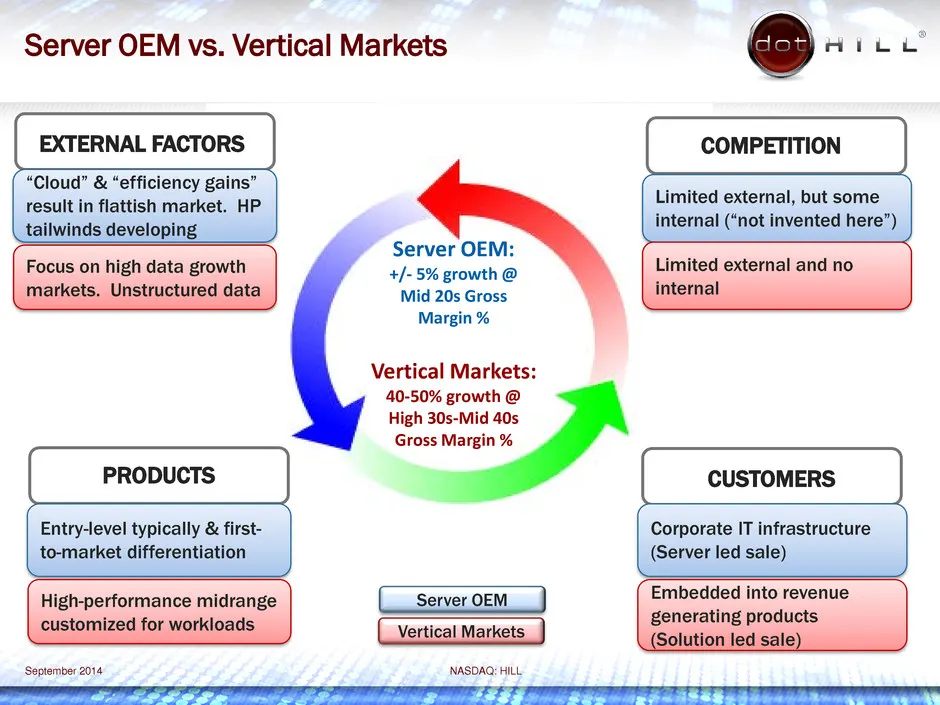
Server OEM vs. Vertical Markets 8 Hite EXTERNAL FACTORS “Cloud” & “efficiency gains” result in flattish market. HP _tailwind: COMPETITION Limited external, but some internal (“not invented here”) Server OEM: Focus on high data +/-5% growth @ arkets. U ruct Mid 20s Gross Margin % Limited external and
Slide 13: Server OEM Segment Non-GAAP Financials
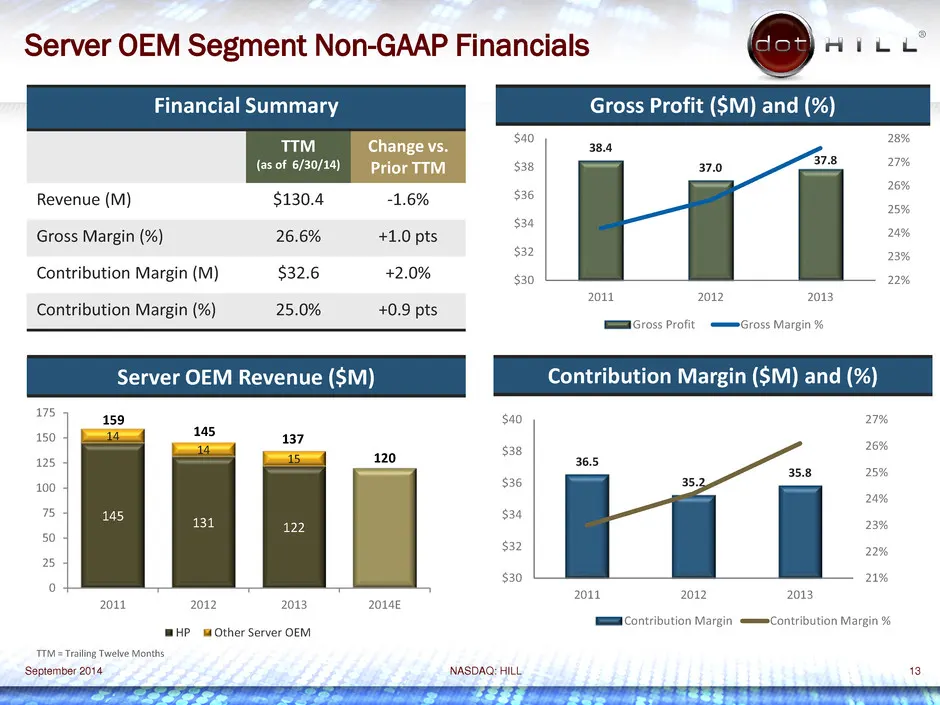
Server OEM Segment Non-GAAP Financials Nie Financial Summary Gross Profit ($M) and (%) an $40 = 28% (as of 6/30/14) $38 are 58 27% 26% Revenue (M) $130.4 -1.6% $36 sax Gross Margin (%) 26.6% +1.0 pts ~ 2496 932 23% Contribution Margin (M) $32.6 +2.0% $60 i ae ; 2011 2012 2013 Contribution Margin (%)
Slide 14: Server OEM Segment: Hewlett Packard
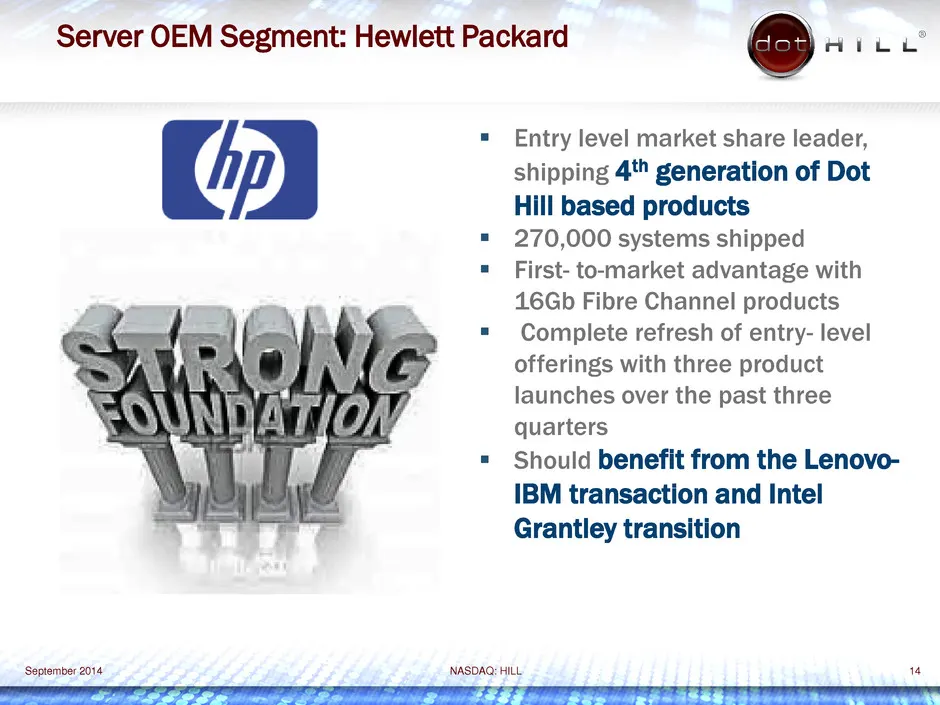
Server OEM Segment: Hewlett Packard 8 dice’ Entry level market share leader, ip shipping 4" generation of Dot Hill based products 270,000 systems shipped First- to-market advantage with 16Gb Fibre Channel products Complete refresh of entry- level offerings with three product launches over the past t
Slide 15: Vertical Markets Focus to Drive Growth
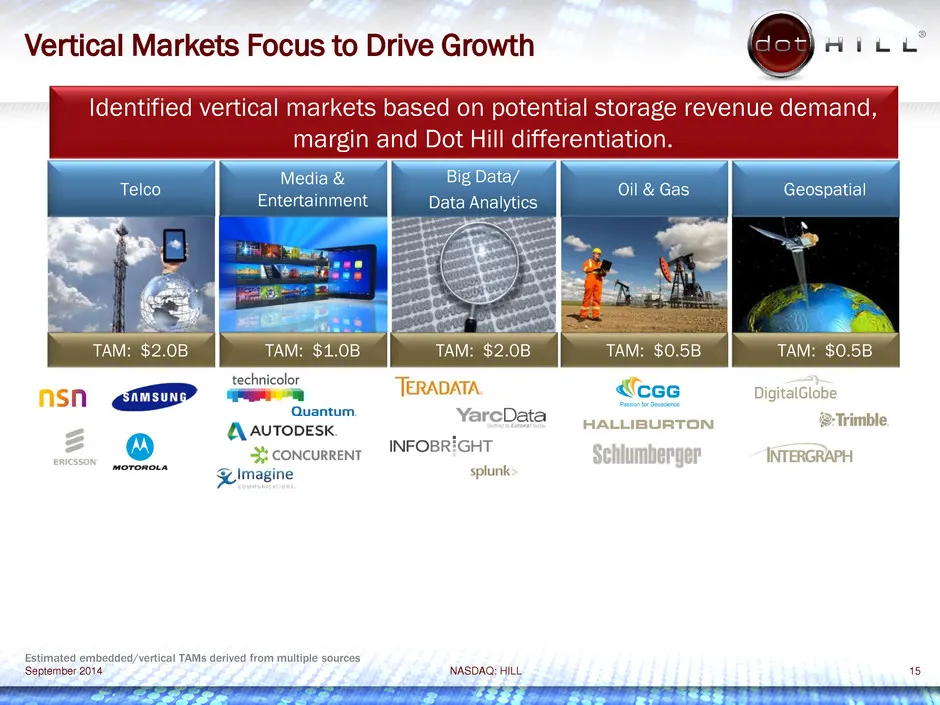
Vertical Markets Focus to Drive Growth 8 Hite Identified vertical markets based on potential storage revenue demand, margin and Dot Hill differentiation. ‘Data Analytics xe TAM: $0.5B technicolor on ao a TeRADATA DigitalGlobe QauTovesK. Yarepaie HALLIBURTON Trimble Se concurrent INFOBR'GHT iKimaen m
Slide 16: Vertical Markets Focus to Drive Growth
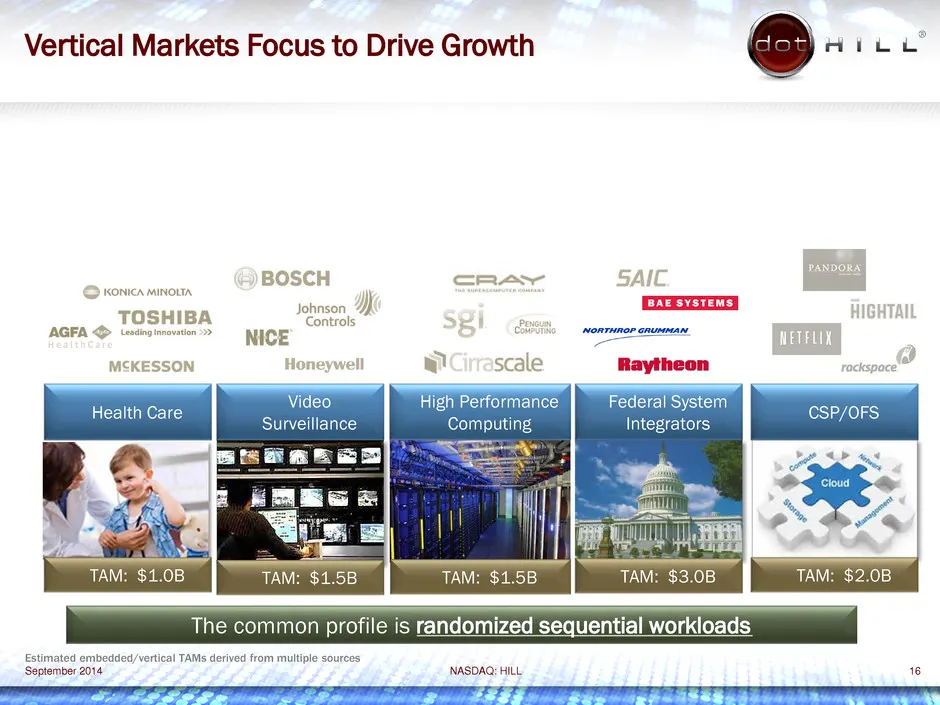
Vertical Markets Focus to Drive Growth 8 dice © roma nino BOSCH cre SAIC. peseneeeneii y TOSHIBA regs Soi «x — AGFA <> tearoiwrowion> — WHO oe pm MCKESSON Honeywell wi scale Raytheon Surveillance TAM: $1.5B TAM: $3.0B The common profile is TAM ‘September 2014 NASDAQ: HILL 16 domized sequential workl
Slide 17: Vertical Markets Focus to Drive Growth
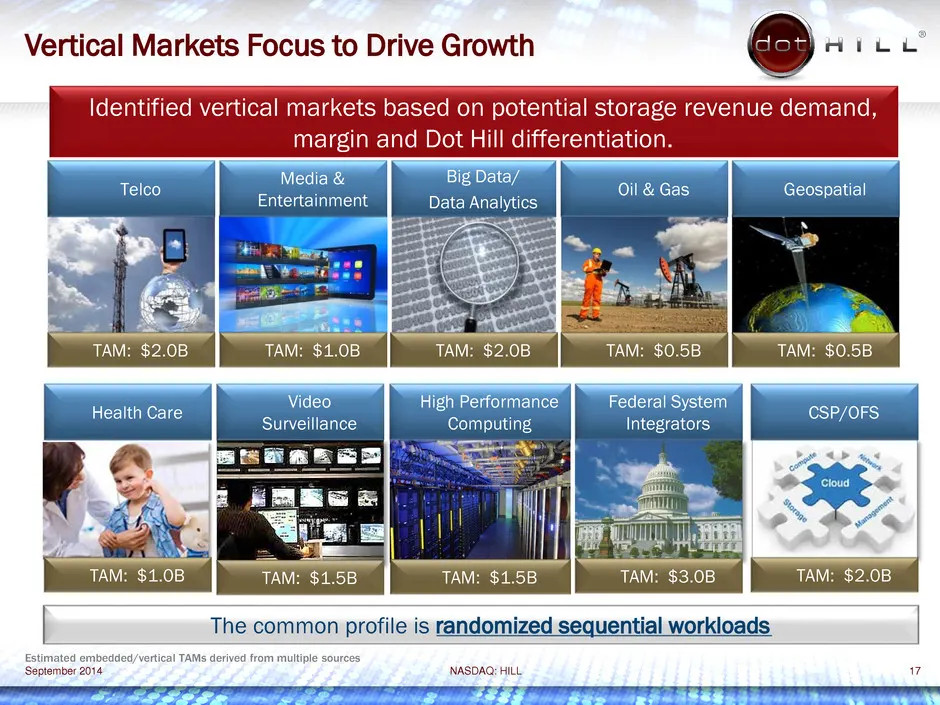
Vertical Markets Focus to Drive Growth Identified vertical markets based on potential s' n and Dot Hill differen TAM: $1.5B TAM: $1.5B The common profile is i ial workloads | bedded/vertical TAMS derived ple acu ‘September 2014 hdeiofial 7
Slide 18: Vertical Markets Segment Non-GAAP Financials
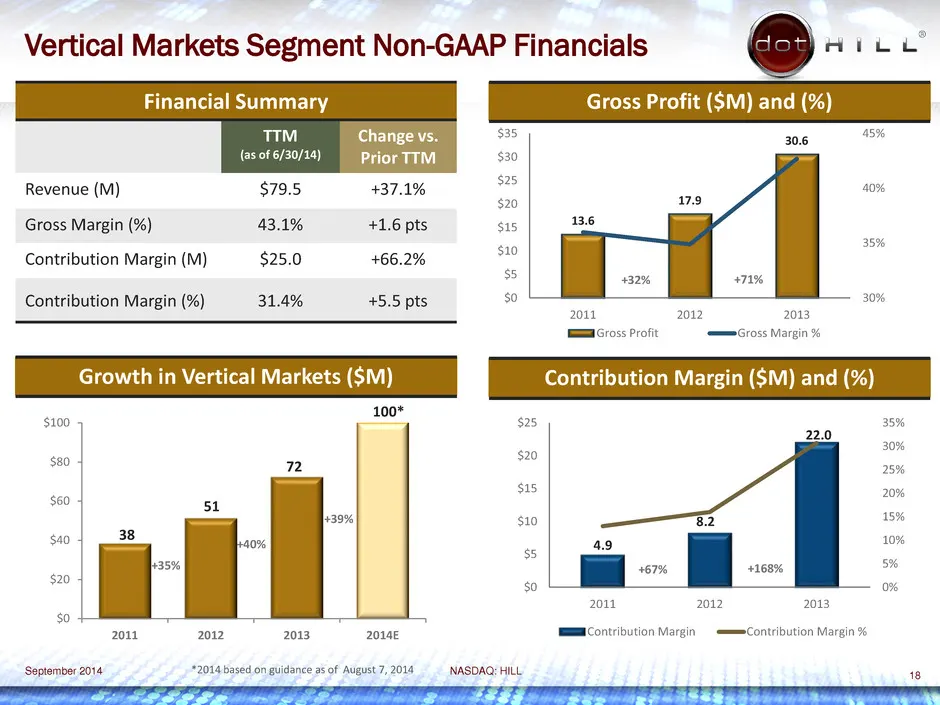
Vertical Markets Segment Non-GAAP Financials Hive Gross Profit ($M) and (%) 45% Financial Summary Change vs. TM (as of 6/30/24) Prior TTM Revenue (M) $79.5 437.1% 40% Gross Margin (%) 43.1% +.6 pts 35% Contribution Margin (M) $25.0 +66.2% Contribution Margin (%) 31.4% +5.5 pts 30% 2012 2013 HGr055 P
Slide 19: Vertical Market Profile: Telco
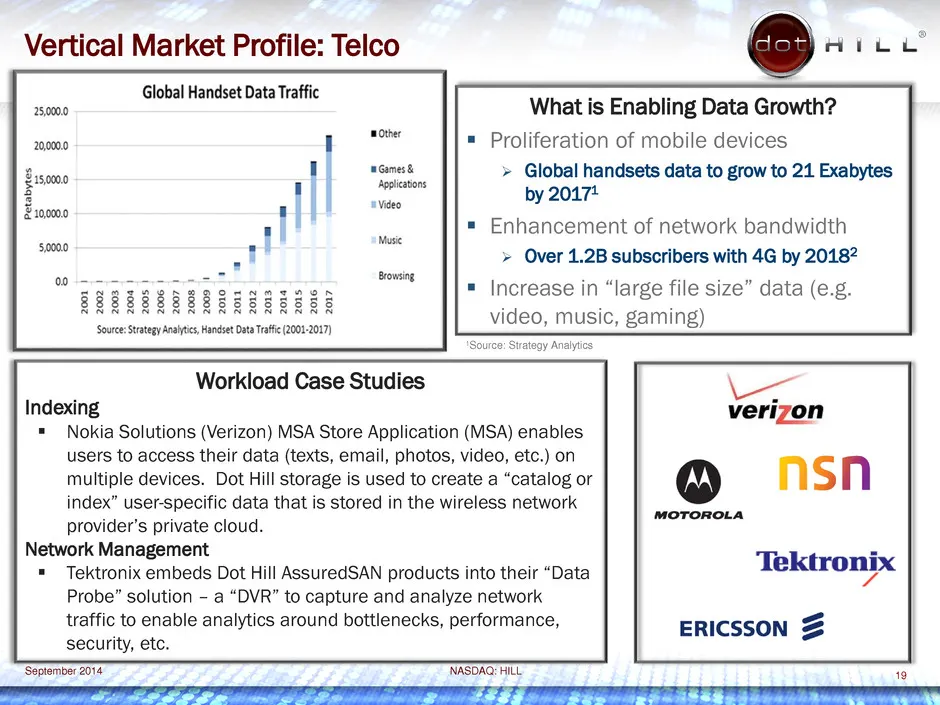
Vertical Market Profile: Telco Global Handset Data Traffic @-.-- What is Enabling Data Growth? 250000 2000 note = Proliferation of mobile devices Eiseno | gone > Global Panes data to grow to 21 Exabytes 3 0000 | Video , ' | n = Enhancement of network bandwidth sa = | > Over 1.2B subscribers with 4G
Slide 20: Vertical Market Profile: Big Data Analytics
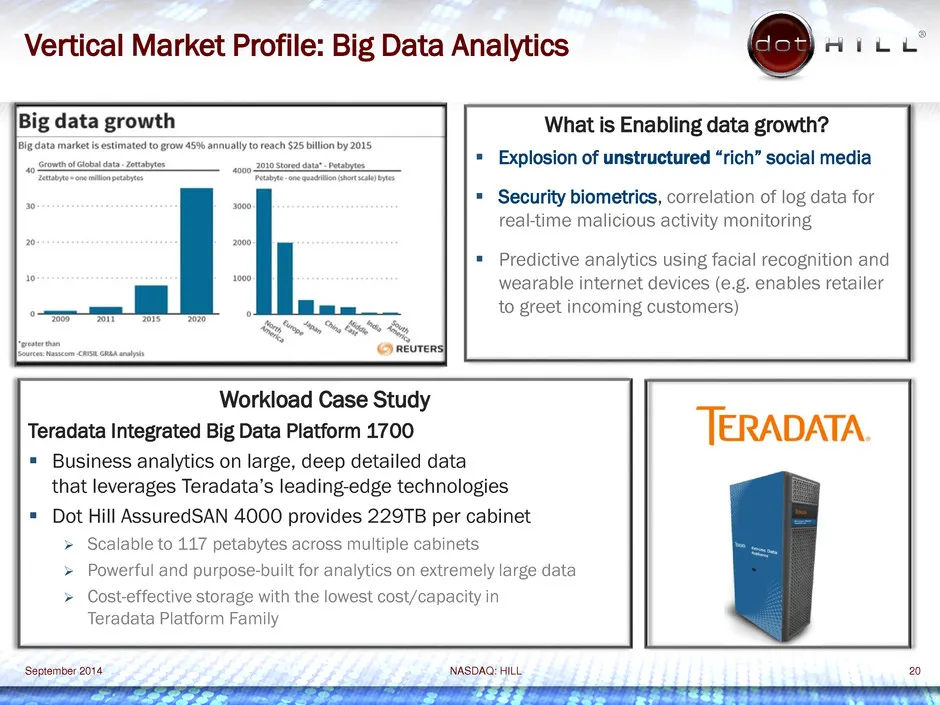
Vertical Market Profile: Big Data Analytics 8 a Big data growth What is Enabling data growth? Sotho si andi * Explosion of unstructured “rich” social media ». ‘ies = Security biometrics, correlation of log data for real-time malicious activity monitoring * Predictive analytics using facial recogniti
Slide 21: Vertical Market Profile: Media & Entertainment
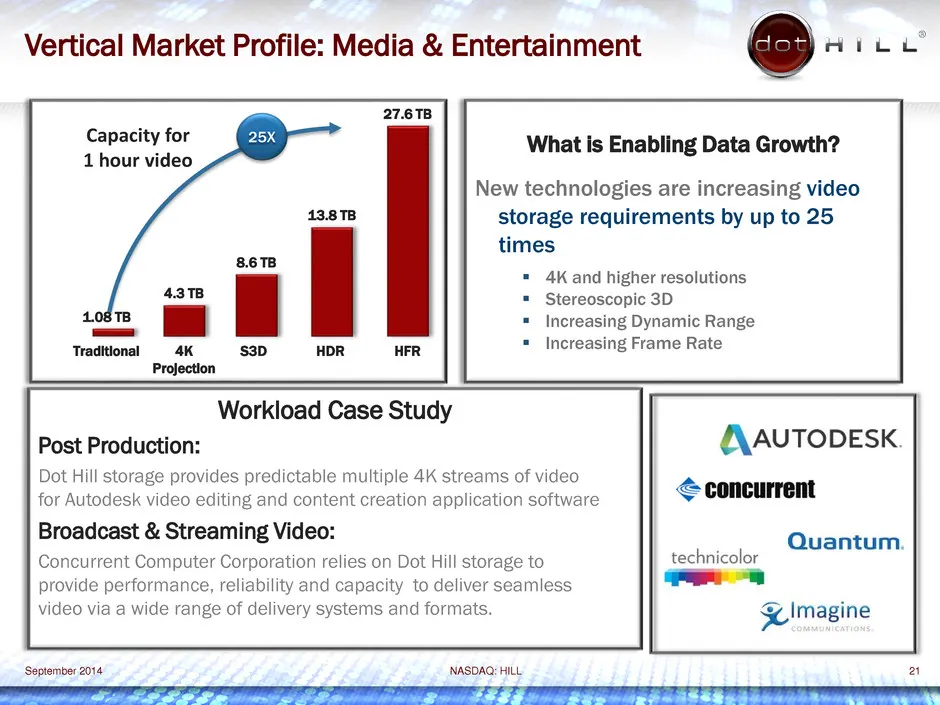
Vertical Market Profile: Media & Entertainment 8 Aice 27.6TB Capacity for What is Enabling Data Growth? 1 hour video New technologies are increasing video 13.878 storage requirements by up to 25 times = 4K and higher resolutions = Stereoscopic 3D 1.08 TB | | = Increasing Dynamic Range = Increasing F

Slide 22: Financials and Business Model
_— z — r Fs a me op S ¢ Ly Lig ad 1 e te ‘a Pc ie ms. itay “ > ee on . = ? vith ™ Gee DRIVING GROWTH"! Wea hs NASDAQ:'HILL ® el ag 30 YEARS Financials and Business Model
Slide 23: About Non-GAAP Financial Measures and Segment Reporting
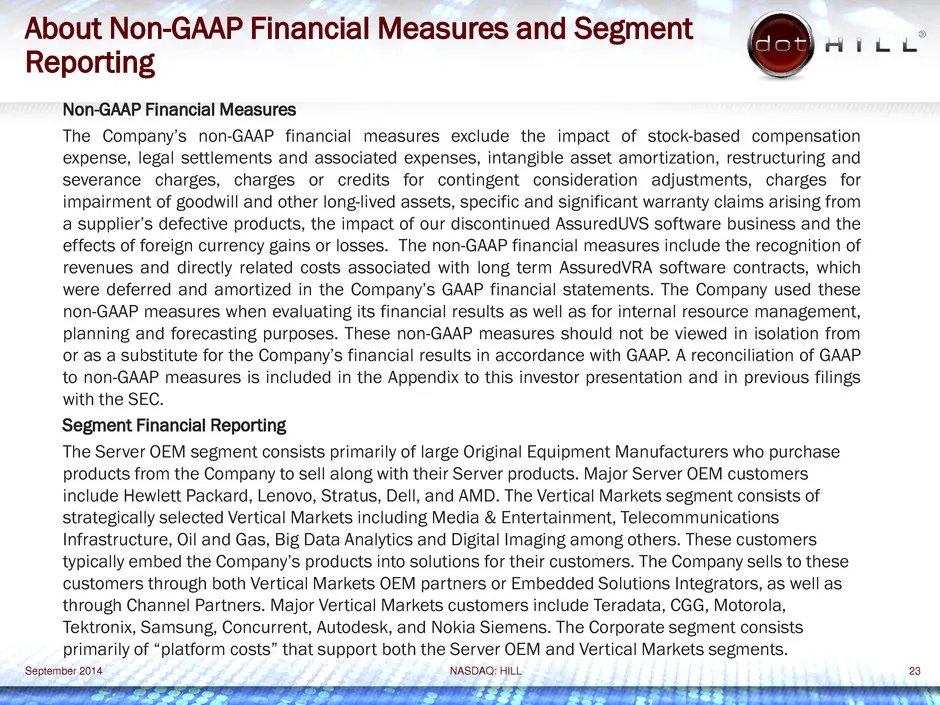
About Non-GAAP Financial Measures and Segment Reporting Non-GAAP Financial Measures The Company's non-GAAP financial measures exclude the impact of stock-based compensation expense, legal settlements and associated expenses, intangible asset amortization, restructuring and severance charges, charges
Slide 24: Q3'14 and Full Year 2014 Non-GAAP Guidance
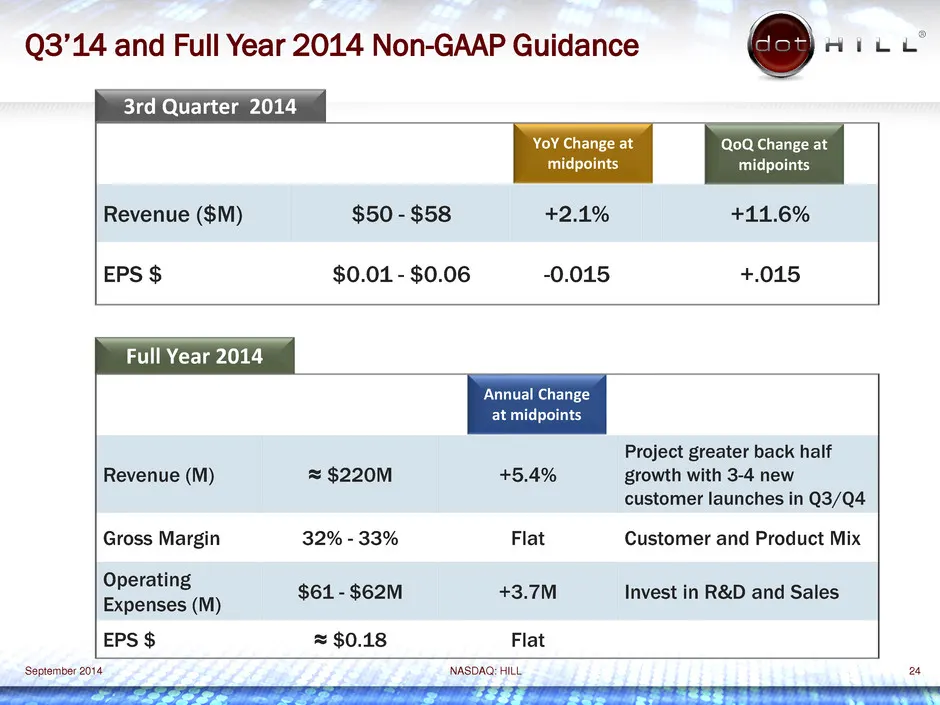
Q3’14 and Full Year 2014 Non-GAAP Guidance 8 Fine. 3rd Quarter 2014 YoY Change at midpoints QoQ Change at midpoints Revenue ($M) $50 - $58 +2.1% +11.6% EPS $ $0.01 - $0.06 -0.015 +.015 Full Year 2014 Annual Change at midpoints Project greater back half Revenue (M) = $220M +5.4% growth with 3-4 new c
Slide 25: Medium-Term Outlook
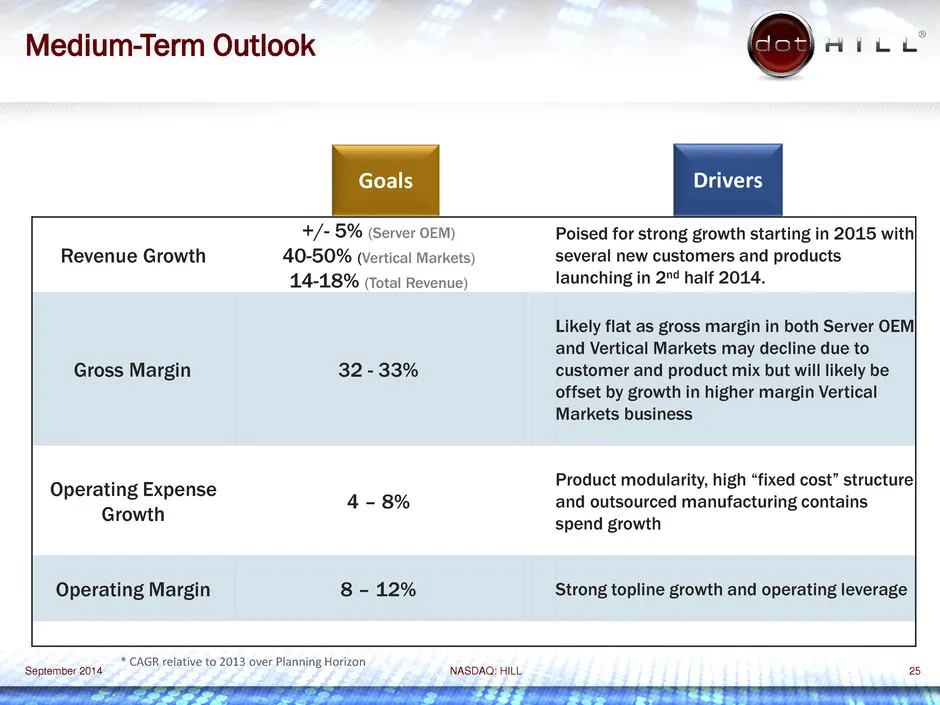
Medium-Term Outlook @-.-- Drivers Revenue Growth +/- 5% (Server OEM) 40-50% (vertical Markets) 14-18% (Total Revenue) Gross Margin 32-33% Operating Expense . Growth 28% Operating Margin 8- 12% Poised for strong growth starting in 2015 with] several new customers and produ‘ launching in 2"4 half 2044
Slide 26: Investment Highlights
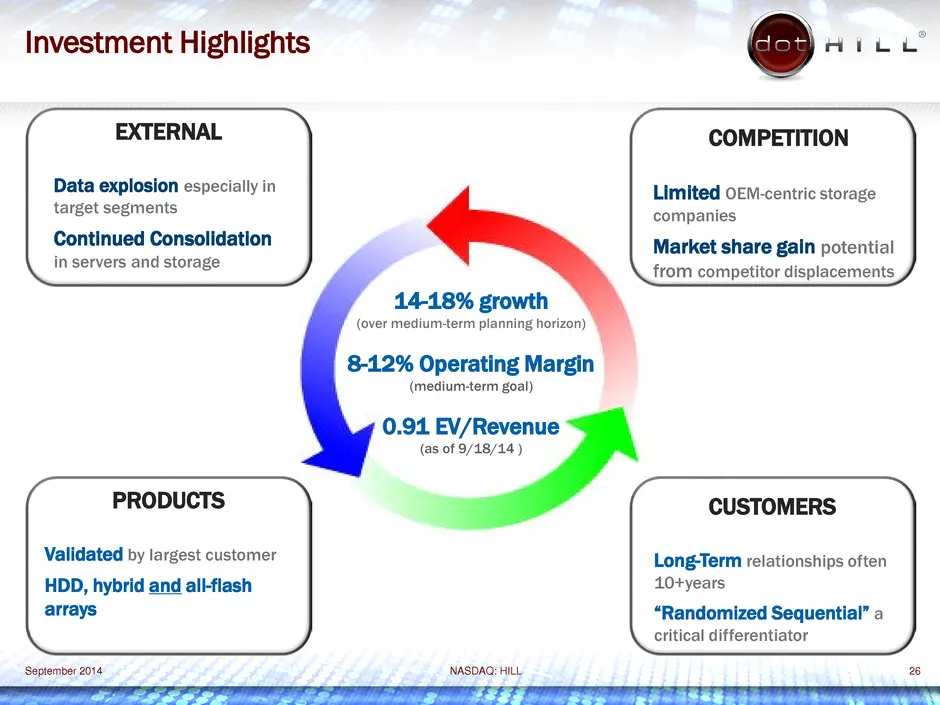
Investment Highlights EXTERNAL Data explosion especially in target segments Continued Consolidation in servers and storage PRODUCTS Validated by largest customer HDD, hybrid and all-flash arrays ‘September 2014 (over medium-term planning horizon) 8-12% Operating Margin I) (medium-term goal 0.91 EV/R

Slide 27: Appendix I: Reconciliation of GAAP to Non-GAAP Financial Measures
= Ait, -” £ > Fs ¥ > x eth, 38 > “Ay, = S > ip La Pd “ e 4 te th ie ie * lta 8 > see, “ on : ™= ge nick we Z Zp “DRIVING GROWTH" Lt NASDAQ:'HILL 30 YEARS Appendix |; Reconciliation of GAAP to Non-GAAP Financial Measures
Slide 28: About Non-GAAP Financial Measures and Segment Reporting
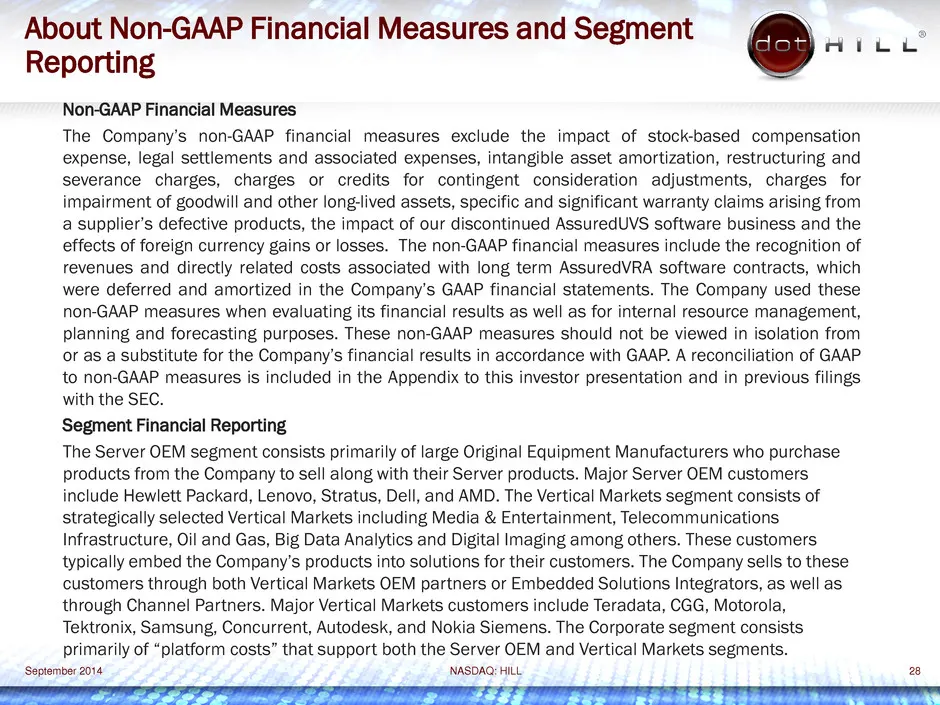
About Non-GAAP Financial Measures and Segment Reporting Non-GAAP Financial Measures The Company's non-GAAP financial measures exclude the impact of stock-based compensation expense, legal settlements and associated expenses, intangible asset amortization, restructuring and severance charges, charges
Slide 29: 2011-2013 Non-GAAP Segment Financial Results
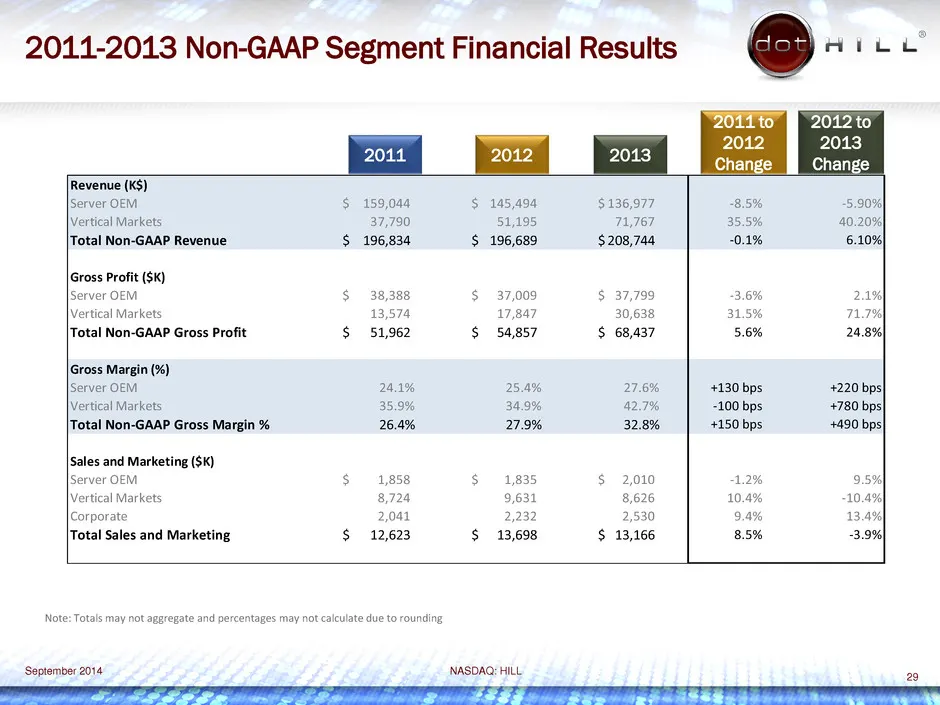
2011-2013 Non-GAAP Segment Financial Results (KS) jerver OEM $ 159,044 $145,494 $136,977 8.5% 5.90%) Vertical Markets 37,790 51,195 71,767 35.5% 40.20%| [Total Non-GAAP Revenue $ 196,834 $ 196,689 $208,744 -0.1% 6.10%| Gross Profit ($k) Server OFM $38,388 $37,009 $ 37,799 3.6% 2.1%] Vertical Markets
Slide 30: 2011-2013 Non-GAAP Segment Financial Results
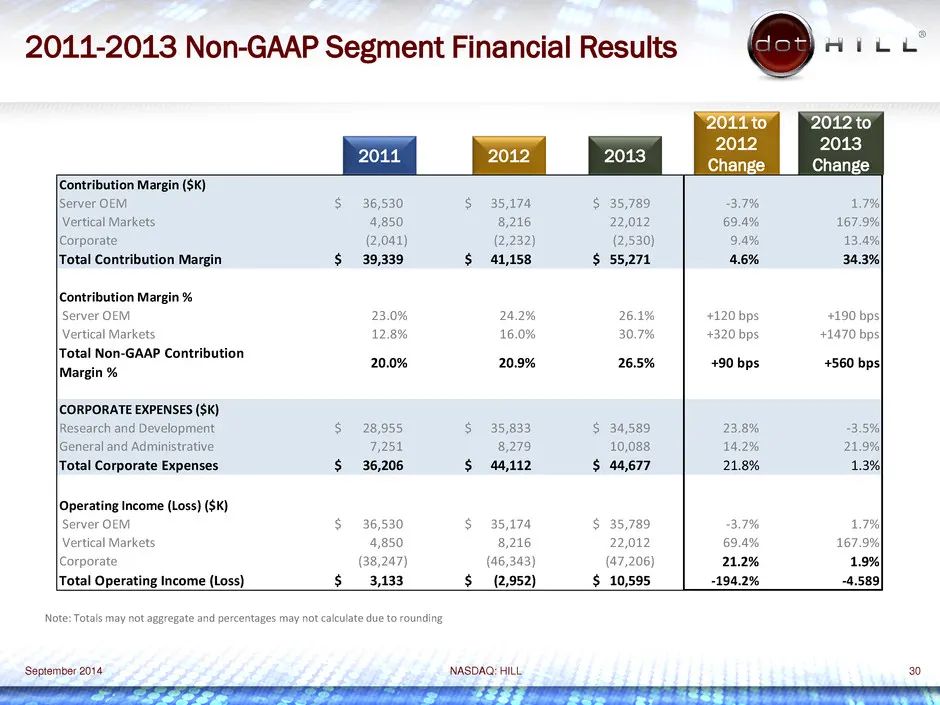
2011-2013 Non-GAAP Segment Financial Results Aree [Contribution Margin ($K) ser $ 36,530 $ 35,174 $ 35,789 3.7% 1.7% Vertical Markets 4,850 8,216 012 69.4% 167.9% corporate (2,041) (2,232) (2,530) 9.4% 13.4% {Total Contribution Margin $ 39,339 $ 41,158 $ 55,271 4.6% 34.3% Server OEM 23.0% 24.2% 26.1
Slide 31: 2011-2013 GAAP to Non-GAAP Revenue
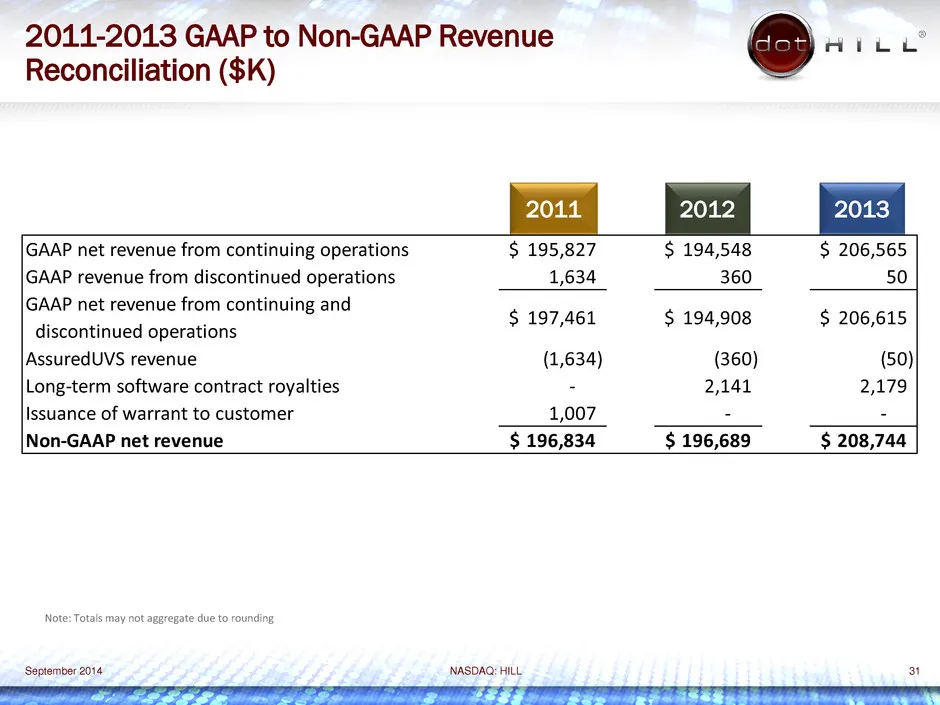
2011-2013 GAAP to Non-GAAP Revenue Reconciliation ($K) @-.-- GAAP net revenue from continuing operations $ 195,827 $§ 194,548 S$ 206,565 GAAP revenue from discontinued operations 1,634 360 50 GAAP net revenue from continuing and : , . $ 197,461 $ 194,908 $ 206,615 discontinued operations AssuredUVS
Slide 32: 2011-2013 GAAP to Non-GAAP Gross Profit
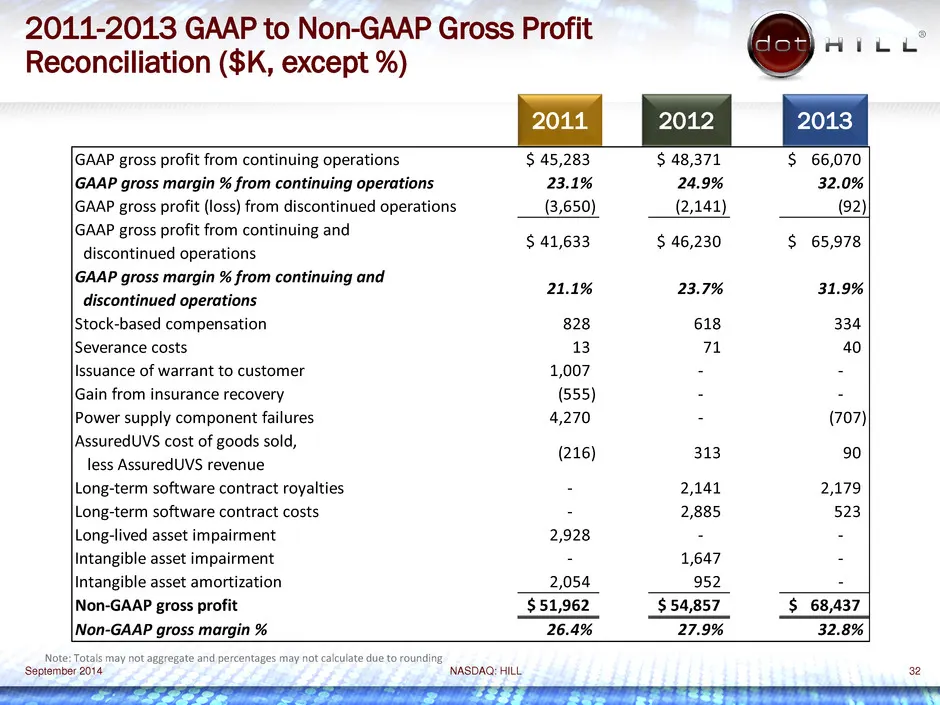
2011-2013 GAAP to Non-GAAP Gross Profit ATL Reconciliation ($K, except %) [GAAP gross profit from continuing operations $ 45,283 $48,371 $ 66,070 g ‘gin % from continuing operatic 23.1% 24.9% 32.0% GAAP gross profit (loss) from discontinued operations (3,650) (2,141) (92) IGAAP gross profit from con
Slide 33: 2011-2013 GAAP to Non-GAAP Operating Expenses
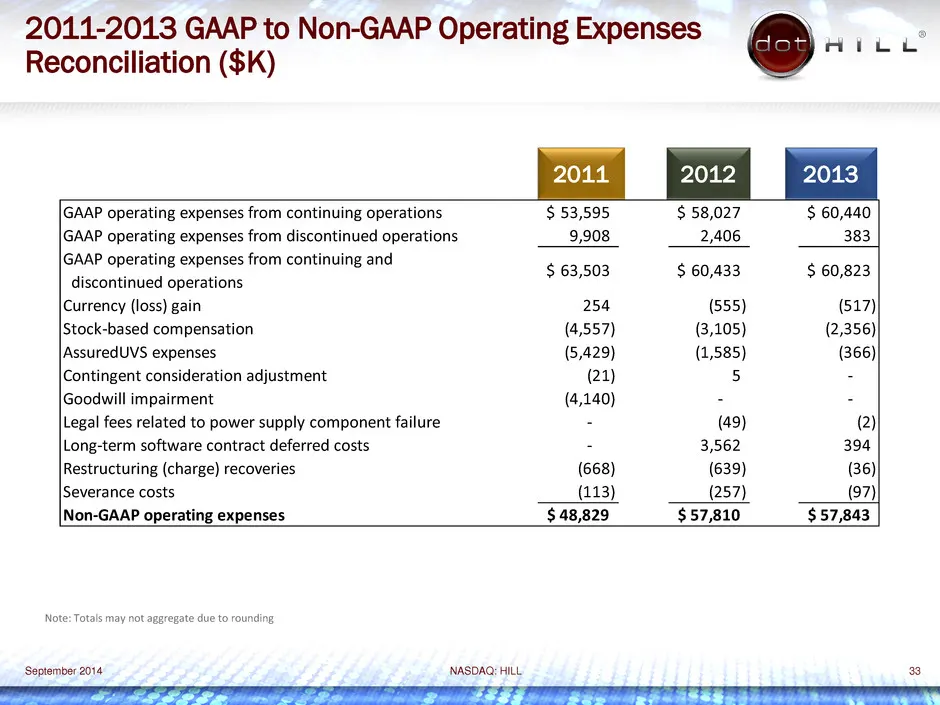
2011-2013 GAAP to Non-GAAP Operating Expenses ae HitLu Reconciliation ($K) GAAP operating expenses from continuing operations $ 53,595 $ 58,027 $ 60,440 IGAAP operating expenses from discontinued operations 9,908 2,406 GAAP operating expenses from continuing and $63,503 $60,433 $60,823 discontinued
Slide 34: 2011-2013 GAAP to Non-GAAP Net Income (Loss)
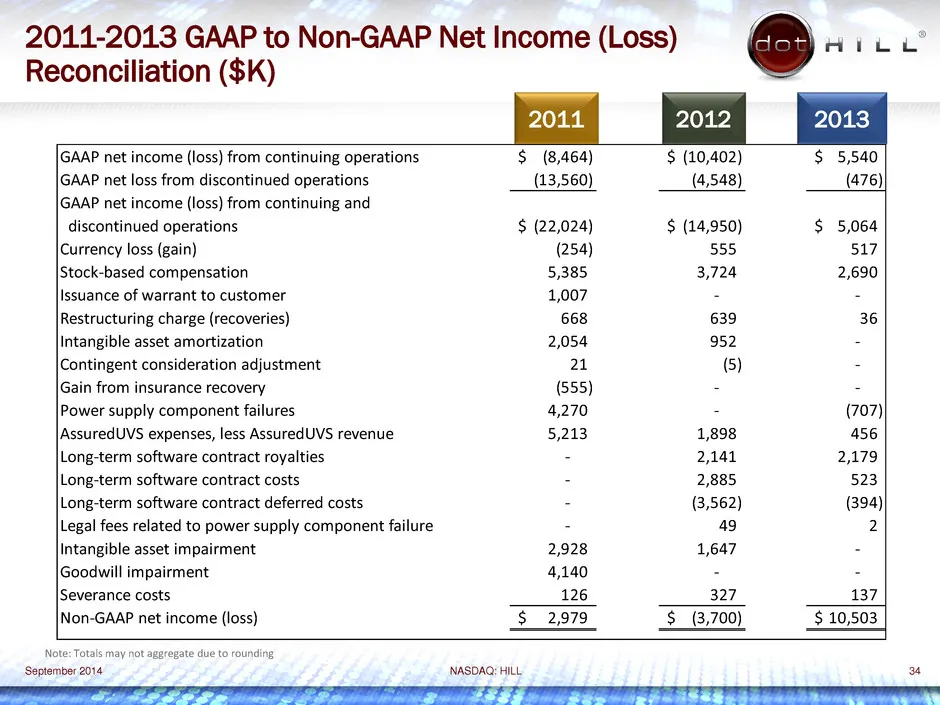
2011-2013 GAAP to Non-GAAP Net Income (Loss) ico Le Reconciliation ($K) GAAP net income (loss) from continuing operations $ (8,464) $ (10,402) $ 5,540 GAAP net loss from discontinued operations (13,560) (4,548) (476) GAAP net income (loss) from continuing and discontinued operations $ (22,024) $ (14
Slide 35: 2011-2013 GAAP to Non-GAAP EPS (LPS)
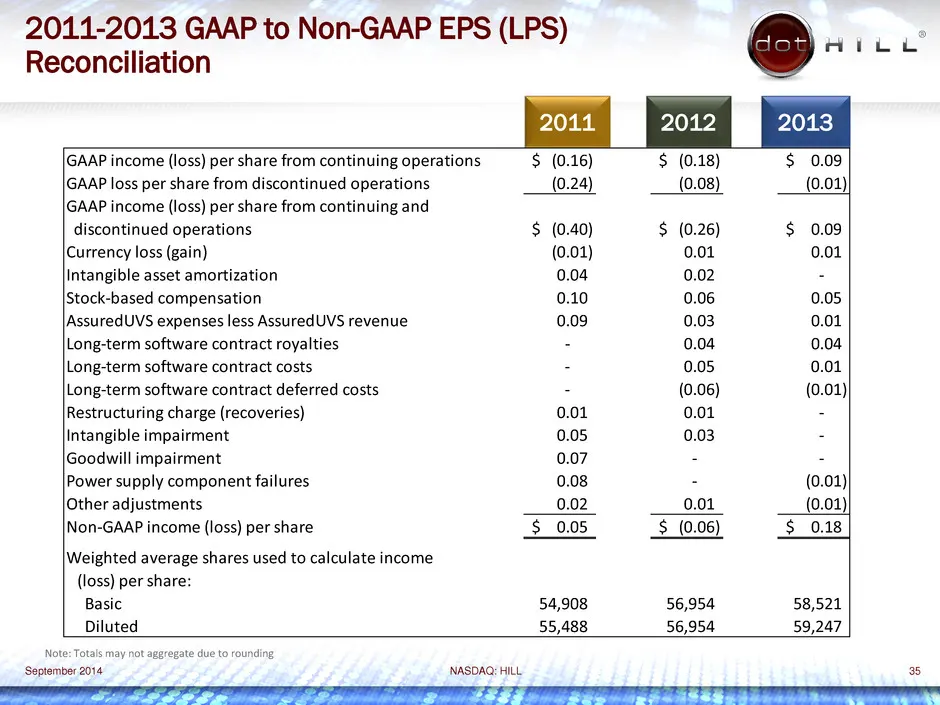
2011-2013 GAAP to Non-GAAP EPS (LPS) pee Hicu Reconciliation GAAP income (loss) per share from continuing operations $ (0.16) $ (0.18) $ 0.09 GAAP loss per share from discontinued operations (0.24) (0.08) (0.01) GAAP income (loss) per share from continuing and discontinued operations $ (0.40) $ (0.2
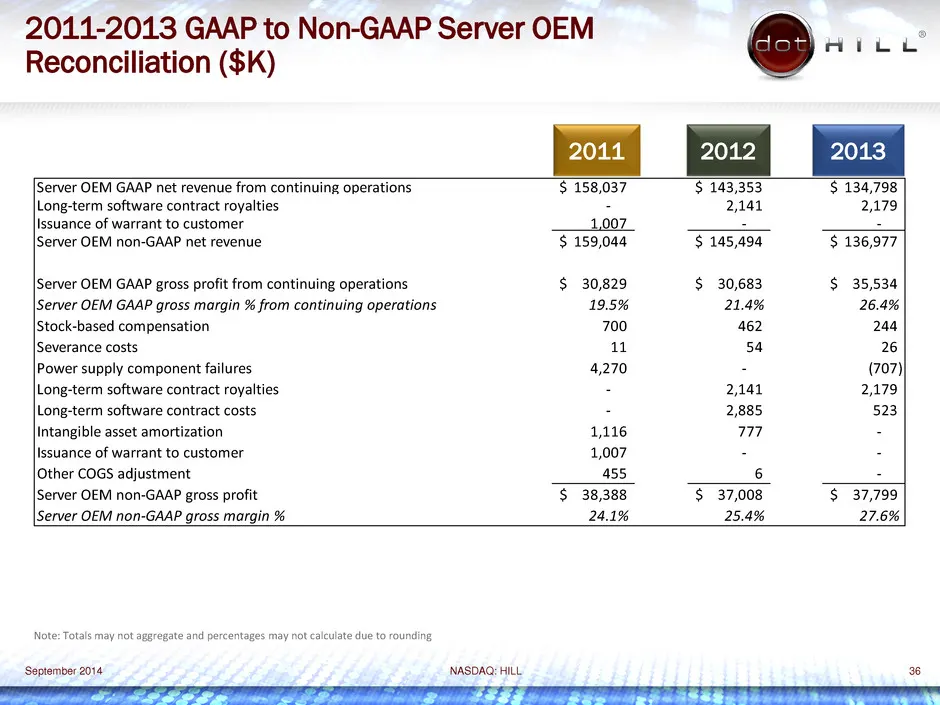
Slide 36: 2011-2013 GAAP to Non-GAAP Server OEM
2011-2013 GAAP to Non-GAAP Server OEM pee Hive Reconciliation ($K) 2011 2013 [Server OEM GAAP net revenue from continuing operations $ 158,037 $ 143,353 $ 134,798 Long-term software contract royalties s 41 Issuance of warrant to customer 1,007 = Server OEM non-GAAP net revenue $ 159,044 $ 145,494 $
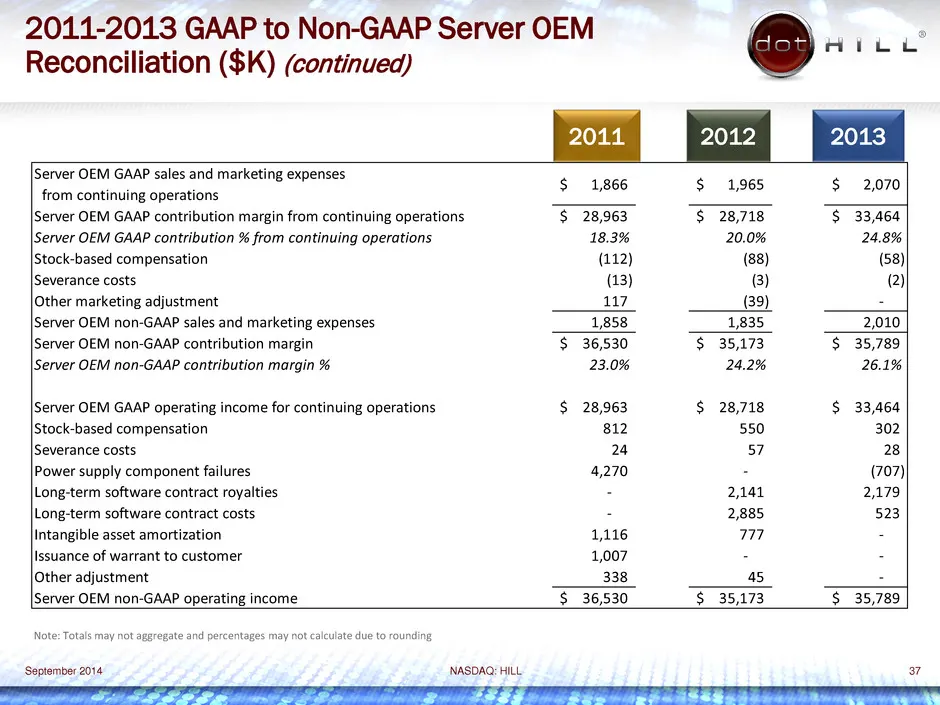
Slide 37: 2011-2013 GAAP to Non-GAAP Server OEM
2011-2013 GAAP to Non-GAAP Server OEM pee 2 Hicu Reconciliation ($K) (continued) [Server OEM GAAP sales and marketing expenses $ $ f96s $ aor from continuing operations Server OEM GAAP ibutic ft $ $ 28,718 $ 33,464 |Server OEM GAAP contribution % from continuing operations 20.0% 24.8% IStock-based c
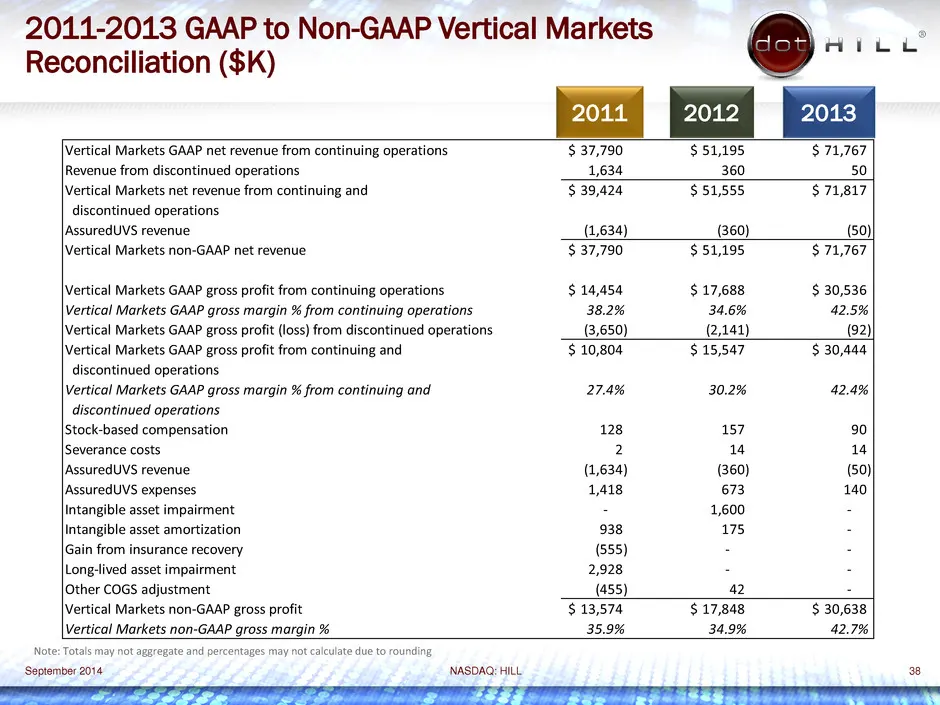
Slide 38: 2011-2013 GAAP to Non-GAAP Vertical Markets
2011-2013 GAAP to Non-GAAP Vertical Markets have AYTLE Reconciliation ($K) 2011 fm 2012 Vertical ti $ 37,790 $51,195 $71,767 Revenue from discontinued operations 1,634 360 50 Vertical Markets net revenue from continuing and $ 39,424 $51,555 $71,817 discontinued operations |AssuredUVS revenue (1,634)
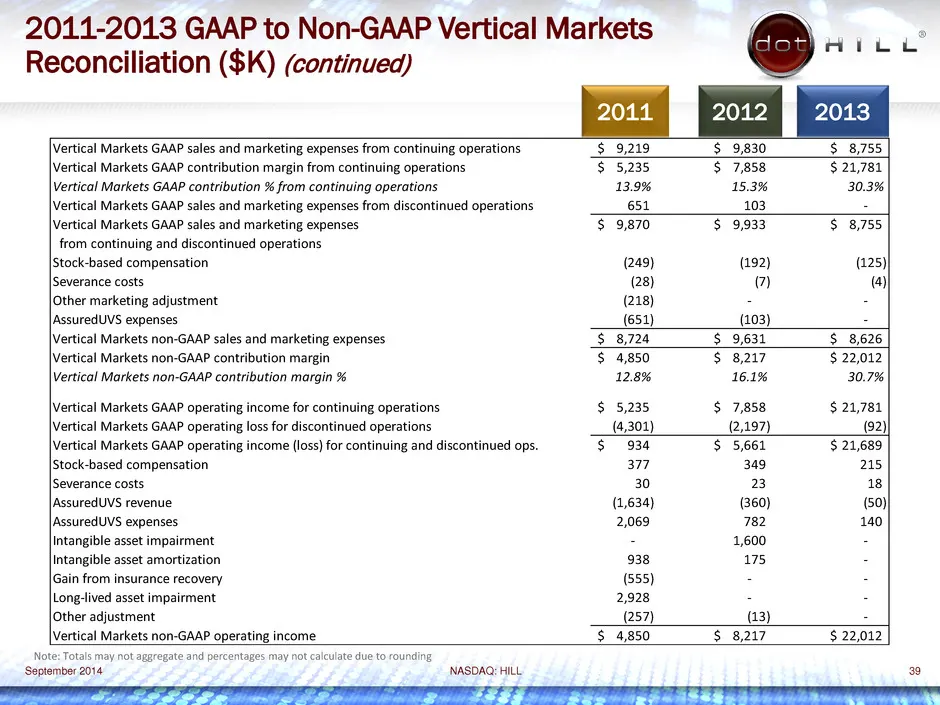
Slide 39: 2011-2013 GAAP to Non-GAAP Vertical Markets
2011-2013 GAAP to Non-GAAP Vertical Markets Reconciliation ($K) (continued) Hite $9,219 $9,830 $8,755 $5,235 S$ 7,858 $21,781 3.9% 5.3% 30.3% 651 103 E $ 9,870 $ 9,933 $ 8,755 from continuing and discontinued operations |Stock-based compensation (249) (192) (225) Severance costs (28) (7) @) lOther m
Slide 40: 2011-2013 GAAP to Non-GAAP Corporate Segment
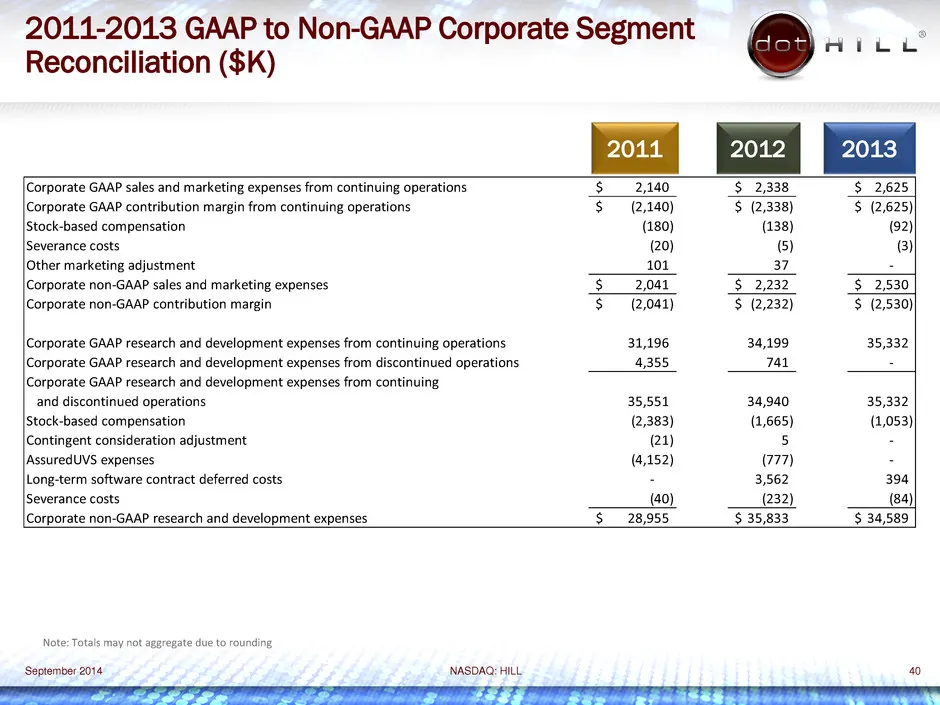
2011-2013 GAAP to Non-GAAP Corporate Segment Pca Hice Reconciliation ($K) 2011 2012 2013 Conn $2,140 “$2,338 “$_ 2,625 | $ (2,140) $ (2,338) $ (2,625) Stock-based compensation (180) (138) (92) ‘Severance costs (20) (5) (3) (Other marketing adjustment 101 37 : sales an 2,041 $2,232 Corporate non-GAAP
Slide 41: 2011-2013 GAAP to Non-GAAP Corporate Segment
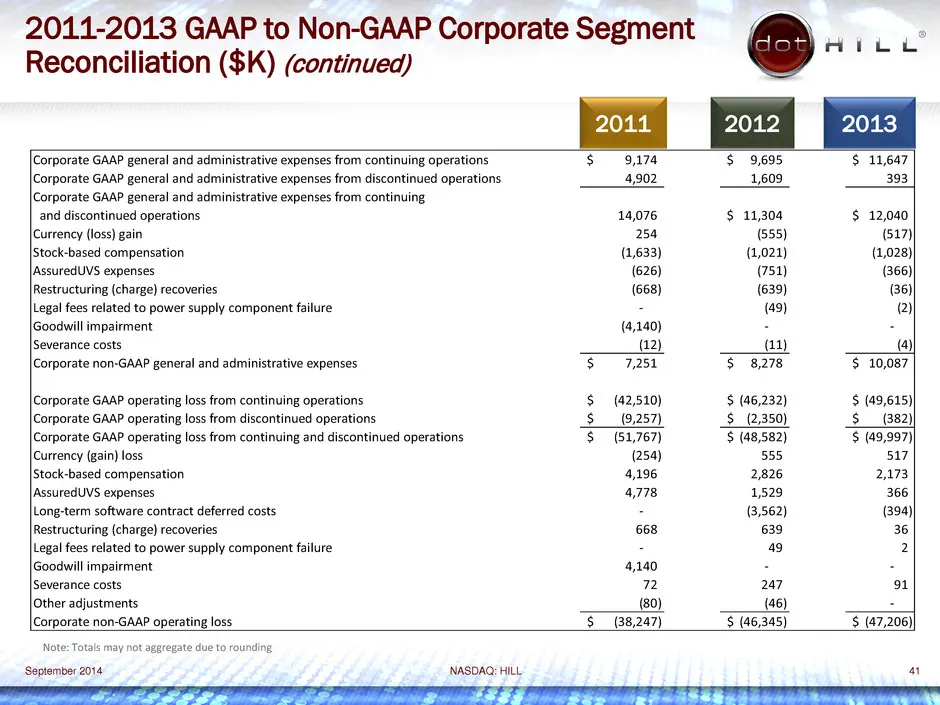
2011-2013 GAAP to Non-GAAP Corporate Segment gee 2 Aaiee Reconciliation ($K) (continued) PS $ 9,174 $ 9,695 $ 11,647 said dlecontinusd operations 14,076 $ 11,304 $ 12,040 Currency (loss) gain 254 (555) (517) |Stock-based compensation (1,633) (1,021) (1,028)| |AssuredUVS expenses ( (751) Restructurin
Slide 42: Trailing Months GAAP to Non-GAAP
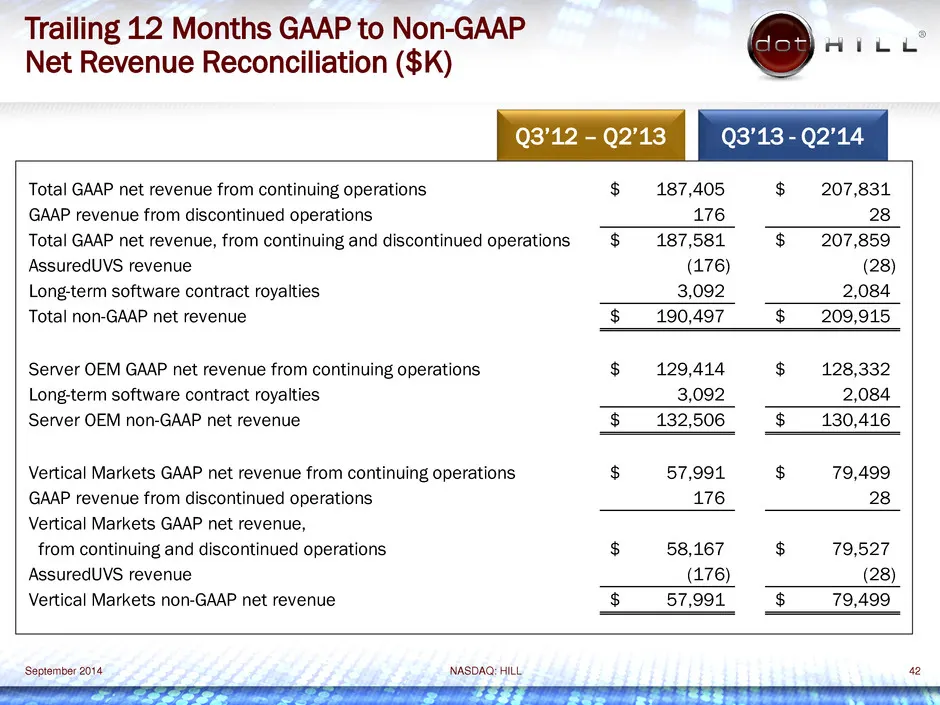
Trailing 12 Months GAAP to Non-GAAP 8 a Net Revenue Reconciliation ($K) Q3 13 Q3’13 - Q: Total GAAP net revenue from continuing operations $ 187,405 $ 207,831 GAAP revenue from discontinued operations 176 28 Total GAAP net revenue, from continuing and discontinued operations $ 187,581 $ 207,859 Assu
Slide 43: Trailing Months GAAP to Non-GAAP
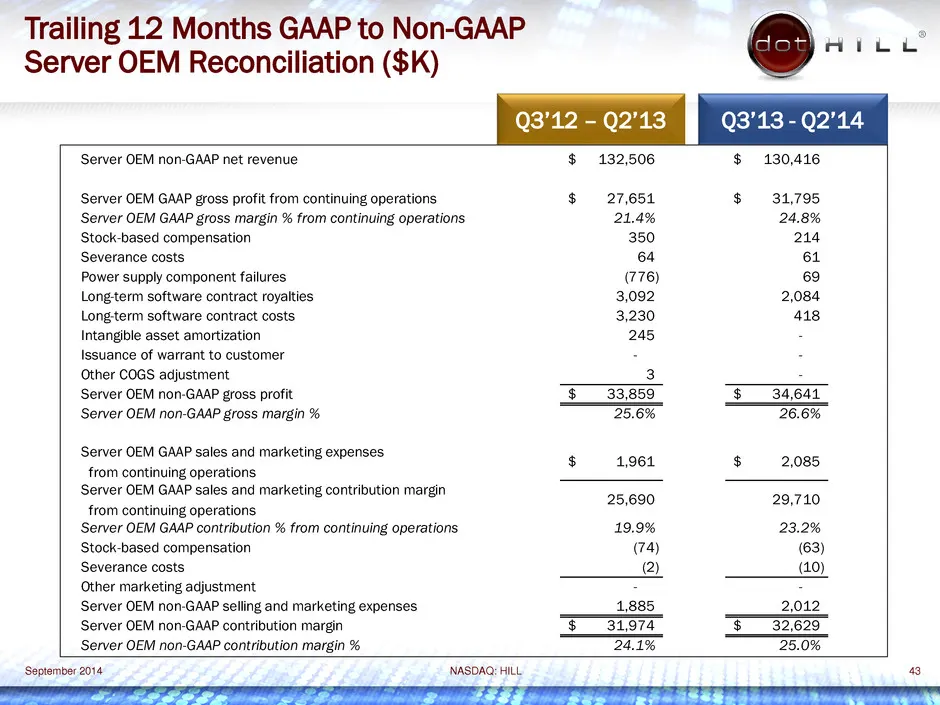
Trailing 12 Months GAAP to Non-GAAP Server OEM Reconciliation ($K) Q3’12 - Q2’13 ‘Server OEM non-GAAP net revenue $ 132,506 Server OEM GAAP gross profit from continuing operations $ 27,654 Server margin % 21.4% ‘Stock-based compensation 350 Severance costs 64 Power supply component failures (776) Lo
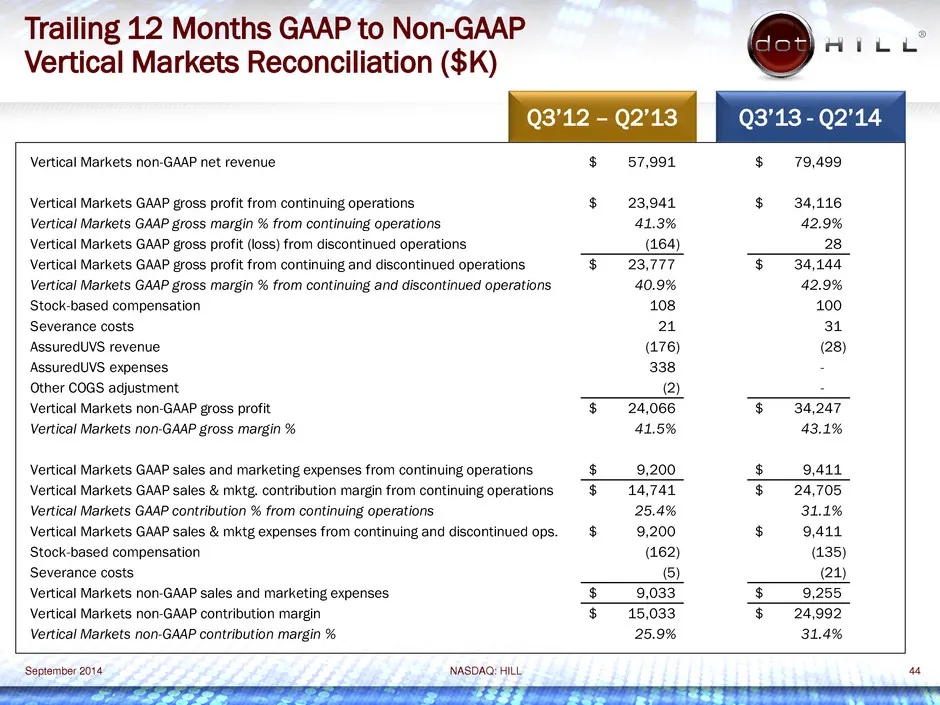
Slide 44: Trailing Months GAAP to Non-GAAP
Trailing 12 Months GAAP to Non-GAAP f (ri Aice Vertical Markets Reconciliation ($K) Q3’12 - Q2'13 Q3’13 - Q2’14 Vertical Markets non-GAAP net revenue $ 57,991 $ 79,499 profit $ 23,941 $ 34,116 in % ir 41.3% 42.9% (164) ‘BF0SS pr it i ir $ 23,777 $ 34,144 % 40.9% 42.9% Stock-based compensation 108 10

Slide 45: @-.-- ® oe
@-.-- ® oe
Source: SEC EDGAR · 8-K filed Sep 22, 2014
More decks from Dot Hill Systems Corp
 Q2 2015 Earnings Presentation27 slides · Aug 6, 2015
 Investor Presentation (May 2015)58 slides · May 12, 2015
 Q1 2015 Earnings Presentation13 slides · May 7, 2015
 Investor Presentation (March 2015)15 slides · Mar 5, 2015
 Investor Presentation (January 2015)49 slides · Jan 12, 2015
 Investor Presentation (November 2014)47 slides · Nov 10, 2014