Chittenden — Investor Presentation (January 2004)
16 slides from Chittenden's investor presentation, Jan 29, 2004

Slide 1: Chittenden
Chittarden ‘As of December 31, 2003
Slide 2: A Compelling Story
A Compelling Story Š Recognized competency in an attractive business mix Š Strategic acquisitions which provide strong earnings growth Š Low risk execution orientation provides an understandable opportunity Š Proven leadership provides aggressive focus to achieve superior financial results Š Well es
Slide 3: Loans and Deposits by State
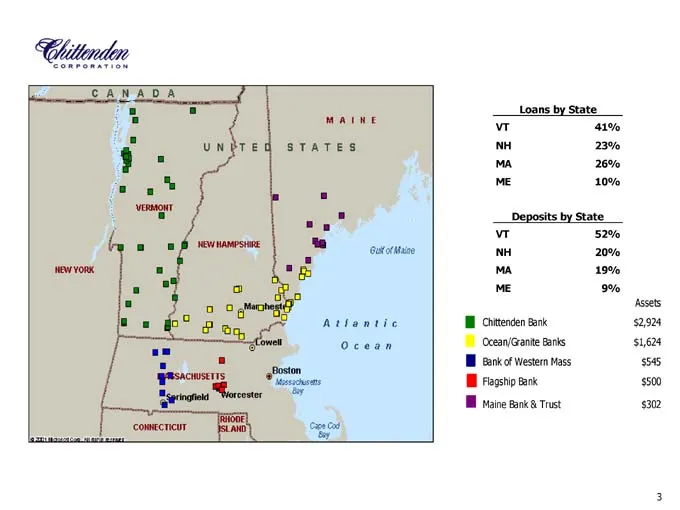
Loans by State VT 41% NH 23% MA 26% ME 10% Deposits by State VT 52% NH 20% MA 19% ME 9% Assets Chittenden Bank $ 2,924 Ocean/Granite Banks $ 1,624 Bank of Western Mass $ 545 Flagship Bank $ 500 Maine Bank & Trust $ 302
Slide 4: Strategic Direction
Strategic Direction • Continue to expand the existing franchise and our fee based businesses • Pursue acquisitions of banks and financial services companies Acquisition Strategy • Chittenden Corporation operates as a multi-bank holding company with significant operating autonomy at its banks. • Prim
Slide 5: Business Approach
Business Approach Š Deep relationships with worthwhile customers Š Focus on small and mid-sized businesses Š Maintain conservative underwriting standards and discipline Š Offer a complete range of banking products and services Š Geographically diverse branch franchise with both a consumer and small
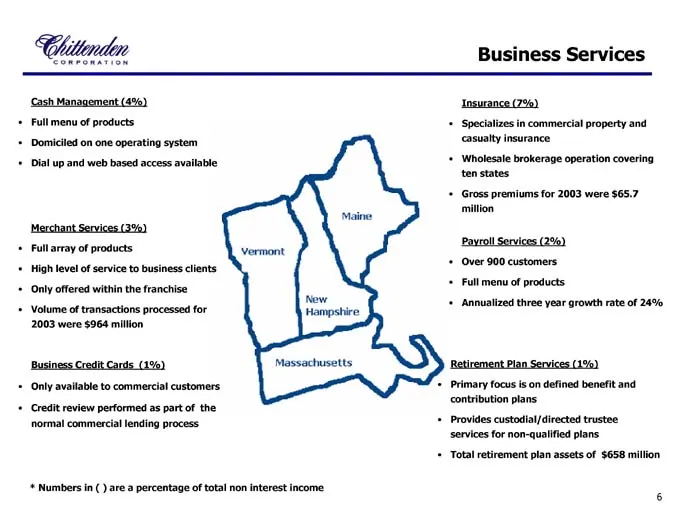
Slide 6: Business Services
Business Services Cash Management (4%) • Full menu of products • Domiciled on one operating system • Dial up and web based access available Merchant Services (3%) • Full array of products • High level of service to business clients • Only offered within the franchise • Volume of transactions process
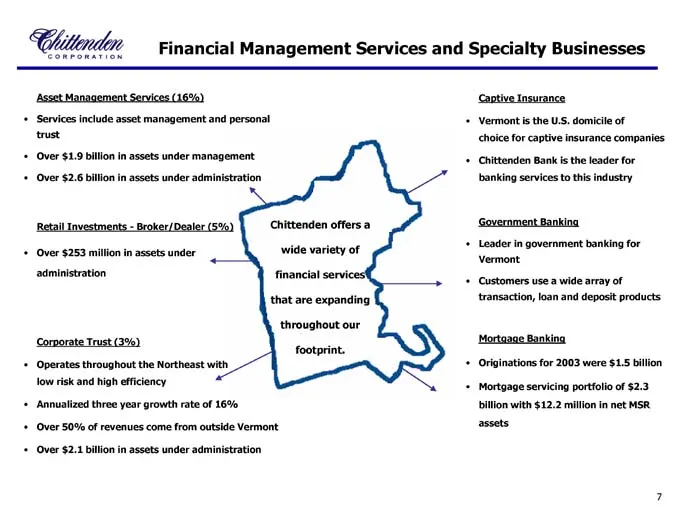
Slide 7: Financial Management Services and Specialty Businesses
Financial Management Services and Specialty Businesses Asset Management Services (16%) • Services include asset management and personal trust • Over $1.9 billion in assets under management • Over $2.6 billion in assets under administration Retail Investments—Broker/Dealer (5%) • Over $253 million in
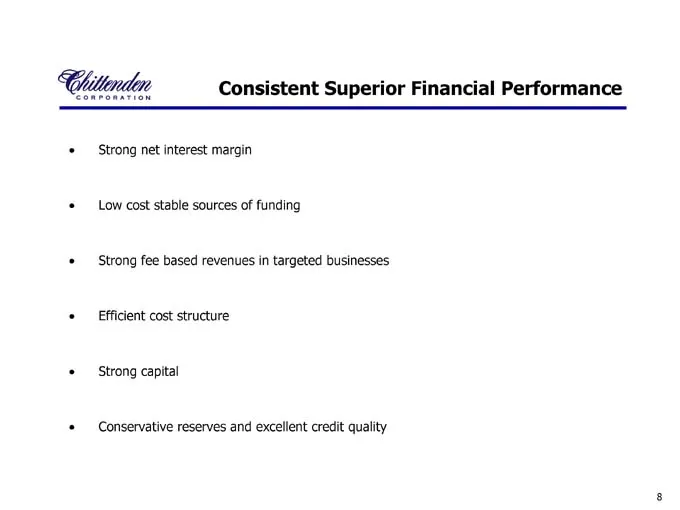
Slide 8: Consistent Superior Financial Performance
Consistent Superior Financial Performance Š Strong net interest margin Š Low cost stable sources of funding Š Strong fee based revenues in targeted businesses Š Efficient cost structure Š Strong capital Š Conservative reserves and excellent credit quality
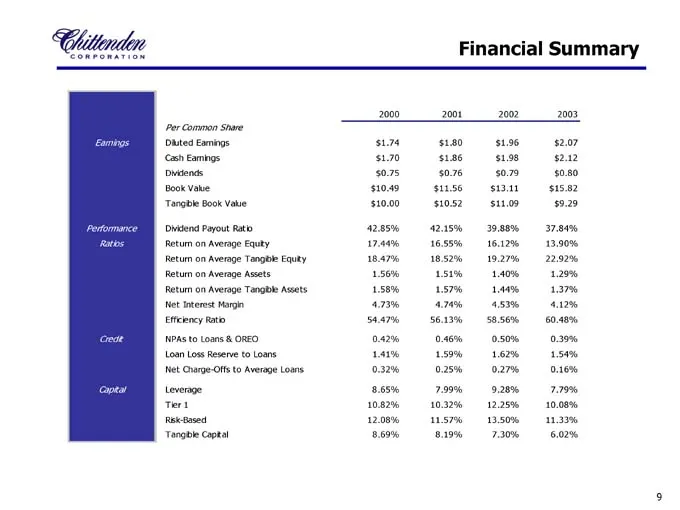
Slide 9: Financial Summary
Financial Summary 2000 2001 2002 2003 Per Common Share Earnings Diluted Earnings $ 1.74 $ 1.80 $ 1.96 $ 2.07 Cash Earnings $ 1.70 $ 1.86 $ 1.98 $ 2.12 Dividends $ 0.75 $ 0.76 $ 0.79 $ 0.80 Book Value $ 10.49 $ 11.56 $ 13.11 $ 15.82 Tangible Book Value $ 10.00 $ 10.52 $ 11.09 $ 9.29 Performance Divid
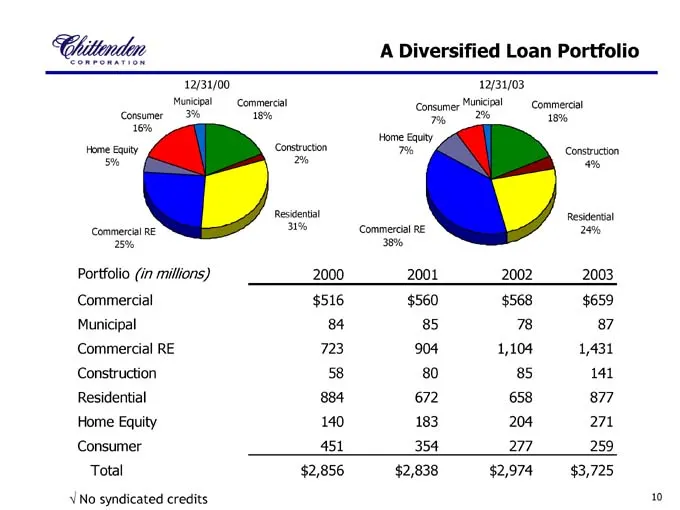
Slide 10: A Diversified Loan Portfolio
A Diversified Loan Portfolio Portfolio (in millions) 2000 2001 2002 2003 Commercial $ 516 $ 560 $ 568 $ 659 Municipal 84 85 78 87 Commercial RE 723 904 1,104 1,431 Construction 58 80 85 141 Residential 884 672 658 877 Home Equity 140 183 204 271 Consumer 451 354 277 259 Total $ 2,856 $ 2,838 $ 2,974
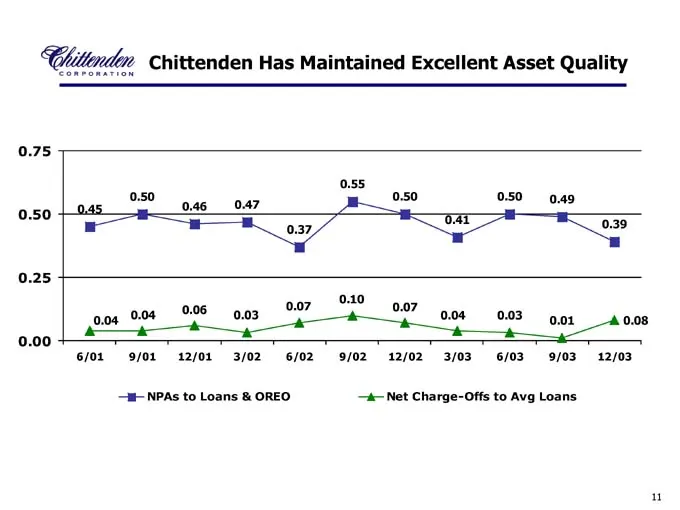
Slide 11: Chittenden Has Maintained Excellent Asset Quality
Chittenden Has Maintained Excellent Asset Quality NPAs to Loans & OREO Net Charge-Offs to Avg Loans
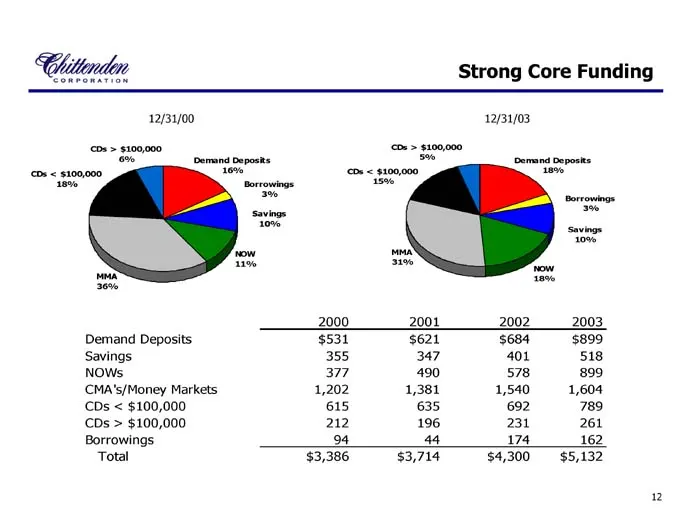
Slide 12: Strong Core Funding
Strong Core Funding 2000 2001 2002 2003 Demand Deposits $ 531 $ 621 $684 $899 Savings 355 347 401 518 NOWs 377 490 578 899 CMA’s/Money Markets 1,202 1,381 1,540 1,604 CDs < $ 100,000 615 635 692 789 CDs > $ 100,000 212 196 231 261 Borrowings 94 44 174 162 Total $ 3,386 $ 3,714 $ 4,300 $ 5,132
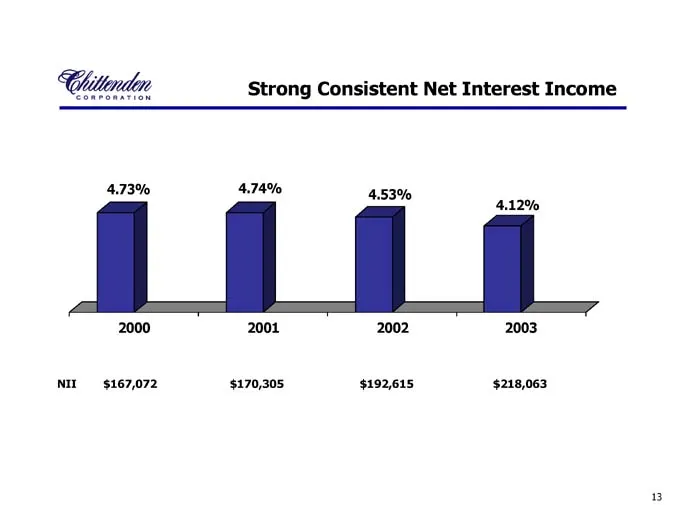
Slide 13: Strong Consistent Net Interest Income
Strong Consistent Net Interest Income NII $167,072 $170,305 $192,615 $218,063
Slide 14: A Strong Diversified Stream of Noninterest Income
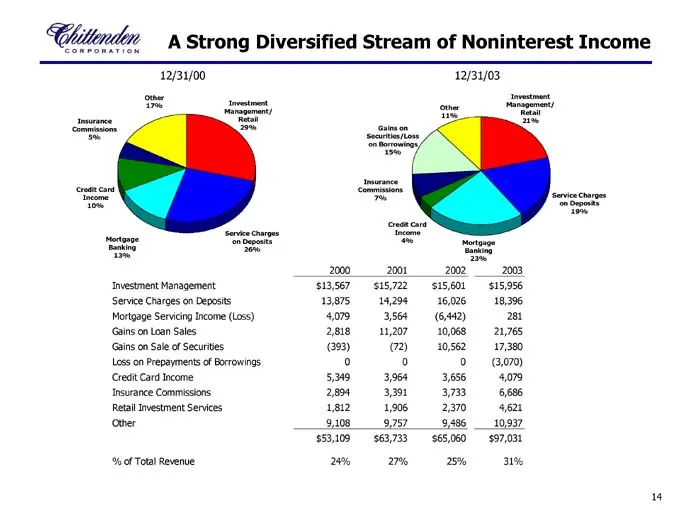
A Strong Diversified Stream of Noninterest Income 2000 2001 2002 2003 Investment Management $ 13,567 $ 15,722 $ 15,601 $ 15,956 Service Charges on Deposits 13,875 14,294 16,026 18,396 Mortgage Servicing Income (Loss) 4,079 3,564 (6,442) 281 Gains on Loan Sales 2,818 11,207 10,068 21,765 Gains on Sal
Slide 15: Strong market share and proven acquisition acumen
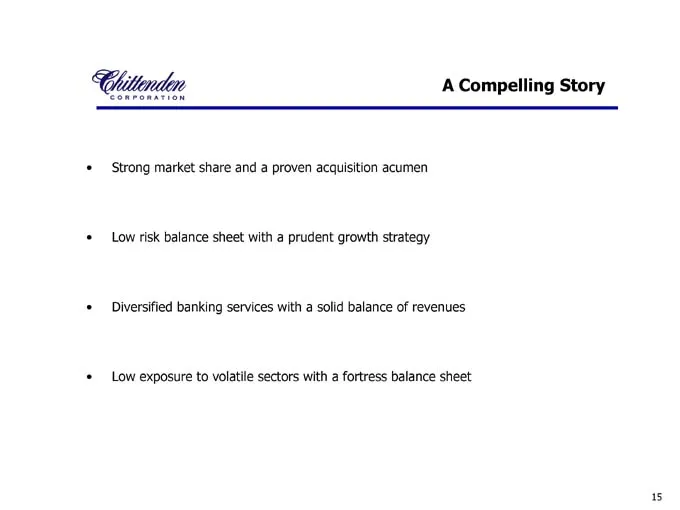
• Strong market share and a proven acquisition acumen • Low risk balance sheet with a prudent growth strategy • Diversified banking services with a solid balance of revenues • Low exposure to volatile sectors with a fortress balance sheet
Slide 16: Visit our website
Visit our website for a wide range of products, latest financial reports and many other interactive services: www.chittendencorp.com This presentation contains “forward-looking statements” which may describe future plans and strategic initiatives. These forward-looking statements are based on curren
Source: SEC EDGAR · 8-K filed Jan 29, 2004
More decks from Chittenden Corp
 Investor Presentation (September 2007)38 slides · Sep 7, 2007
 Merger or Acquisition (June 2007)27 slides · Jun 27, 2007
 Chittenden — Merger or Acquisition (June 2007)25 slides · Jun 27, 2007
 Merger or Acquisition (June 2007)9 slides · Jun 5, 2007
 Investor Presentation (May 2007)36 slides · May 14, 2007
 Investor Presentation (February 2007)37 slides · Feb 16, 2007