PetroQuest Energy — Raymond James 27th Annual Institutional Investors Conference (March 2006)
28 slides from PetroQuest Energy's conference presentation, Mar 7, 2006
Slide 1: Raymond James 27th Annual Institutional Investors Conference
March 8, 2006 Raymond James 27th Annual Institutional Investors Conference
Slide 2: Opening Remarks
Opening Remarks 400 East Kaliste Saloom Road, Suite 6000 Lafayette, Louisiana 70508 Phone: (337) 232-7028 Fax: (337) 232-0044 www.petroquest.com NYSE: PQ Corporate Contact: Todd Zehnder The information presented herein may contain predictions, estimates and other forward-looking statements within th
Slide 3: Corporate Characteristics
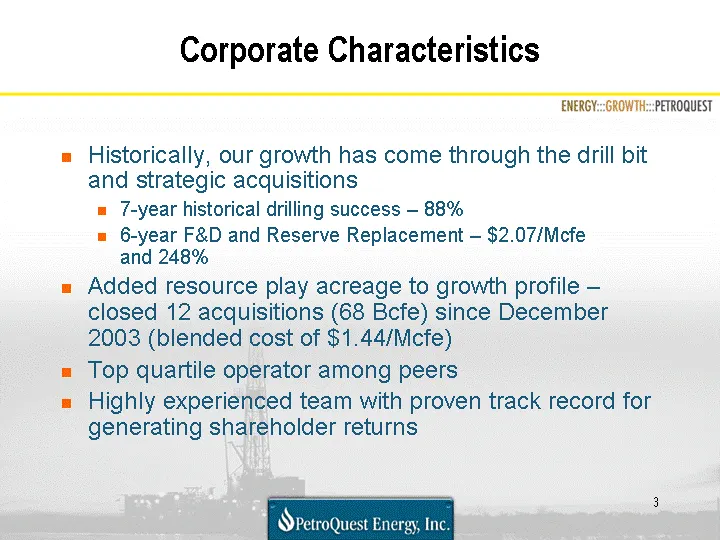
Corporate Characteristics Historically, our growth has come through the drill bit and strategic acquisitions 7-year historical drilling success - 88% 6-year F&D and Reserve Replacement - $2.07/Mcfe and 248% Added resource play acreage to growth profile - closed 12 acquisitions (68 Bcfe) since Decemb
Slide 4: Adding Up Our Milestones
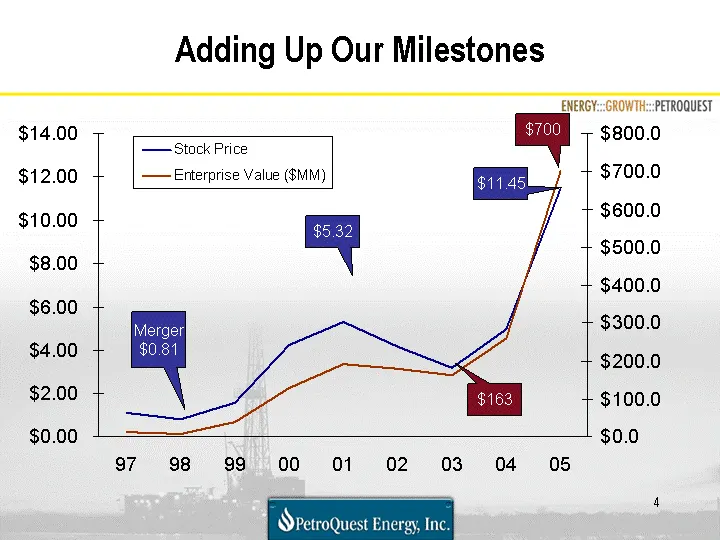
97 98 99 00 01 02 03 04 05 Stock Price 1.12 0.81 1.59 4.25 5.32 4.15 3.17 4.96 11.45 9 Enterprise Value ($MM) 11.5 7.8 37.9 127.8 190.9 179.1 162.6 258.6 700 530 Adding Up Our Milestones Merger $0.81 $5.32 $700 $163 $11.45
Slide 5: Seven Years of Growth
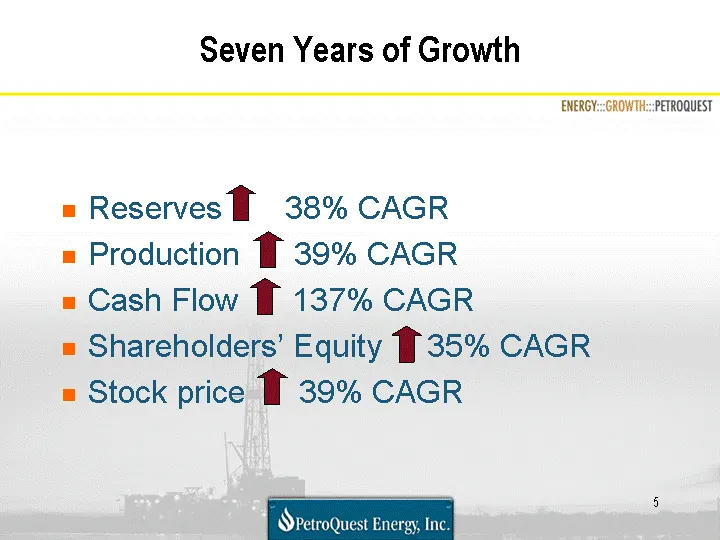
Seven Years of Growth Reserves 38% CAGR Production 39% CAGR Cash Flow 137% CAGR Shareholders' Equity 35% CAGR Stock price 39% CAGR
Slide 6: Company Growth Strategy
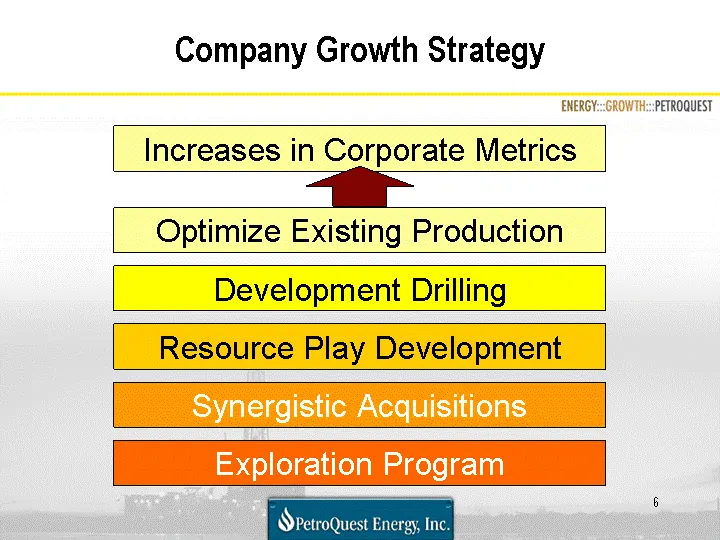
Company Growth Strategy Optimize Existing Production Development Drilling Resource Play Development Synergistic Acquisitions Exploration Program Increases in Corporate Metrics
Slide 7: Our Properties
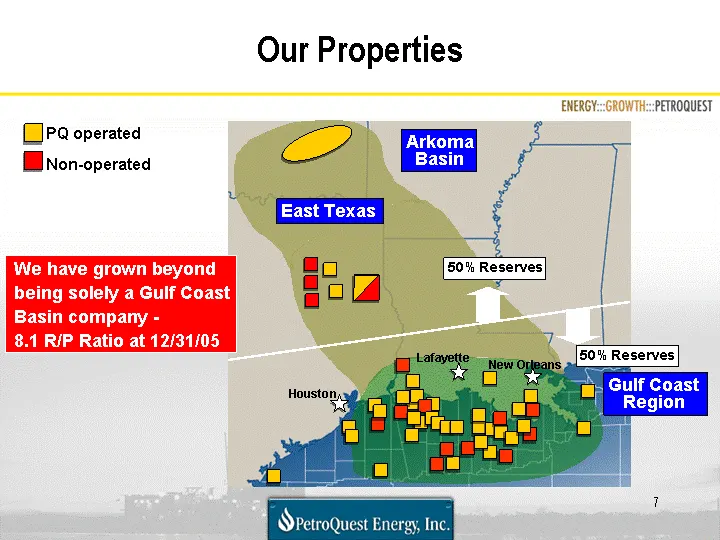
Our Properties Arkoma Basin East Texas Gulf Coast Region Lafayette Houston New Orleans PQ operated We have grown beyond being solely a Gulf Coast Basin company - 8.1 R/P Ratio at 12/31/05 50% Reserves 50% Reserves
Slide 8: Our Portfolio
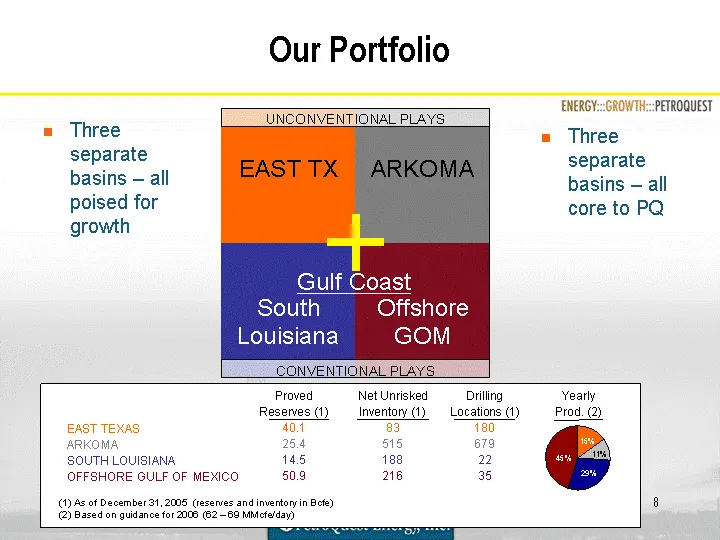
EAST TX ARKOMA South Louisiana Offshore GOM CONVENTIONAL PLAYS UNCONVENTIONAL PLAYS Proved Reserves (1) 40.1 25.4 14.5 50.9 Drilling Locations (1) 180 679 22 35 Yearly Prod. (2) EAST TEXAS ARKOMA SOUTH LOUISIANA OFFSHORE GULF OF MEXICO Our Portfolio Three separate basins - all poised for growth Thre
Slide 9: Propelling our Future Growth
Propelling our Future Growth Approximately 40% of projected reserve growth will come from new "resource" plays 50% of our reserves are in long-lived basins To date - 94% drill bit success rate in long-lived areas 30% of our daily production is from these areas Concentration in three core areas with
Slide 10: Arkoma Basin
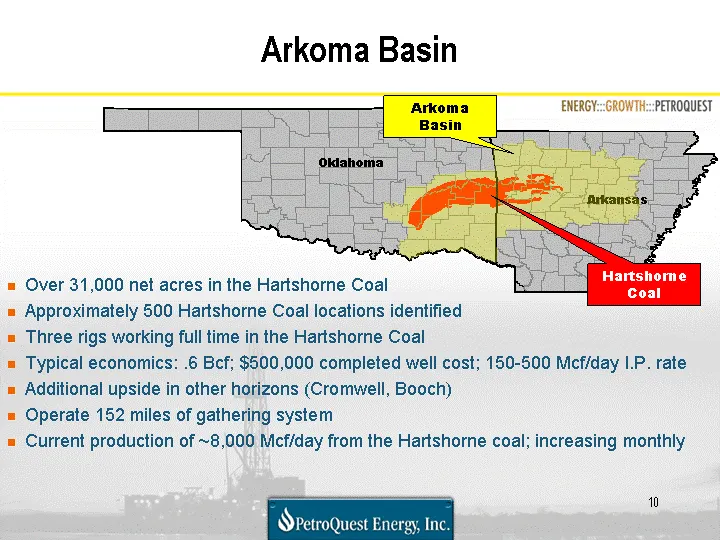
Arkoma Basin Oklahoma Arkansas Over 31,000 net acres in the Hartshorne Coal Approximately 500 Hartshorne Coal locations identified Three rigs working full time in the Hartshorne Coal Typical economics: .6 Bcf; $500,000 completed well cost; 150-500 Mcf/day I.P. rate Additional upside in other horizon
Slide 11: Arkoma Basin Horizontal Coal Bed Methane Well Economics
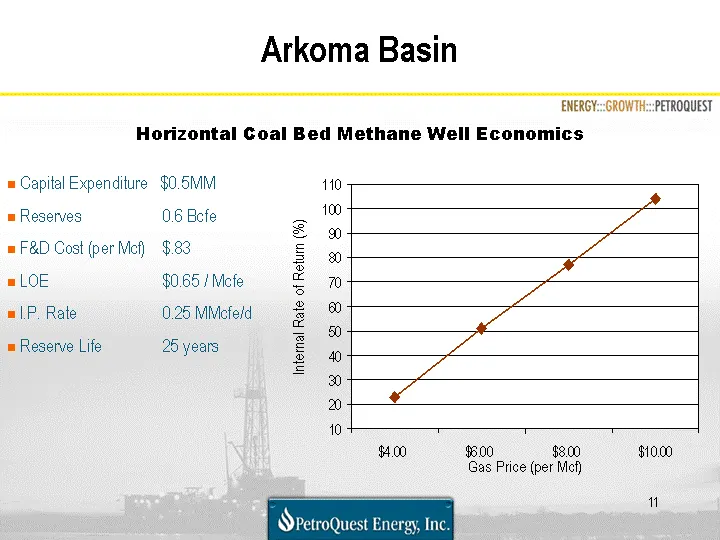
Arkoma Basin Horizontal Coal Bed Methane Well Economics Capital Expenditure $0.5MM Reserves 0.6 Bcfe F&D Cost (per Mcf) $.83 LOE $0.65 / Mcfe I.P. Rate 0.25 MMcfe/d Reserve Life 25 years 4 6 8 10 East 23 51 77 104 West 30.6 38.6 34.6 31.6 North 45.9 46.9 45 43.9 Internal Rate of Return (%) Gas Price
Slide 12: Arkoma Basin - Emerging Resource Play
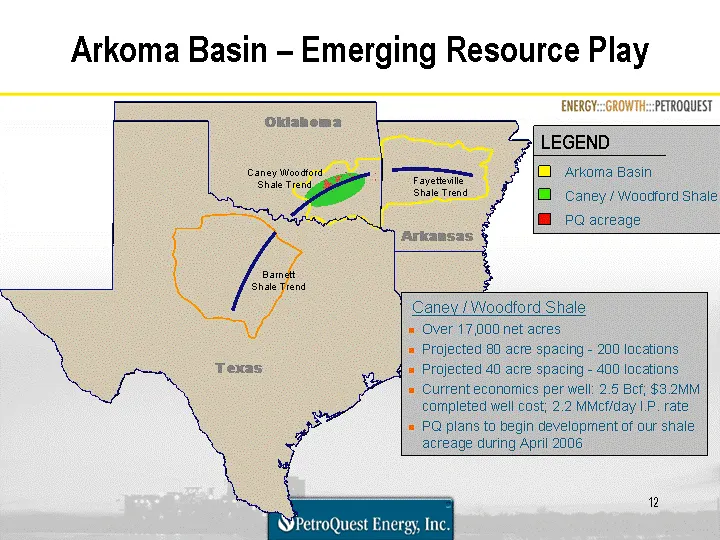
Arkoma Basin - Emerging Resource Play Arkoma Basin Caney / Woodford Shale PQ acreage LEGEND Caney Woodford Shale Trend Fayetteville Shale Trend Barnett Shale Trend Texas Oklahoma Louisiana Arkansas Caney / Woodford Shale Over 17,000 net acres Projected 80 acre spacing - 200 locations Projected 40 ac
Slide 13: East Texas Basin
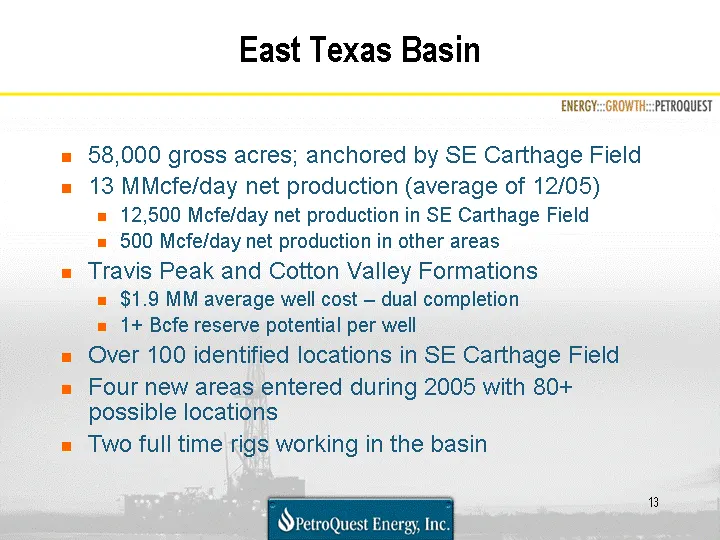
East Texas Basin 58,000 gross acres; anchored by SE Carthage Field 13 MMcfe/day net production (average of 12/05) 12,500 Mcfe/day net production in SE Carthage Field 500 Mcfe/day net production in other areas Travis Peak and Cotton Valley Formations $1.9 MM average well cost - dual completion 1+ Bcf
Slide 14: East Texas Basin
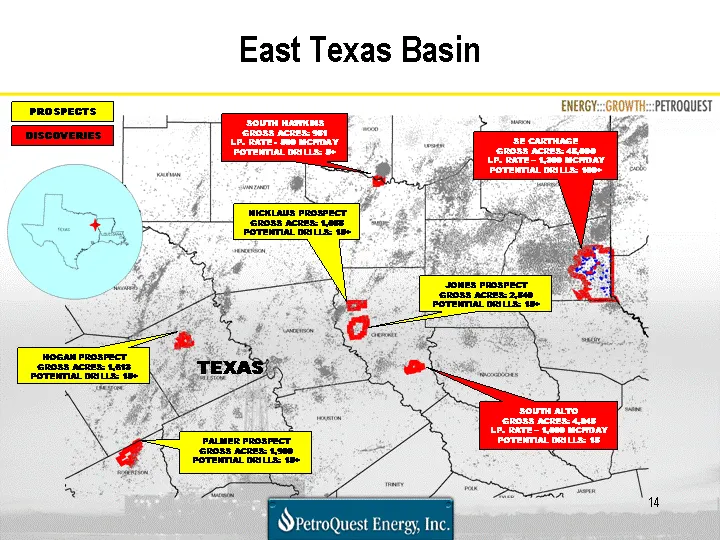
East Texas Basin East Texas Basin SE CARTHAGE GROSS ACRES: 45,000 I.P. RATE - 1,300 MCF/DAY POTENTIAL DRILLS: 100+ SOUTH HAWKINS GROSS ACRES: 951 I.P. RATE - 500 MCF/DAY POTENTIAL DRILLS: 5+ NICKLAUS PROSPECT GROSS ACRES: 1,055 POTENTIAL DRILLS: 15+ JONES PROSPECT GROSS ACRES: 2,540 POTENTIAL DRILLS
Slide 15: Carthage Field - Dual Completed Well Economics
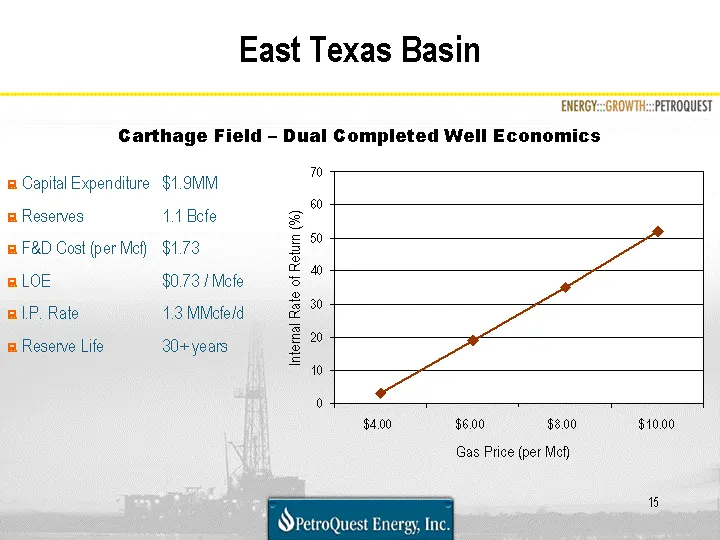
East Texas Basin 4 6 8 10 East 3 19 35 52 West 30.6 38.6 34.6 31.6 North 45.9 46.9 45 43.9 Capital Expenditure $1.9MM Reserves 1.1 Bcfe F&D Cost (per Mcf) $1.73 LOE $0.73 / Mcfe I.P. Rate 1.3 MMcfe/d Reserve Life 30+ years Internal Rate of Return (%) Gas Price (per Mcf) Carthage Field - Dual Complet
Slide 16: Resource Players Cash Flow Comparison
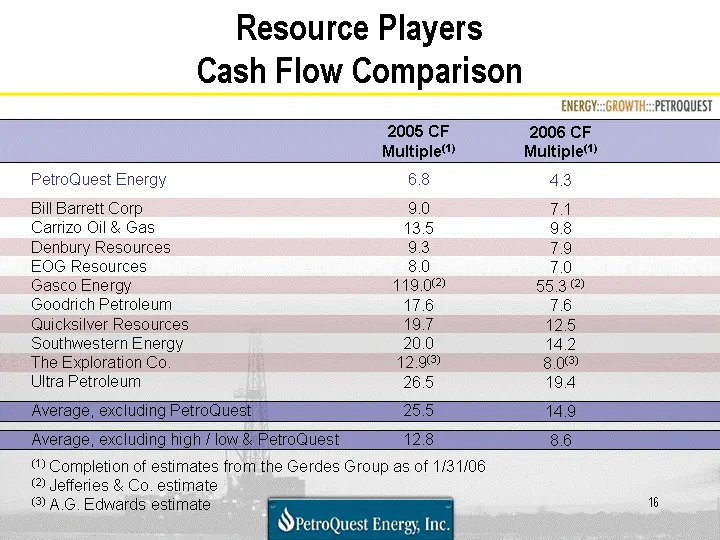
Resource Players Cash Flow Comparison PetroQuest Energy Bill Barrett Corp Carrizo Oil & Gas Denbury Resources EOG Resources Gasco Energy Goodrich Petroleum Quicksilver Resources Southwestern Energy The Exploration Co. Ultra Petroleum Average, excluding PetroQuest Average, excluding high / low & Petr
Slide 17: 2006 South Louisiana Drilling Program
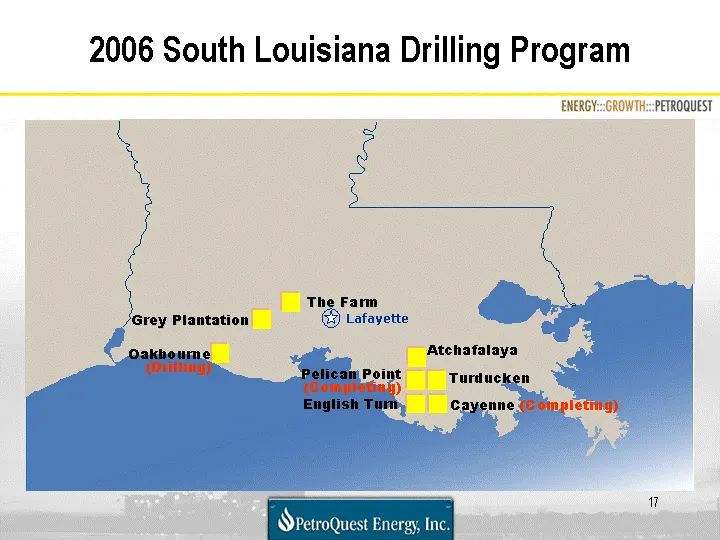
2006 South Louisiana Drilling Program 2006 South Louisiana Drilling Program Oakbourne (Drilling) Turducken Cayenne (Completing) The Farm Lafayette Pelican Point (Completing) Grey Plantation English Turn Atchafalaya
Slide 18: 2006 South Louisiana Drilling Program
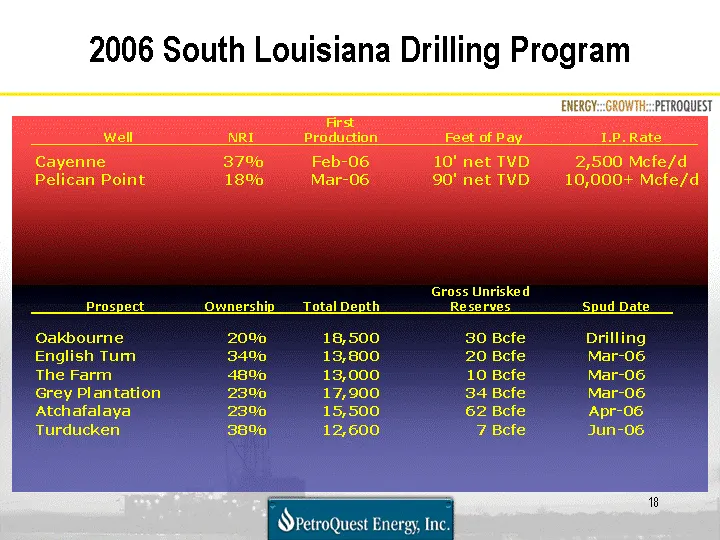
2006 South Louisiana Drilling Program
Slide 19: 2006 Gulf of Mexico Drilling Program
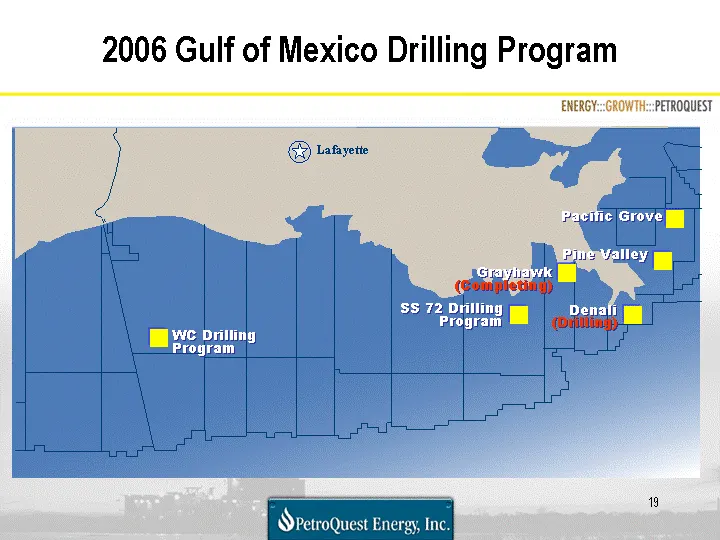
2006 Gulf of Mexico Drilling Program Pacific Grove Lafayette Grayhawk (Completing) Pine Valley Denali (Drilling) WC Drilling Program SS 72 Drilling Program
Slide 20: 2006 Gulf of Mexico Drilling Program
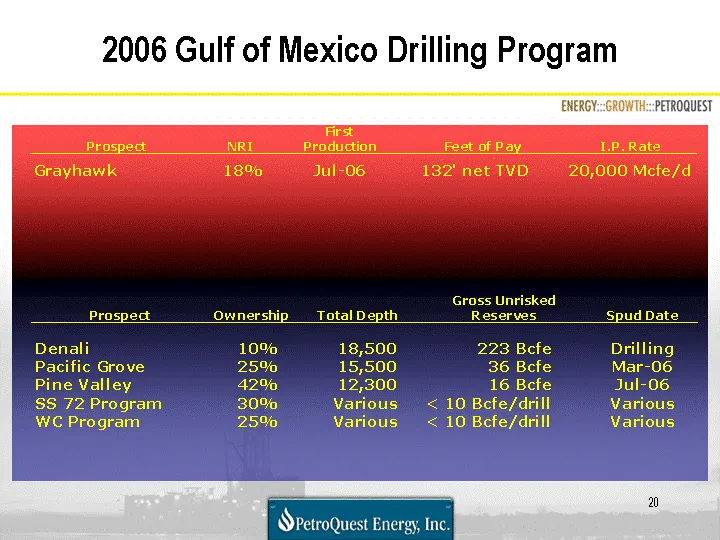
2006 Gulf of Mexico Drilling Program
Slide 21: Consistent Approach Generates Continued Growth
Consistent Approach Generates Continued Growth Economic reserve additions and production growth Effective cost control Balanced portfolio of projects Use acquisitions to augment future drilling program
Slide 22: Growth in Reserves
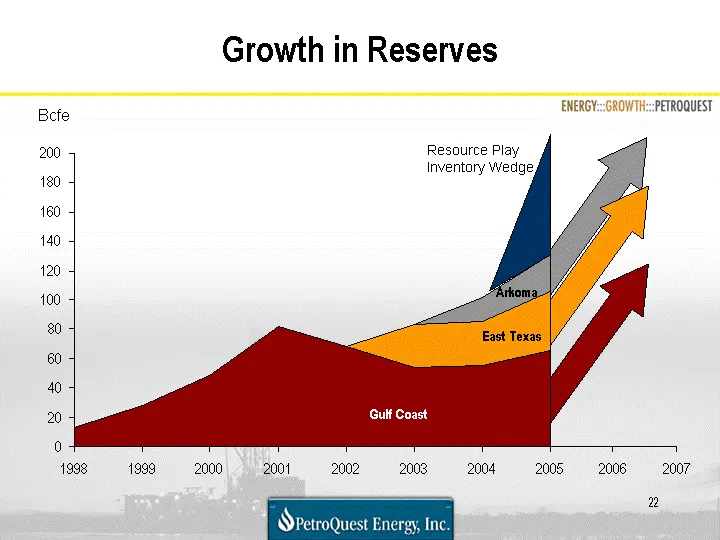
Growth in Reserves 1998 1999 2000 2001 2002 2003 2004 2005 2006 2007 East 13.585 28.289 48.824 82.225 68.685 54.31 55.507 65.427 West 28.951 29.385 40.098 North 16.463 25.447 Resource Play Inventory Wedge East Texas Arkoma Gulf Coast Bcfe 2006 2007
Slide 23: Cash Flow Growth
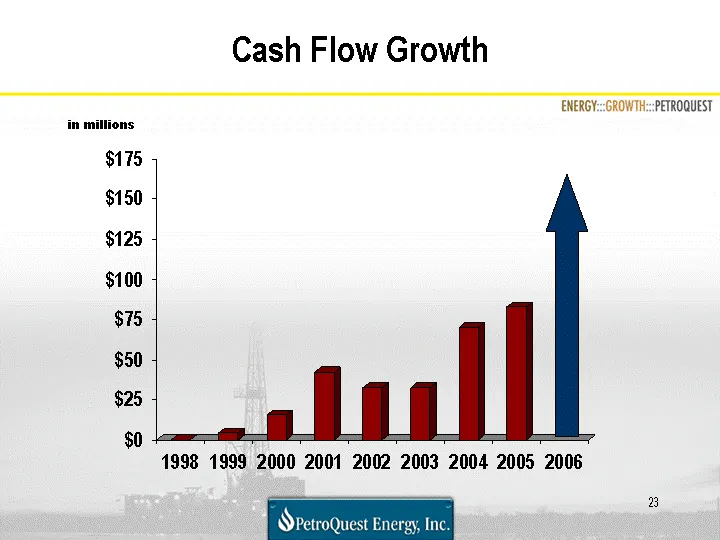
Cash Flow Growth 1998 1999 2000 2001 2002 2003 2004 2005 2006 East -960 4.59 15.926 42.317 32.813 32.915 70.31 83 West 38.6 34.6 31.6 North 46.9 45 43.9 in millions
Slide 24: Gross Margin
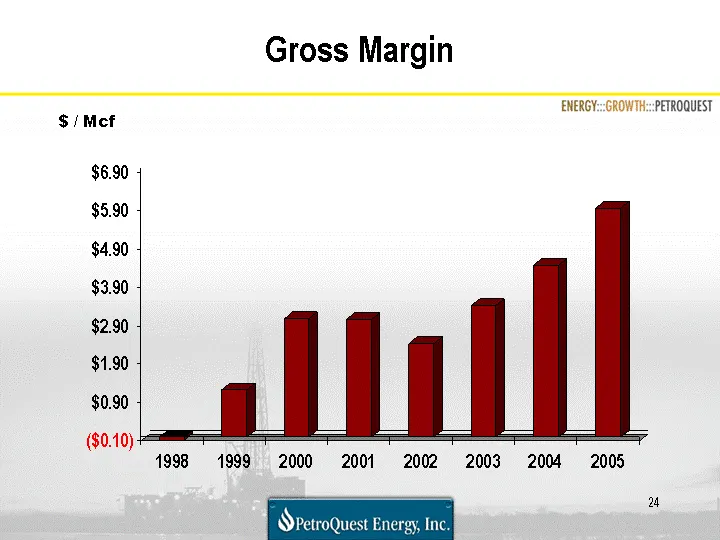
Gross Margin 1998 1999 2000 2001 2002 2003 2004 2005 East -0.07 1.23 3.08 3.06 2.44 3.43 4.47 5.97 West North $ / Mcf
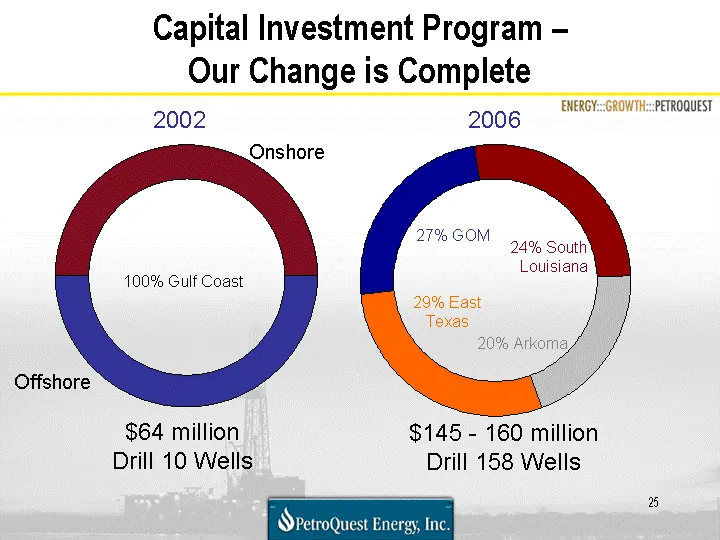
Slide 25: Capital Investment Program - Our Change is Complete
1st Qtr 2nd Qtr 3rd Qtr 4th Qtr East 29 24 27 20 West 30.6 38.6 34.6 31.6 North 45.9 46.9 45 43.9 Capital Investment Program - Our Change is Complete Onshore Offshore 100% Gulf Coast 29% East Texas 20% Arkoma 24% South Louisiana 27% GOM $145 - 160 million Drill 158 Wells $64 million Drill 10 Wells 2
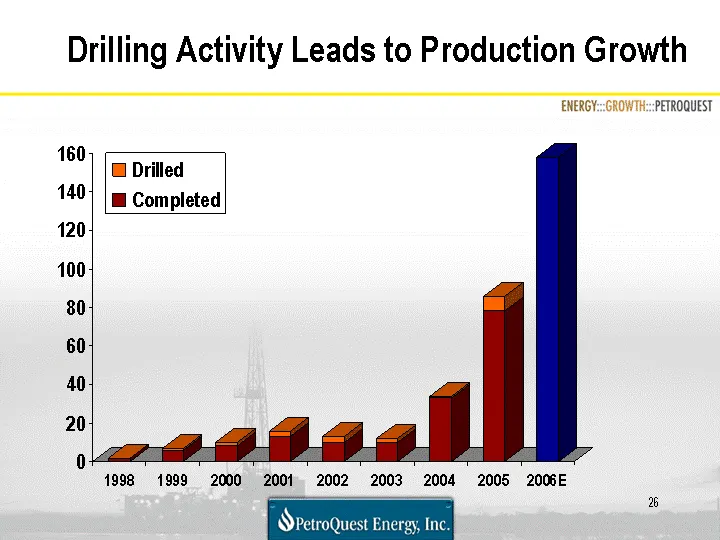
Slide 26: Drilling Activity Leads to Production Growth
Drilling Activity Leads to Production Growth 1998 1999 2000 2001 2002 2003 2004 2005 2006E Completed 2 6 8 13 10 10 33 78 158 Drilled 0 1 2 3 3 2 1 8 North
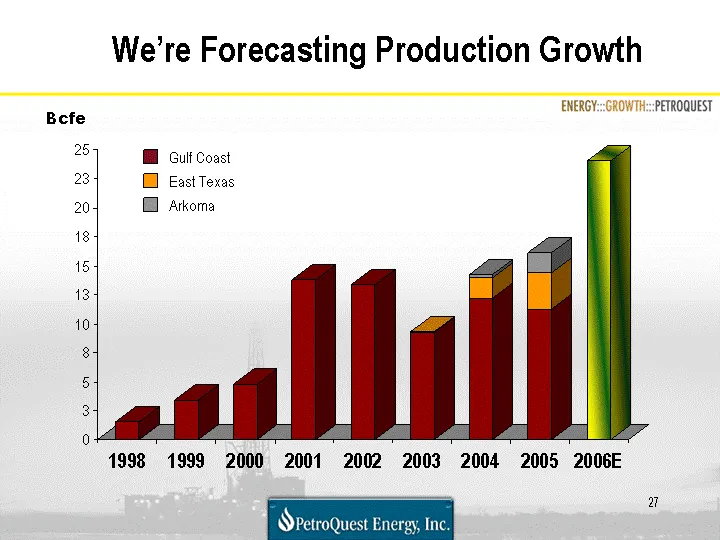
Slide 27: We're Forecasting Production Growth
We're Forecasting Production Growth 1998 1999 2000 2001 2002 2003 2004 2005 2006E Gulf Coast 1.553 3.461 4.848 13.774 13.34 9.267 12.206 11.3 24 East Texas 0.033 1.758 3.1 Arkoma 0.252 1.7 Gulf Coast East Texas Arkoma Bcfe
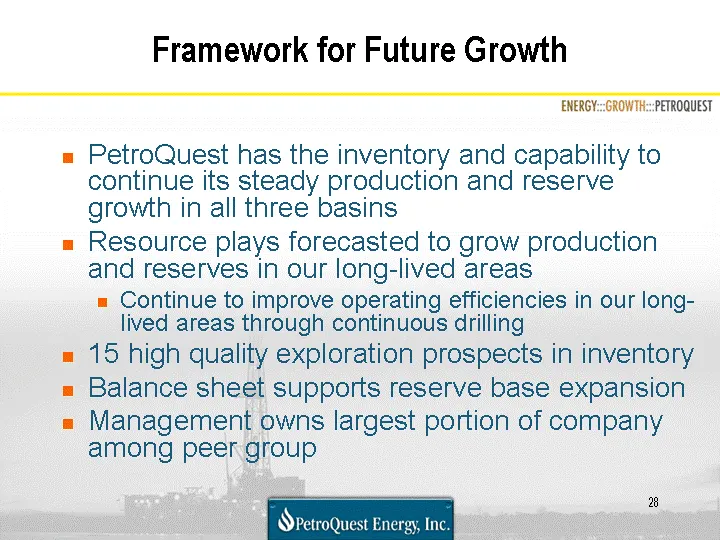
Slide 28: Framework for Future Growth
Framework for Future Growth PetroQuest has the inventory and capability to continue its steady production and reserve growth in all three basins Resource plays forecasted to grow production and reserves in our long-lived areas Continue to improve operating efficiencies in our long- lived areas throu
Source: SEC EDGAR · 8-K filed Mar 7, 2006
More decks from PetroQuest Energy Inc
 Corporate Update (June 2019)15 slides · Jun 19, 2019
 Investor Presentation (November 2018)16 slides · Nov 7, 2018
 Investor Presentation (July 2018)29 slides · Jul 10, 2018
 Investor Presentation (December 2017)6 slides · Dec 20, 2017
 Investor Presentation (January 2017)28 slides · Jan 9, 2017
 Investor Presentation (April 2016)29 slides · Apr 5, 2016