Home Loan Servicing Solutions Ltd
Home Loan Servicing Solutions — Debt Investor Presentation (October 2013)
41 slides from Home Loan Servicing Solutions's debt investor presentation, Oct 7, 2013
Slide 1: HLSS Servicer Advance Receivables Trust Investor Presentation
Exhibit 99.1 * * * * * * * TM **** HLSS Servicer Advance Receivables Trust Investor Presentation
Slide 2: Disclaimer
Disclaimer FORWARD-LOOKING STATEMENTS: THIS PRESENTATION CONTAINS FORWARD-LOOKING STATEMENTS THAT INVOLVE RISKS AND UNCERTAINTIES. ALL STATEMENTS IN THIS PRESENTATION OTHER THAN STATEMENTS OF HISTORICAL FACTS ARE FORWARD- LOOKING STATEMENTS. THESE FORWARD-LOOKING STATEMENTS ARE SUBJECT TO INHERENT R

Slide 3: Table of Contents
Table of Contents Agenda 1. HLSS Overview 2. Ocwen Overview 3. HSART Master Trust Overview 4. Appendices 3
Slide 4: HLSS Overview
HOME LOAN™ ieee SERVICING SOLUTIONS HLSS Overview
Slide 5: HLSS Overview
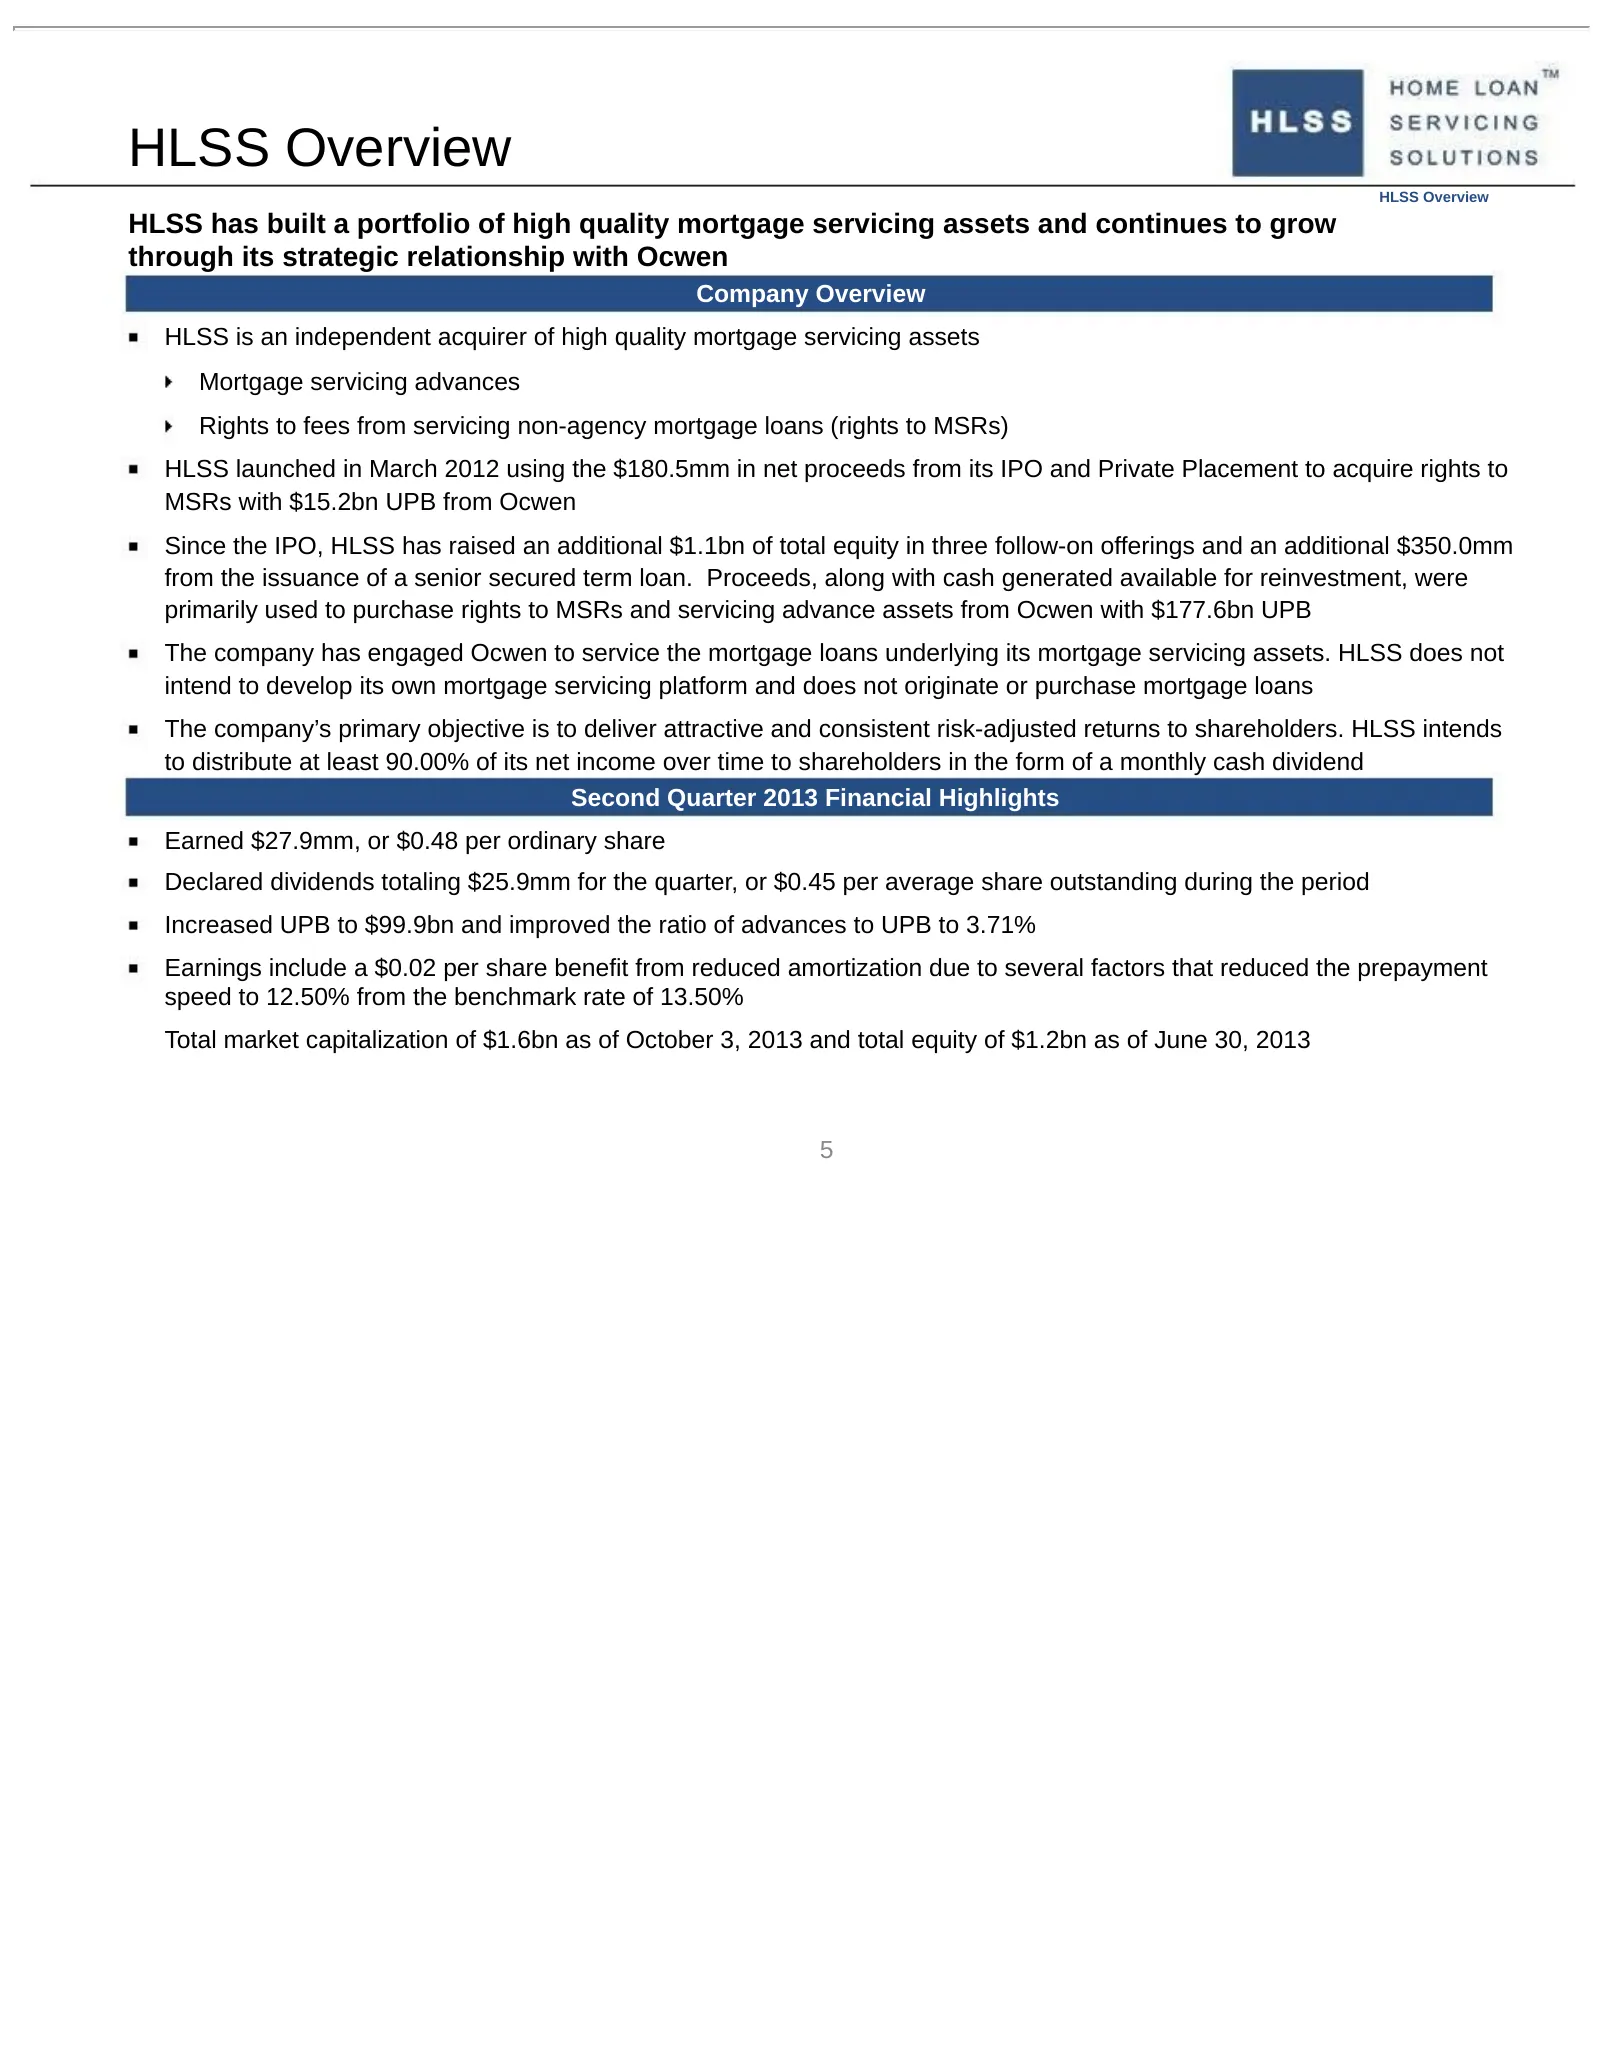
HLSS Overview HLSS Overview HLSS has built a portfolio of high quality mortgage servicing assets and continues to grow through its strategic relationship with Ocwen Company Overview HLSS is an independent acquirer of high quality mortgage servicing assets Mortgage servicing advances Rights to fees f
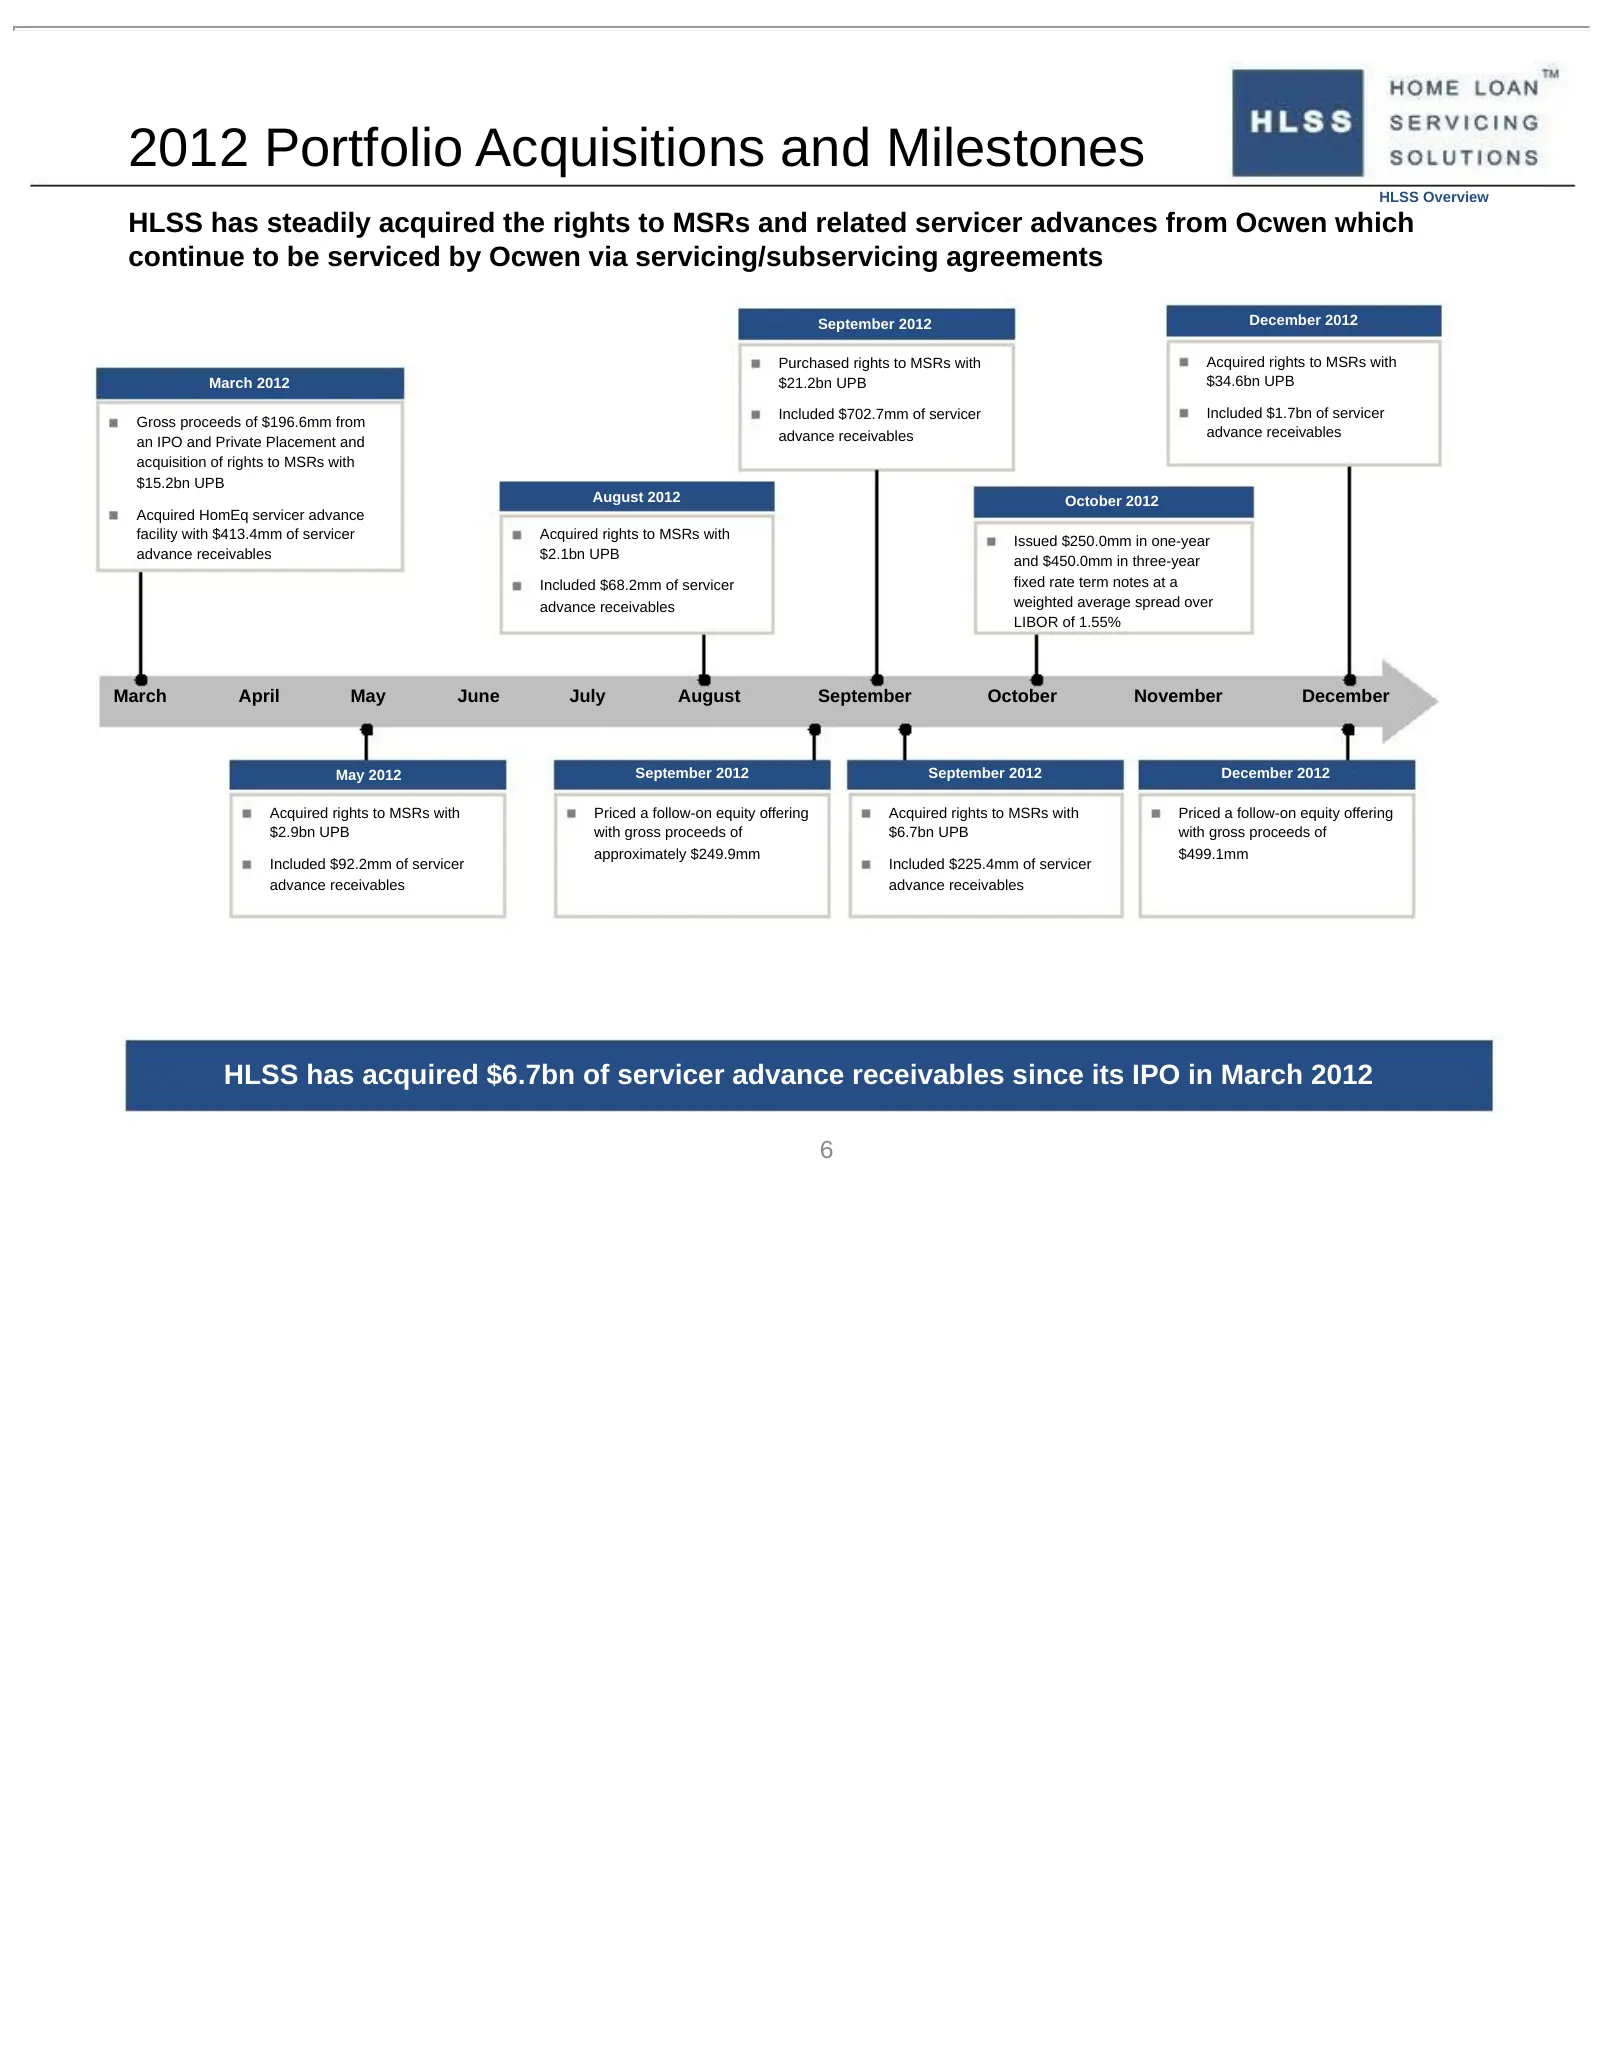
Slide 6: 2012 Portfolio Acquisitions and Milestones
2012 Portfolio Acquisitions and Milestones HLSS Overview HLSS has steadily acquired the rights to MSRs and related servicer advances from Ocwen which continue to be serviced by Ocwen via servicing/subservicing agreements September 2012 December 2012 Purchased rights to MSRs with Acquired rights to M
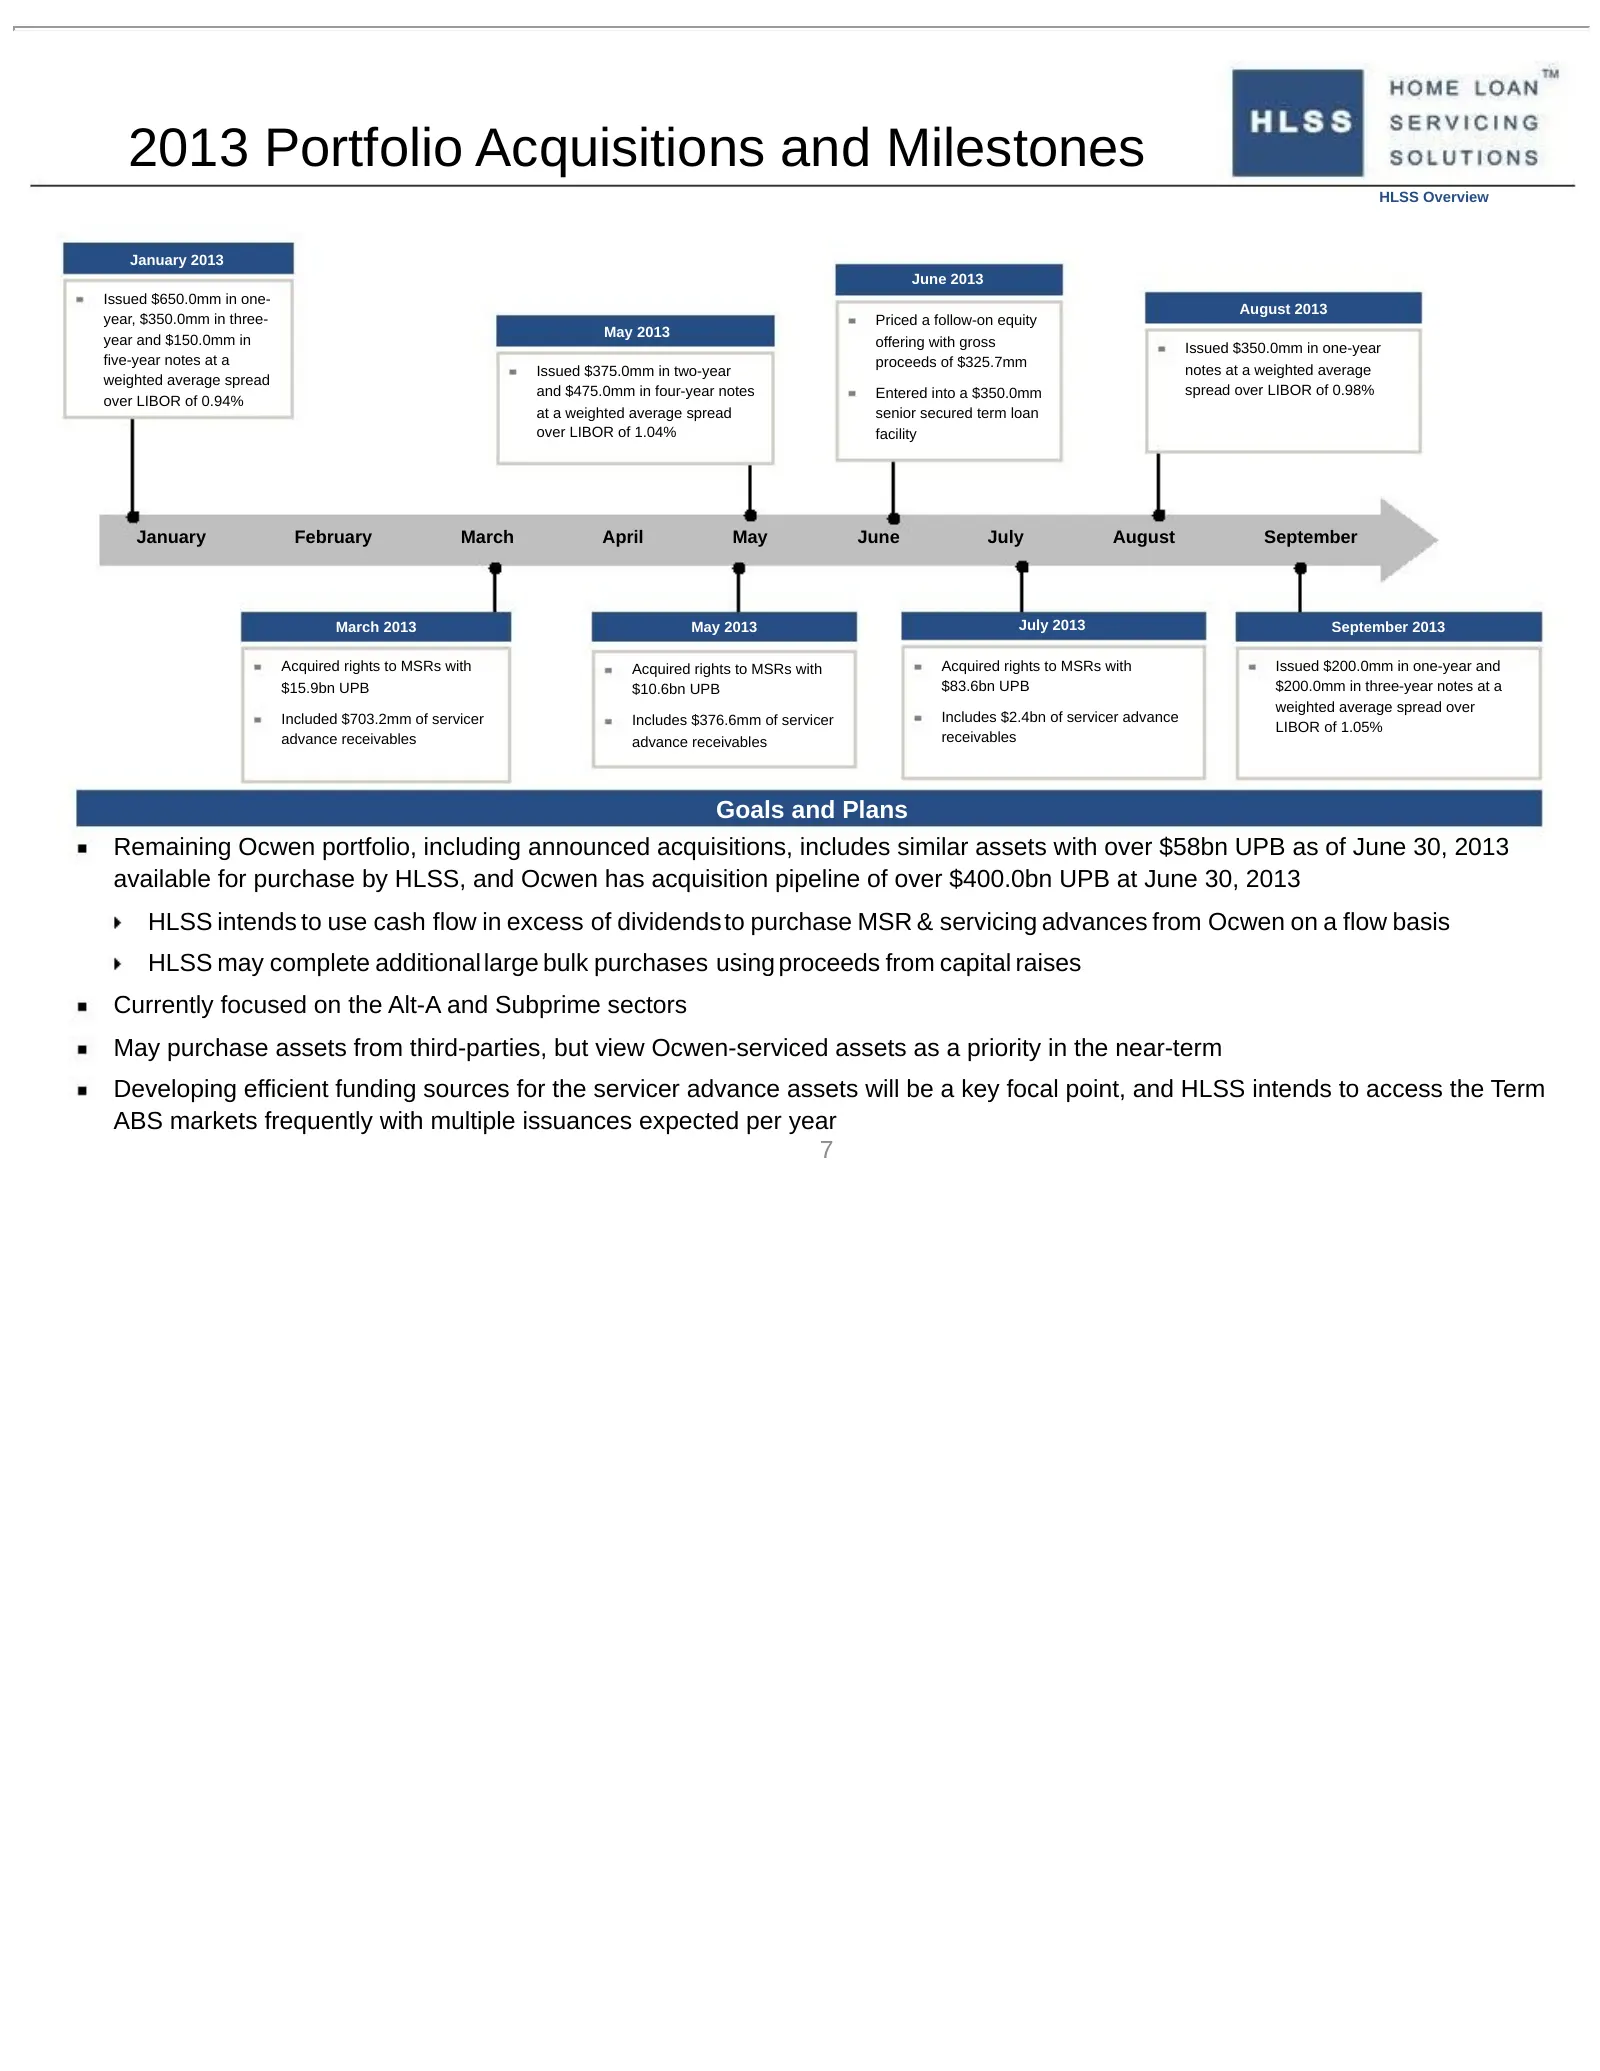
Slide 7: 2013 Portfolio Acquisitions and Milestones
2013 Portfolio Acquisitions and Milestones HLSS Overview January 2013 June 2013 Issued $650.0mm in one- August 2013 year, $350.0mm in three- Priced a follow-on equity May 2013 year and $150.0mm in offering with gross Issued $350.0mm in one-year five-year notes at a proceeds of $325.7mm Issued $375.0
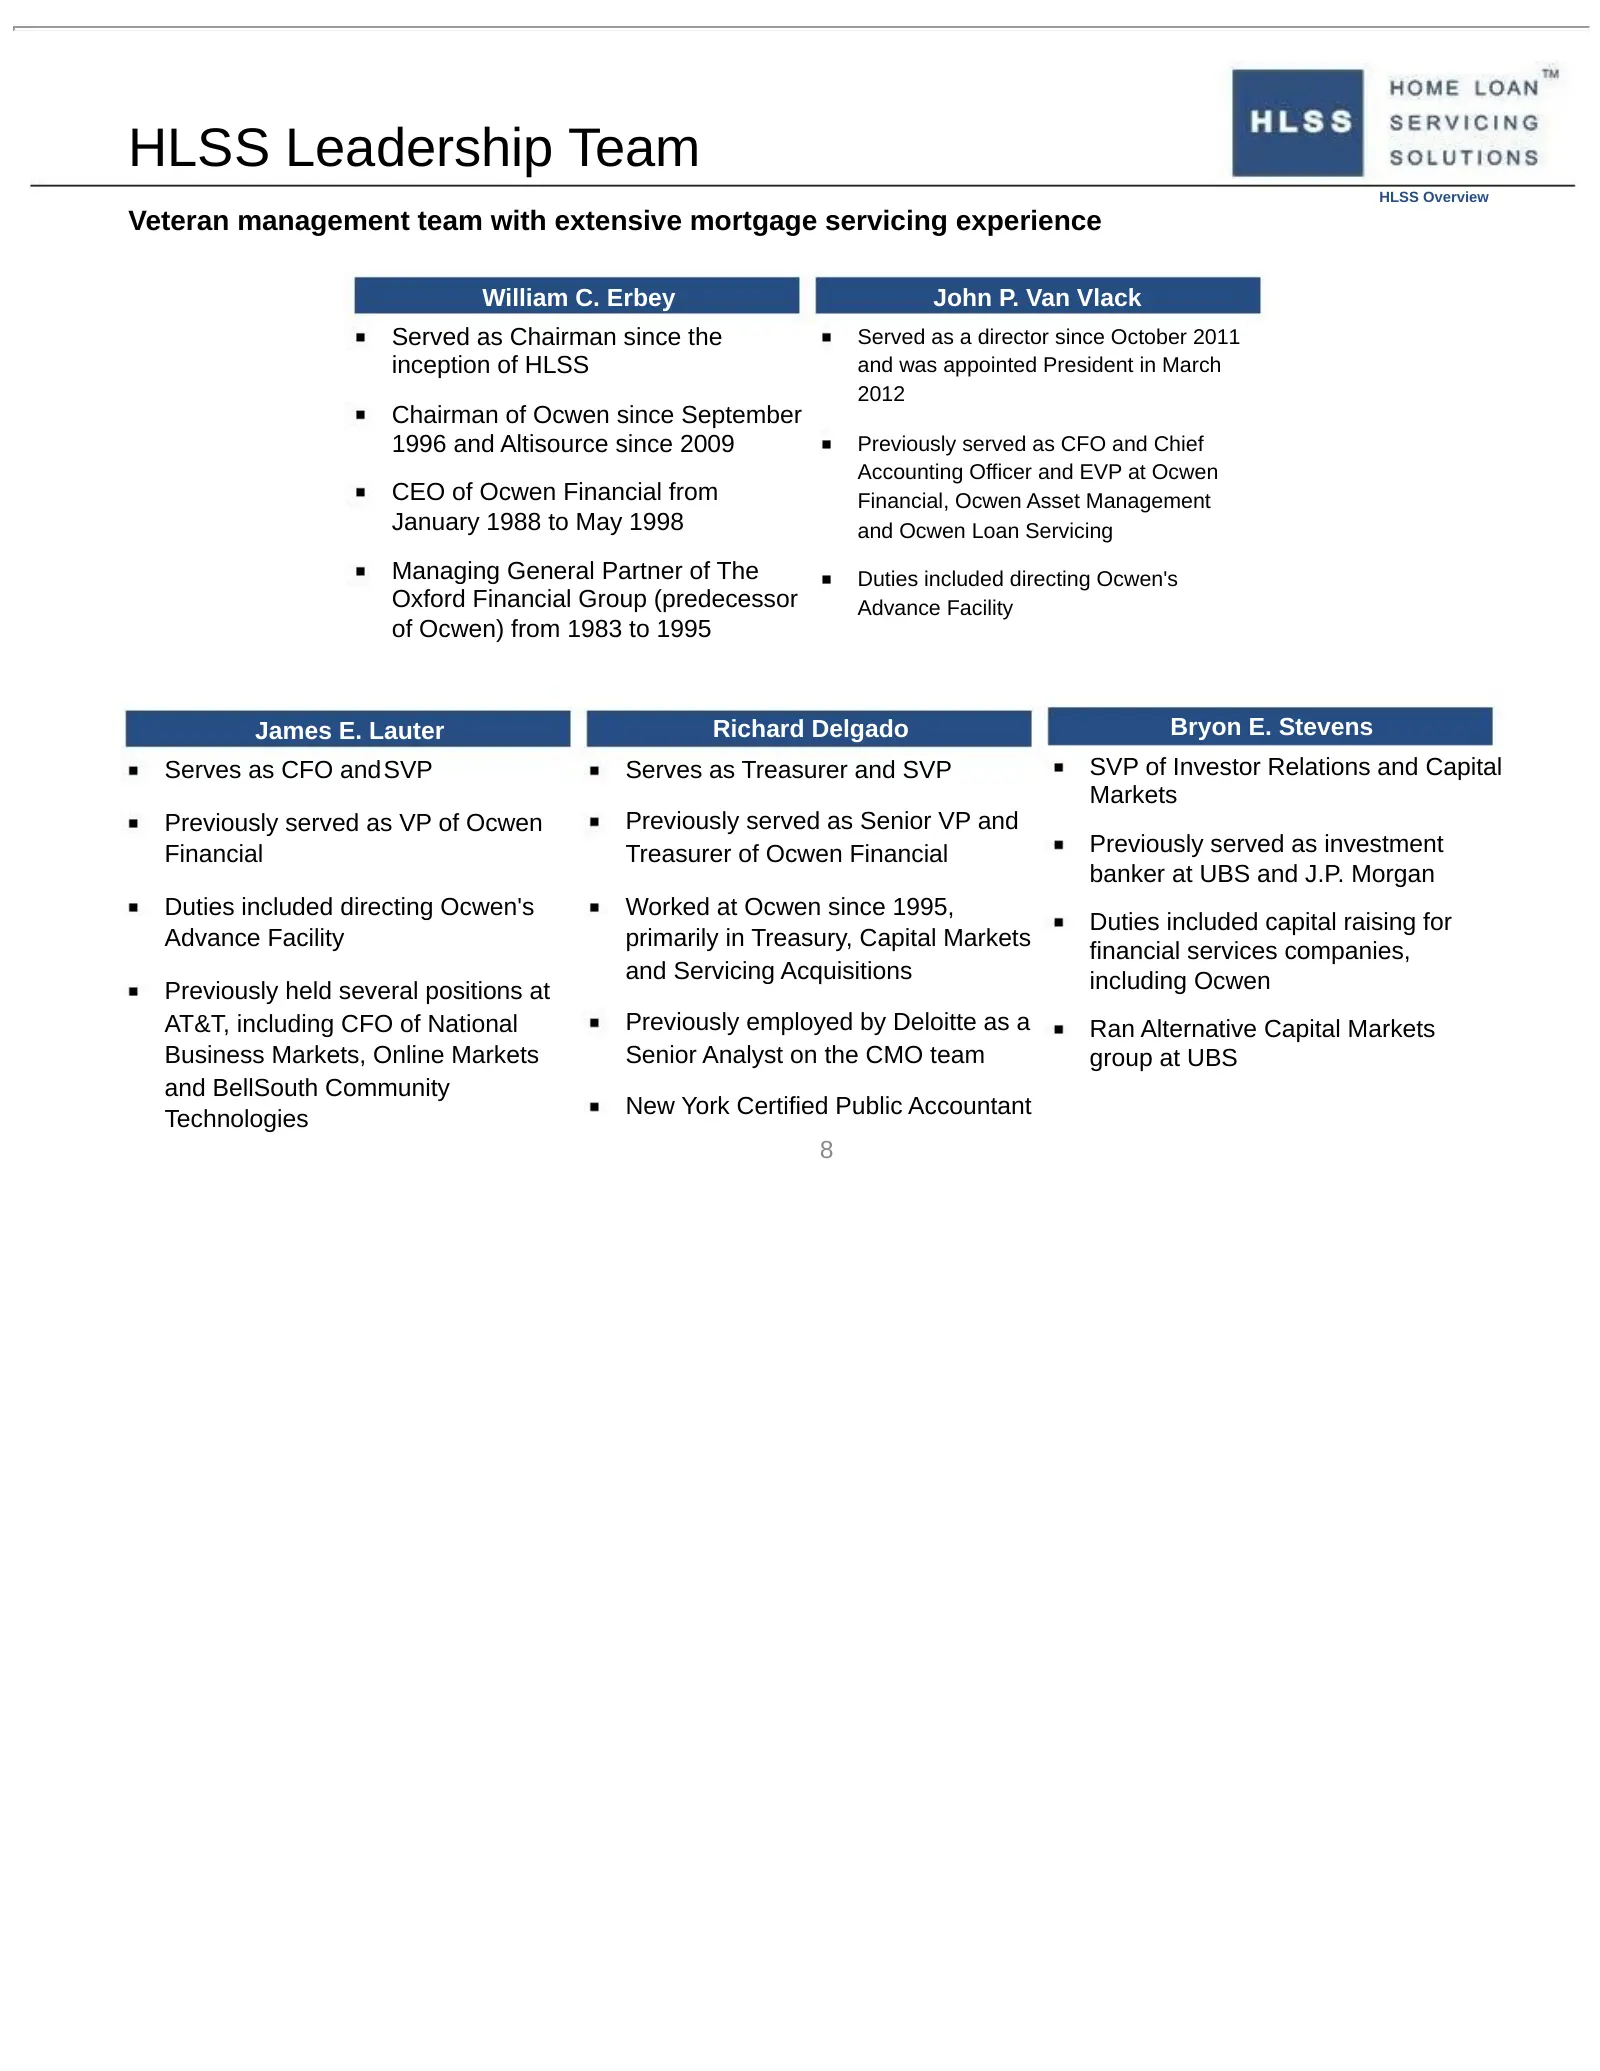
Slide 8: HLSS Leadership Team
HLSS Leadership Team HLSS Overview Veteran management team with extensive mortgage servicing experience William C. Erbey John P. Van Vlack Served as Chairman since the Served as a director since October 2011 inception of HLSS and was appointed President in March 2012 Chairman of Ocwen since Septembe
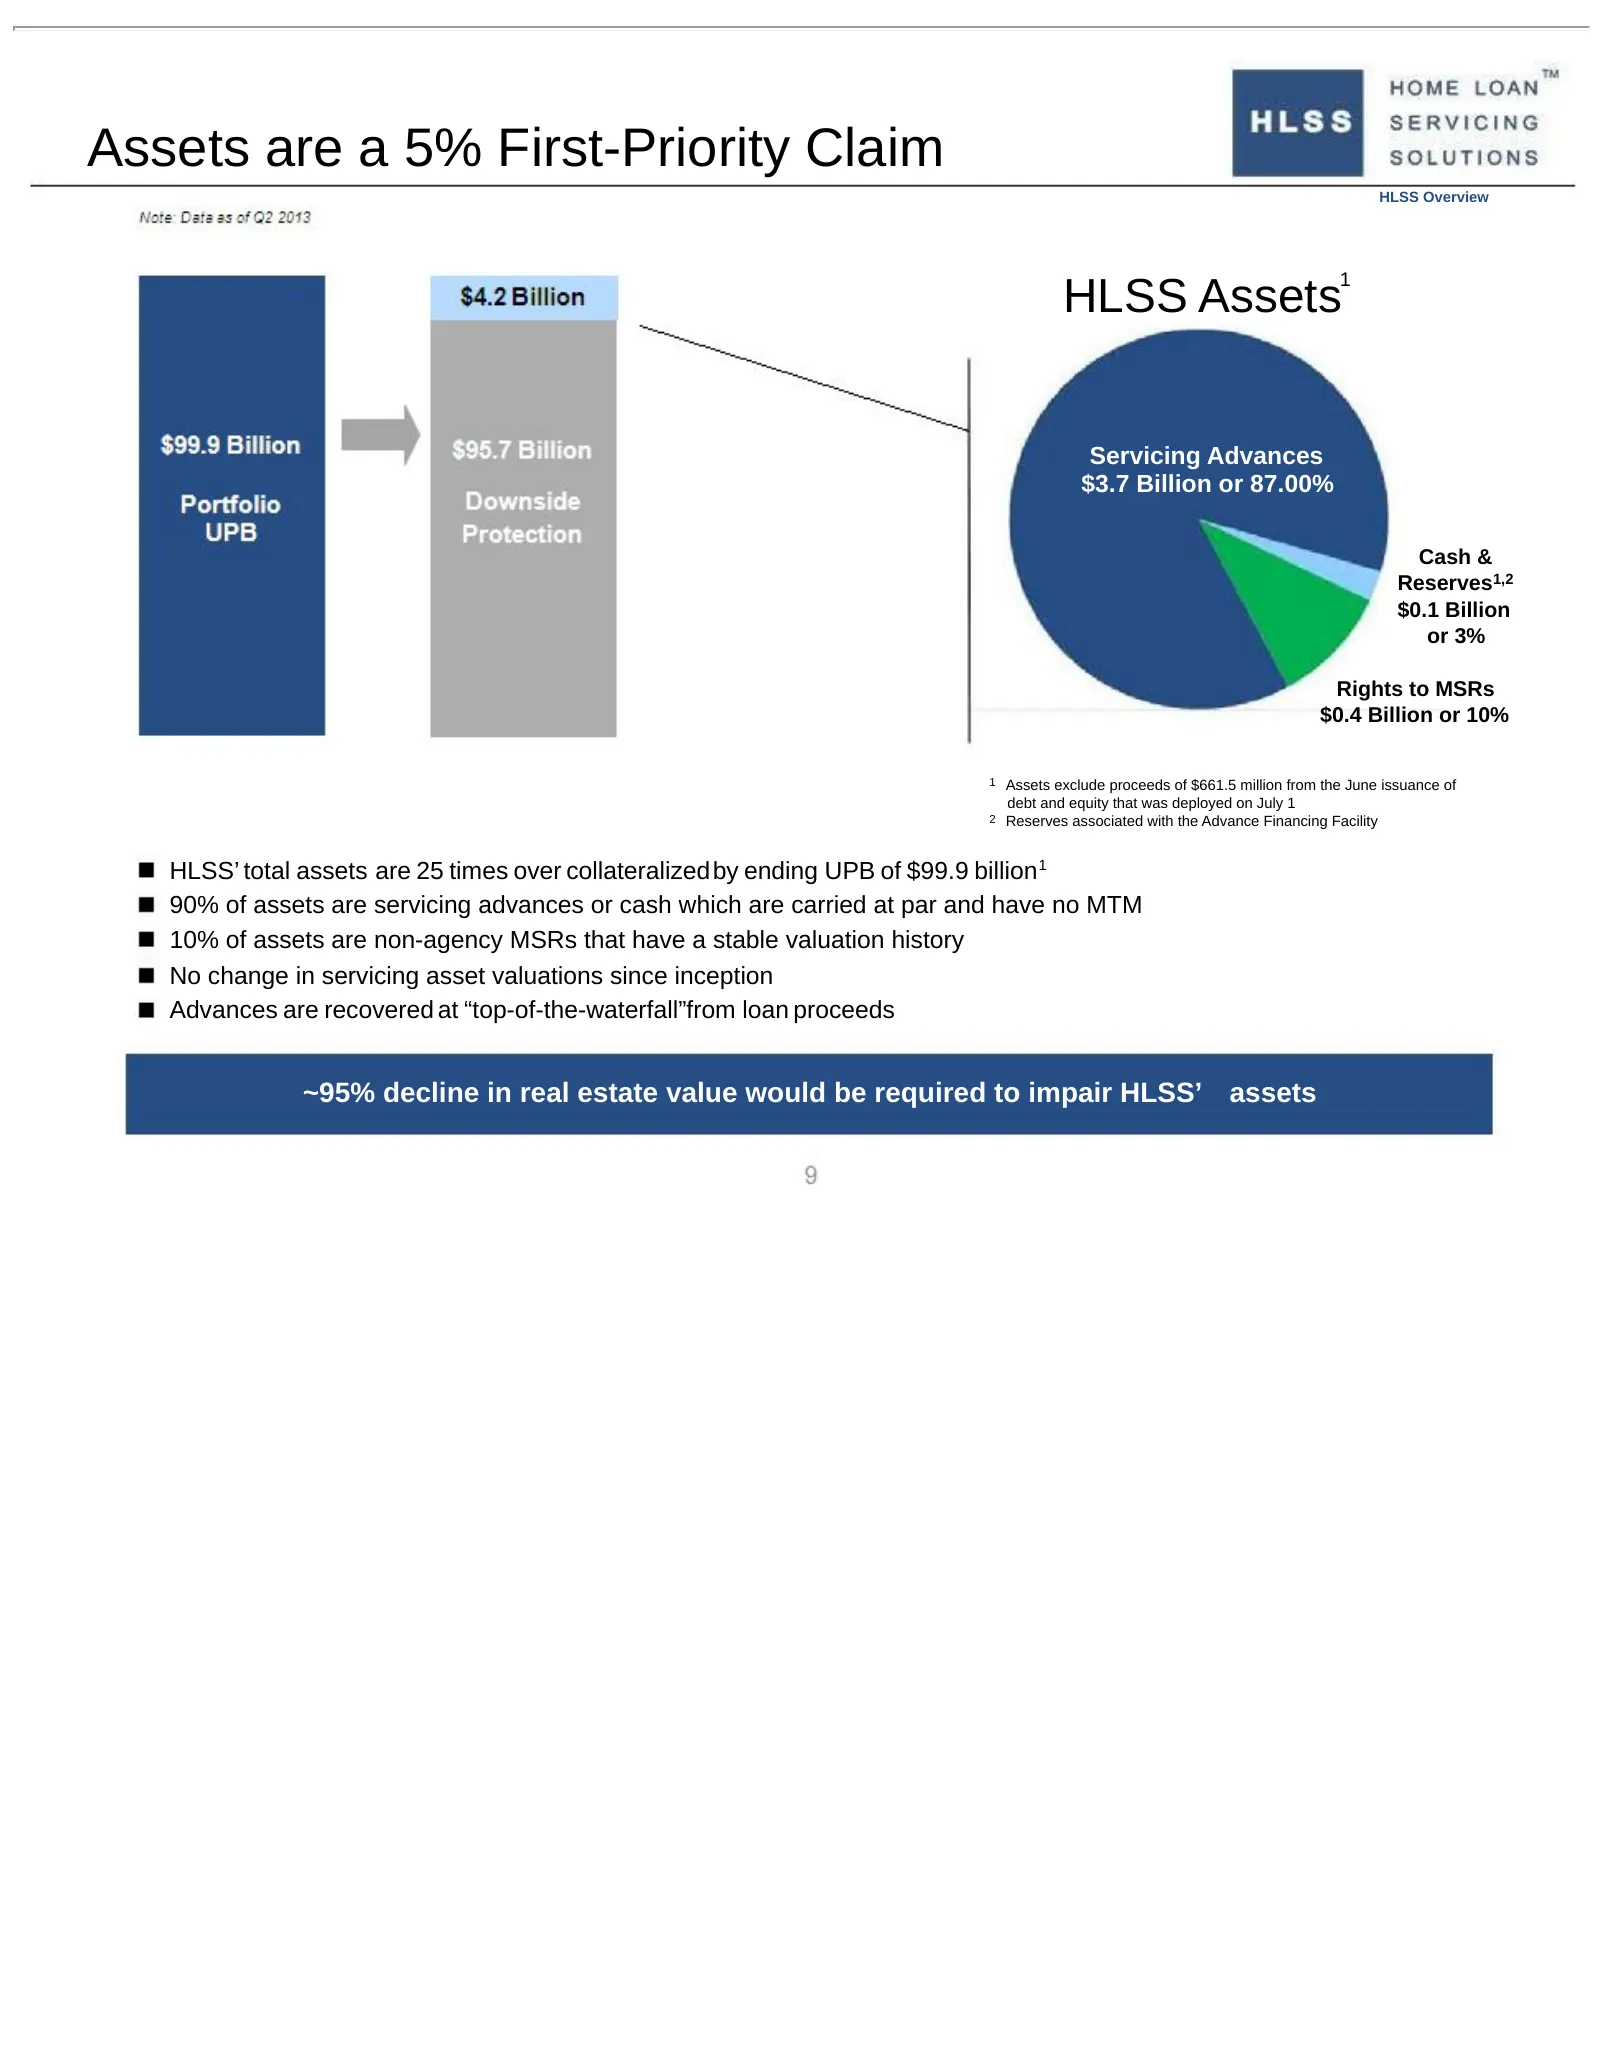
Slide 9: Assets are a 5% First-Priority Claim
Assets are a 5% First-Priority Claim HLSS Overview 1 HLSS Assets Servicing Advances $3.7 Billion or 87.00% Cash & Reserves1,2 $0.1 Billion or 3% Rights to MSRs $0.4 Billion or 10% 1 Assets exclude proceeds of $661.5 million from the June issuance of debt and equity that was deployed on July 1 2 Rese
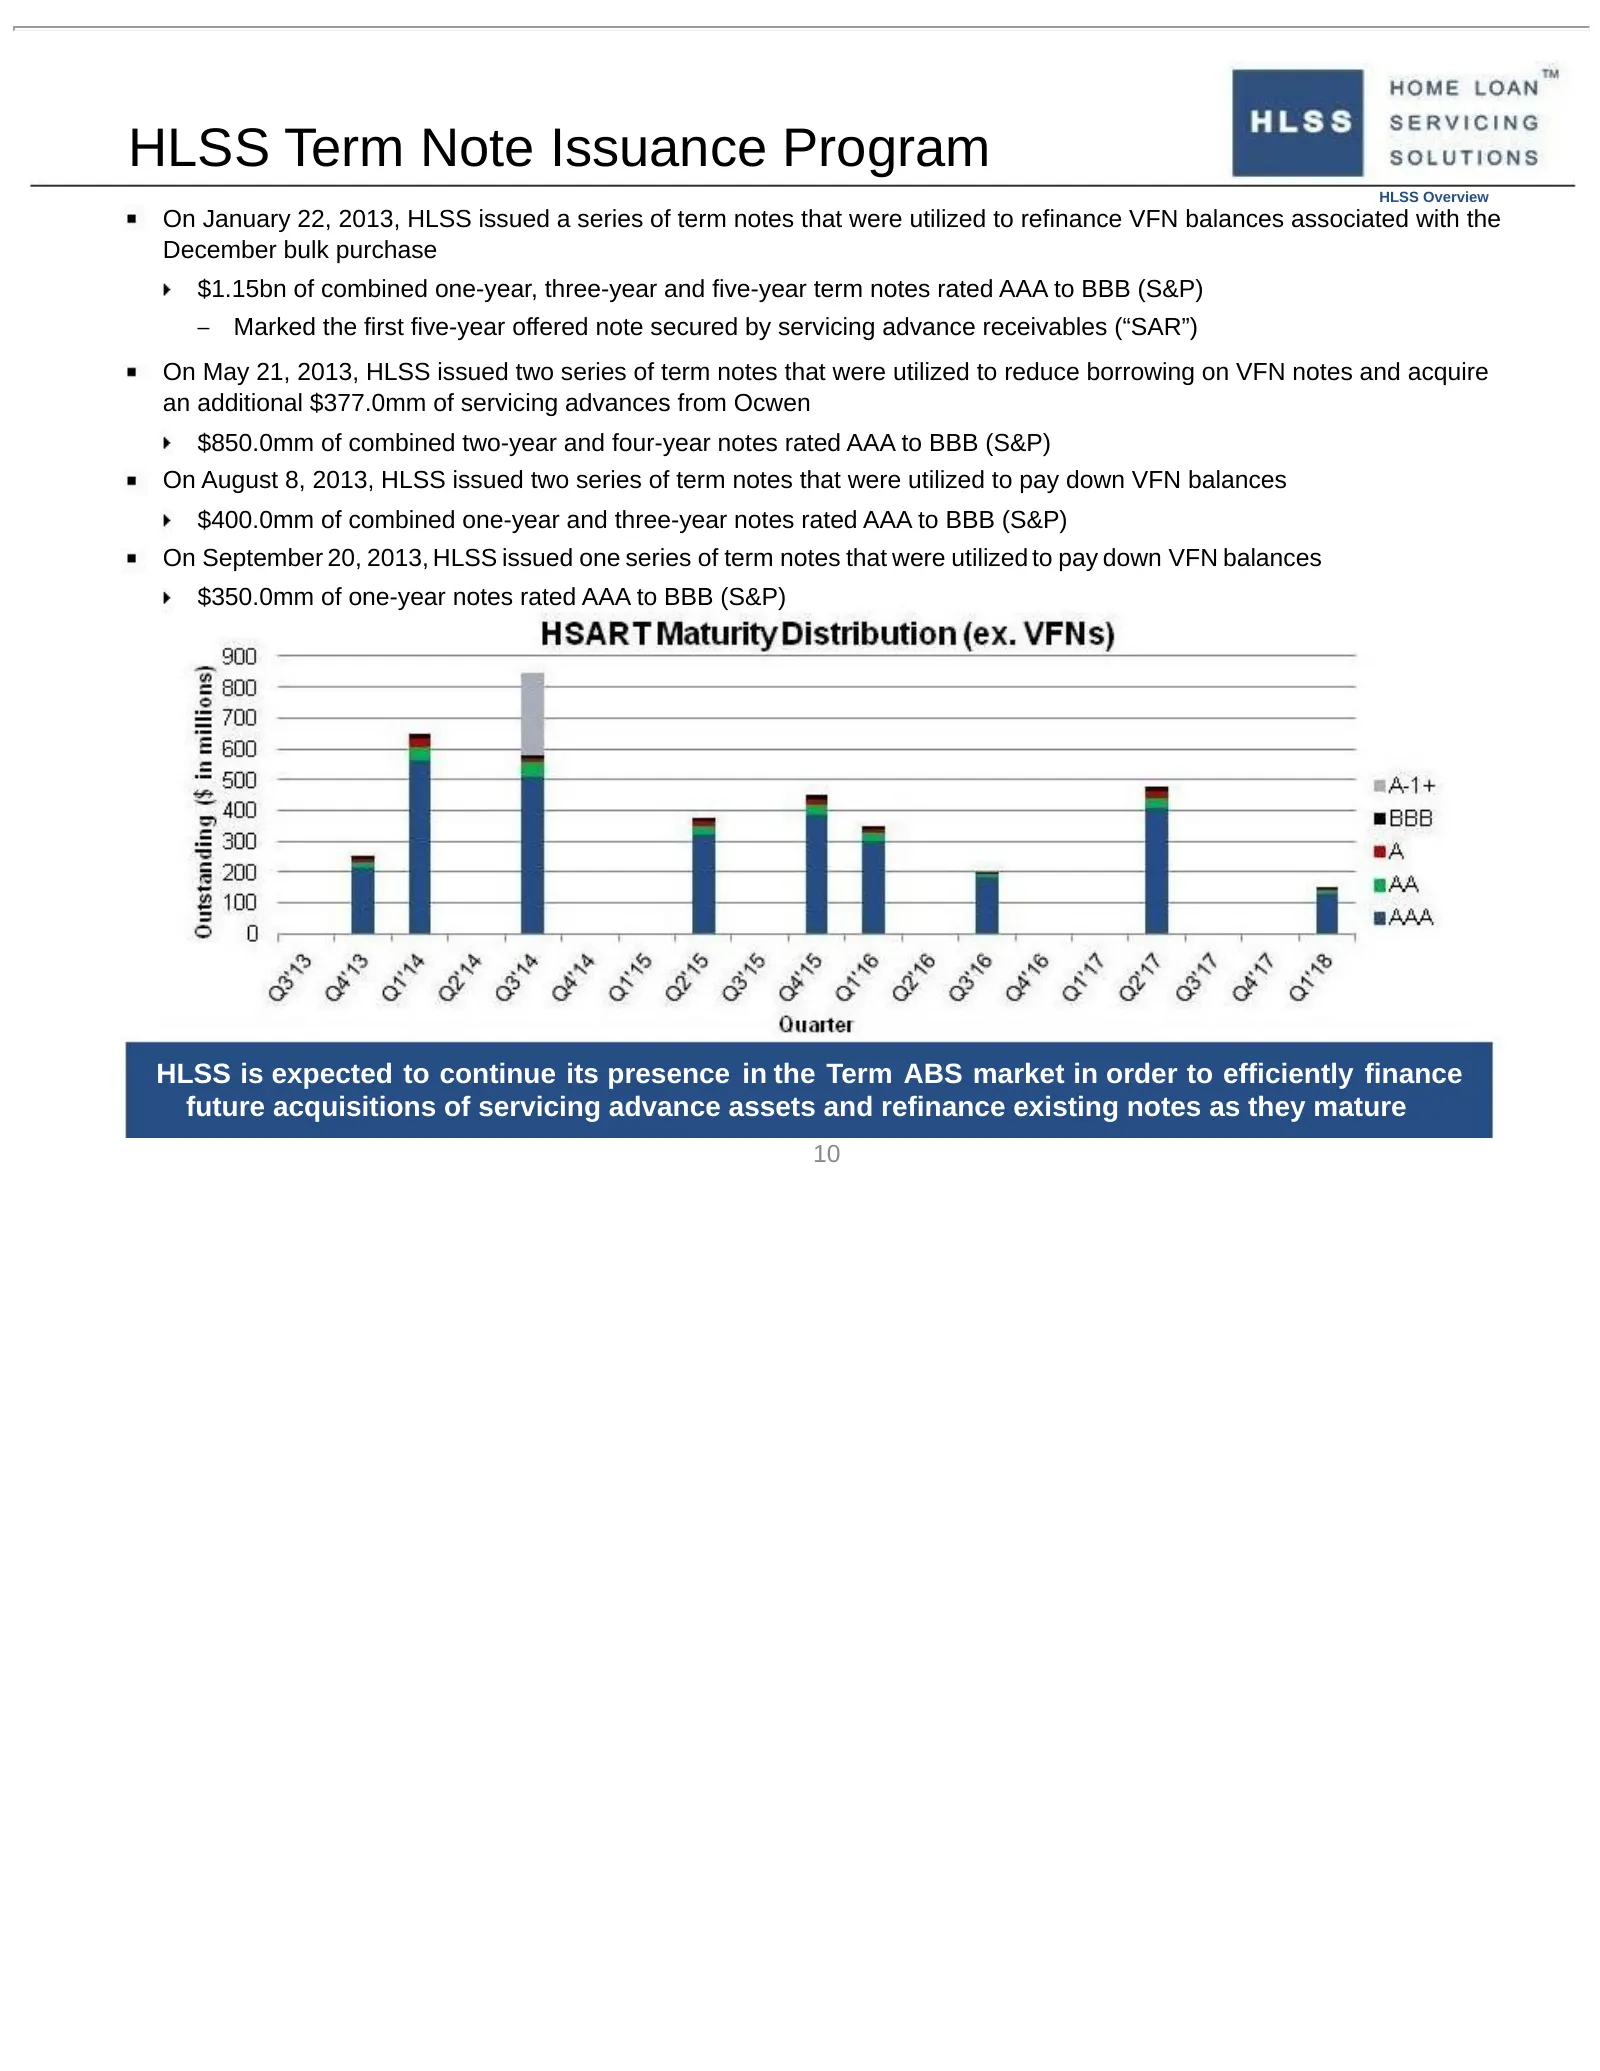
Slide 10: HLSS Term Note Issuance Program
HLSS Term Note Issuance Program HLSS Overview On January 22, 2013, HLSS issued a series of term notes that were utilized to refinance VFN balances associated with the December bulk purchase $1.15bn of combined one-year, three-year and five-year term notes rated AAA to BBB (S&P) – Marked the first fi
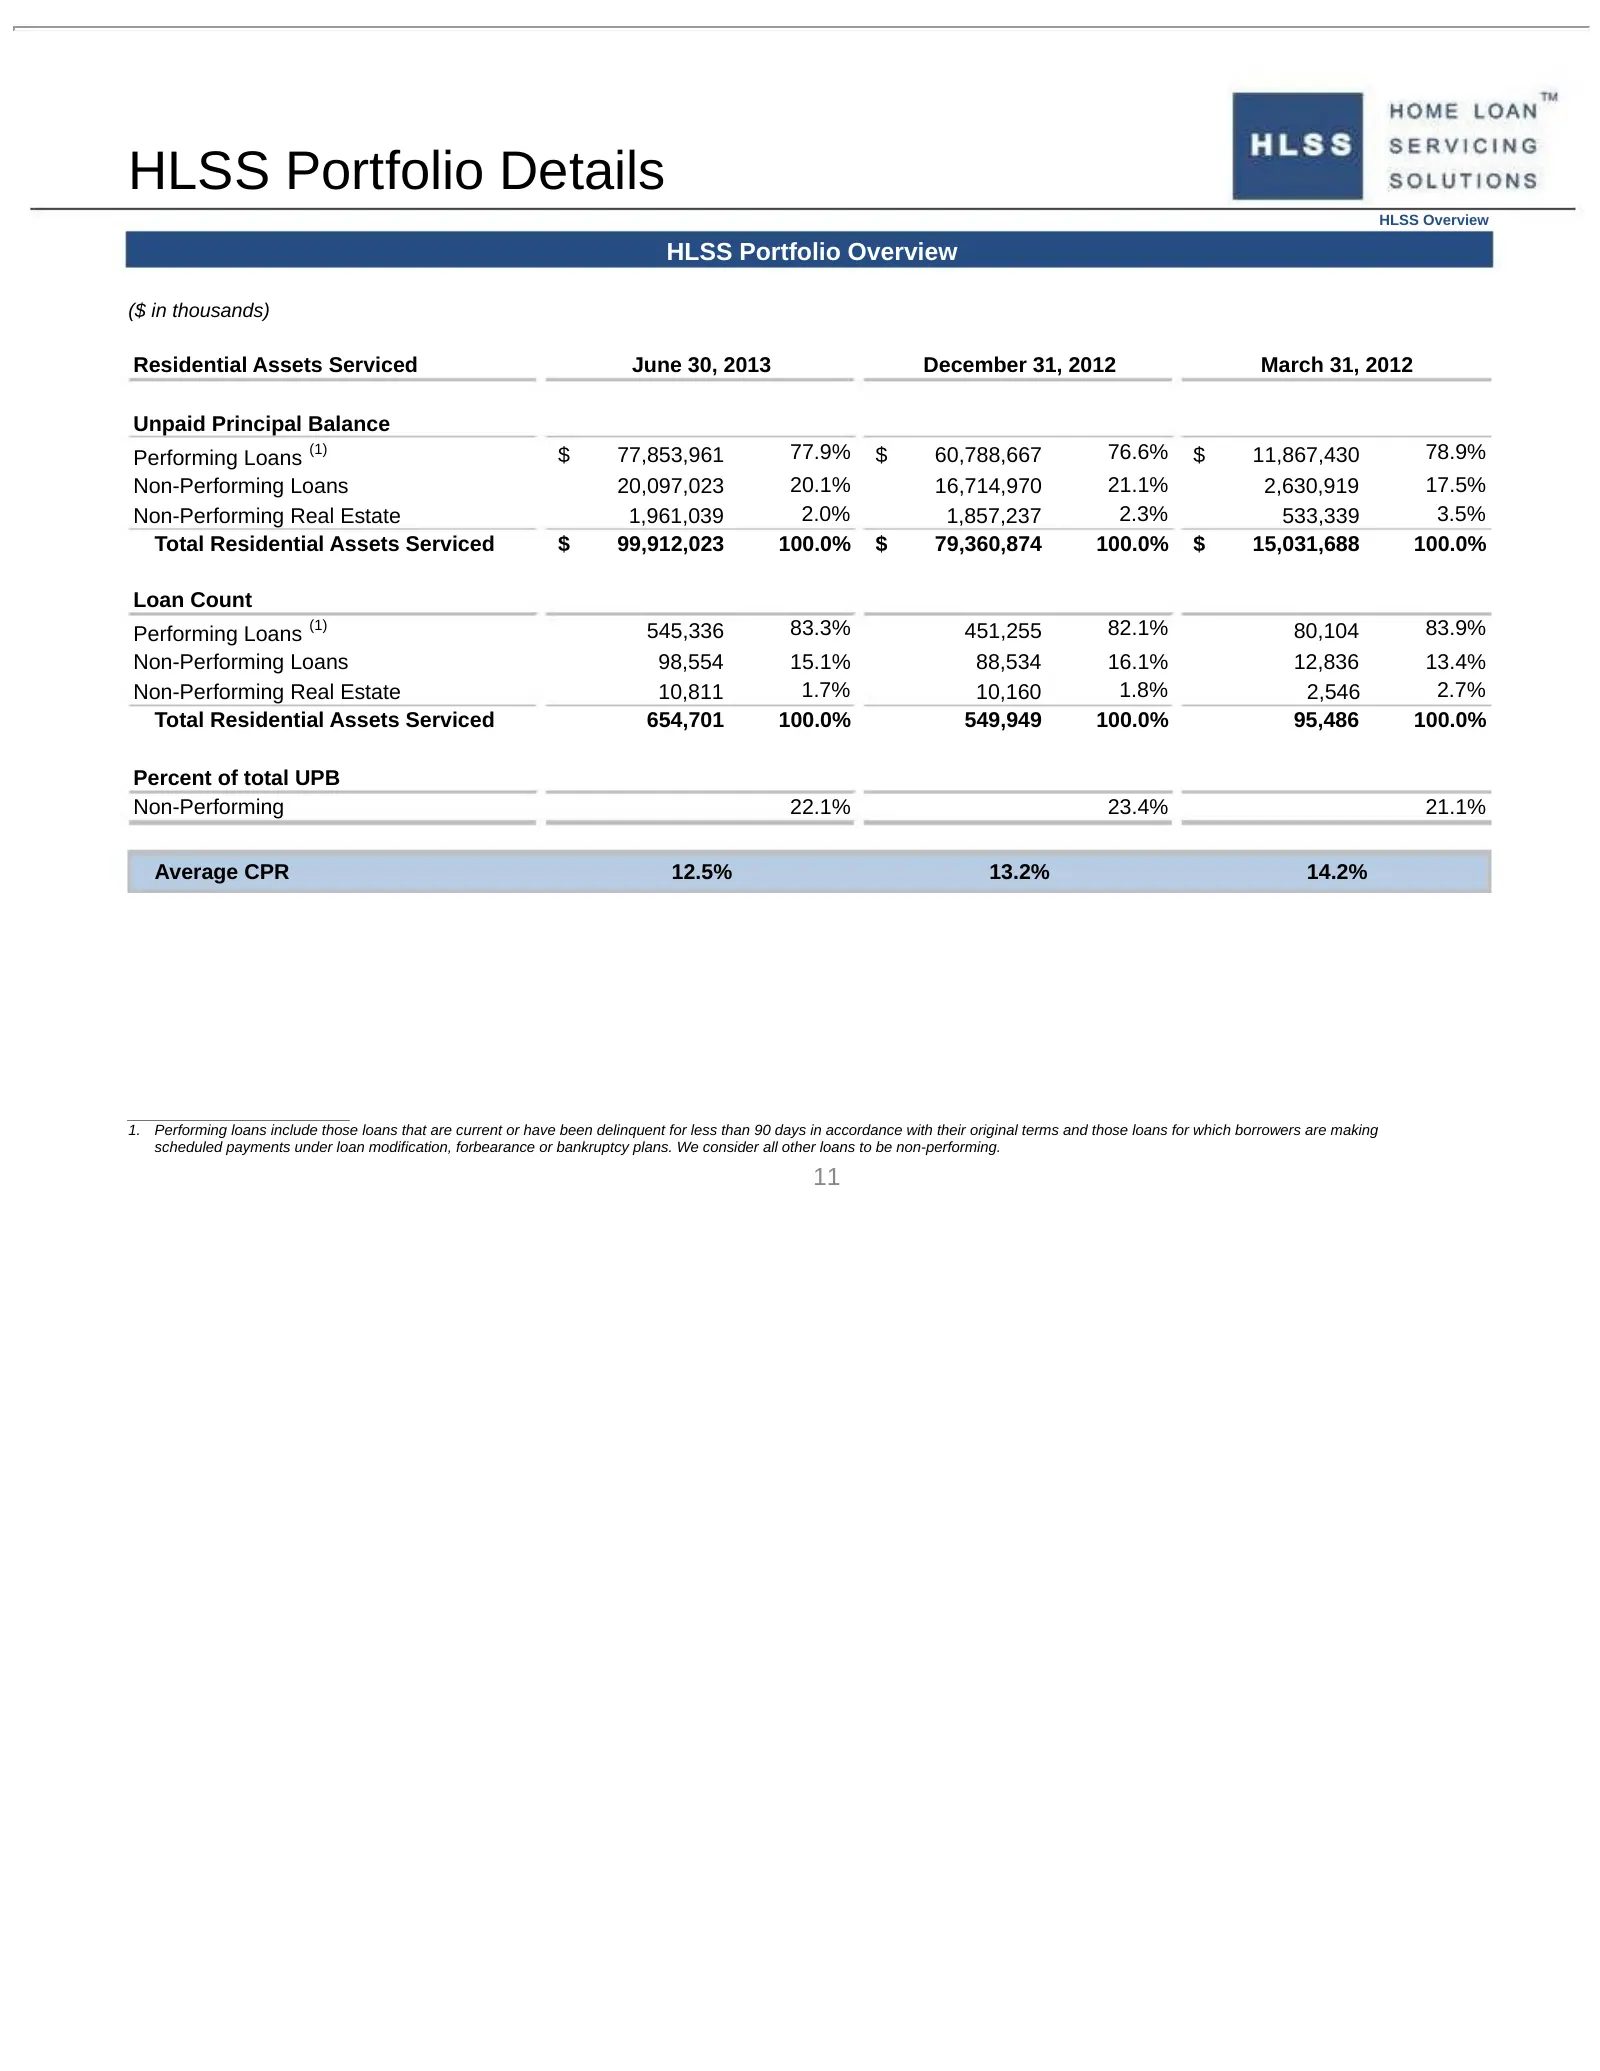
Slide 11: HLSS Portfolio Details
HLSS Portfolio Details HLSS Overview HLSS Portfolio Overview ($ in thousands) Residential Assets Serviced June 30, 2013 December 31, 2012 March 31, 2012 Unpaid Principal Balance Performing Loans (1) $ 77,853,961 77.9% $ 60,788,667 76.6% $ 11,867,430 78.9% Non-Performing Loans 20,097,023 20.1% 16,714

Slide 12: Ocwen Overview
HOME LOAN” EME SERVICING SOLUTIONS Ocwen Overview 12
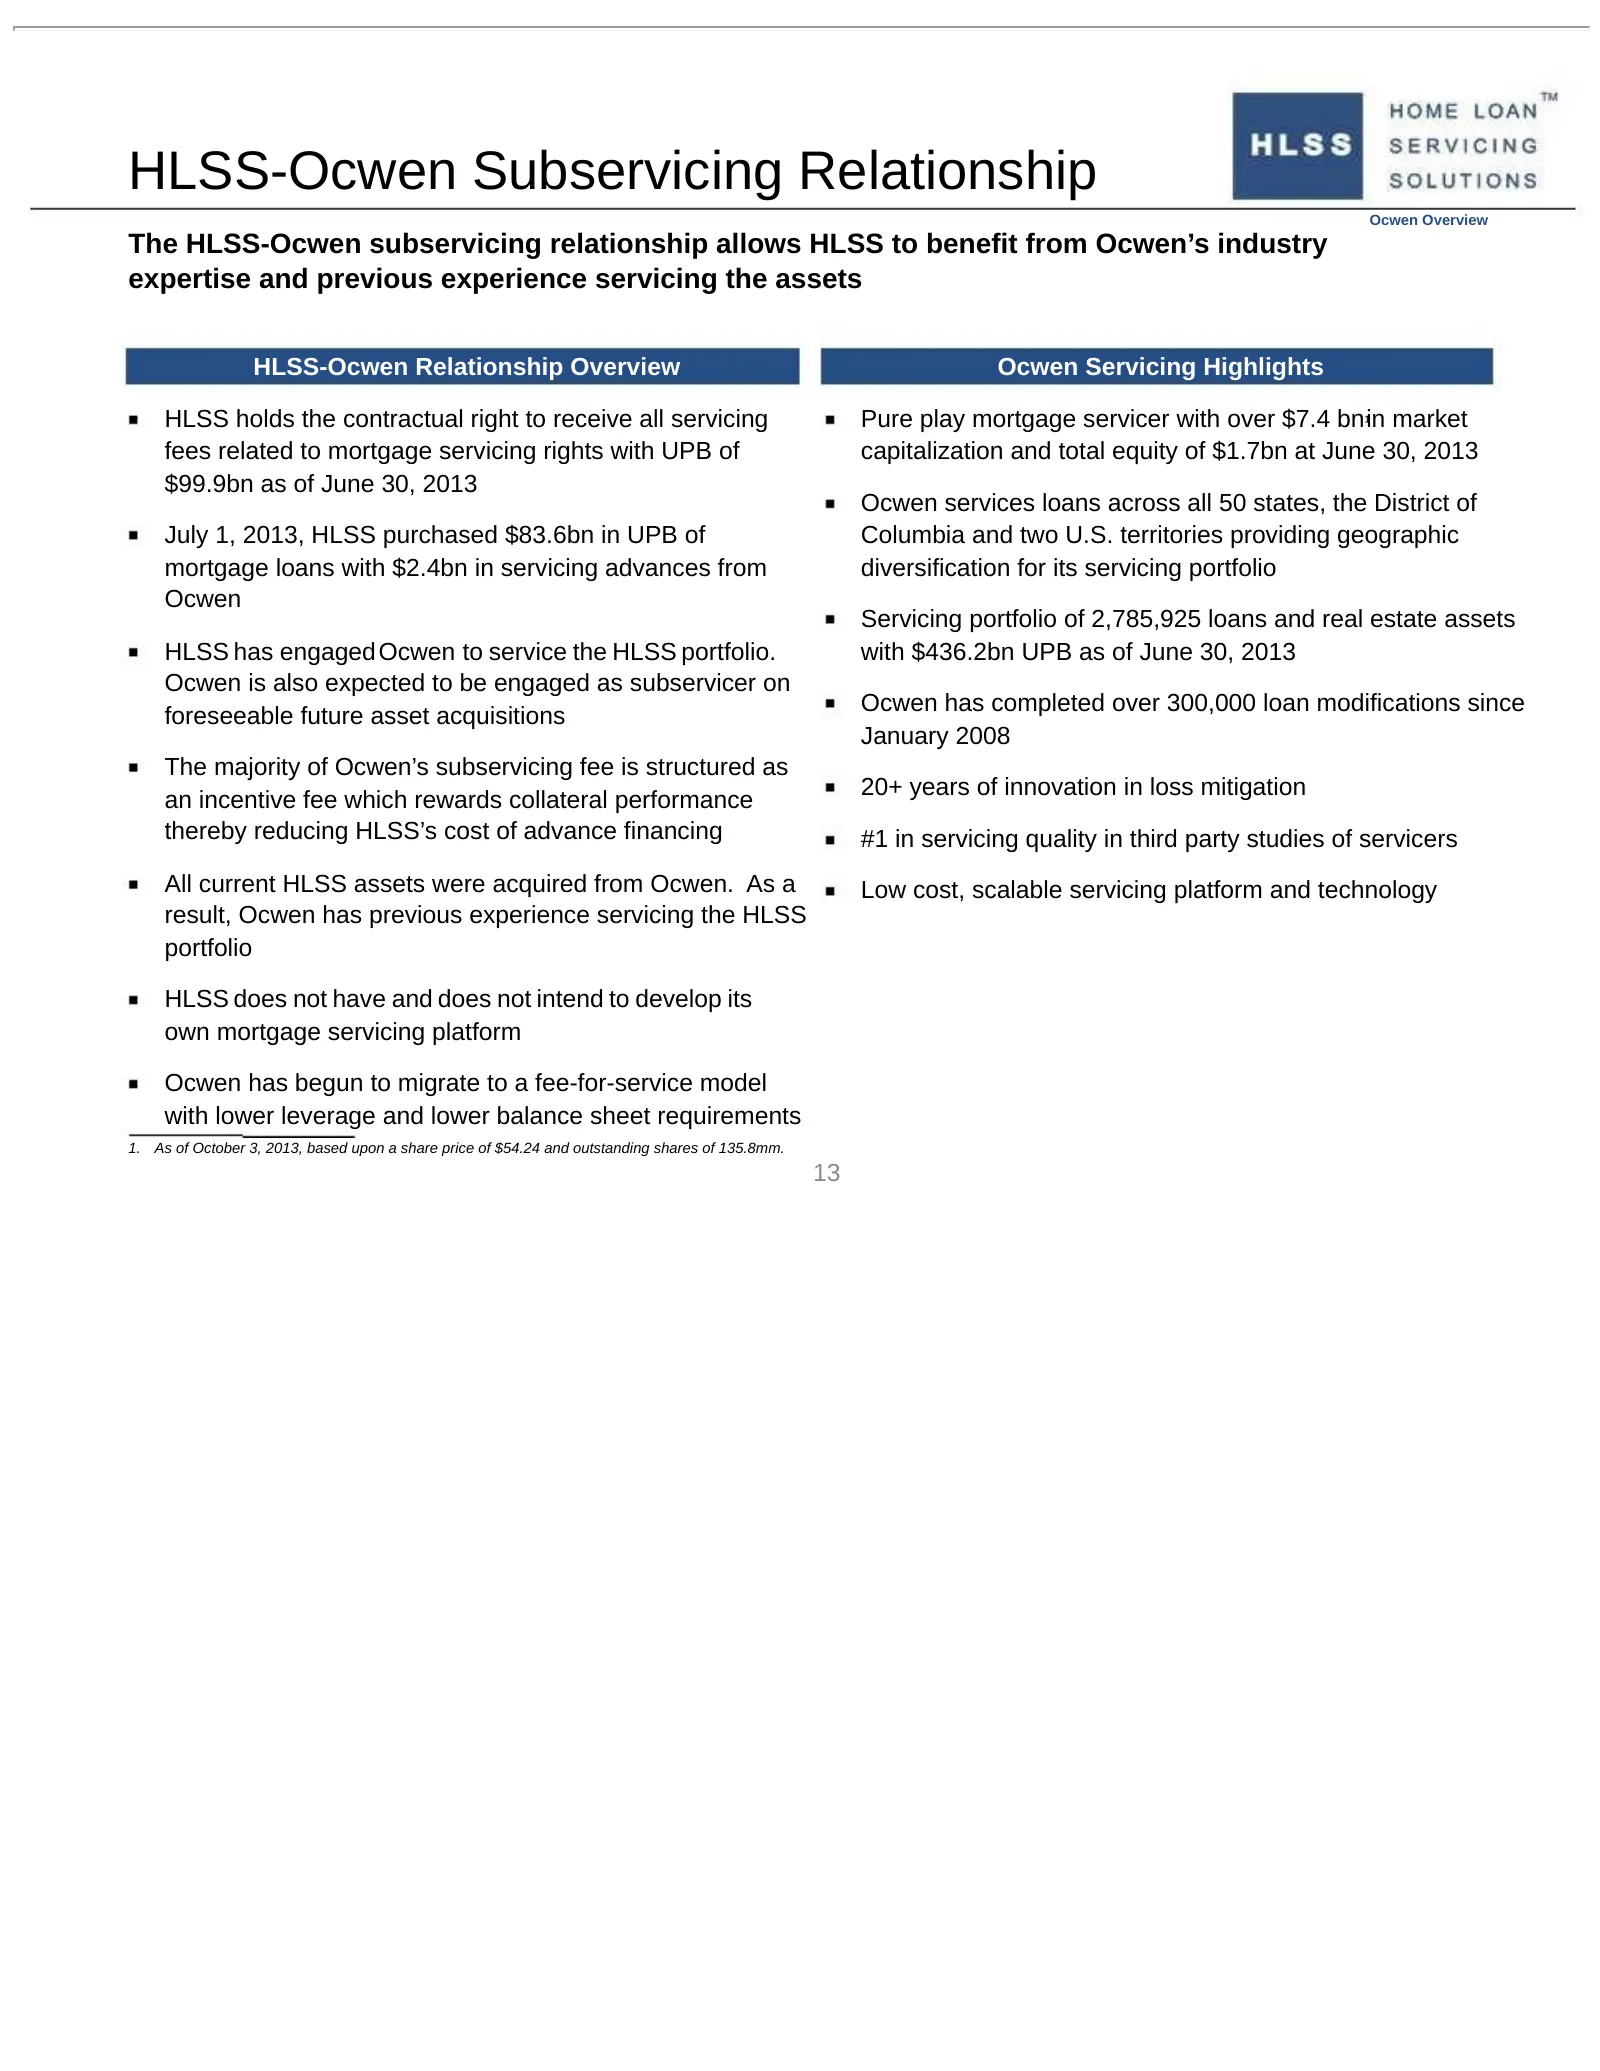
Slide 13: HLSS-Ocwen Subservicing Relationship
HLSS-Ocwen Subservicing Relationship Ocwen Overview The HLSS-Ocwen subservicing relationship allows HLSS to benefit from Ocwen’s industry expertise and previous experience servicing the assets HLSS-Ocwen Relationship Overview Ocwen Servicing Highlights HLSS holds the contractual right to receive all
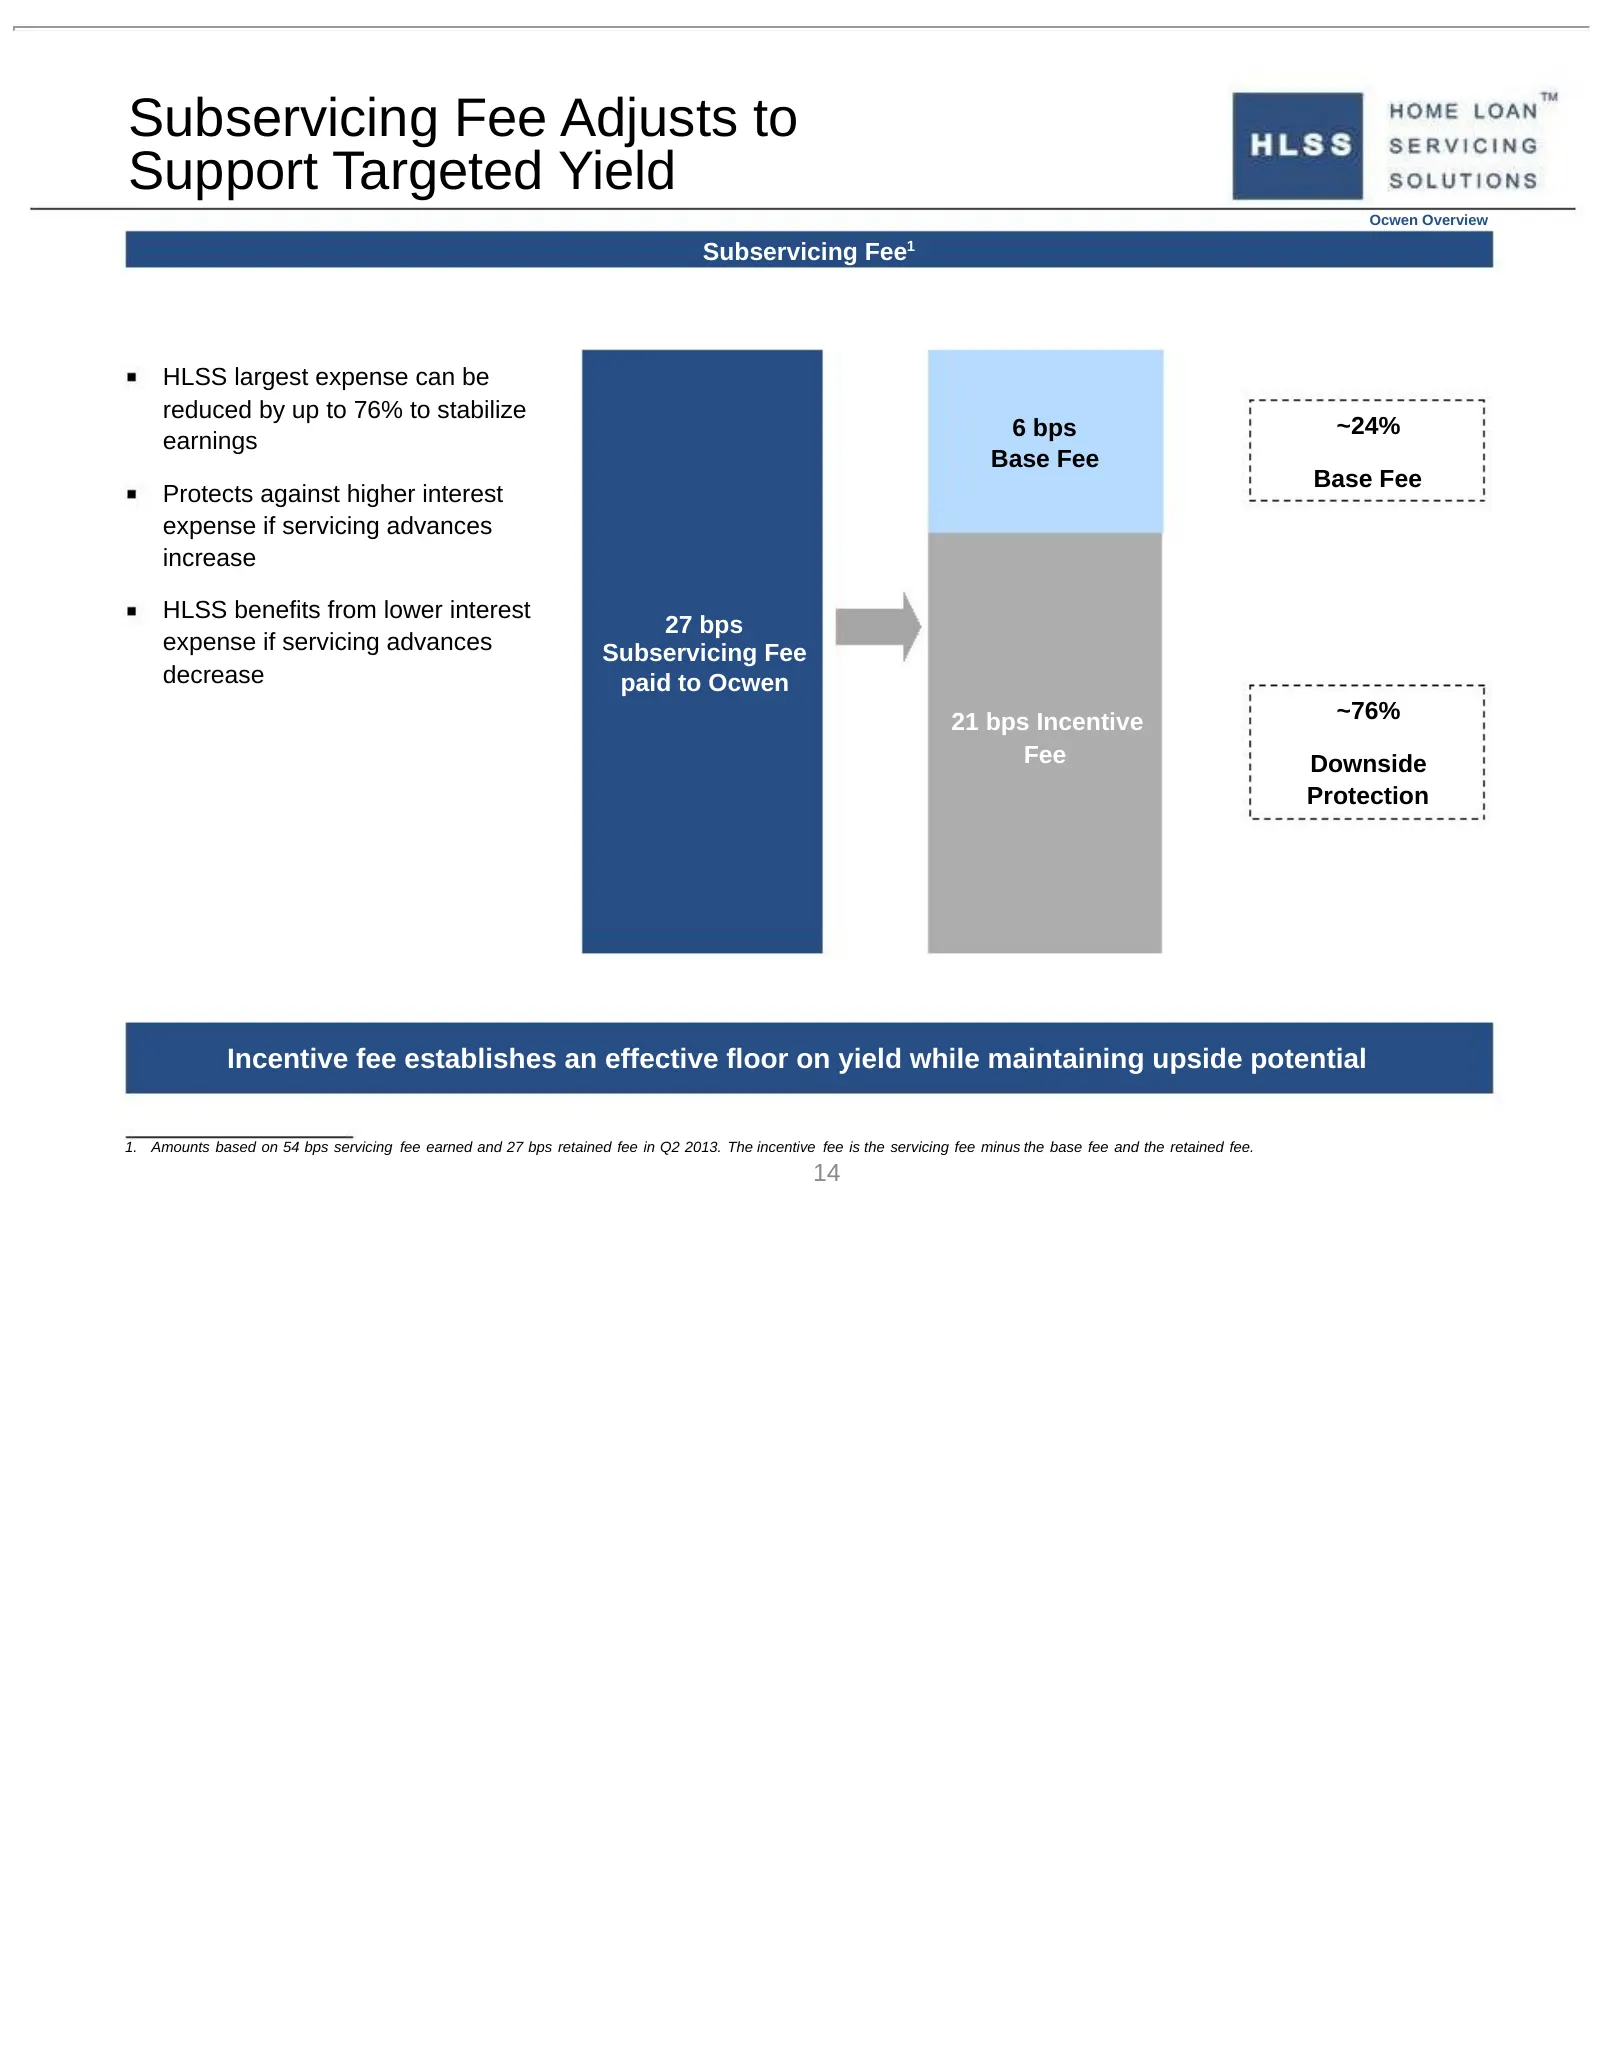
Slide 14: Subservicing Fee Adjusts to Support Targeted Yield
Subservicing Fee Adjusts to Support Targeted Yield Ocwen Overview Subservicing Fee1 HLSS largest expense can be reduced by up to 76% to stabilize 6 bps ~24% earnings Base Fee Base Fee Protects against higher interest expense if servicing advances increase HLSS benefits from lower interest 27 bps exp
Slide 15: Global Servicing Platform
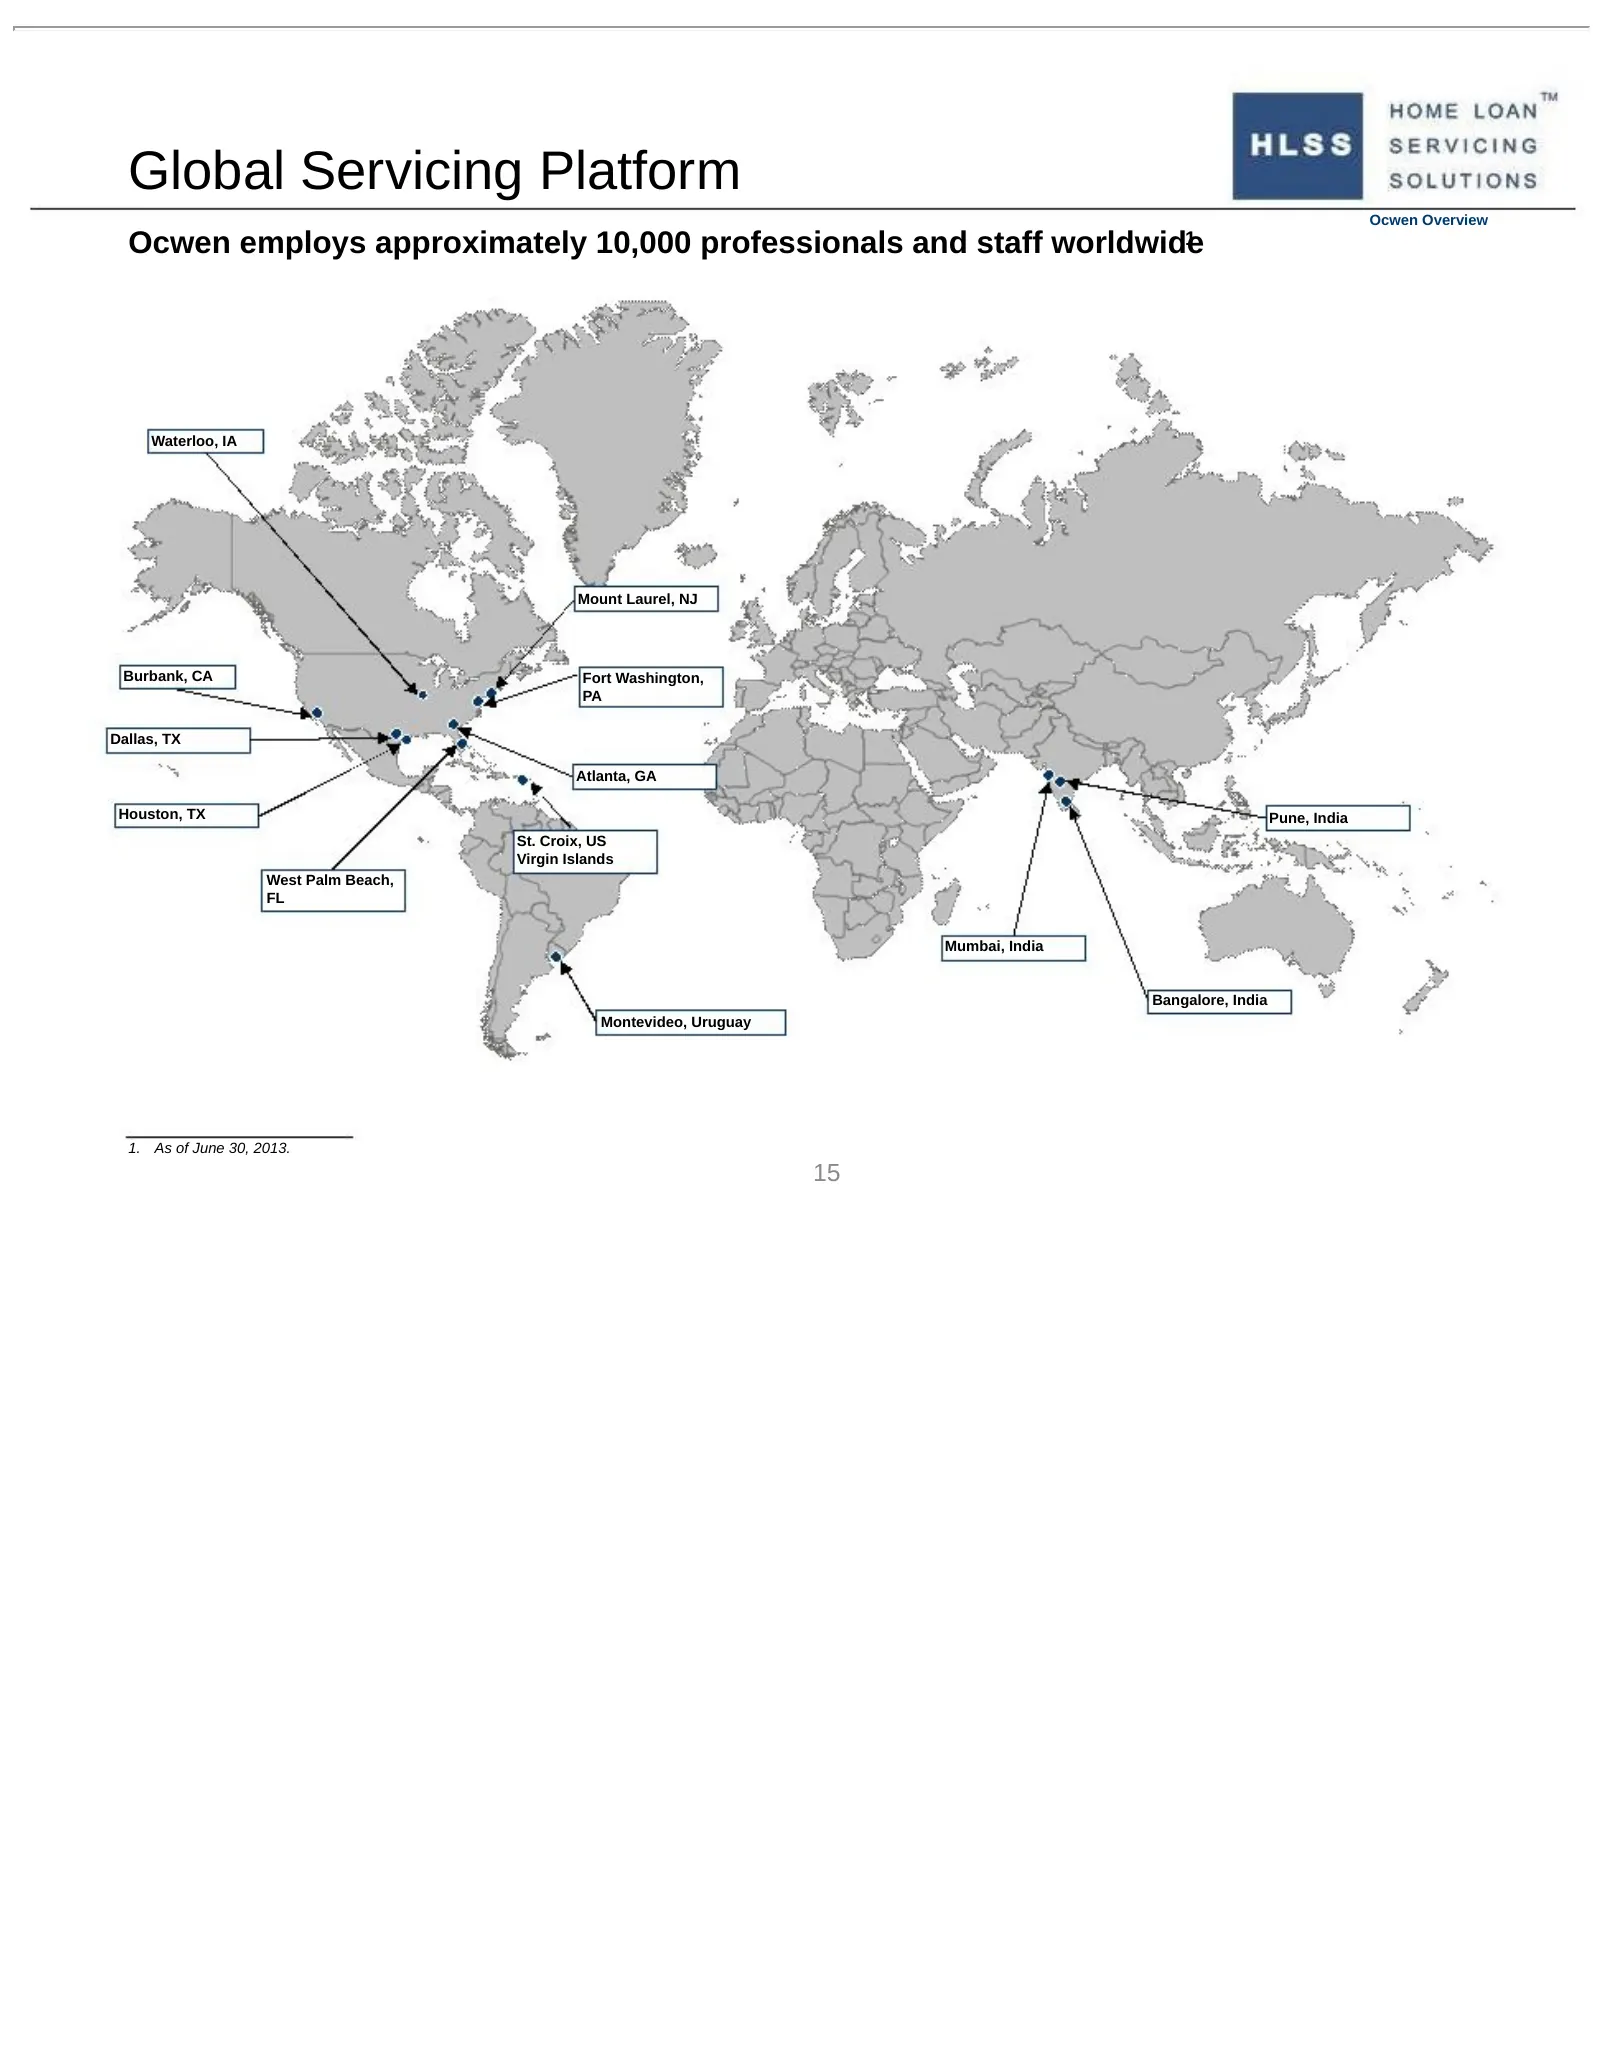
Global Servicing Platform Ocwen Overview Ocwen employs approximately 10,000 professionals and staff worldwide 1 Waterloo, IA Mount Laurel, NJ Burbank, CA Fort Washington, PA Dallas, TX Atlanta, GA Houston, TX Pune, India St. Croix, US Virgin Islands West Palm Beach, FL Mumbai, India Bangalore, India
Slide 16: Ocwen Servicing Portfolio History
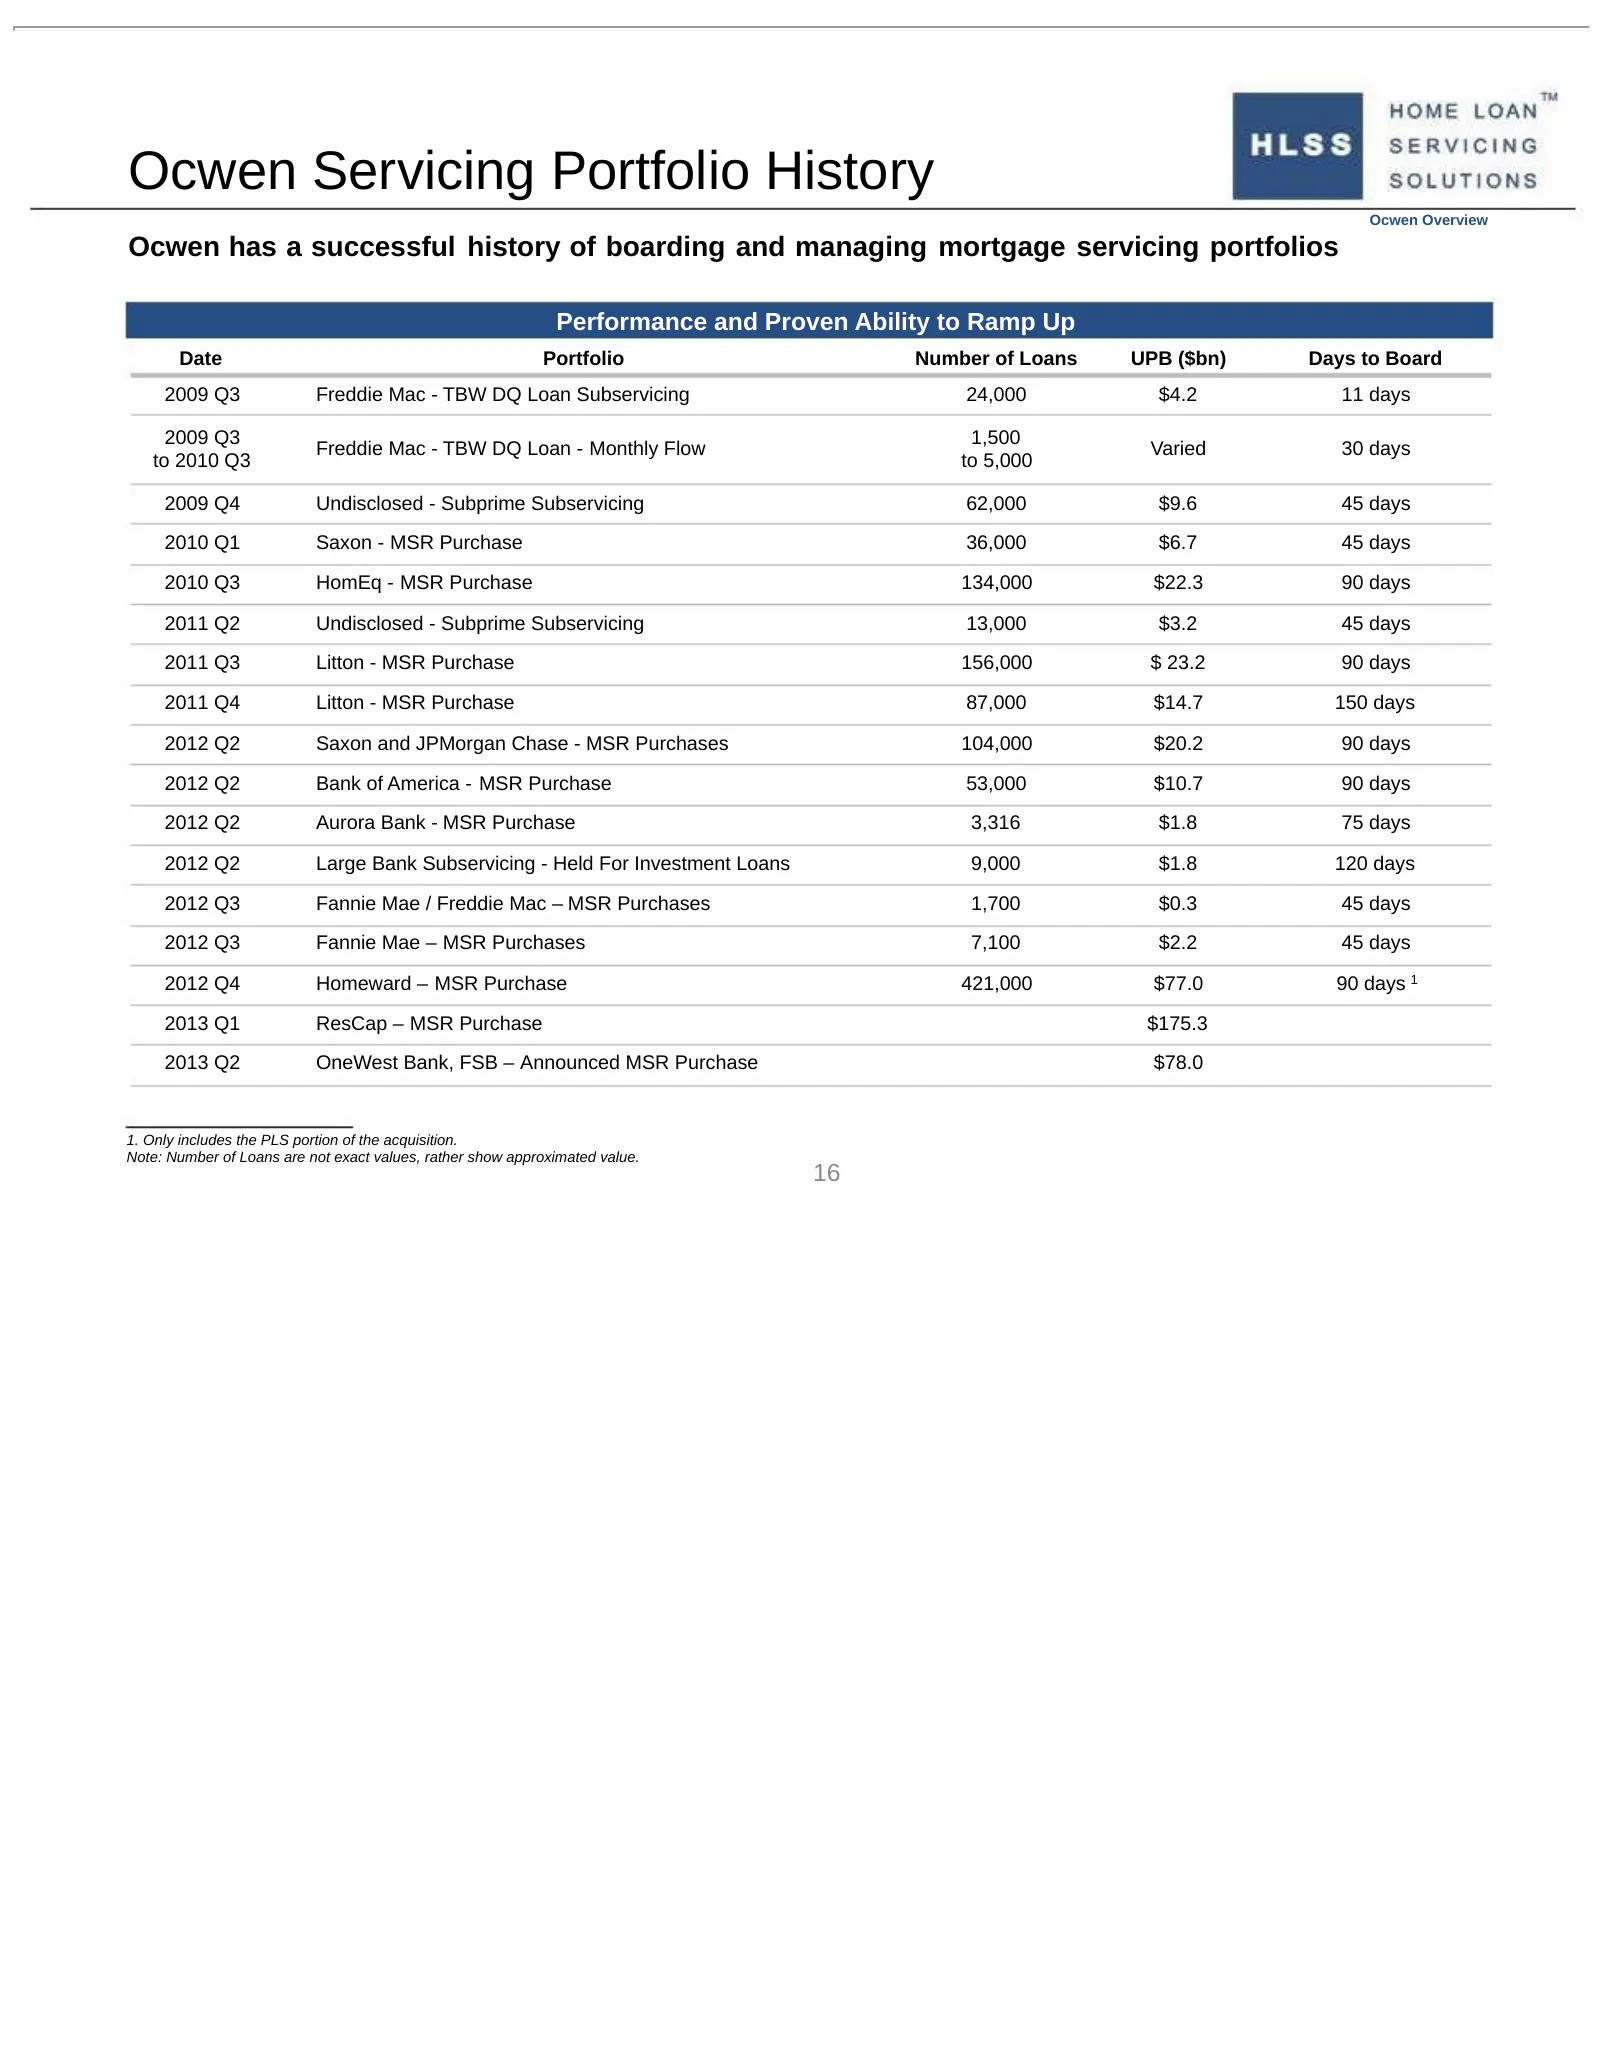
Ocwen Servicing Portfolio History Ocwen Overview Ocwen has a successful history of boarding and managing mortgage servicing portfolios Performance and Proven Ability to Ramp Up Date Portfolio Number of Loans UPB ($bn) Days to Board 2009 Q3 Freddie Mac - TBW DQ Loan Subservicing 24,000 $4.2 11 days 2
Slide 17: Ocwen Servicing Portfolio Update
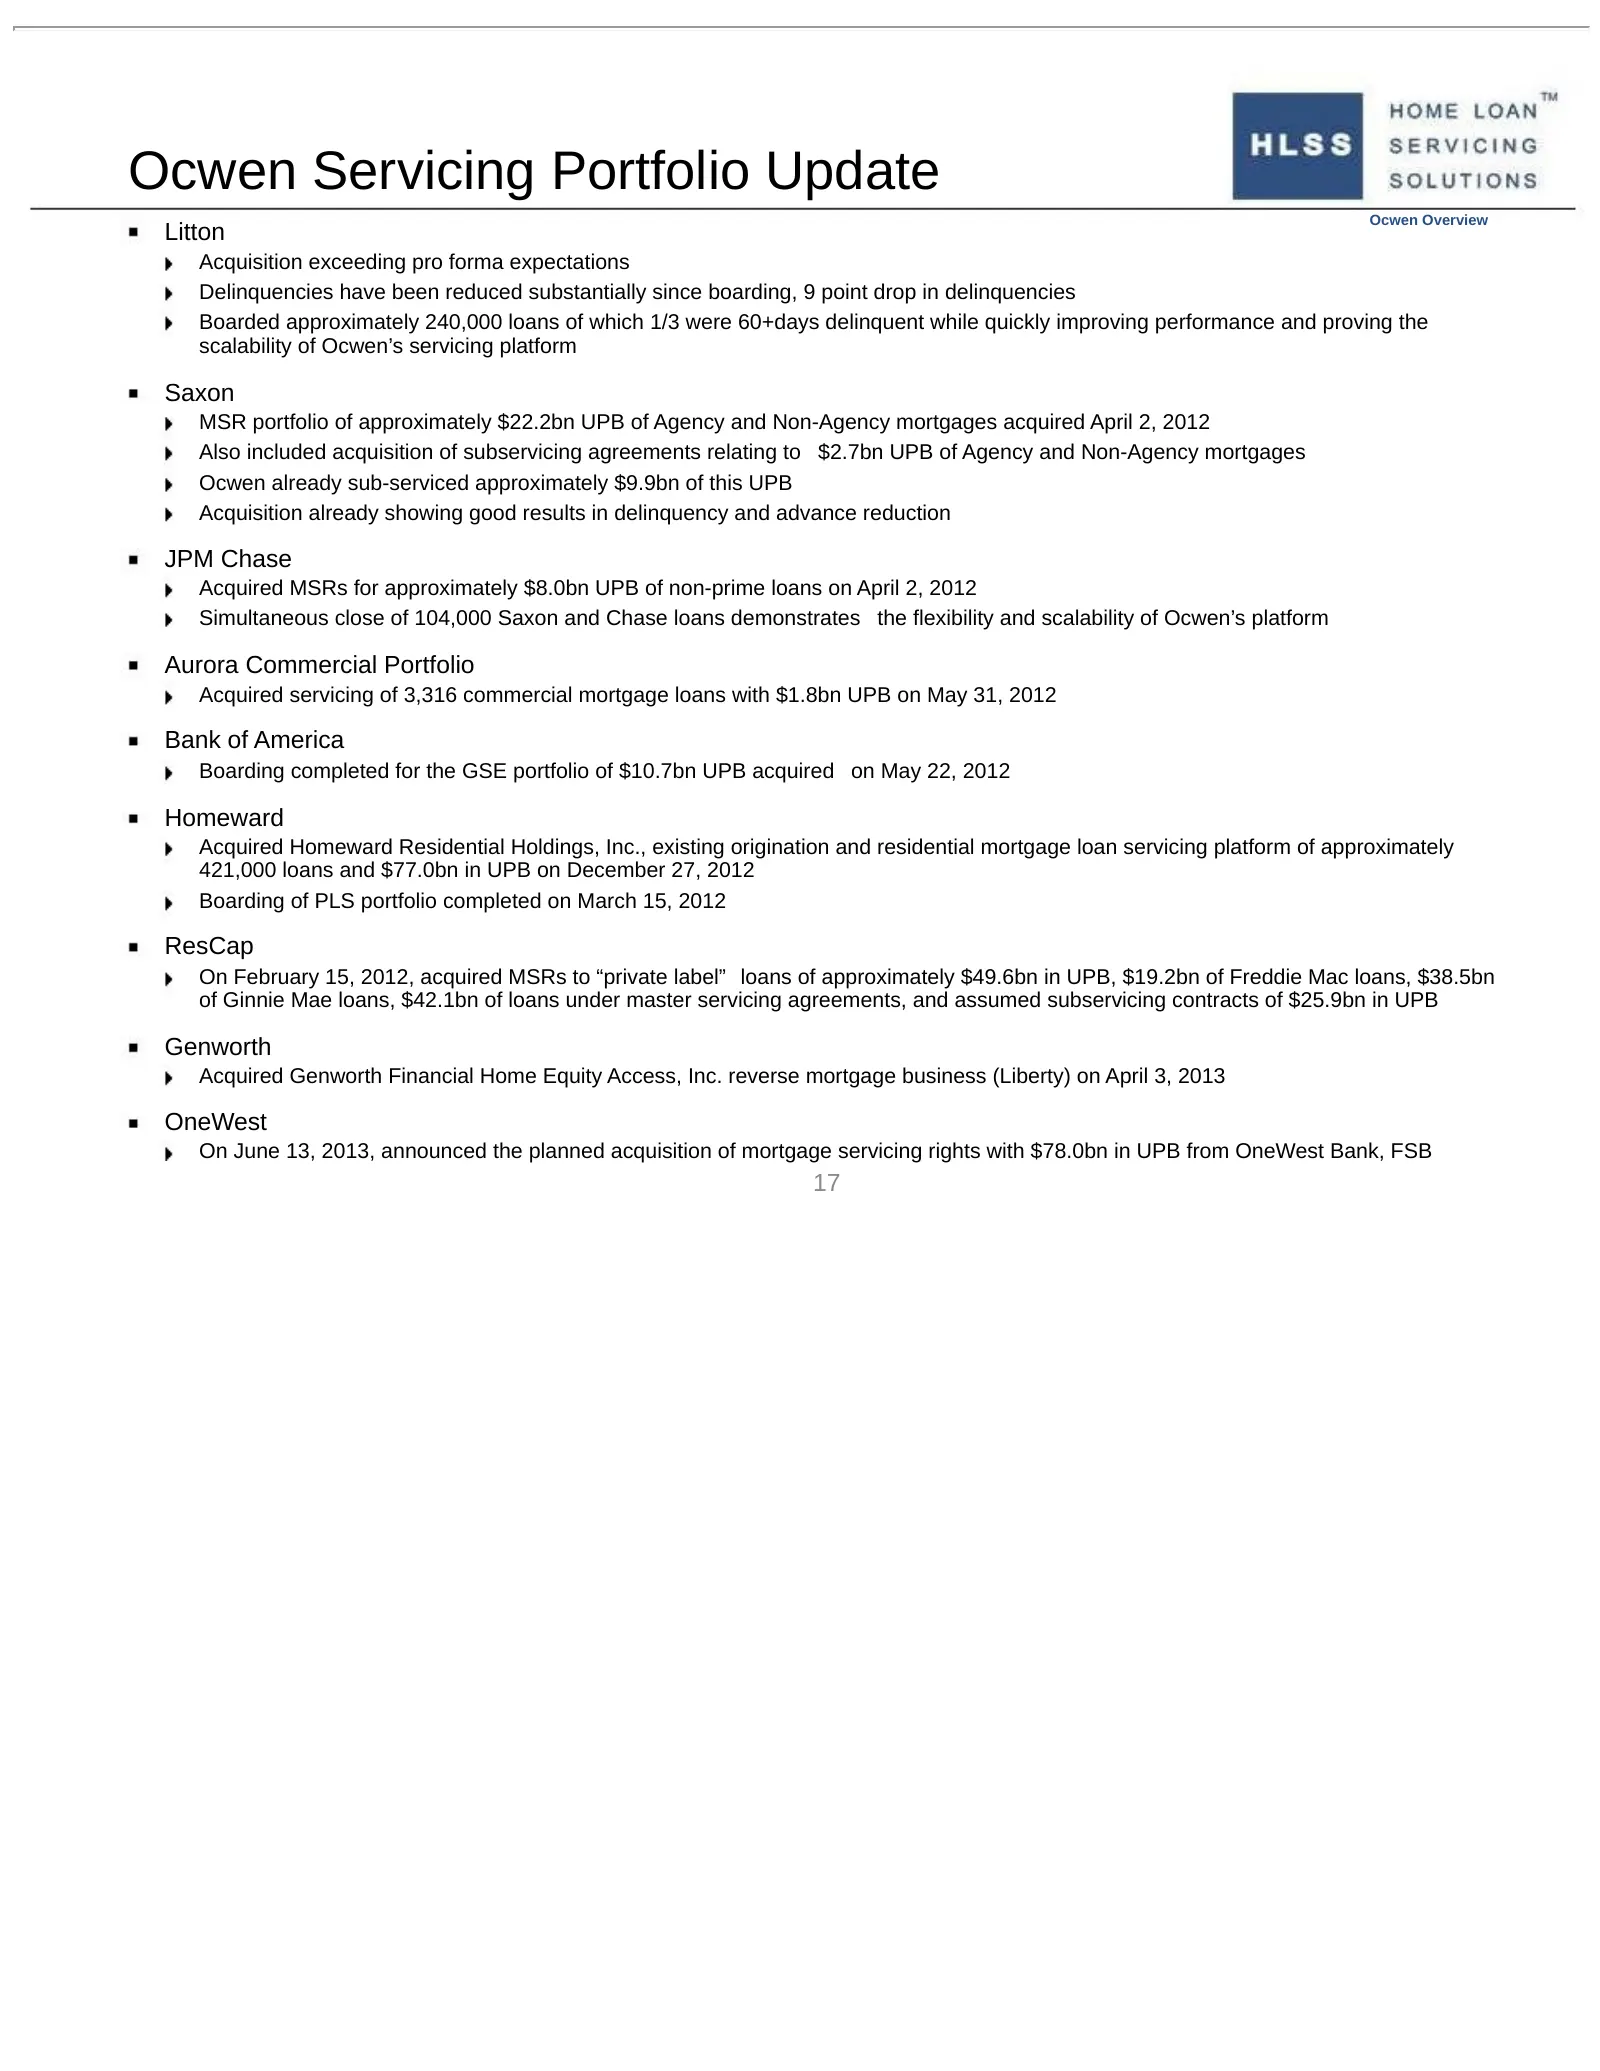
Ocwen Servicing Portfolio Update Ocwen Overview Litton Acquisition exceeding pro forma expectations Delinquencies have been reduced substantially since boarding, 9 point drop in delinquencies Boarded approximately 240,000 loans of which 1/3 were 60+days delinquent while quickly improving performance
Slide 18: Ocwen Servicing Effectiveness
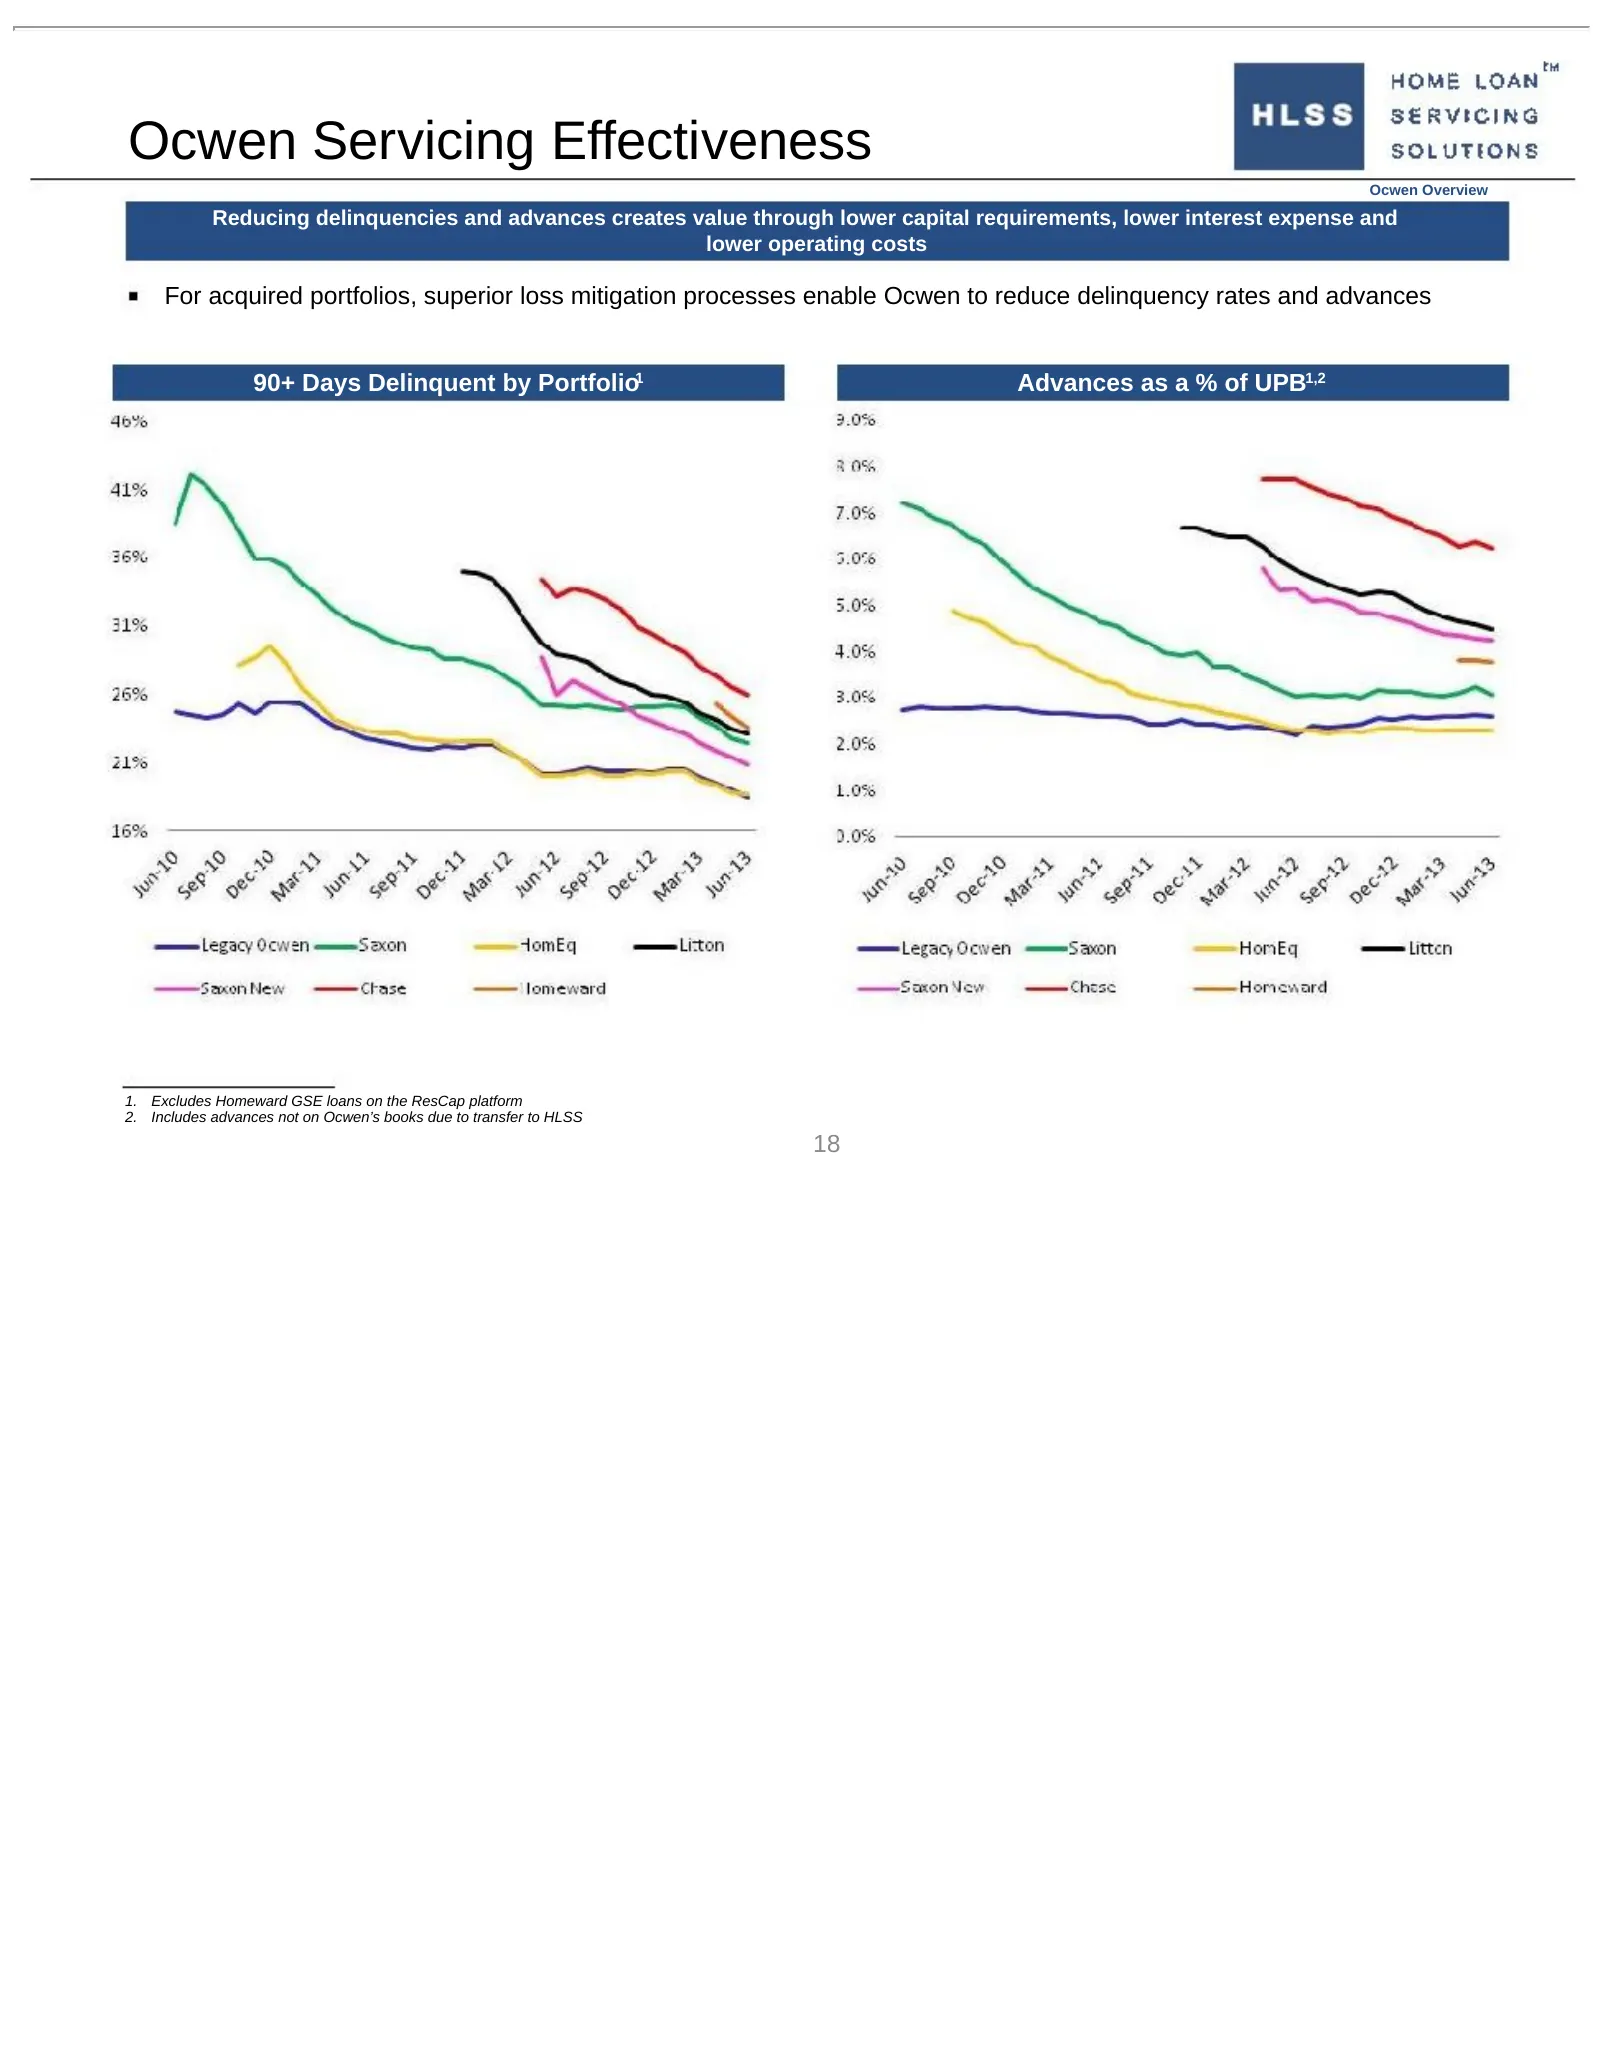
Ocwen Servicing Effectiveness Ocwen Overview Reducing delinquencies and advances creates value through lower capital requirements, lower interest expense and lower operating costs For acquired portfolios, superior loss mitigation processes enable Ocwen to reduce delinquency rates and advances 90+ Da
Slide 19: Ocwen Servicing Portfolio Details
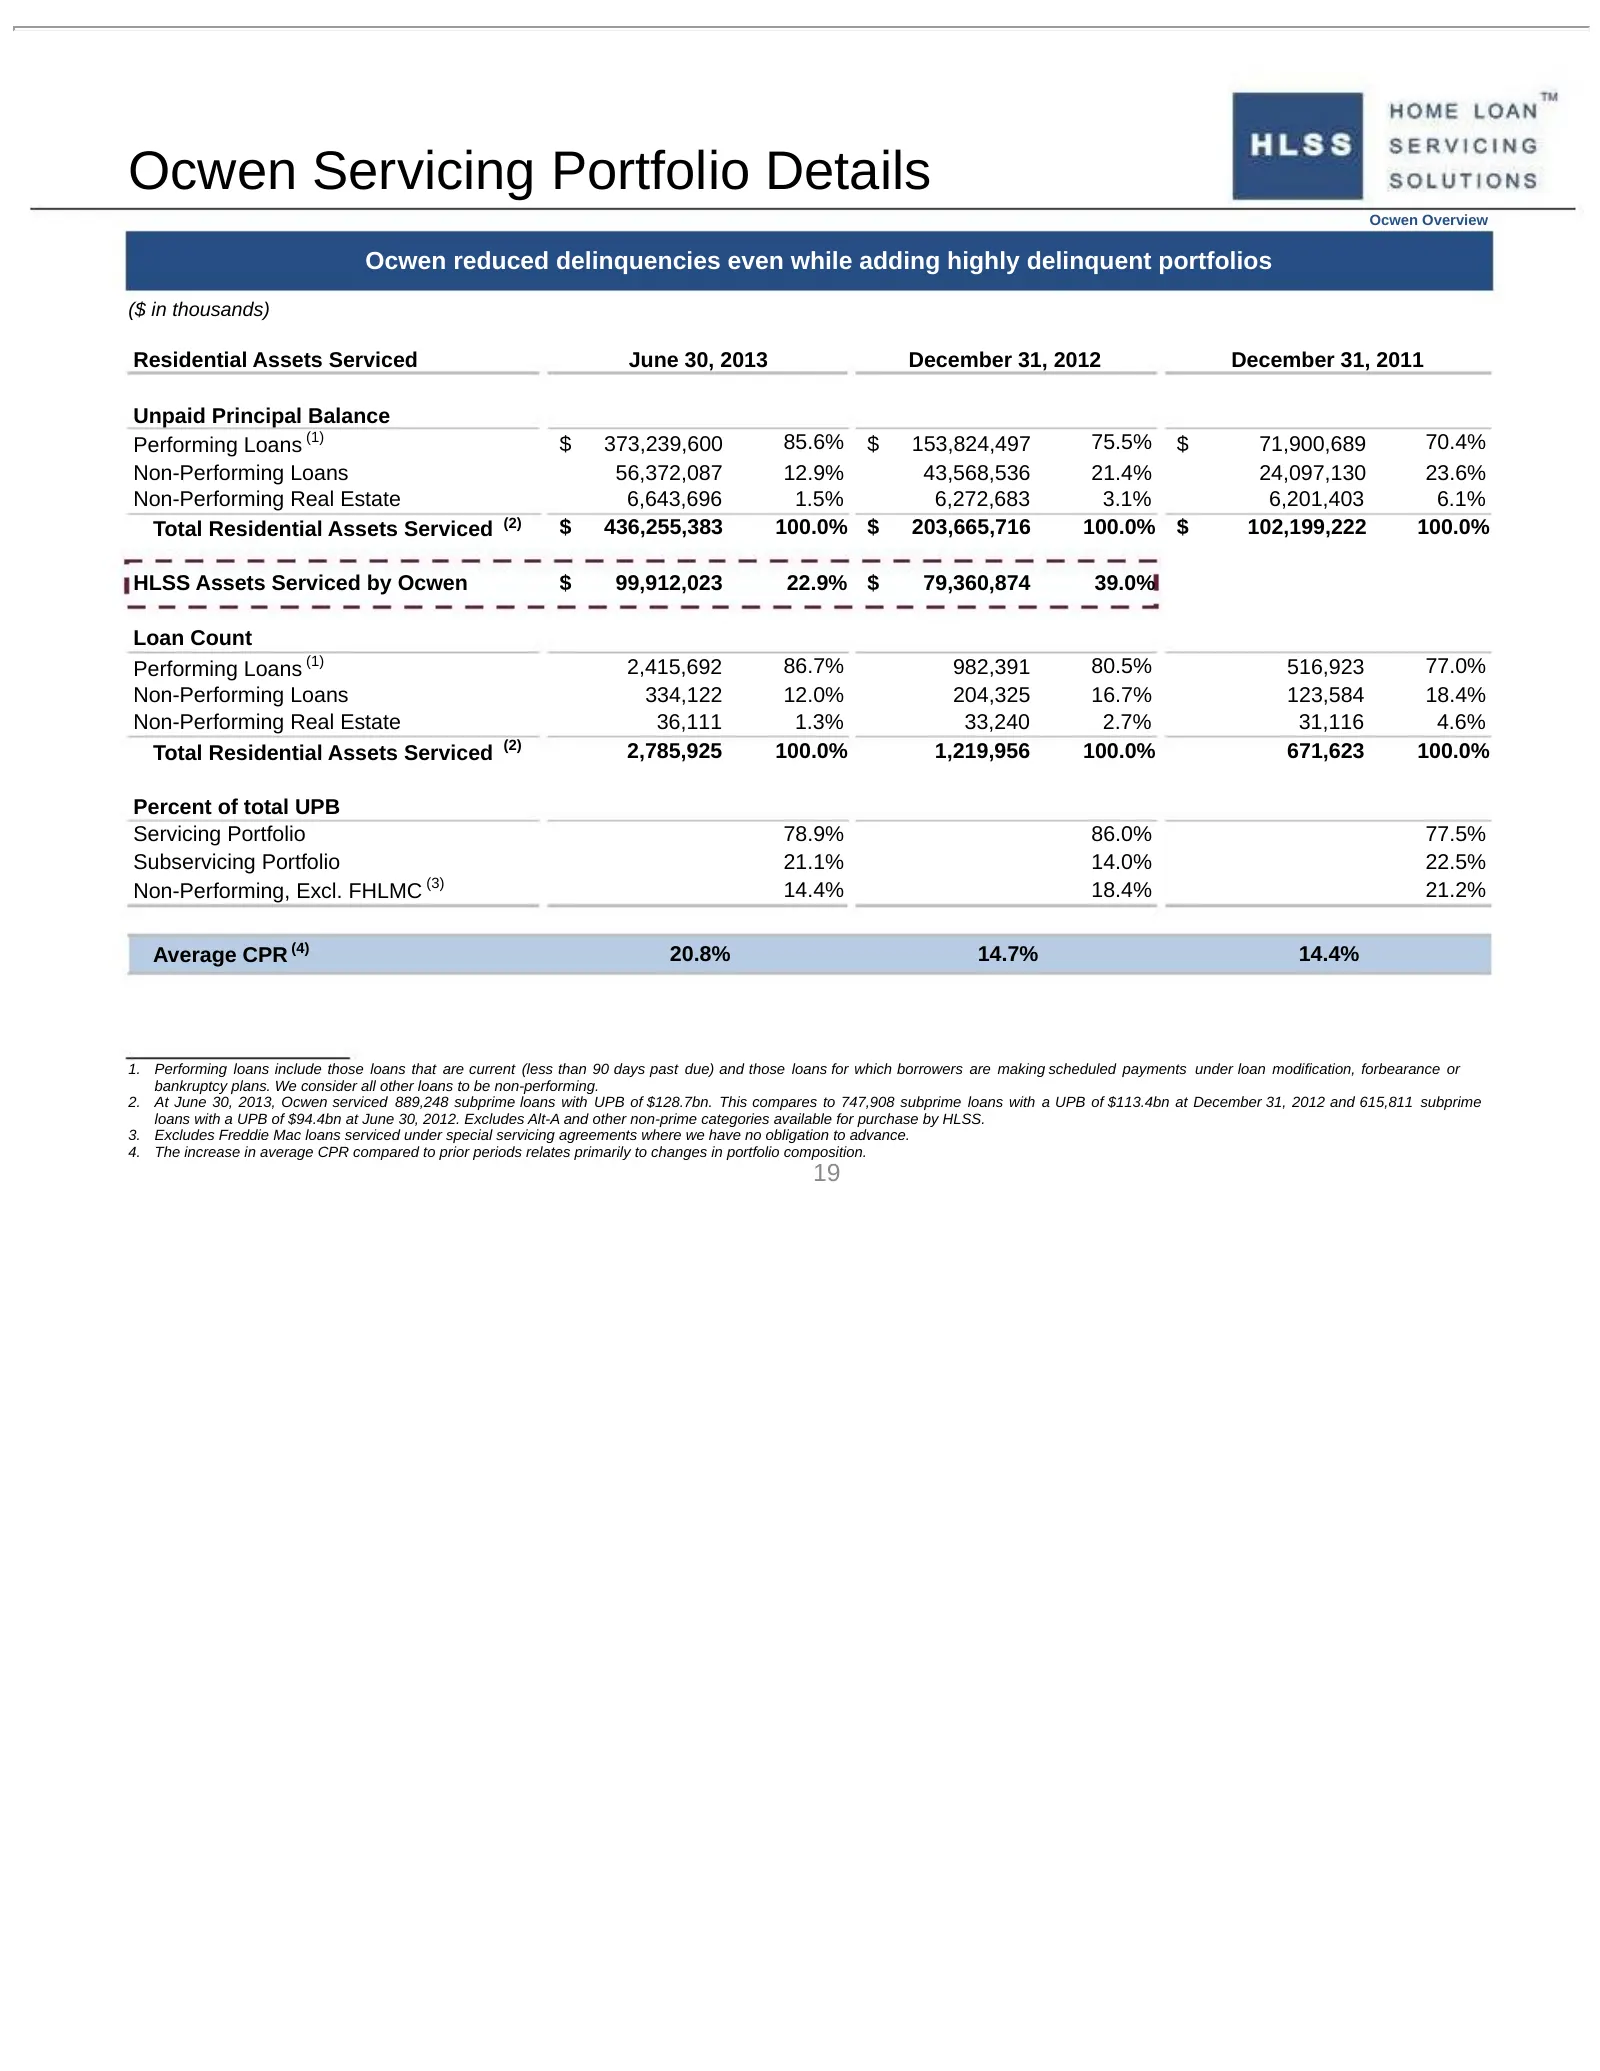
Ocwen Servicing Portfolio Details Ocwen Overview Ocwen reduced delinquencies even while adding highly delinquent portfolios ($ in thousands) Residential Assets Serviced June 30, 2013 December 31, 2012 December 31, 2011 Unpaid Principal Balance Performing Loans (1) $ 373,239,600 85.6% $ 153,824,497 7

Slide 20: HSART Master Trust Overview
* * * ** * * * * HSART Master Trust Overview 20
Slide 21: SAF Market Update
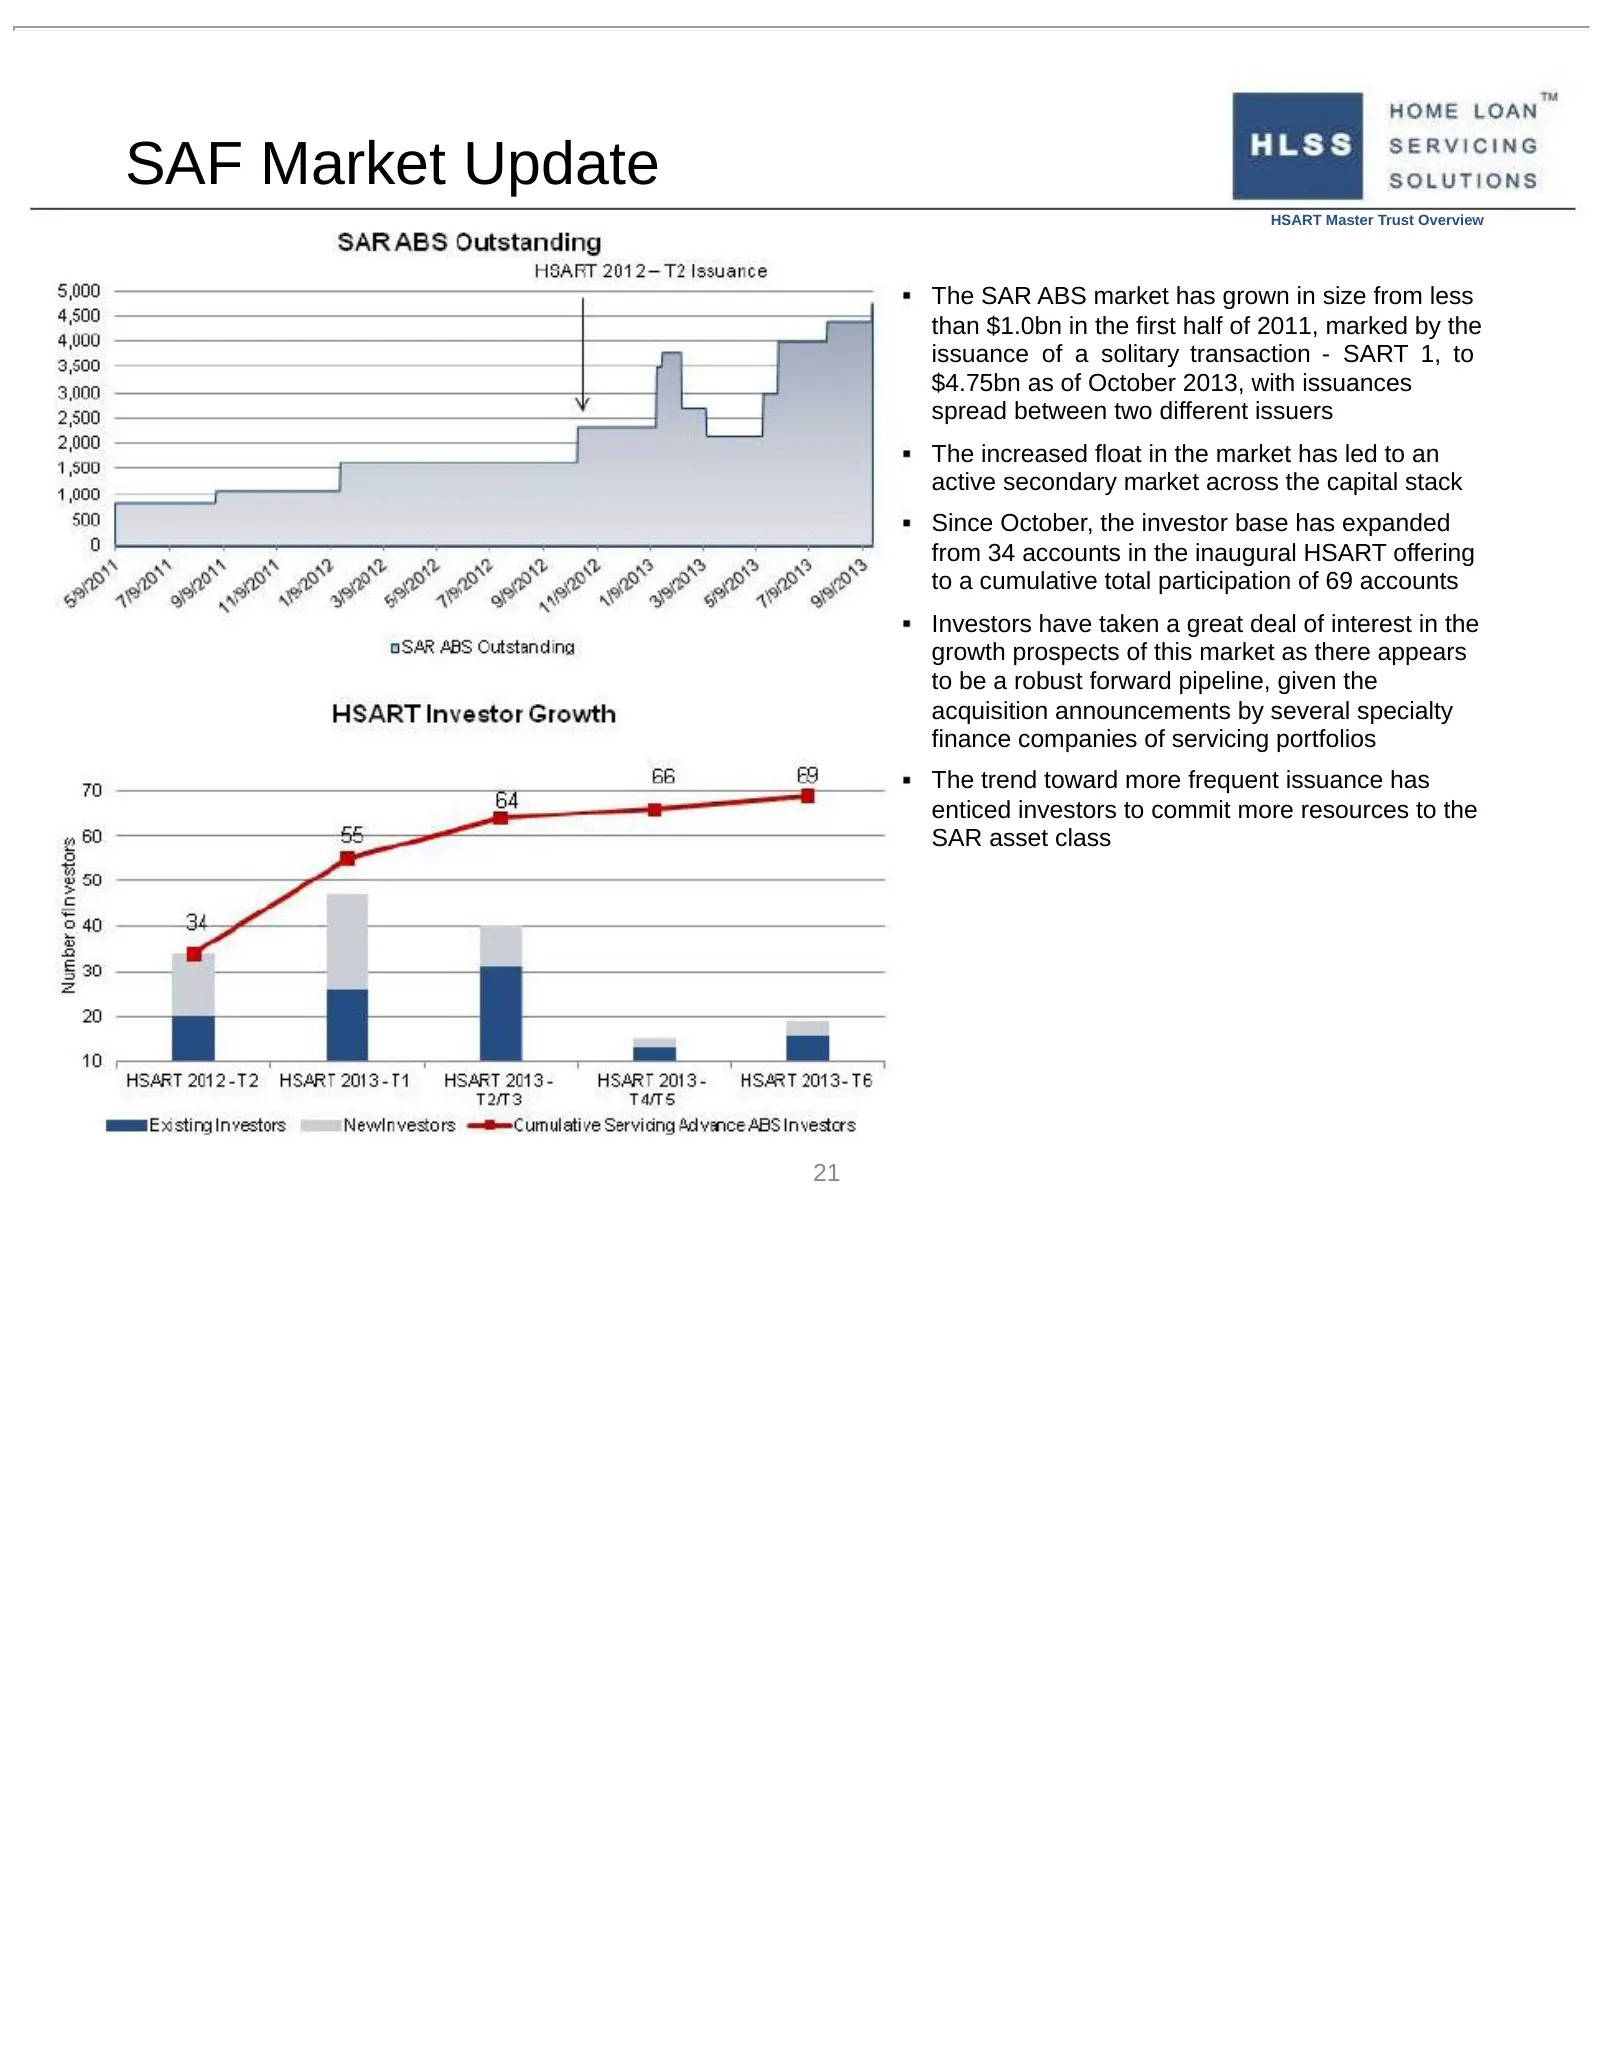
SAF Market Update HSART Master Trust Overview The SAR ABS market has grown in size from less than $1.0bn in the first half of 2011, marked by the issuance of a solitary transaction - SART 1, to $4.75bn as of October 2013, with issuances spread between two different issuers The increased float in the
Slide 22: HSART Structural Summary
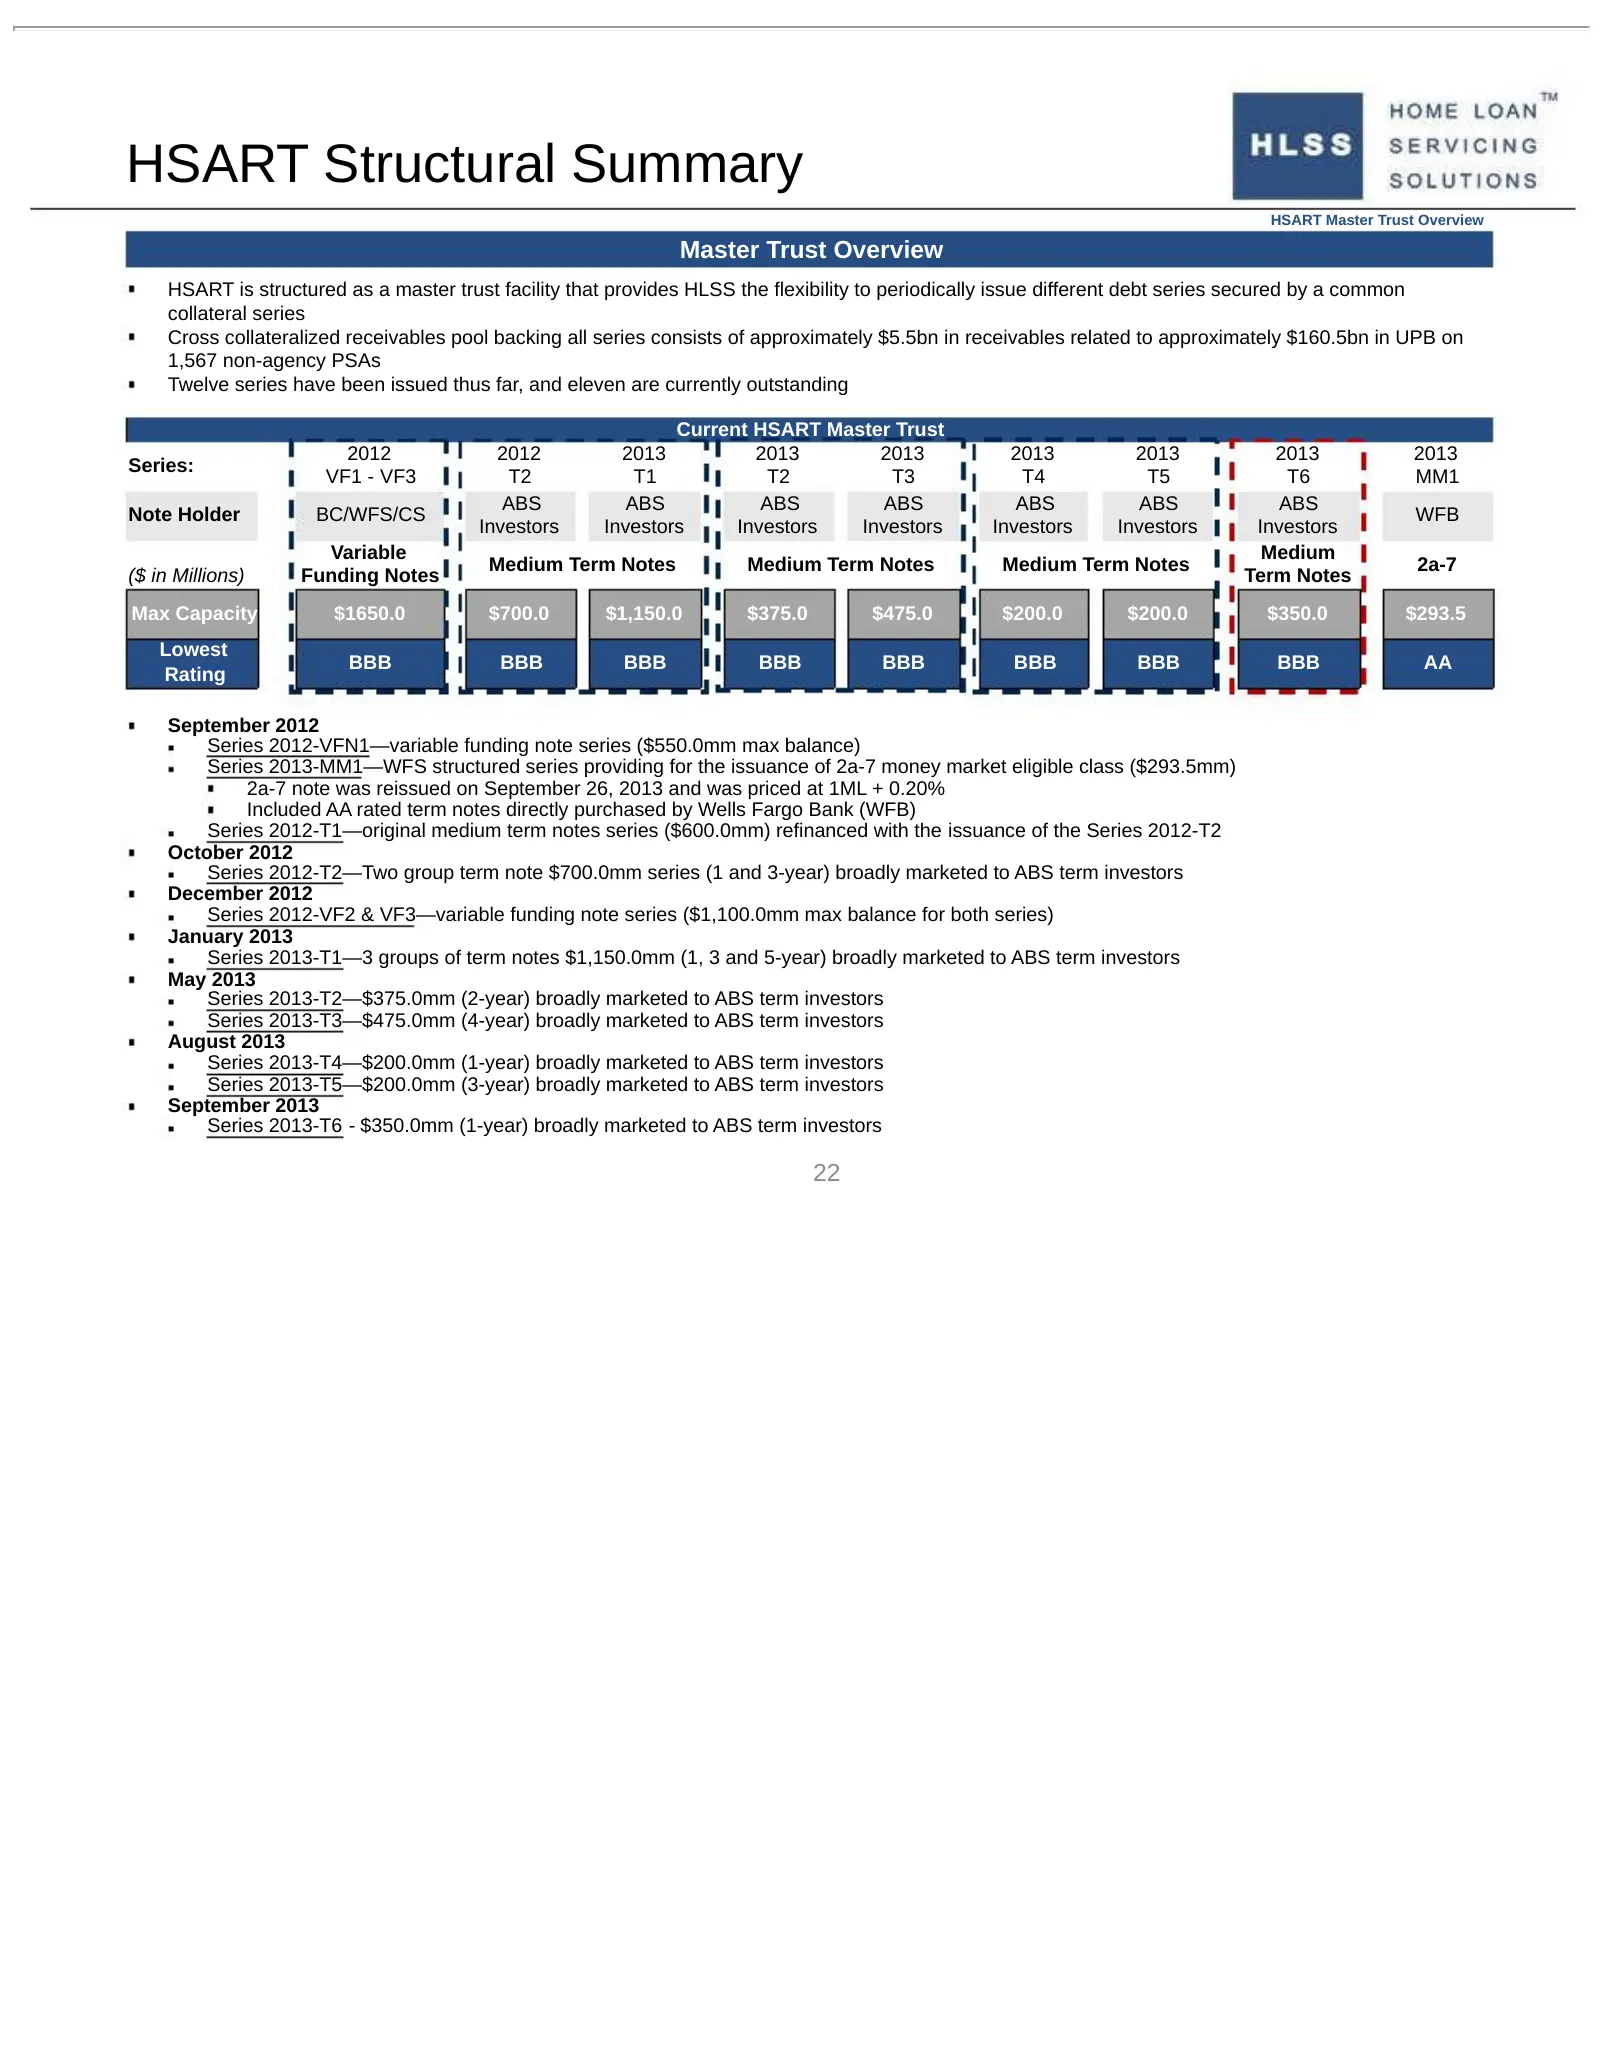
HSART Structural Summary HSART Master Trust Overview Master Trust Overview HSART is structured as a master trust facility that provides HLSS the flexibility to periodically issue different debt series secured by a common collateral series Cross collateralized receivables pool backing all series cons
Slide 23: HSART Transaction Phases
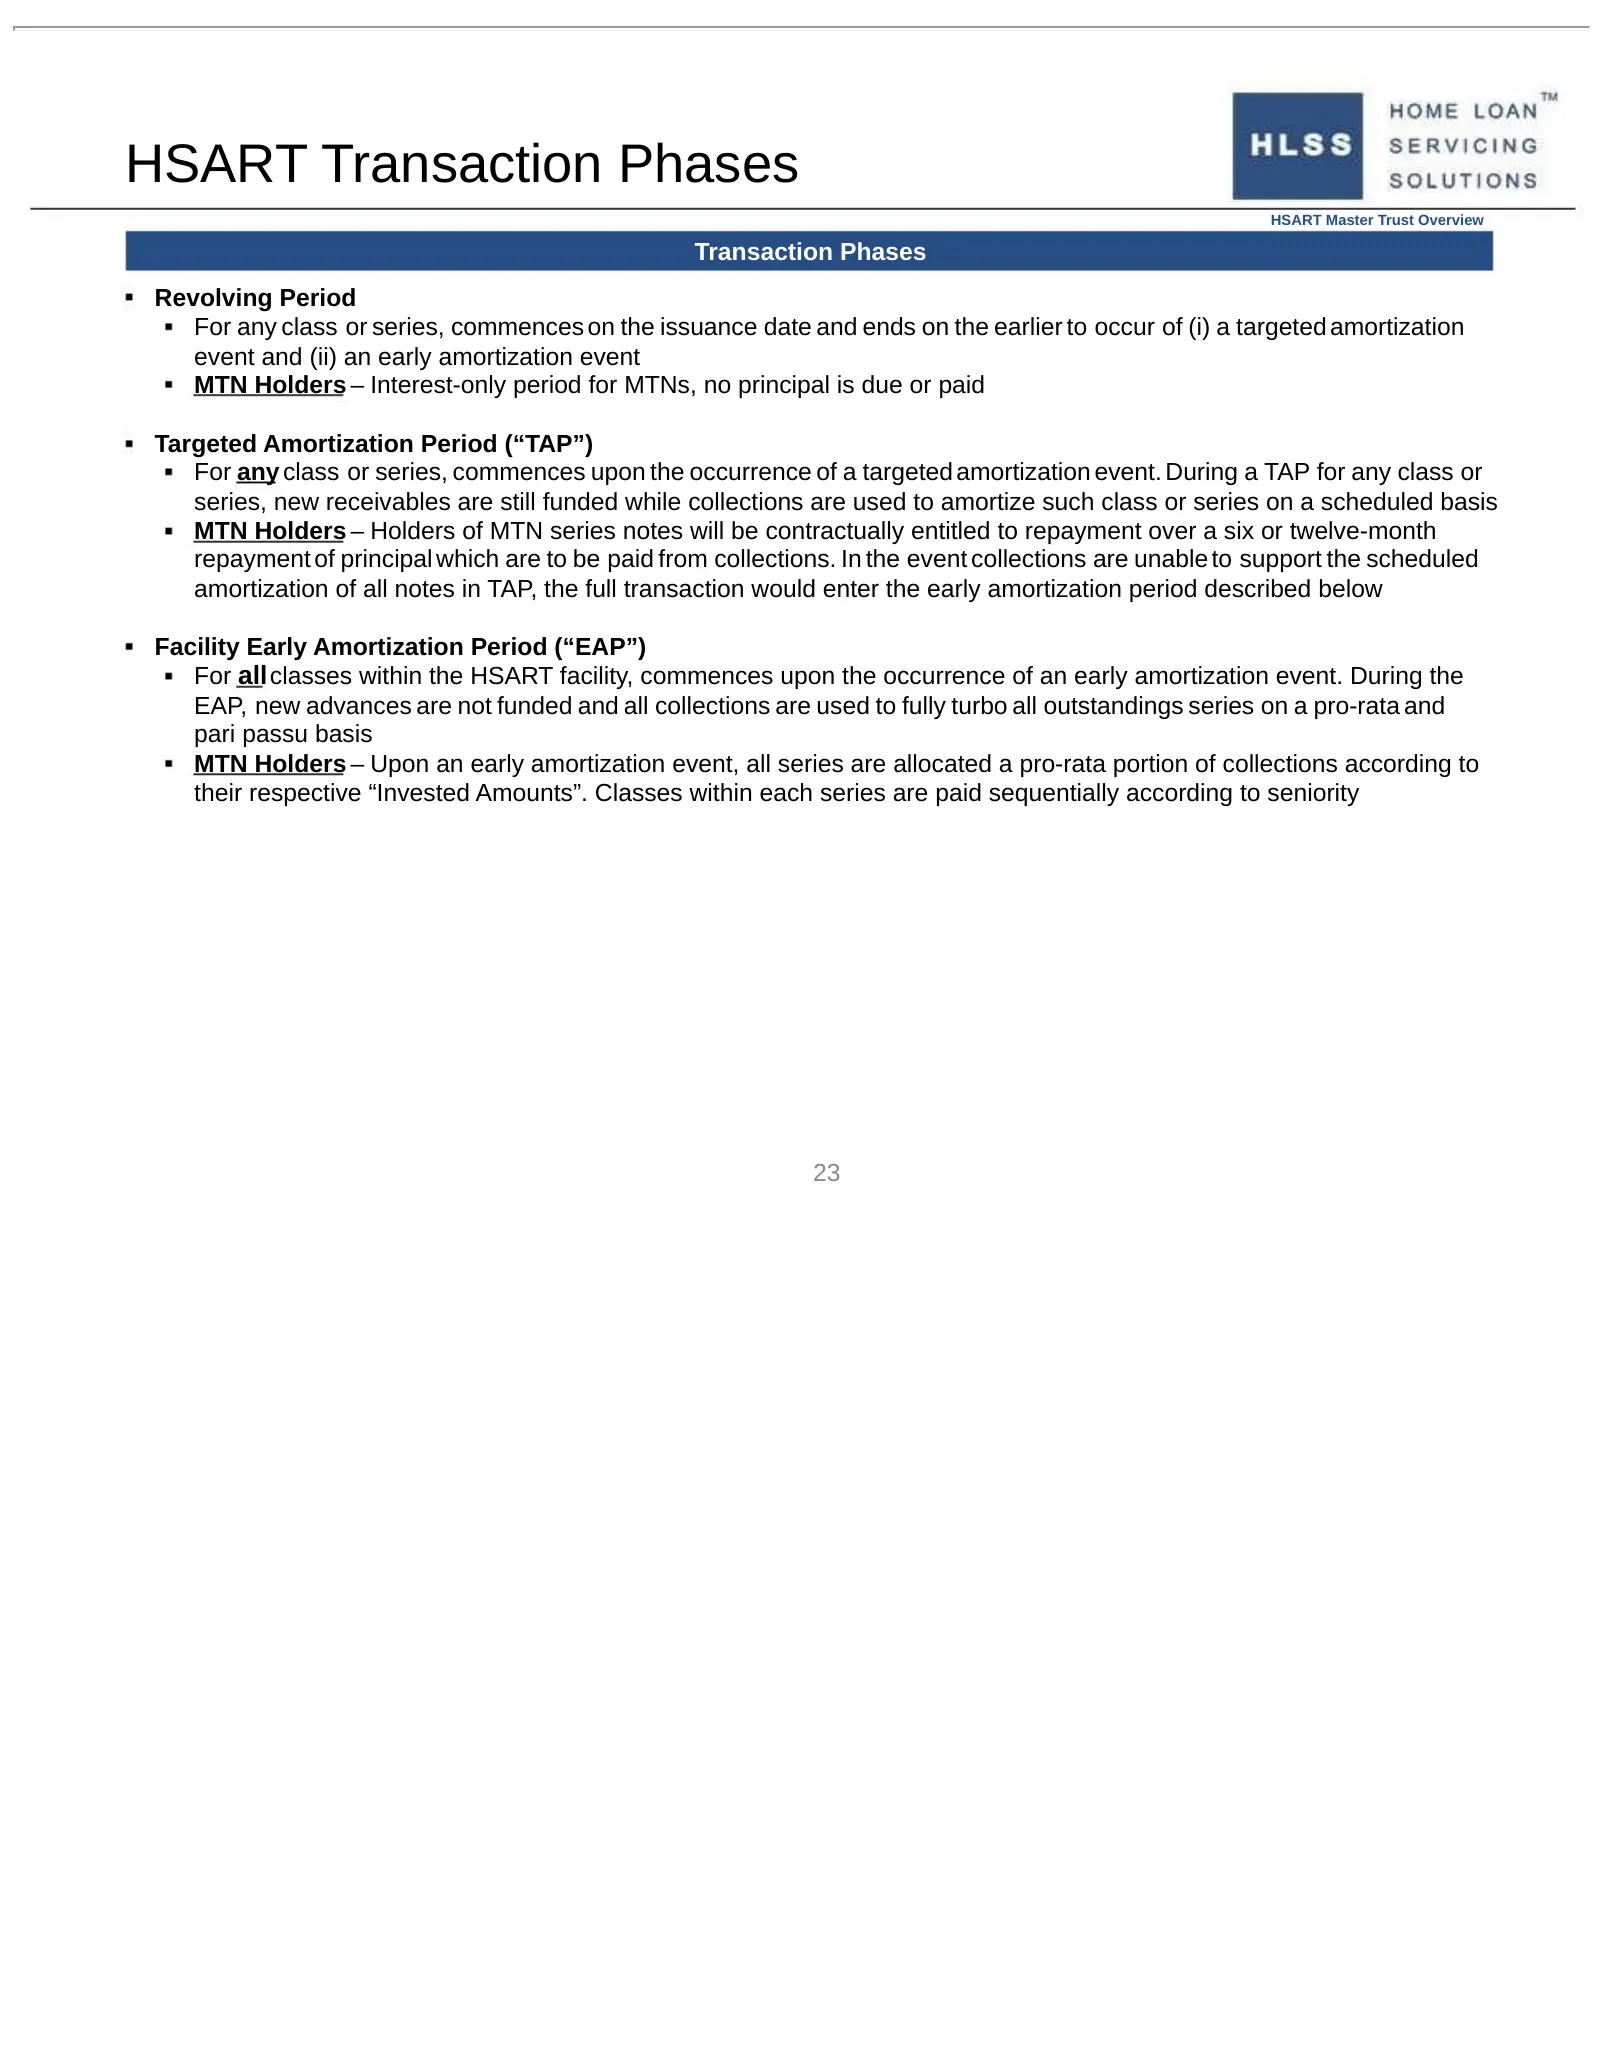
HSART Transaction Phases HSART Master Trust Overview Transaction Phases Revolving Period For any class or series, commences on the issuance date and ends on the earlier to occur of (i) a targeted amortization event and (ii) an early amortization event MTN Holders – Interest-only period for MTNs, no
Slide 24: HSART Investor Protections
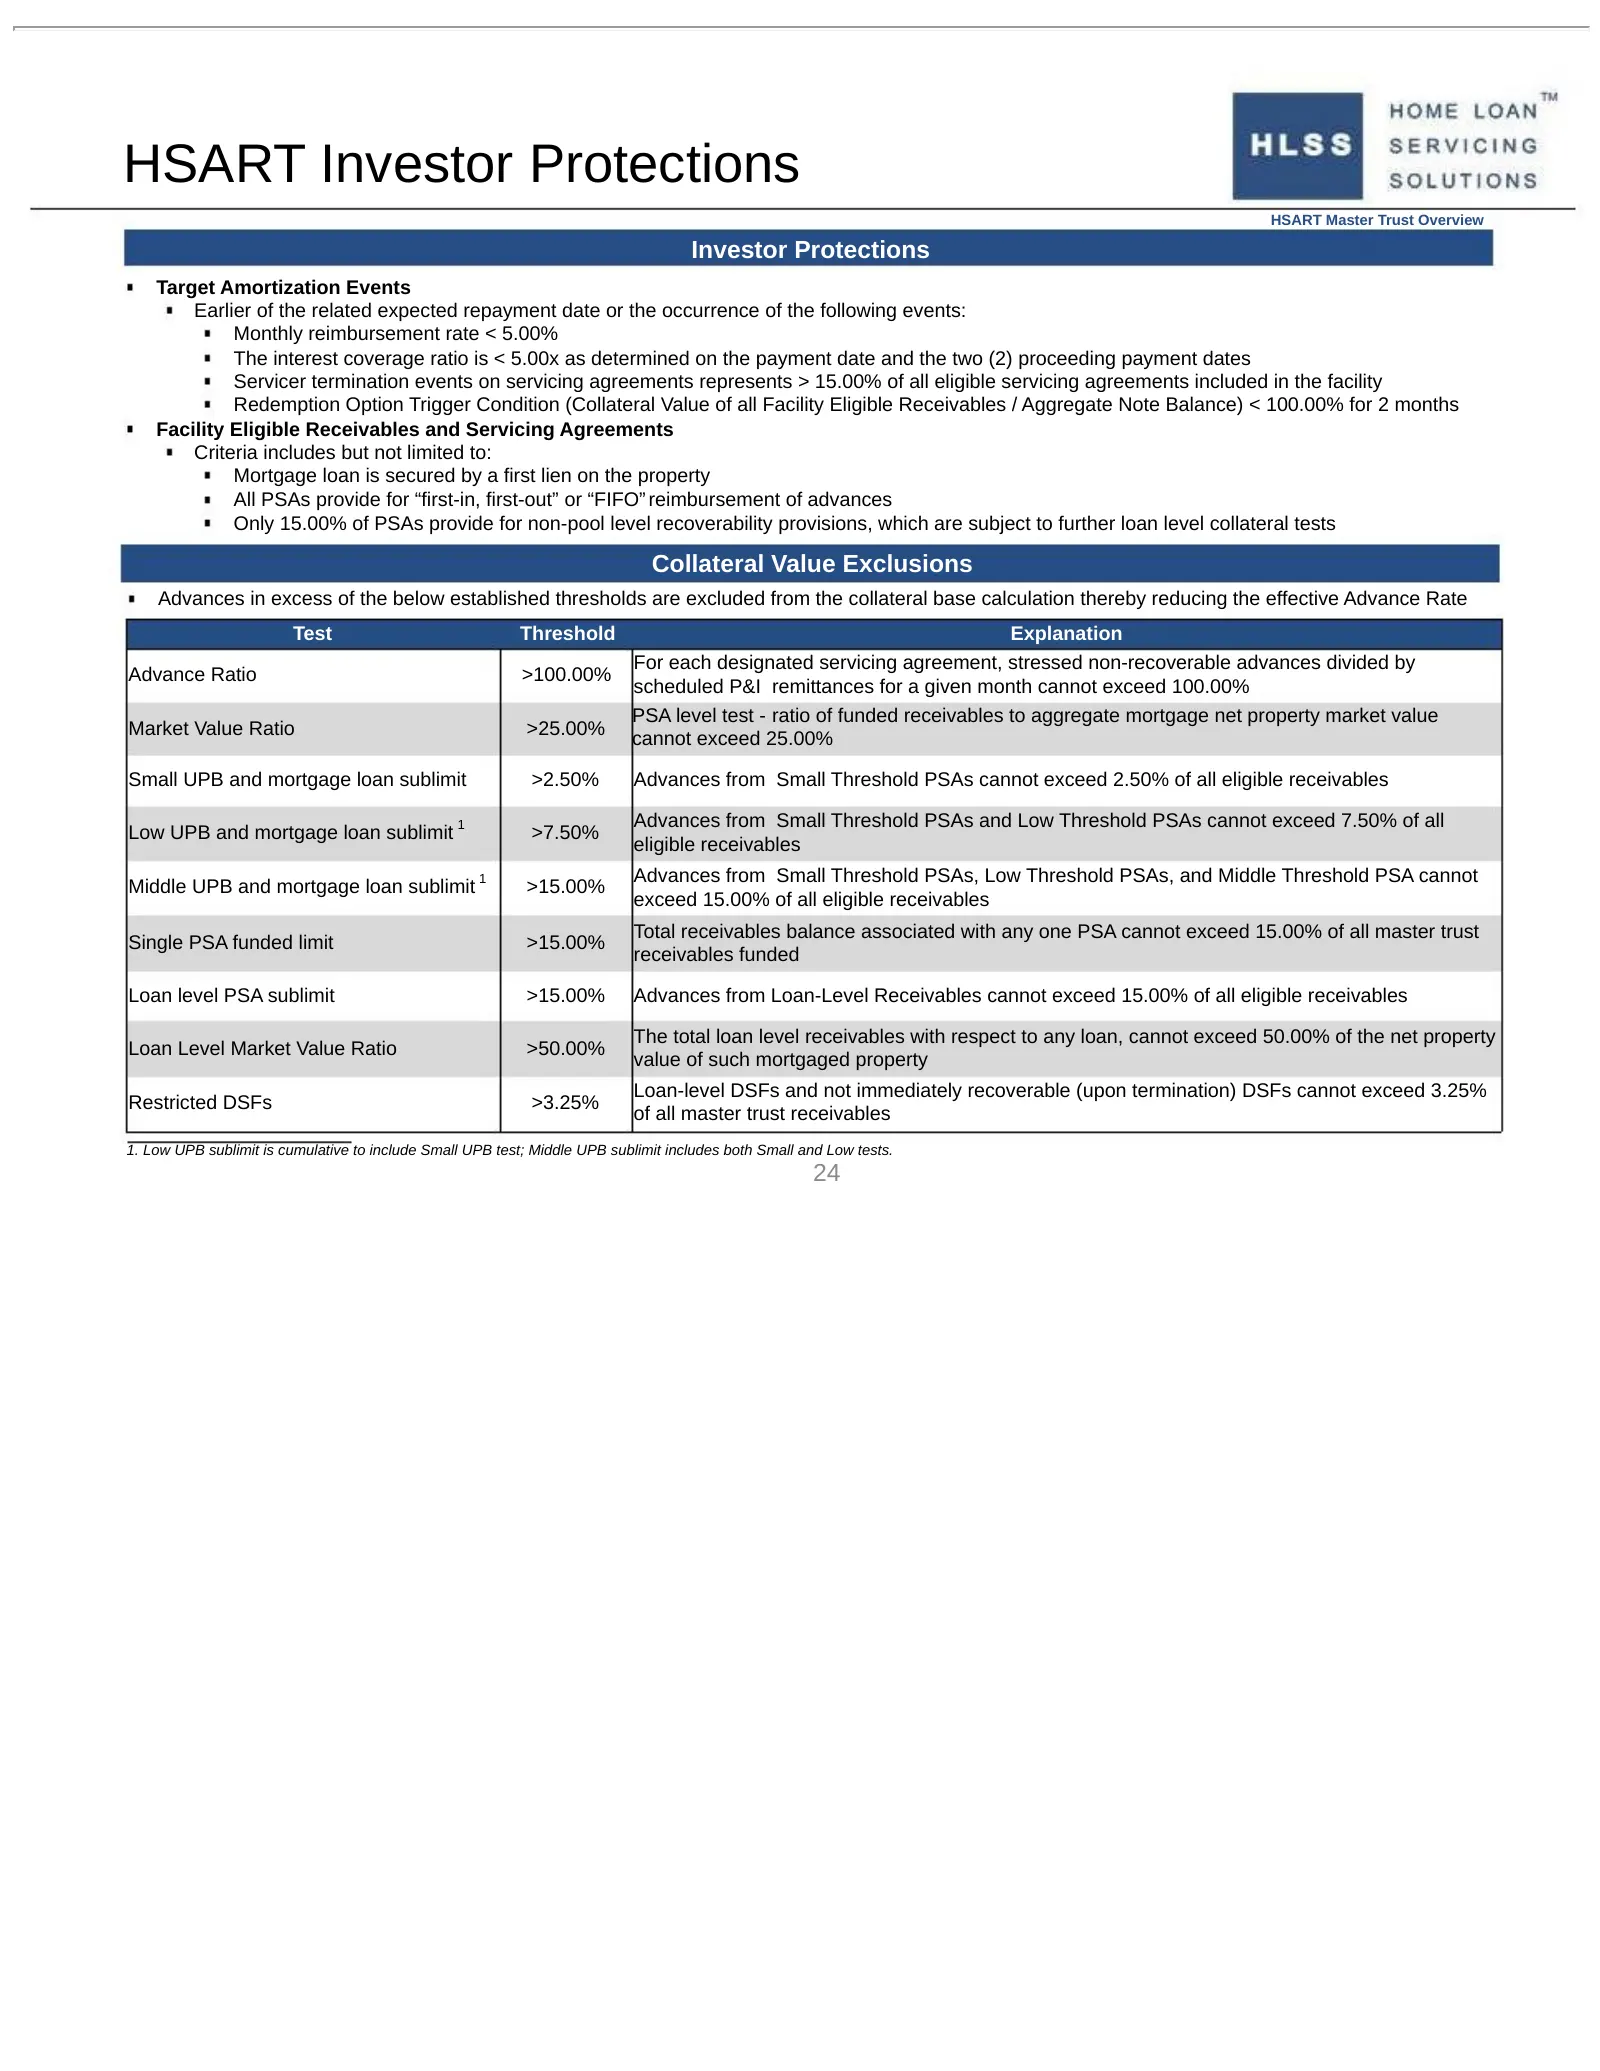
HSART Investor Protections HSART Master Trust Overview Investor Protections Target Amortization Events Earlier of the related expected repayment date or the occurrence of the following events: Monthly reimbursement rate < 5.00% The interest coverage ratio is < 5.00x as determined on the payment date
Slide 25: HSART Trigger Advance Rate
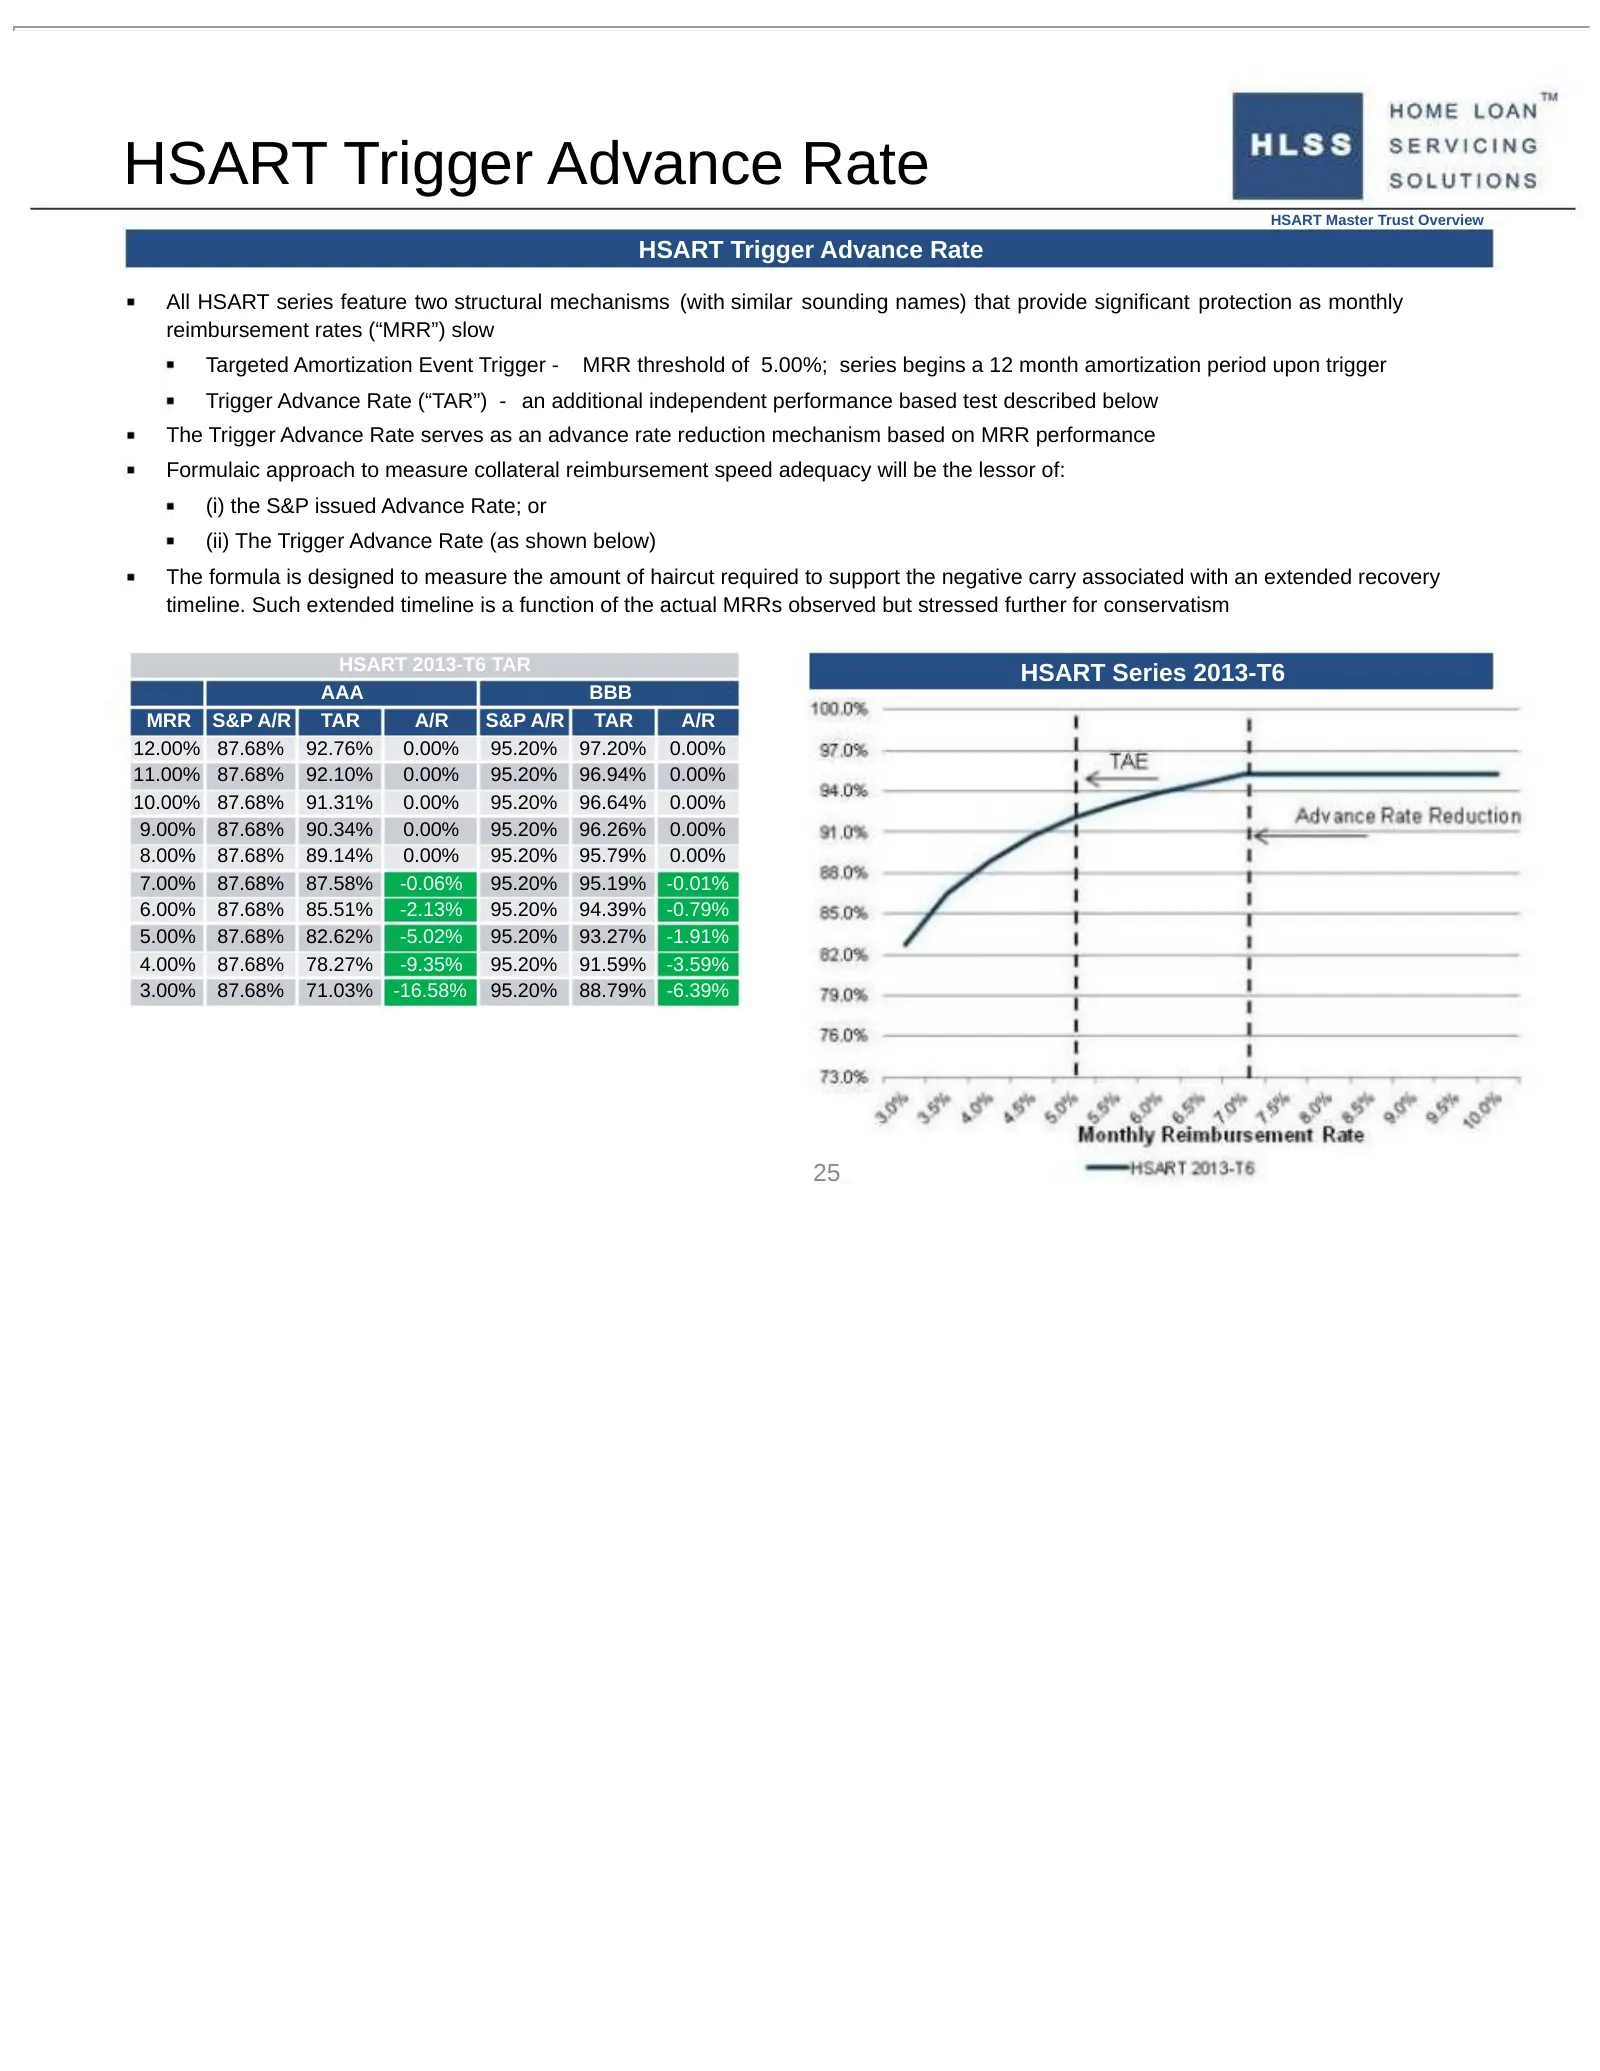
HSART Trigger Advance Rate HSART Master Trust Overview HSART Trigger Advance Rate All HSART series feature two structural mechanisms (with similar sounding names) that provide significant protection as monthly reimbursement rates (“MRR”) slow Targeted Amortization Event Trigger - MRR threshold of 5.
Slide 26: Master Trust Receivables Distribution
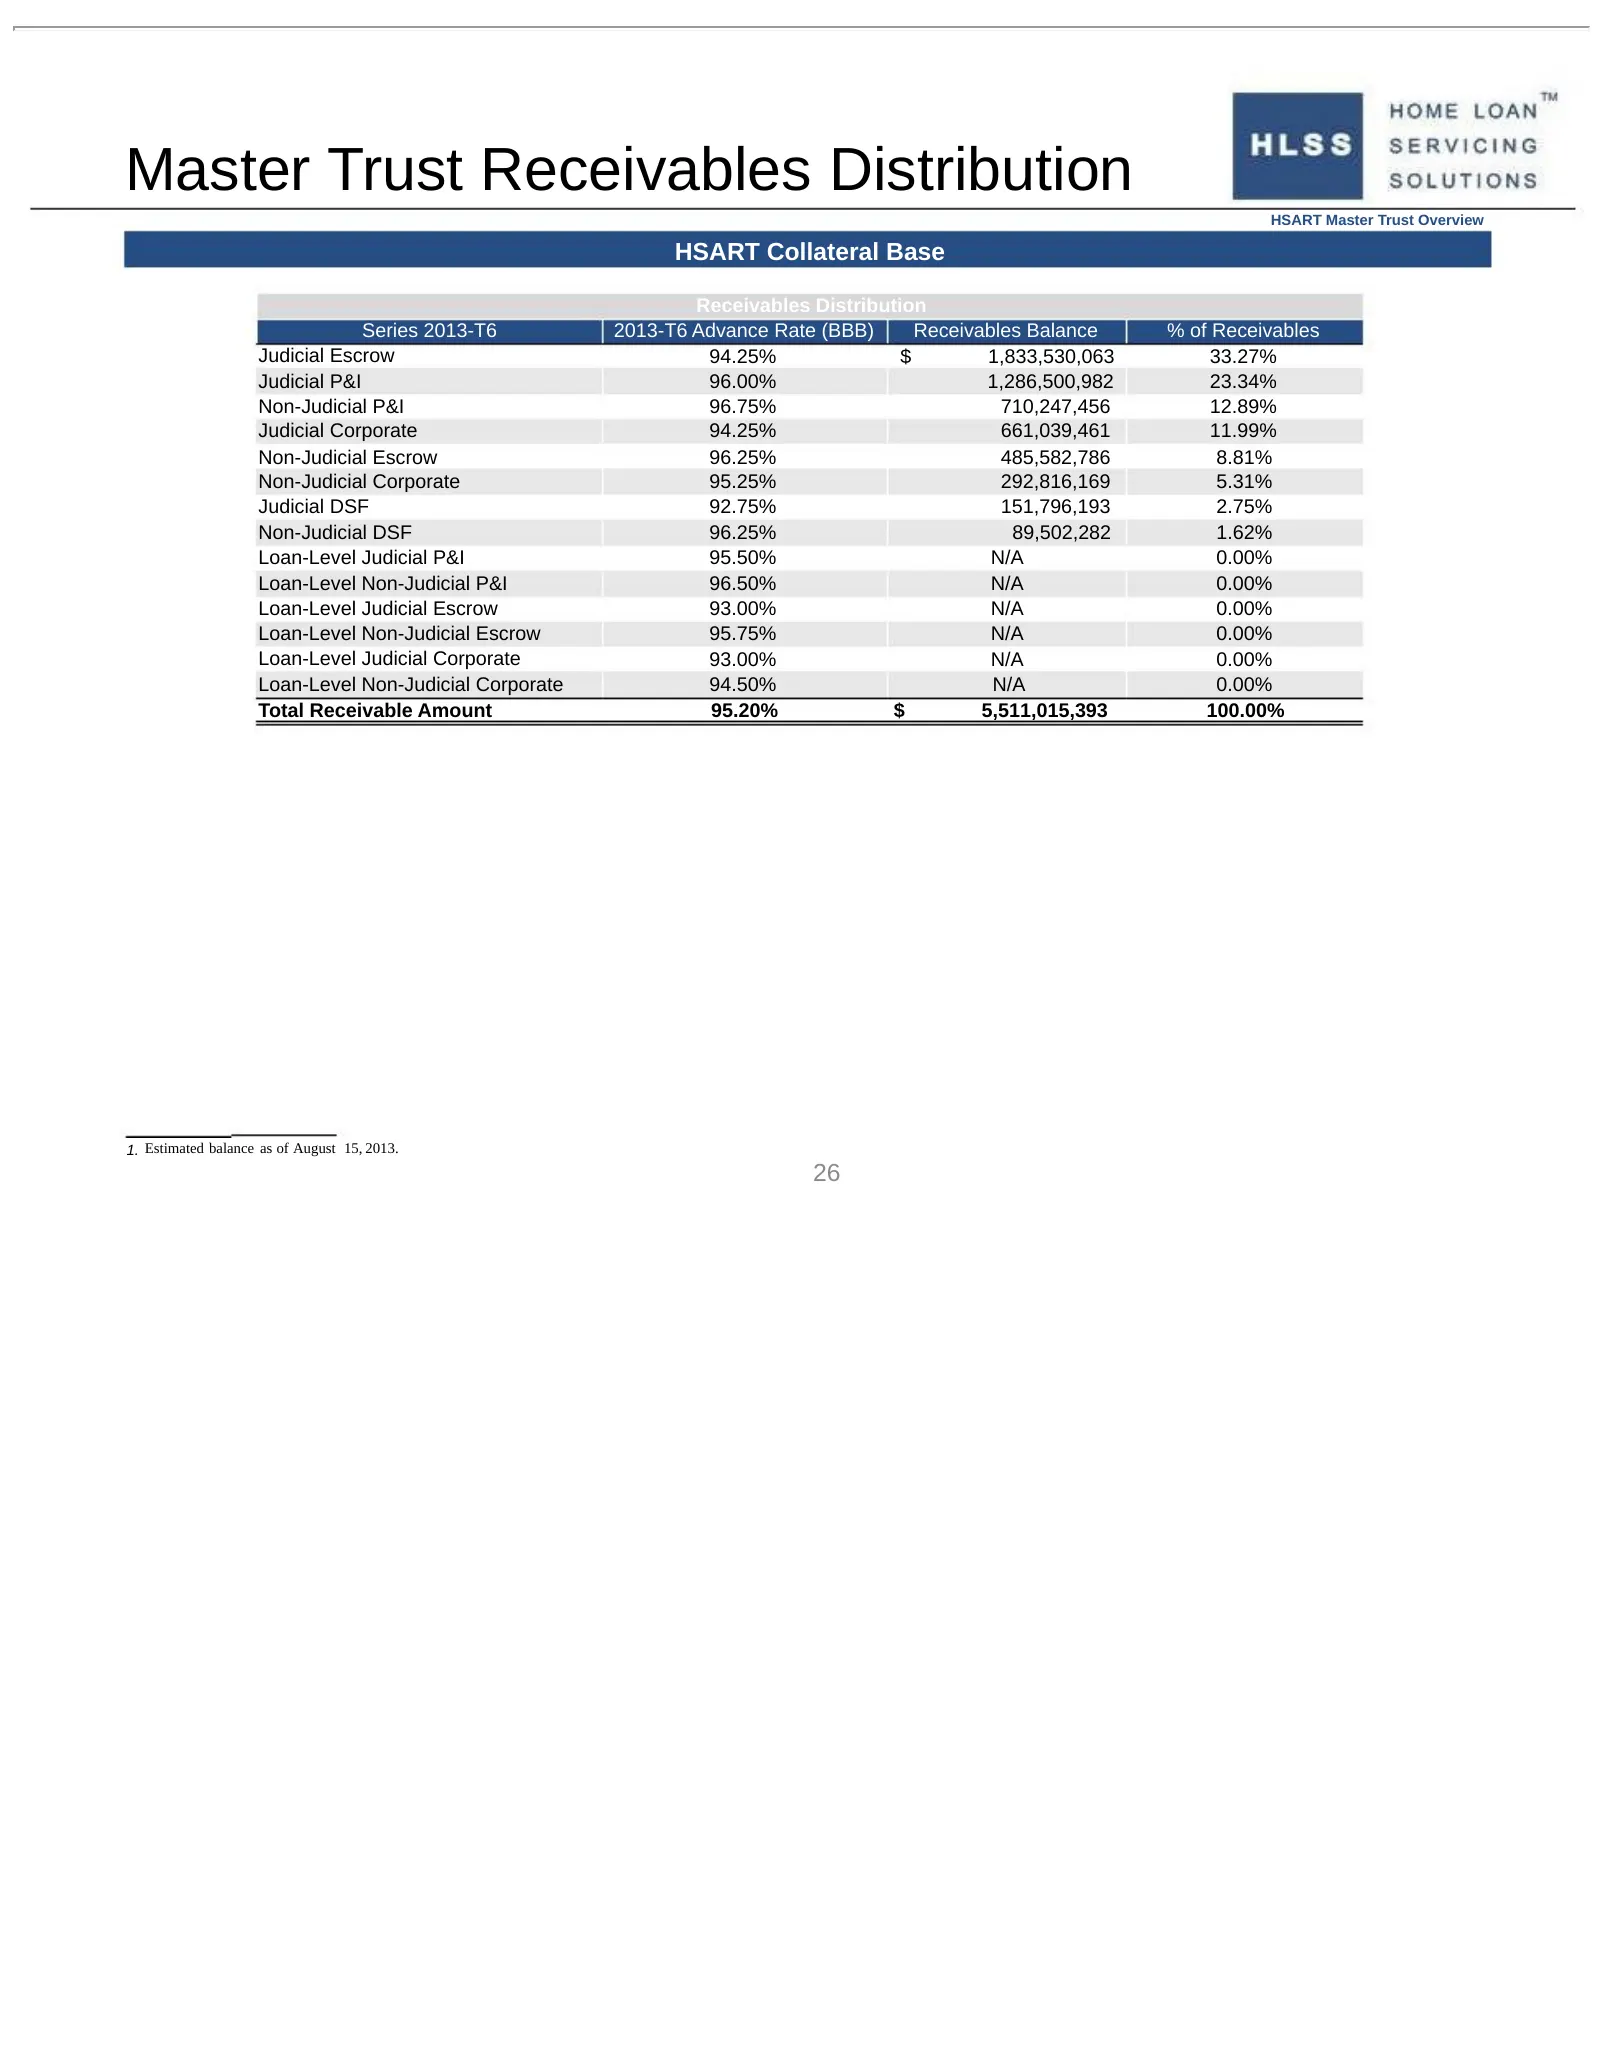
Master Trust Receivables Distribution HSART Master Trust Overview HSART Collateral Base Receivables Distribution Series 2013-T6 2013-T6 Advance Rate (BBB) Receivables Balance % of Receivables Judicial Escrow 94.25% $ 1,833,530,063 33.27% Judicial P&I 96.00% 1,286,500,982 23.34% Non-Judicial P&I 96.7

Slide 27: Appendices
HOME LOAN” hee SERVICING SOLUTIONS Appendices 27
Slide 28: Appendix: Past Transactions
* * * * * * * * Appendix: Past Transactions 28
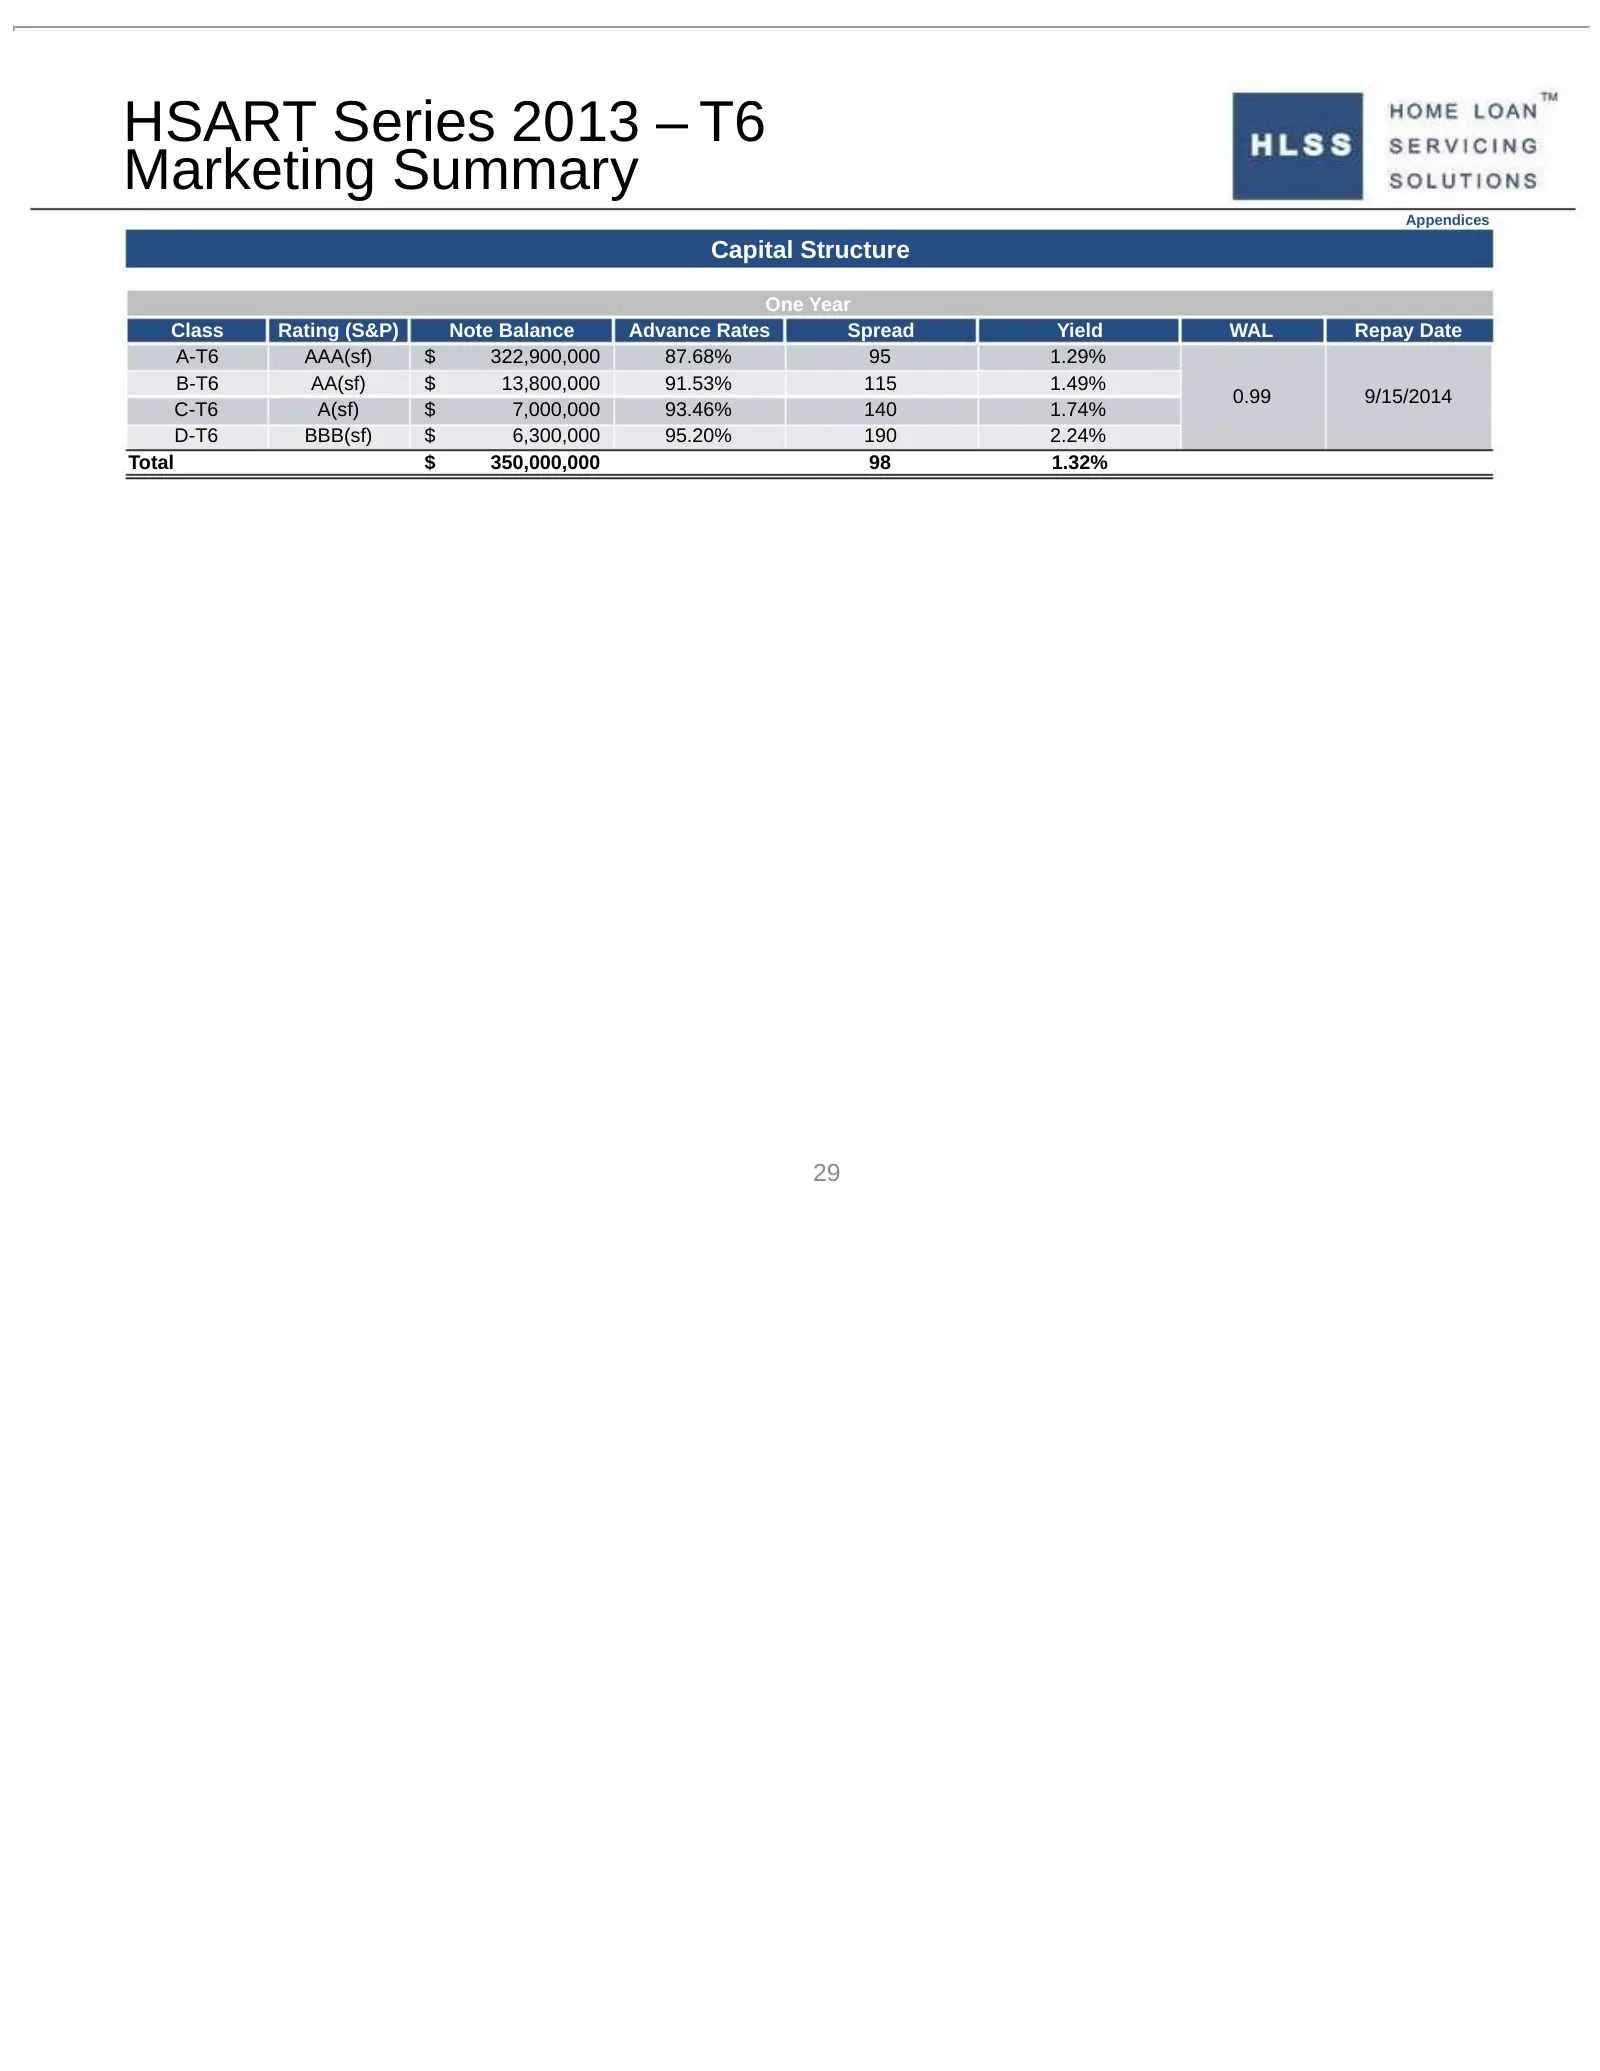
Slide 29: HSART Series 2013 – T6 Marketing Summary
HSART Series 2013 – T6 Marketing Summary Appendices Capital Structure One Year Class Rating (S&P) Note Balance Advance Rates Spread Yield WAL Repay Date A-T6 AAA(sf) $ 322,900,000 87.68% 95 1.29% B-T6 AA(sf) $ 13,800,000 91.53% 115 1.49% 0.99 9/15/2014 C-T6 A(sf) $ 7,000,000 93.46% 140 1.74% D-T6 BB
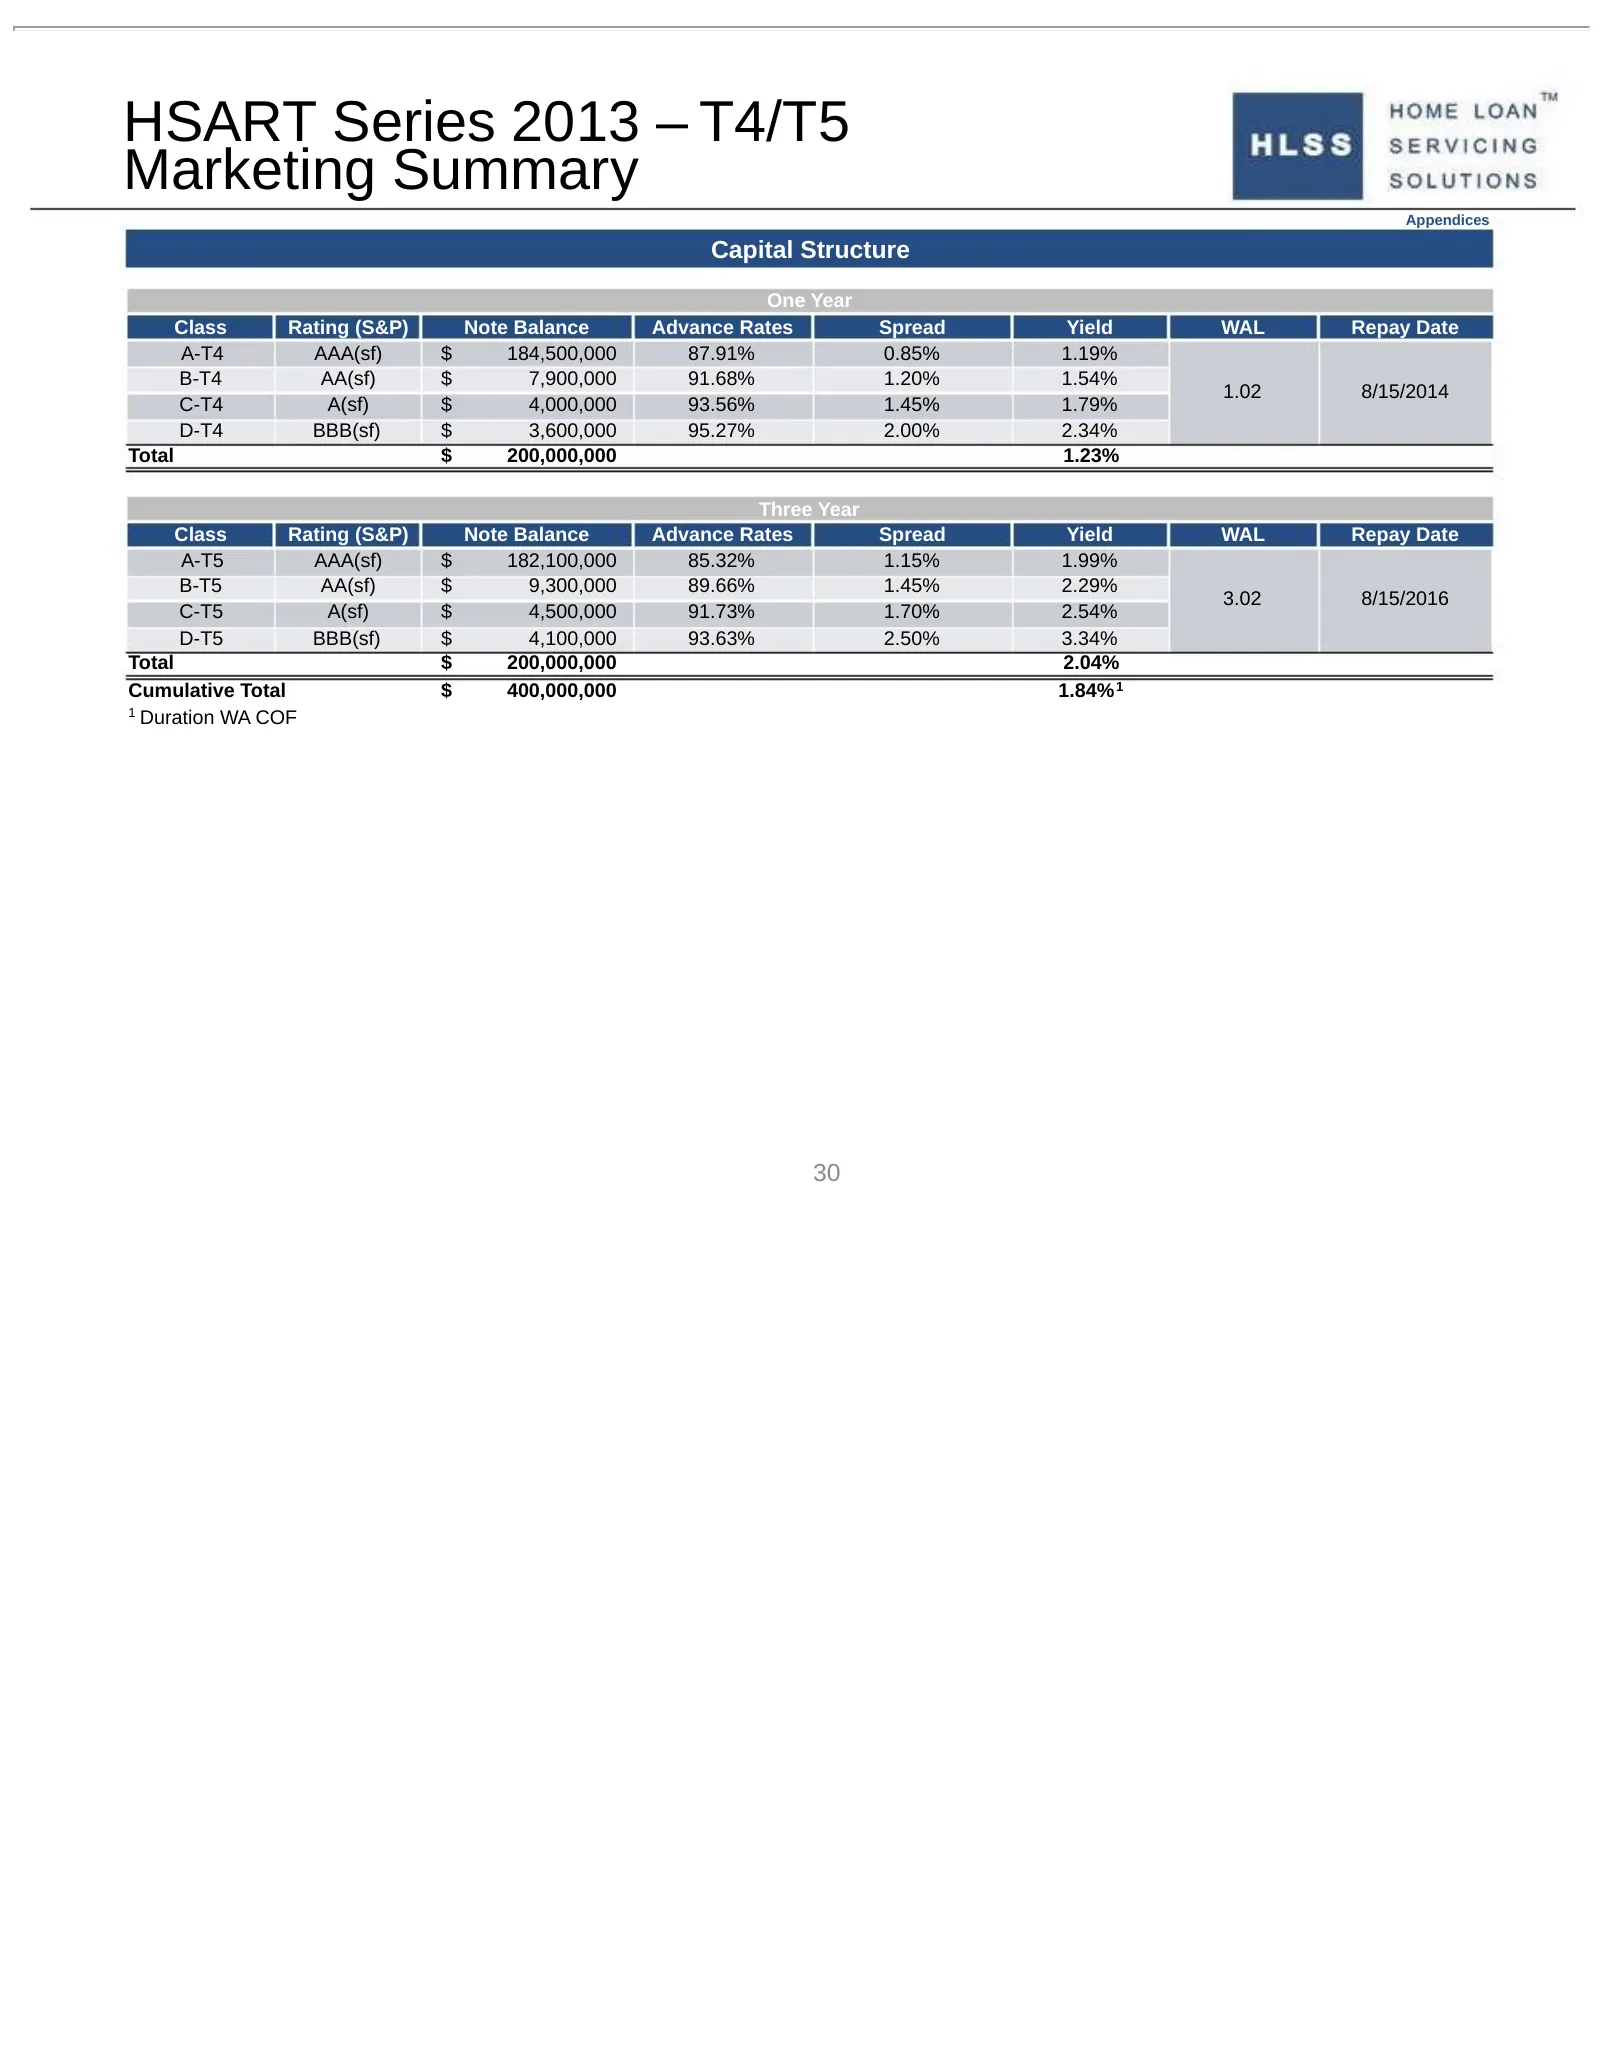
Slide 30: HSART Series 2013 – T4/T5 Marketing Summary
HSART Series 2013 – T4/T5 Marketing Summary Appendices Capital Structure One Year Class Rating (S&P) Note Balance Advance Rates Spread Yield WAL Repay Date A-T4 AAA(sf) $ 184,500,000 87.91% 0.85% 1.19% B-T4 AA(sf) $ 7,900,000 91.68% 1.20% 1.54% 1.02 8/15/2014 C-T4 A(sf) $ 4,000,000 93.56% 1.45% 1.79
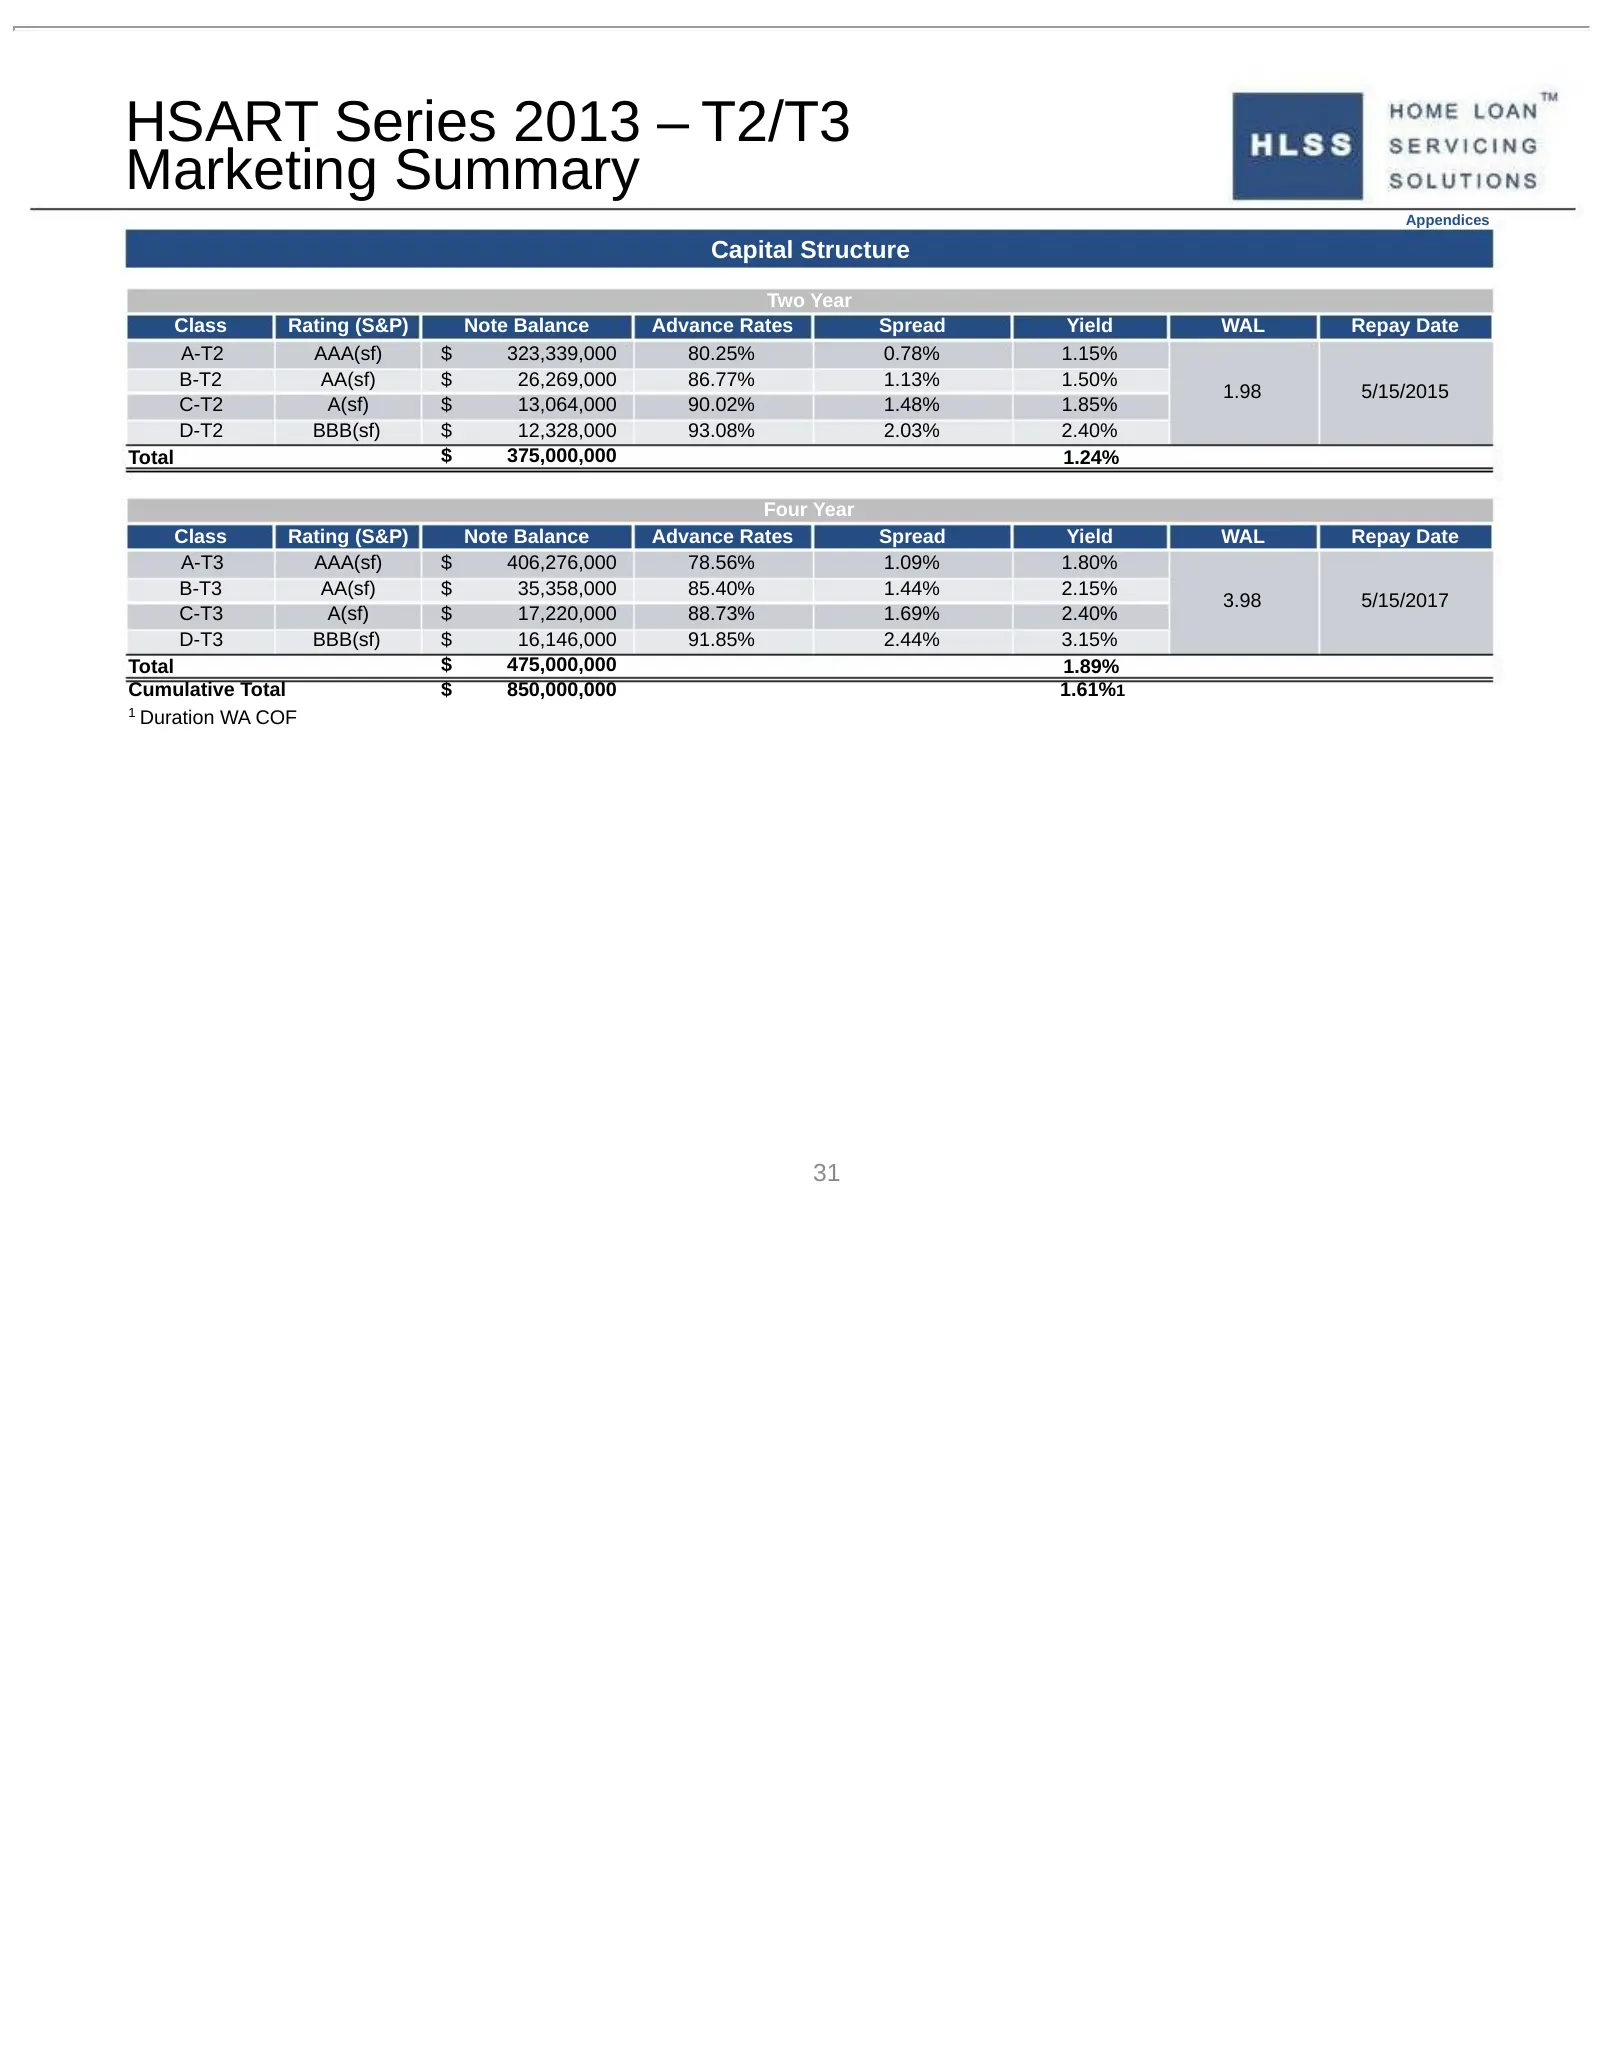
Slide 31: HSART Series 2013 – T2/T3 Marketing Summary
HSART Series 2013 – T2/T3 Marketing Summary Appendices Capital Structure Two Year Class Rating (S&P) Note Balance Advance Rates Spread Yield WAL Repay Date A-T2 AAA(sf) $ 323,339,000 80.25% 0.78% 1.15% B-T2 AA(sf) $ 26,269,000 86.77% 1.13% 1.50% 1.98 5/15/2015 C-T2 A(sf) $ 13,064,000 90.02% 1.48% 1.
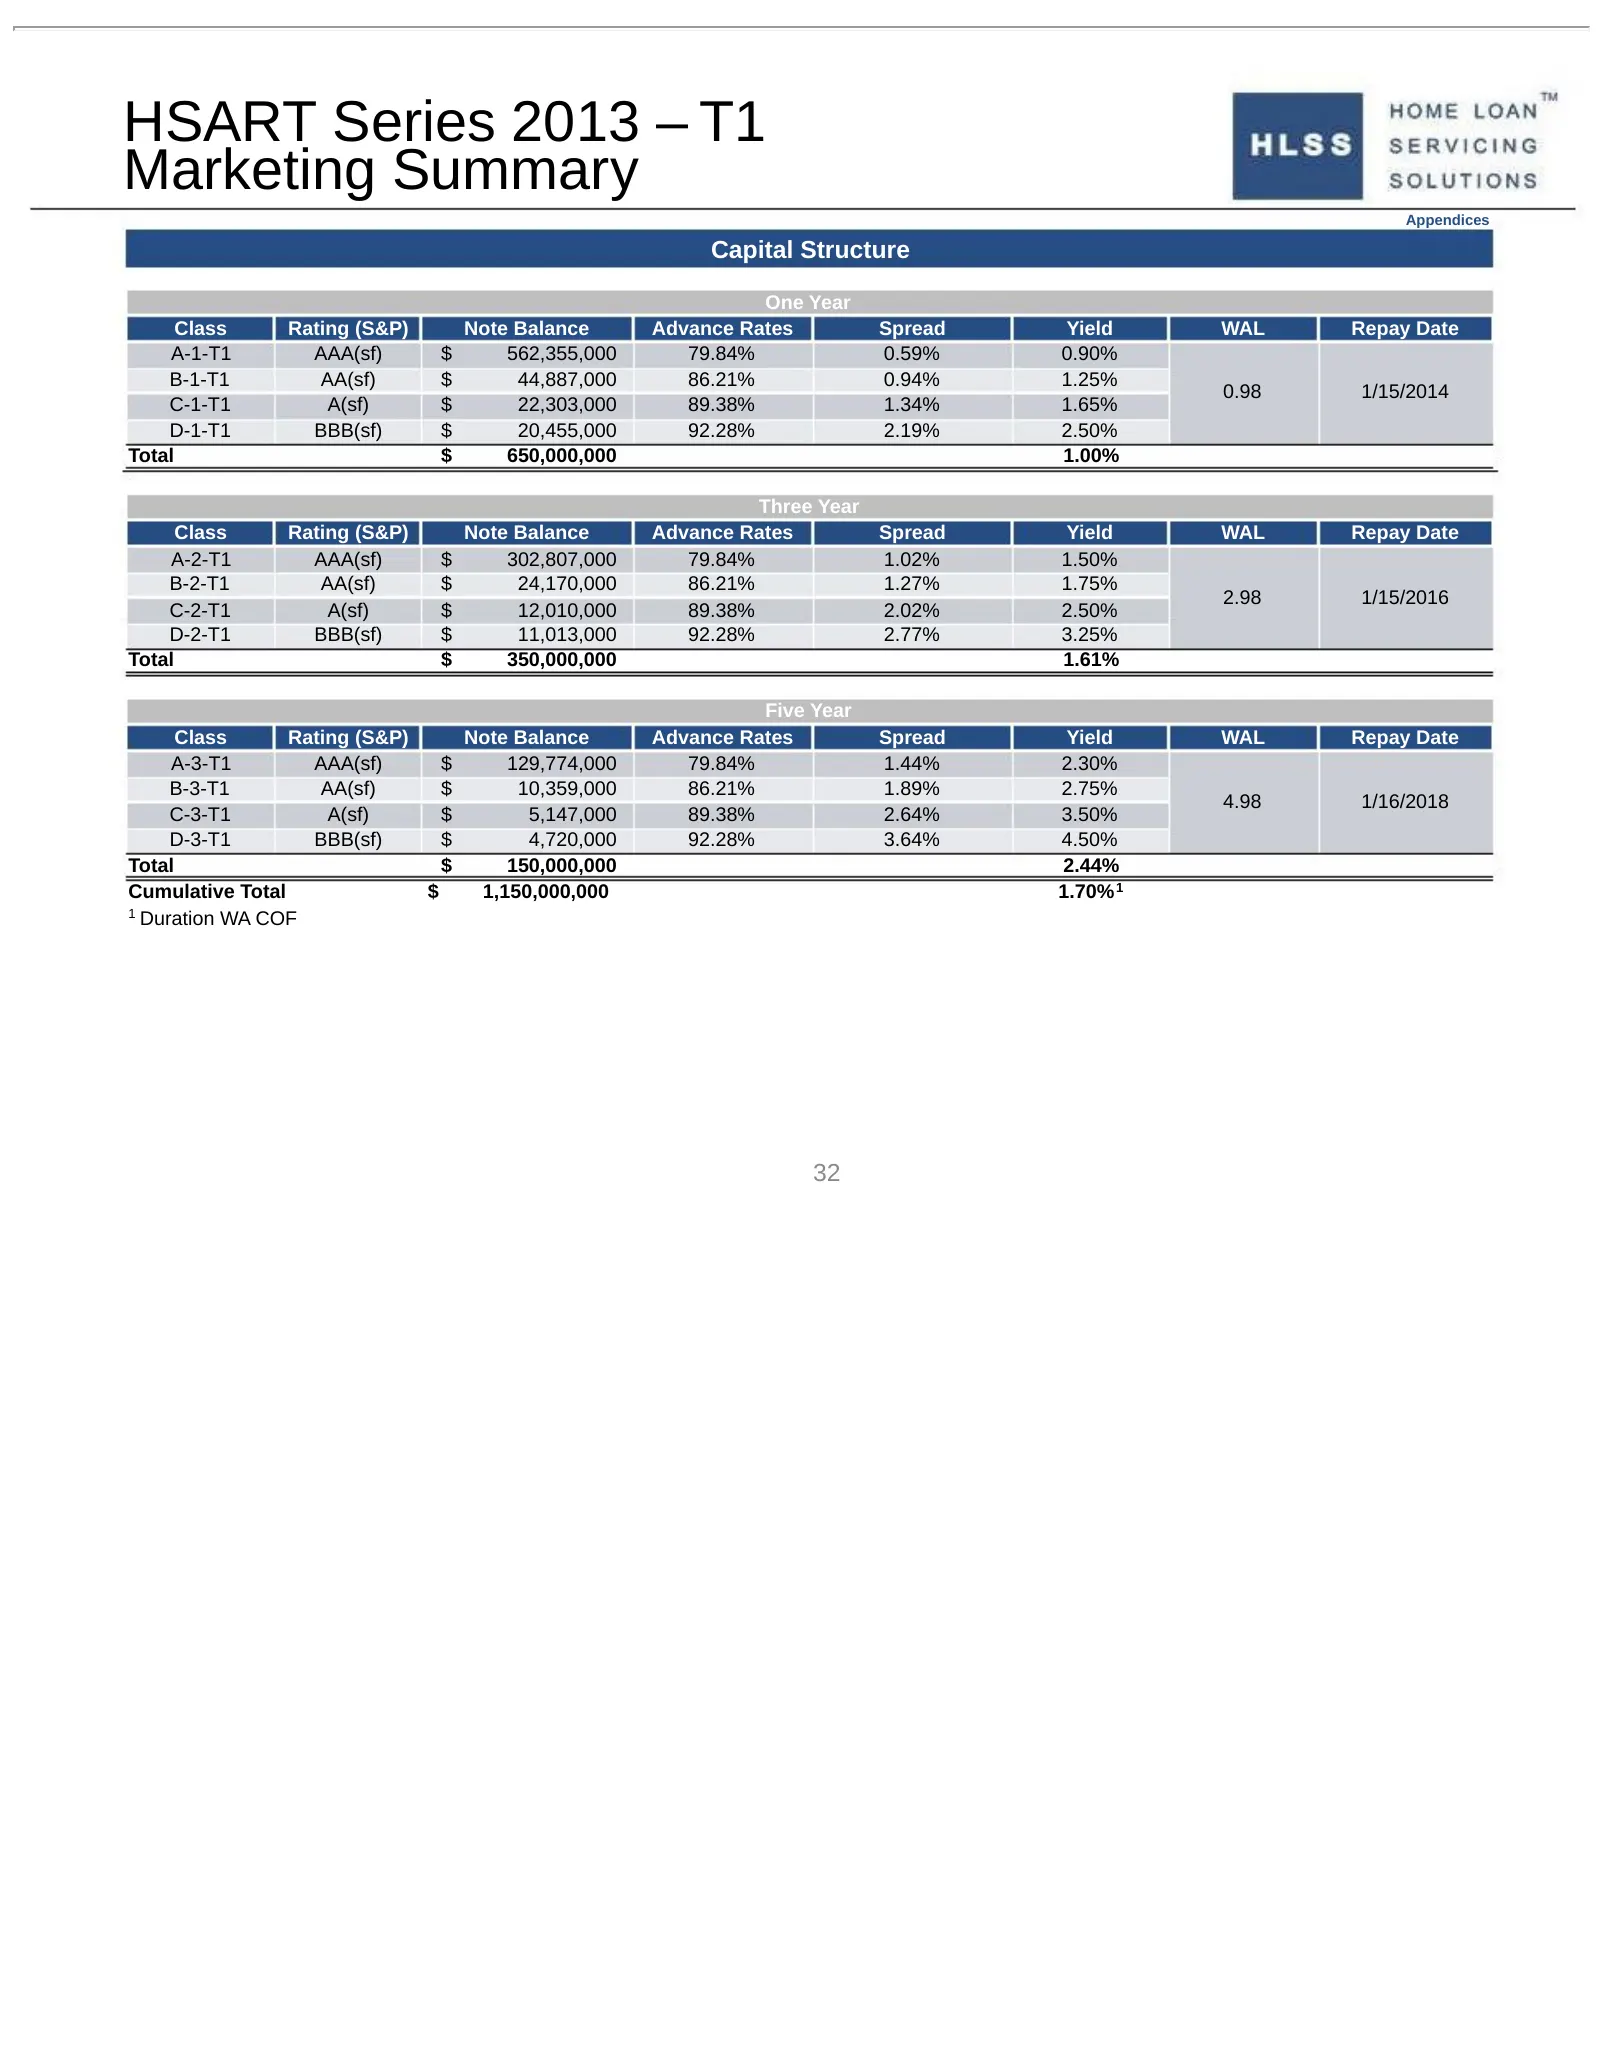
Slide 32: HSART Series 2013 – T1 Marketing Summary
HSART Series 2013 – T1 Marketing Summary Appendices Capital Structure One Year Class Rating (S&P) Note Balance Advance Rates Spread Yield WAL Repay Date A-1-T1 AAA(sf) $ 562,355,000 79.84% 0.59% 0.90% B-1-T1 AA(sf) $ 44,887,000 86.21% 0.94% 1.25% 0.98 1/15/2014 C-1-T1 A(sf) $ 22,303,000 89.38% 1.34%
Slide 33: HSART Series 2012 - T2 Marketing Summary
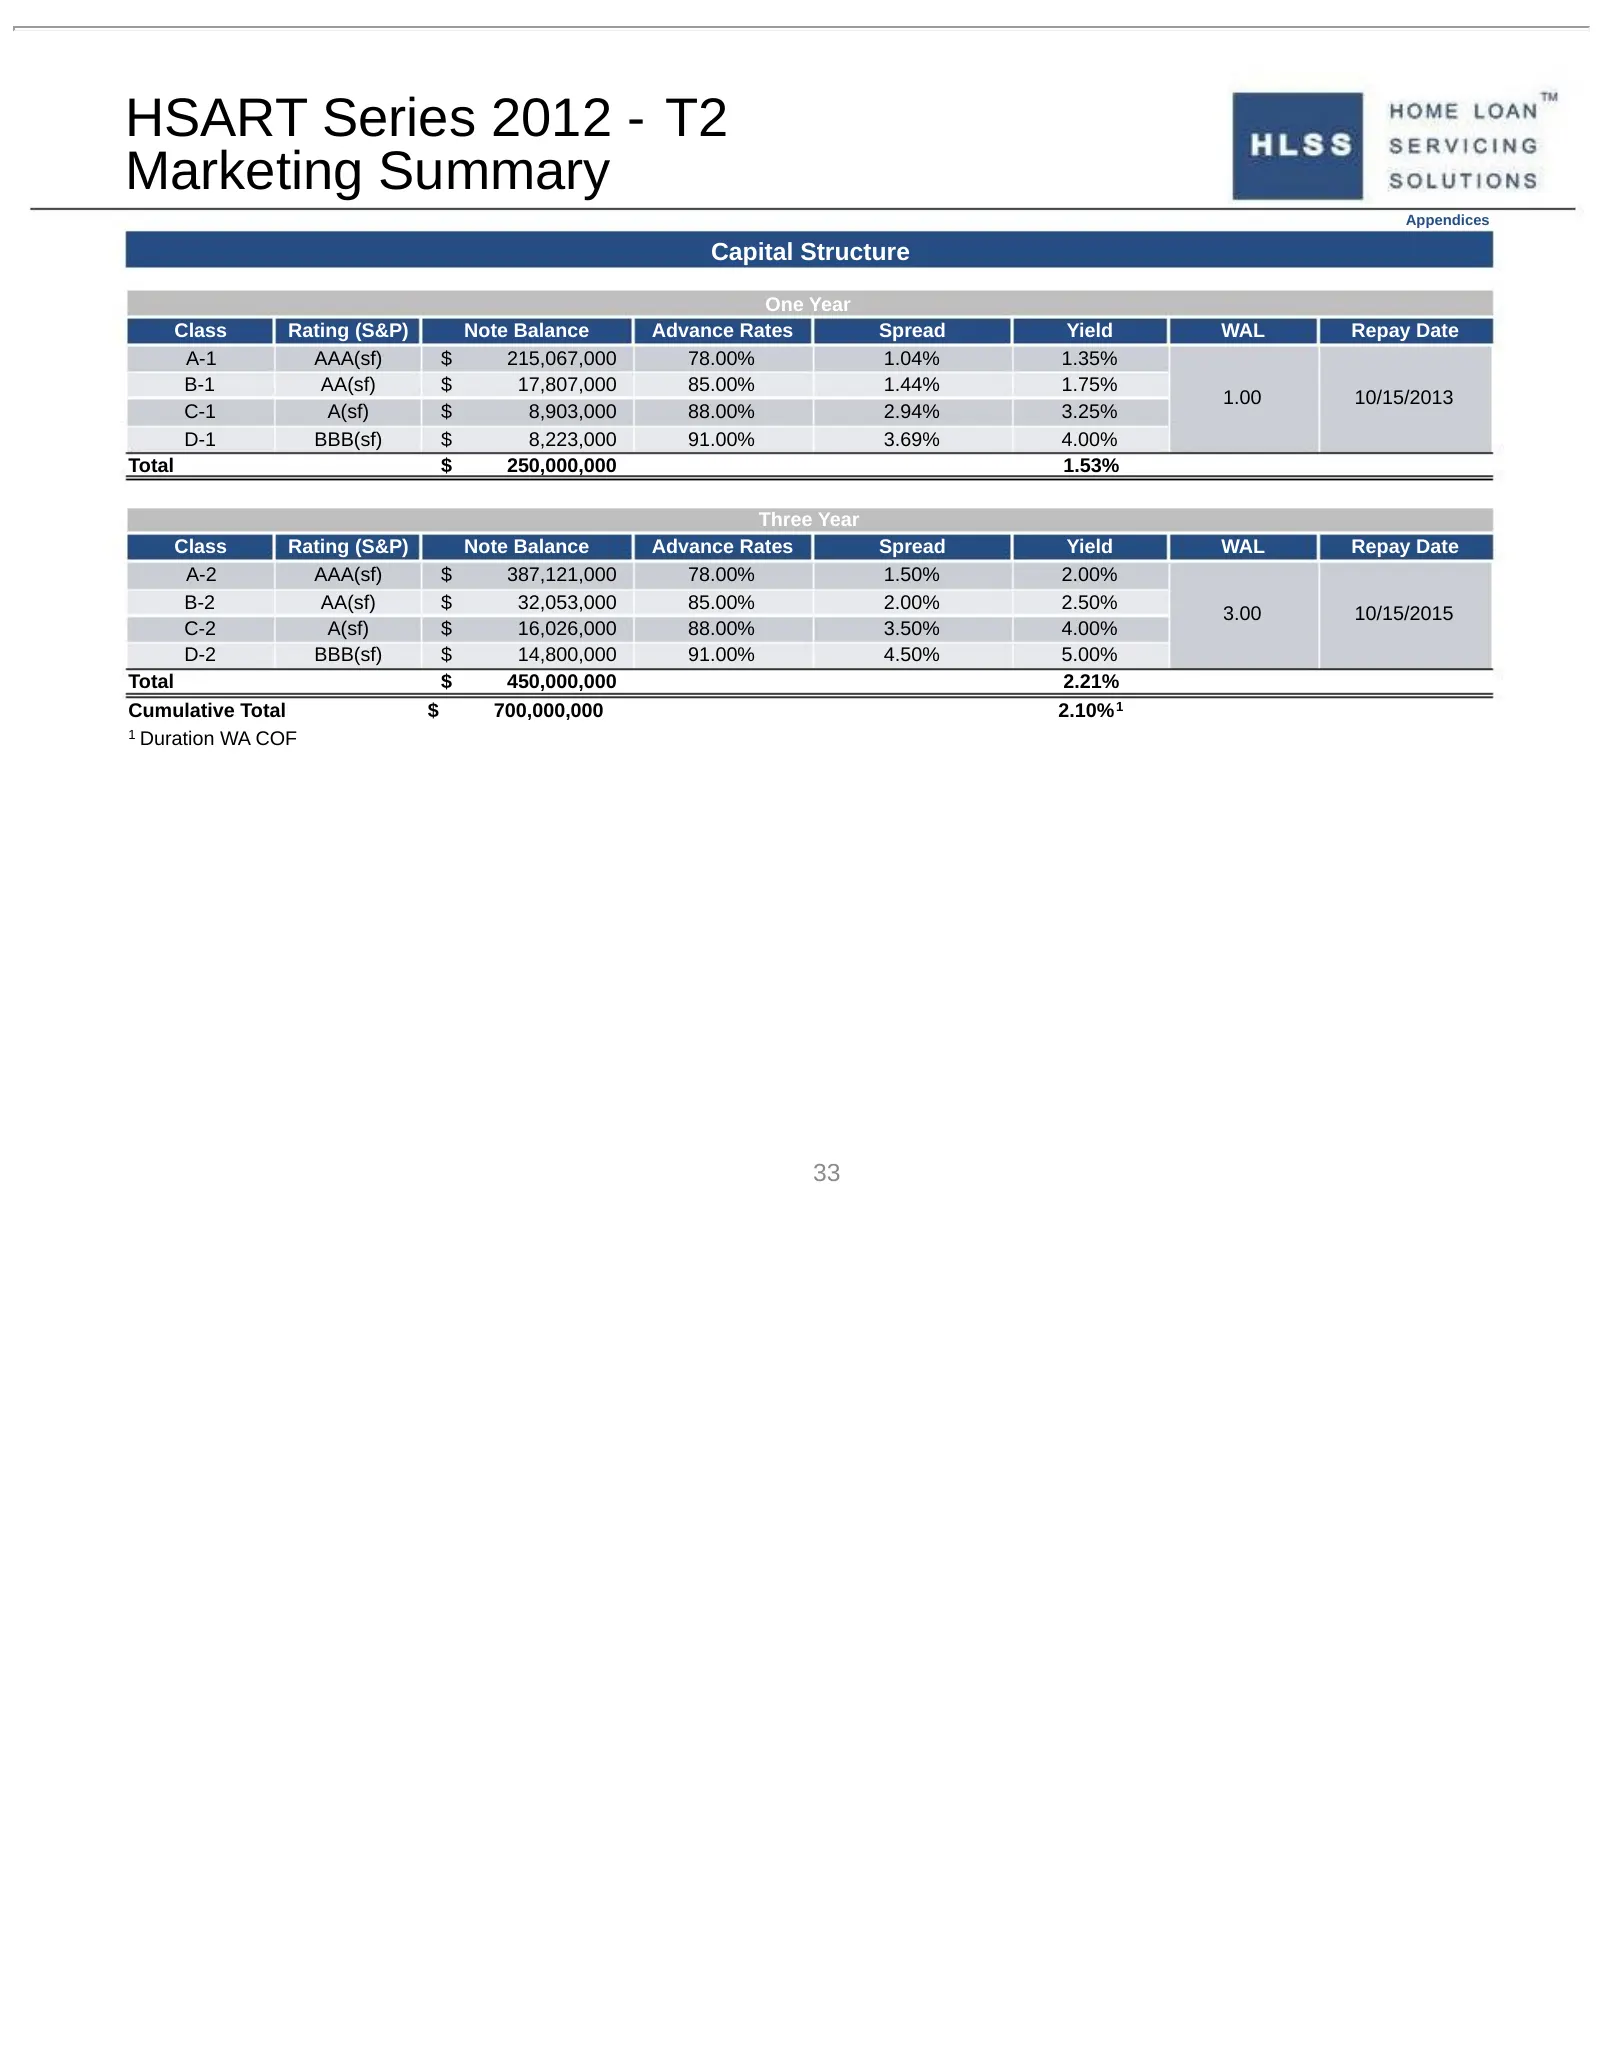
HSART Series 2012 - T2 Marketing Summary Appendices Capital Structure One Year Class Rating (S&P) Note Balance Advance Rates Spread Yield WAL Repay Date A-1 AAA(sf) $ 215,067,000 78.00% 1.04% 1.35% B-1 AA(sf) $ 17,807,000 85.00% 1.44% 1.75% 1.00 10/15/2013 C-1 A(sf) $ 8,903,000 88.00% 2.94% 3.25% D-
Slide 34: Appendix: Performance
* * * * * * * * * Appendix: Performance 34
Slide 35: HSART Remittance Report
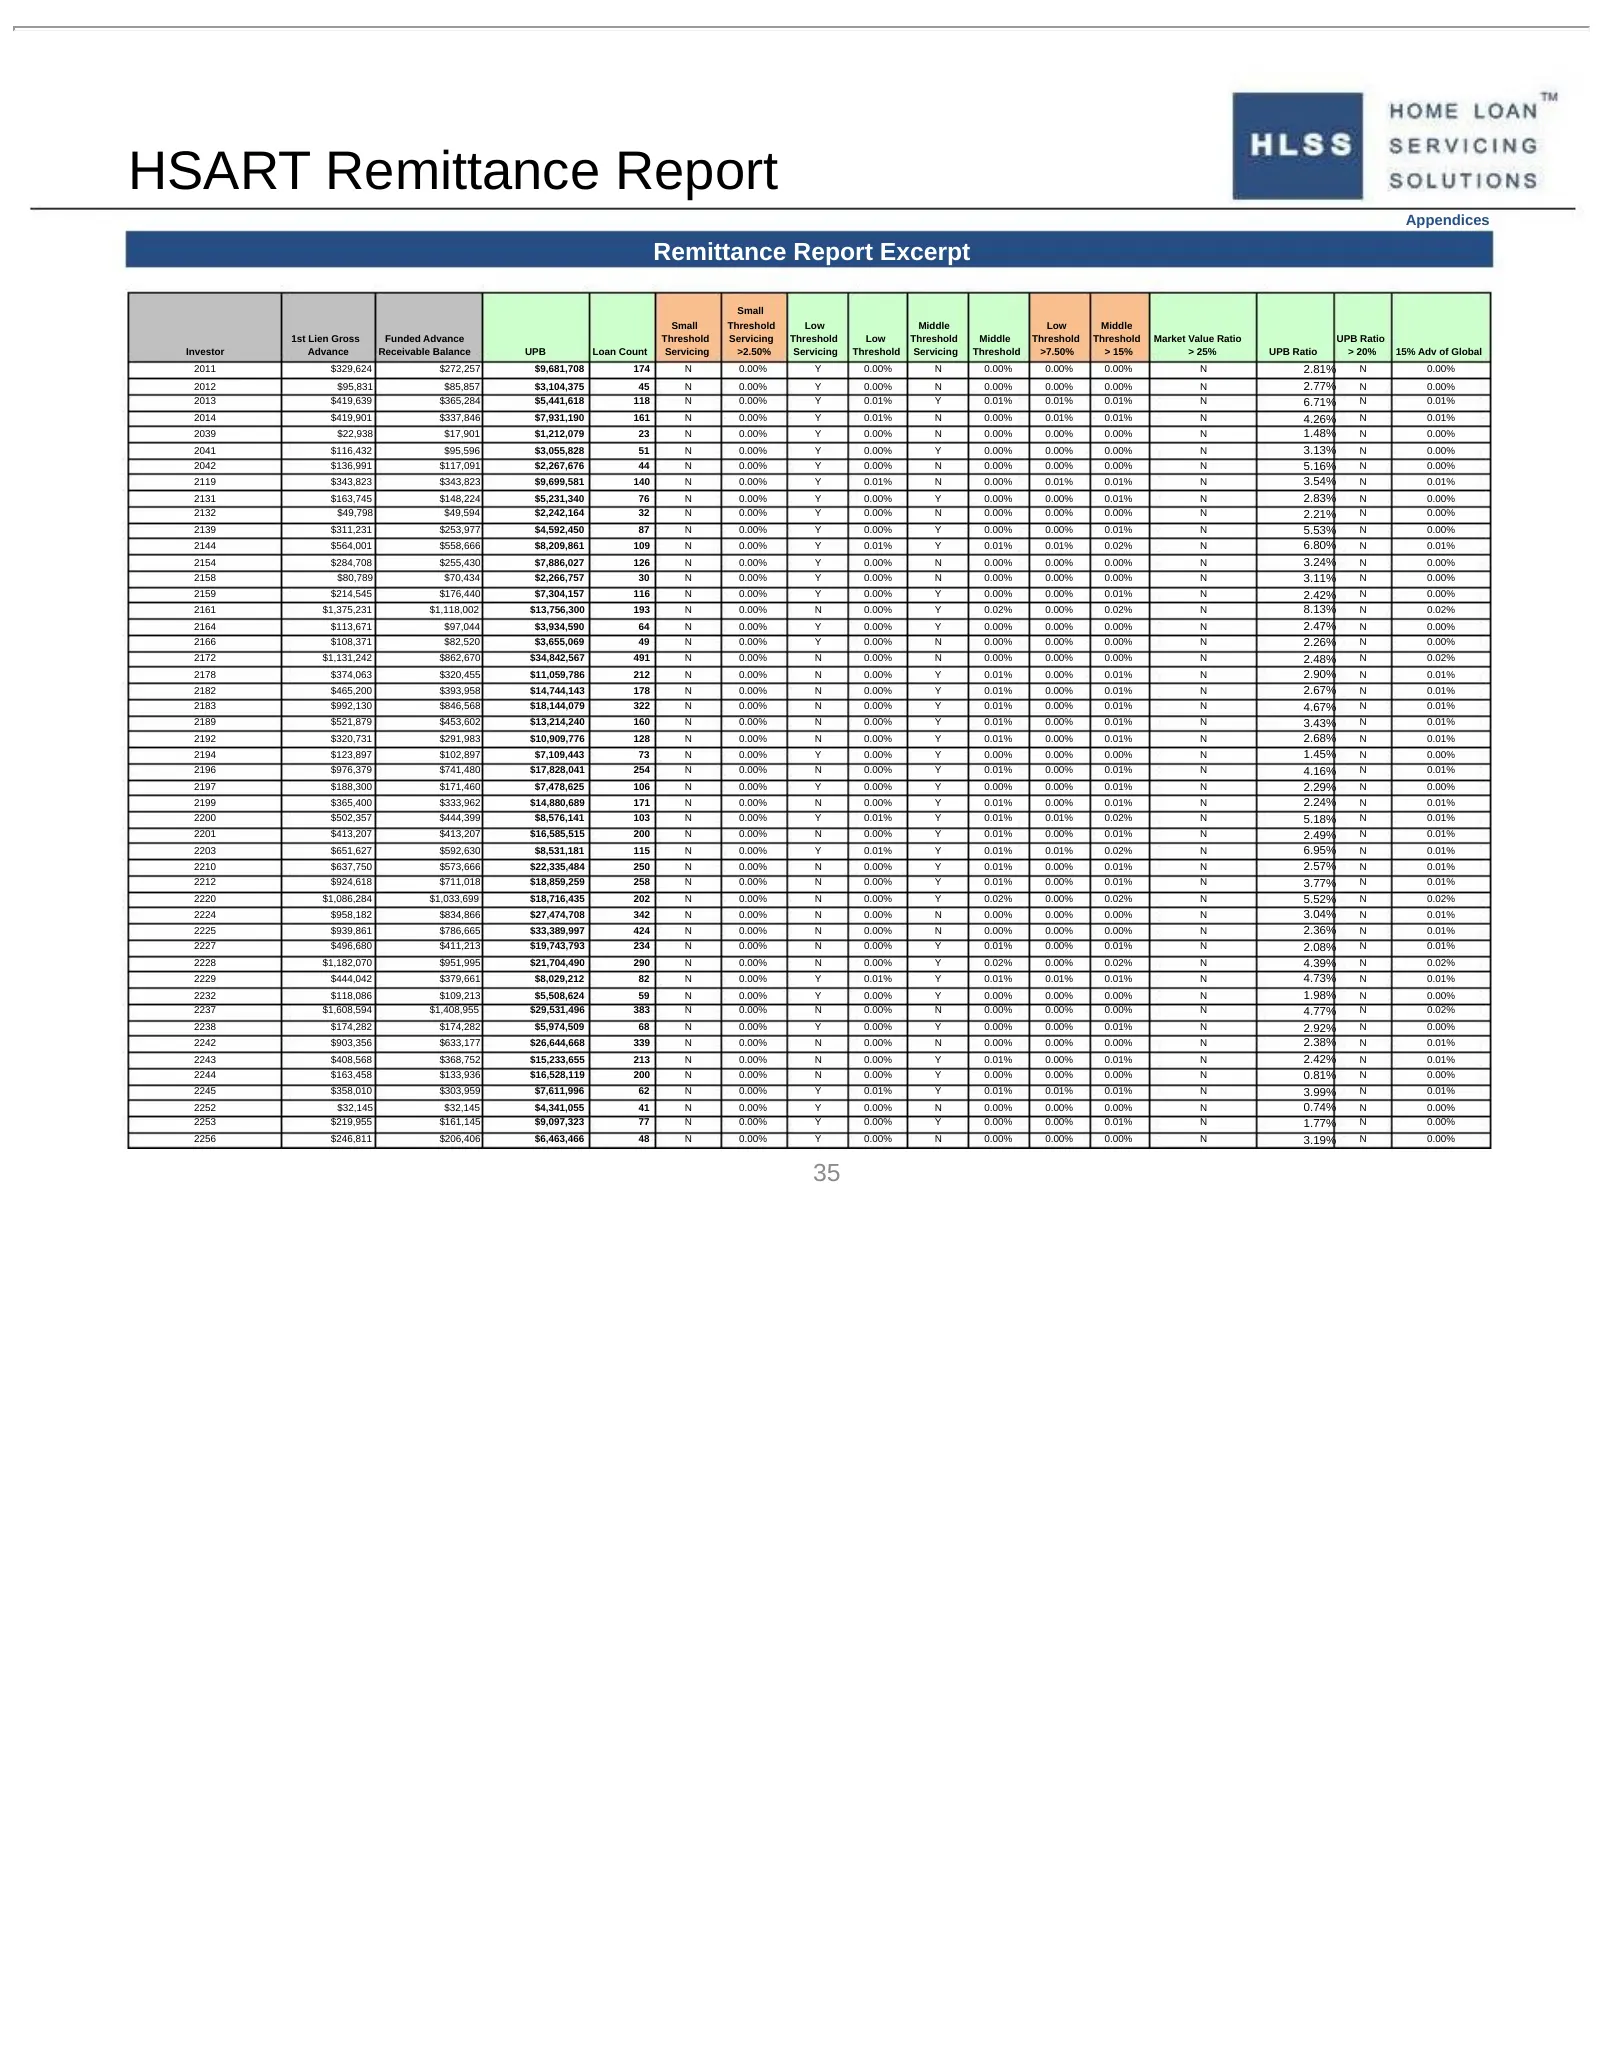
HSART Remittance Report Appendices Remittance Report Excerpt Small Small Threshold Low Middle Low Middle 1st Lien Gross Funded Advance Threshold Servicing Threshold Low Threshold Middle Threshold Threshold Market Value Ratio UPB Ratio Investor Advance Receivable Balance UPB Loan Count Servicing >2.5
Slide 36: Historical Monthly Reimbursement Rate
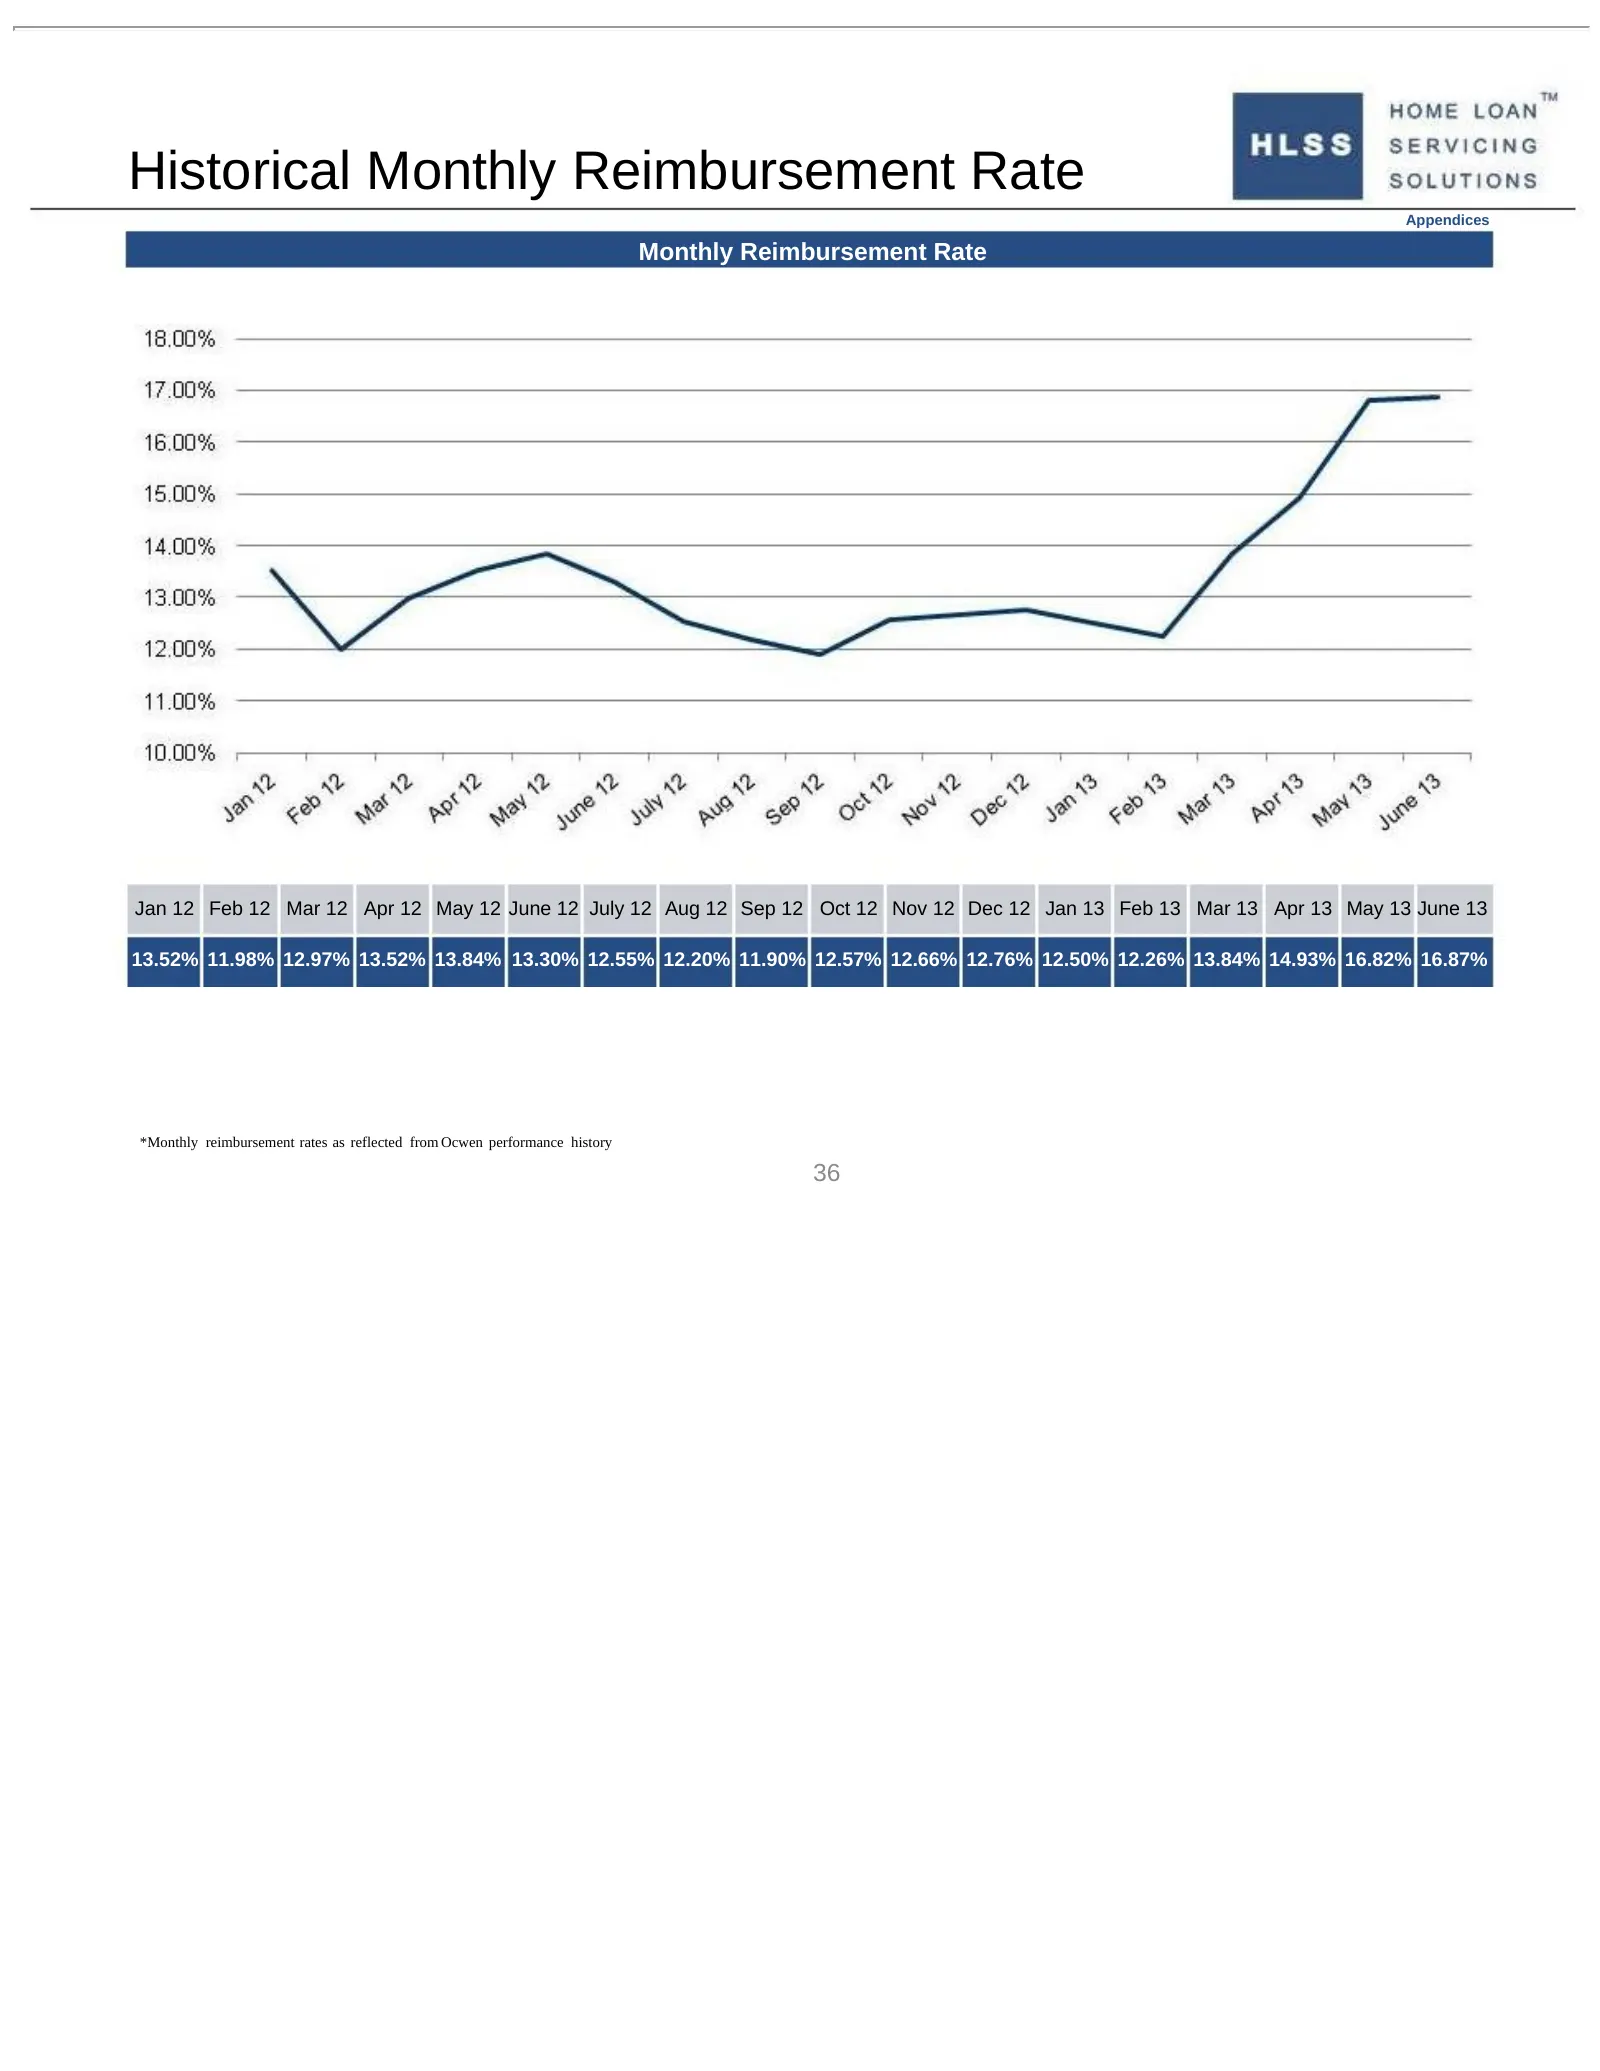
Historical Monthly Reimbursement Rate Appendices Monthly Reimbursement Rate Jan 12 Feb 12 Mar 12 Apr 12 May 12 June 12 July 12 Aug 12 Sep 12 Oct 12 Nov 12 Dec 12 Jan 13 Feb 13 Mar 13 Apr 13 May 13 June 13 13.52% 11.98% 12.97% 13.52% 13.84% 13.30% 12.55% 12.20% 11.90% 12.57% 12.66% 12.76% 12.50% 12.2
Slide 37: P&I Recovery Curves
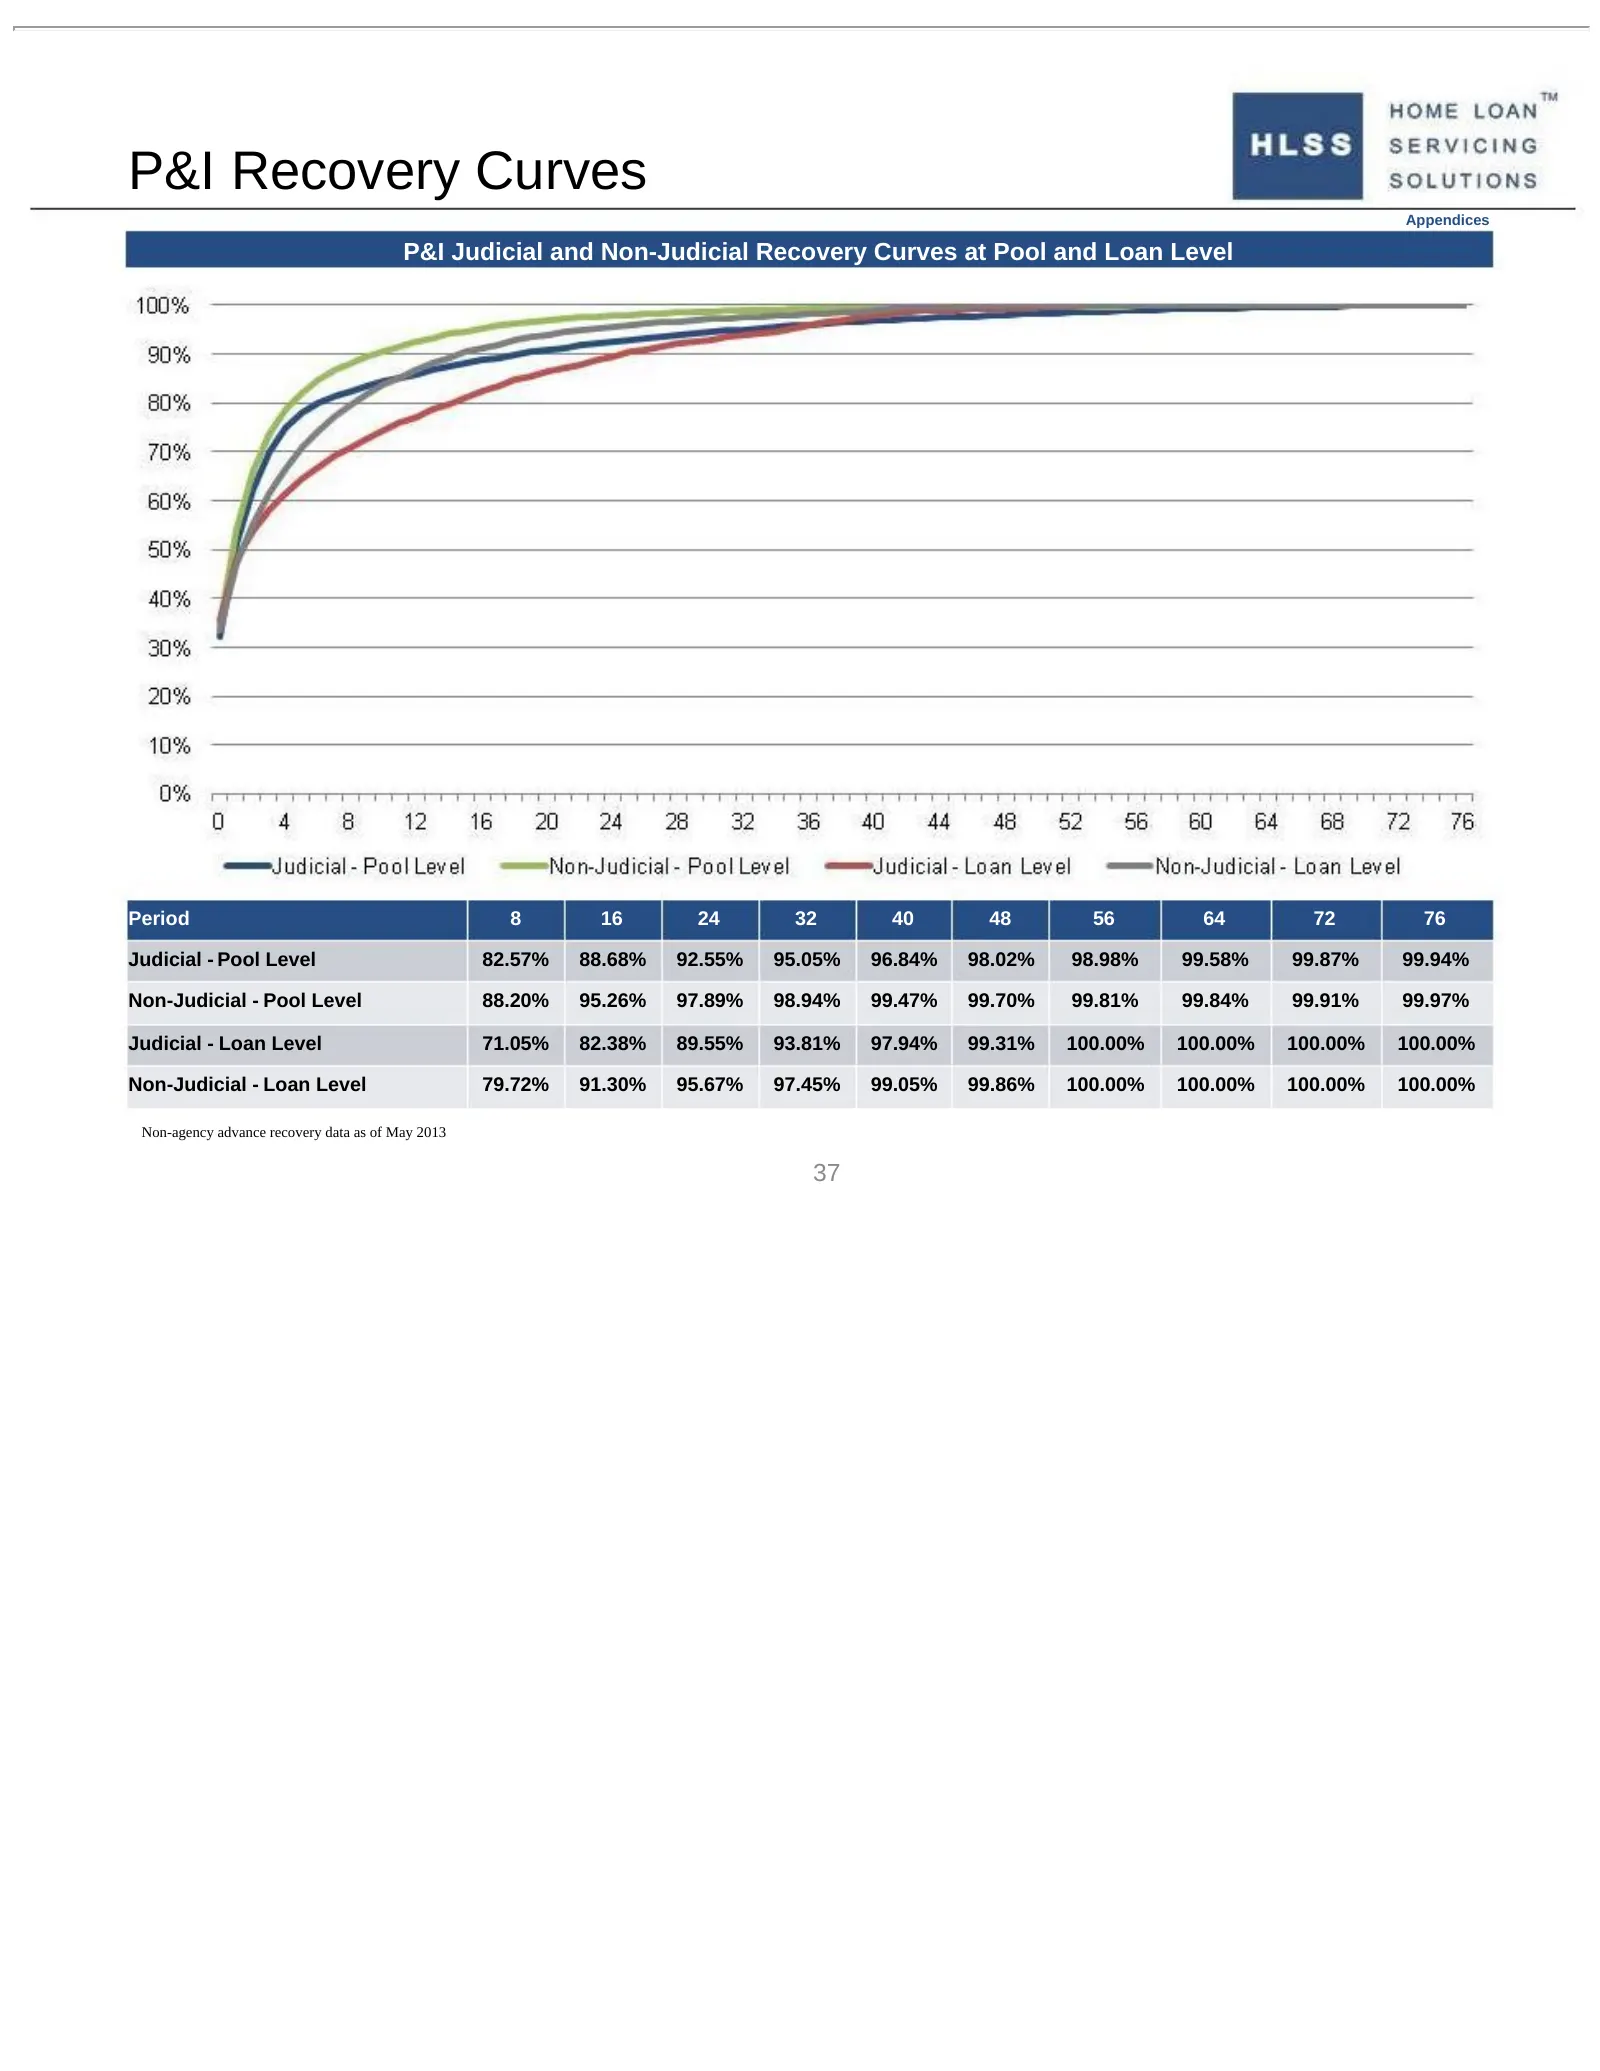
P&I Recovery Curves Appendices P&I Judicial and Non-Judicial Recovery Curves at Pool and Loan Level Period 8 16 24 32 40 48 56 64 72 76 Judicial - Pool Level 82.57% 88.68% 92.55% 95.05% 96.84% 98.02% 98.98% 99.58% 99.87% 99.94% Non-Judicial - Pool Level 88.20% 95.26% 97.89% 98.94% 99.47% 99.70% 99.8
Slide 38: Corporate Recovery Curves
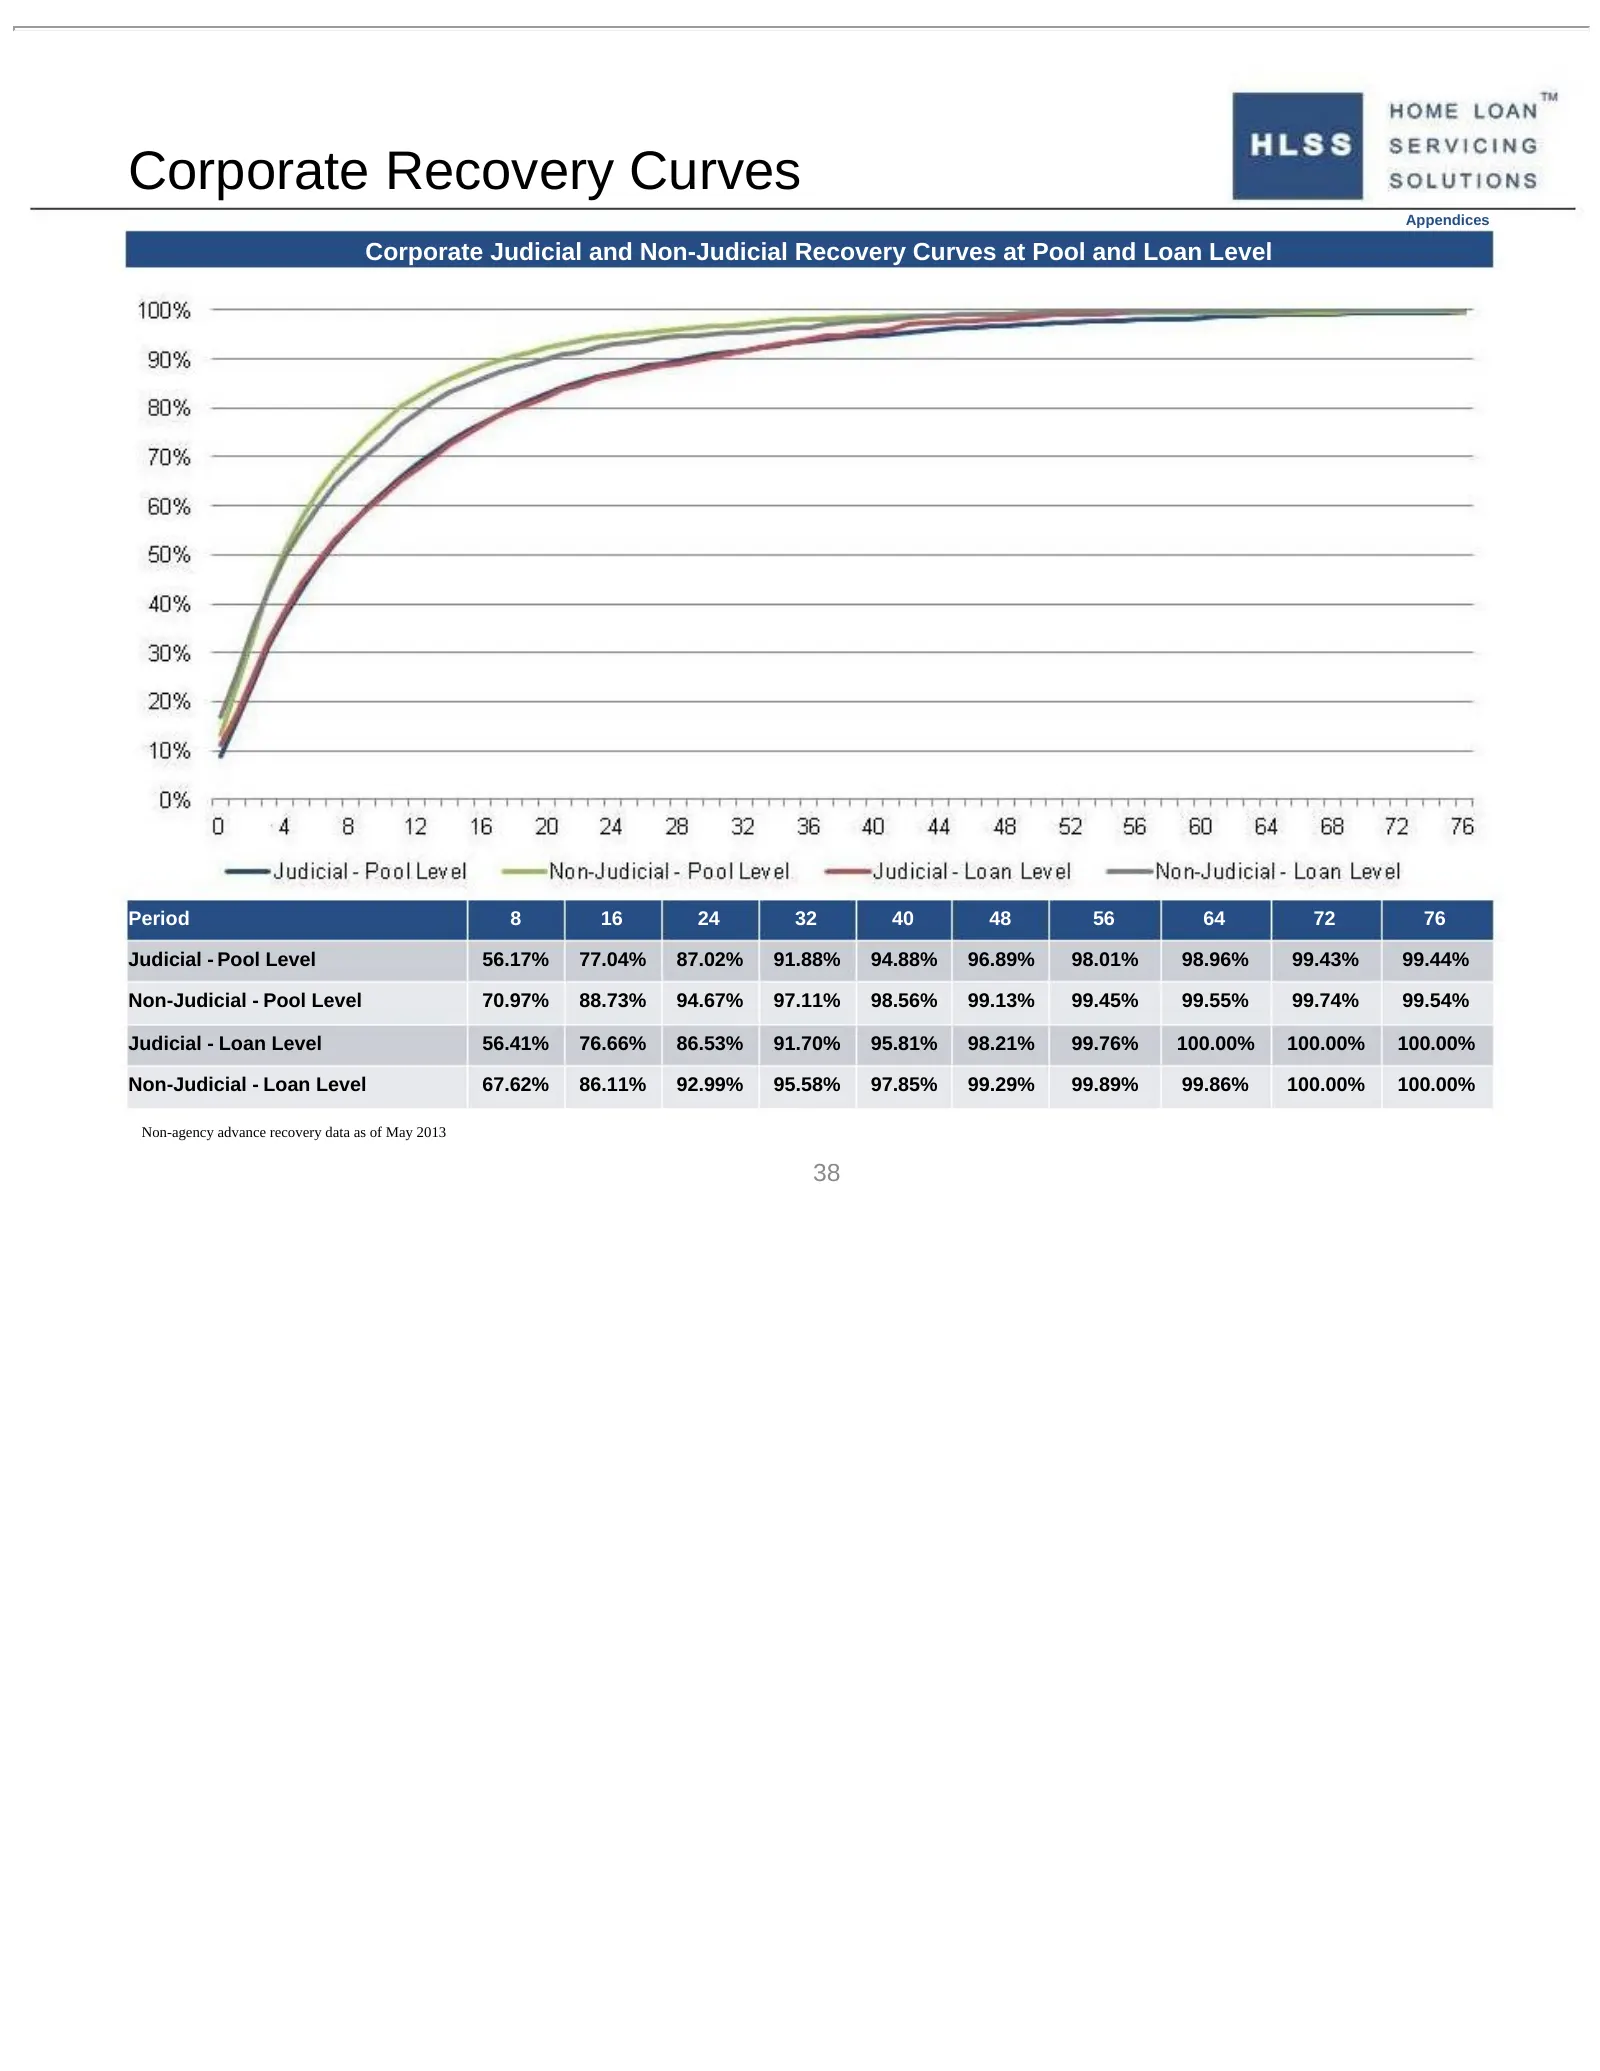
Corporate Recovery Curves Appendices Corporate Judicial and Non-Judicial Recovery Curves at Pool and Loan Level Period 8 16 24 32 40 48 56 64 72 76 Judicial - Pool Level 56.17% 77.04% 87.02% 91.88% 94.88% 96.89% 98.01% 98.96% 99.43% 99.44% Non-Judicial - Pool Level 70.97% 88.73% 94.67% 97.11% 98.56%
Slide 39: DSF Recovery Curves
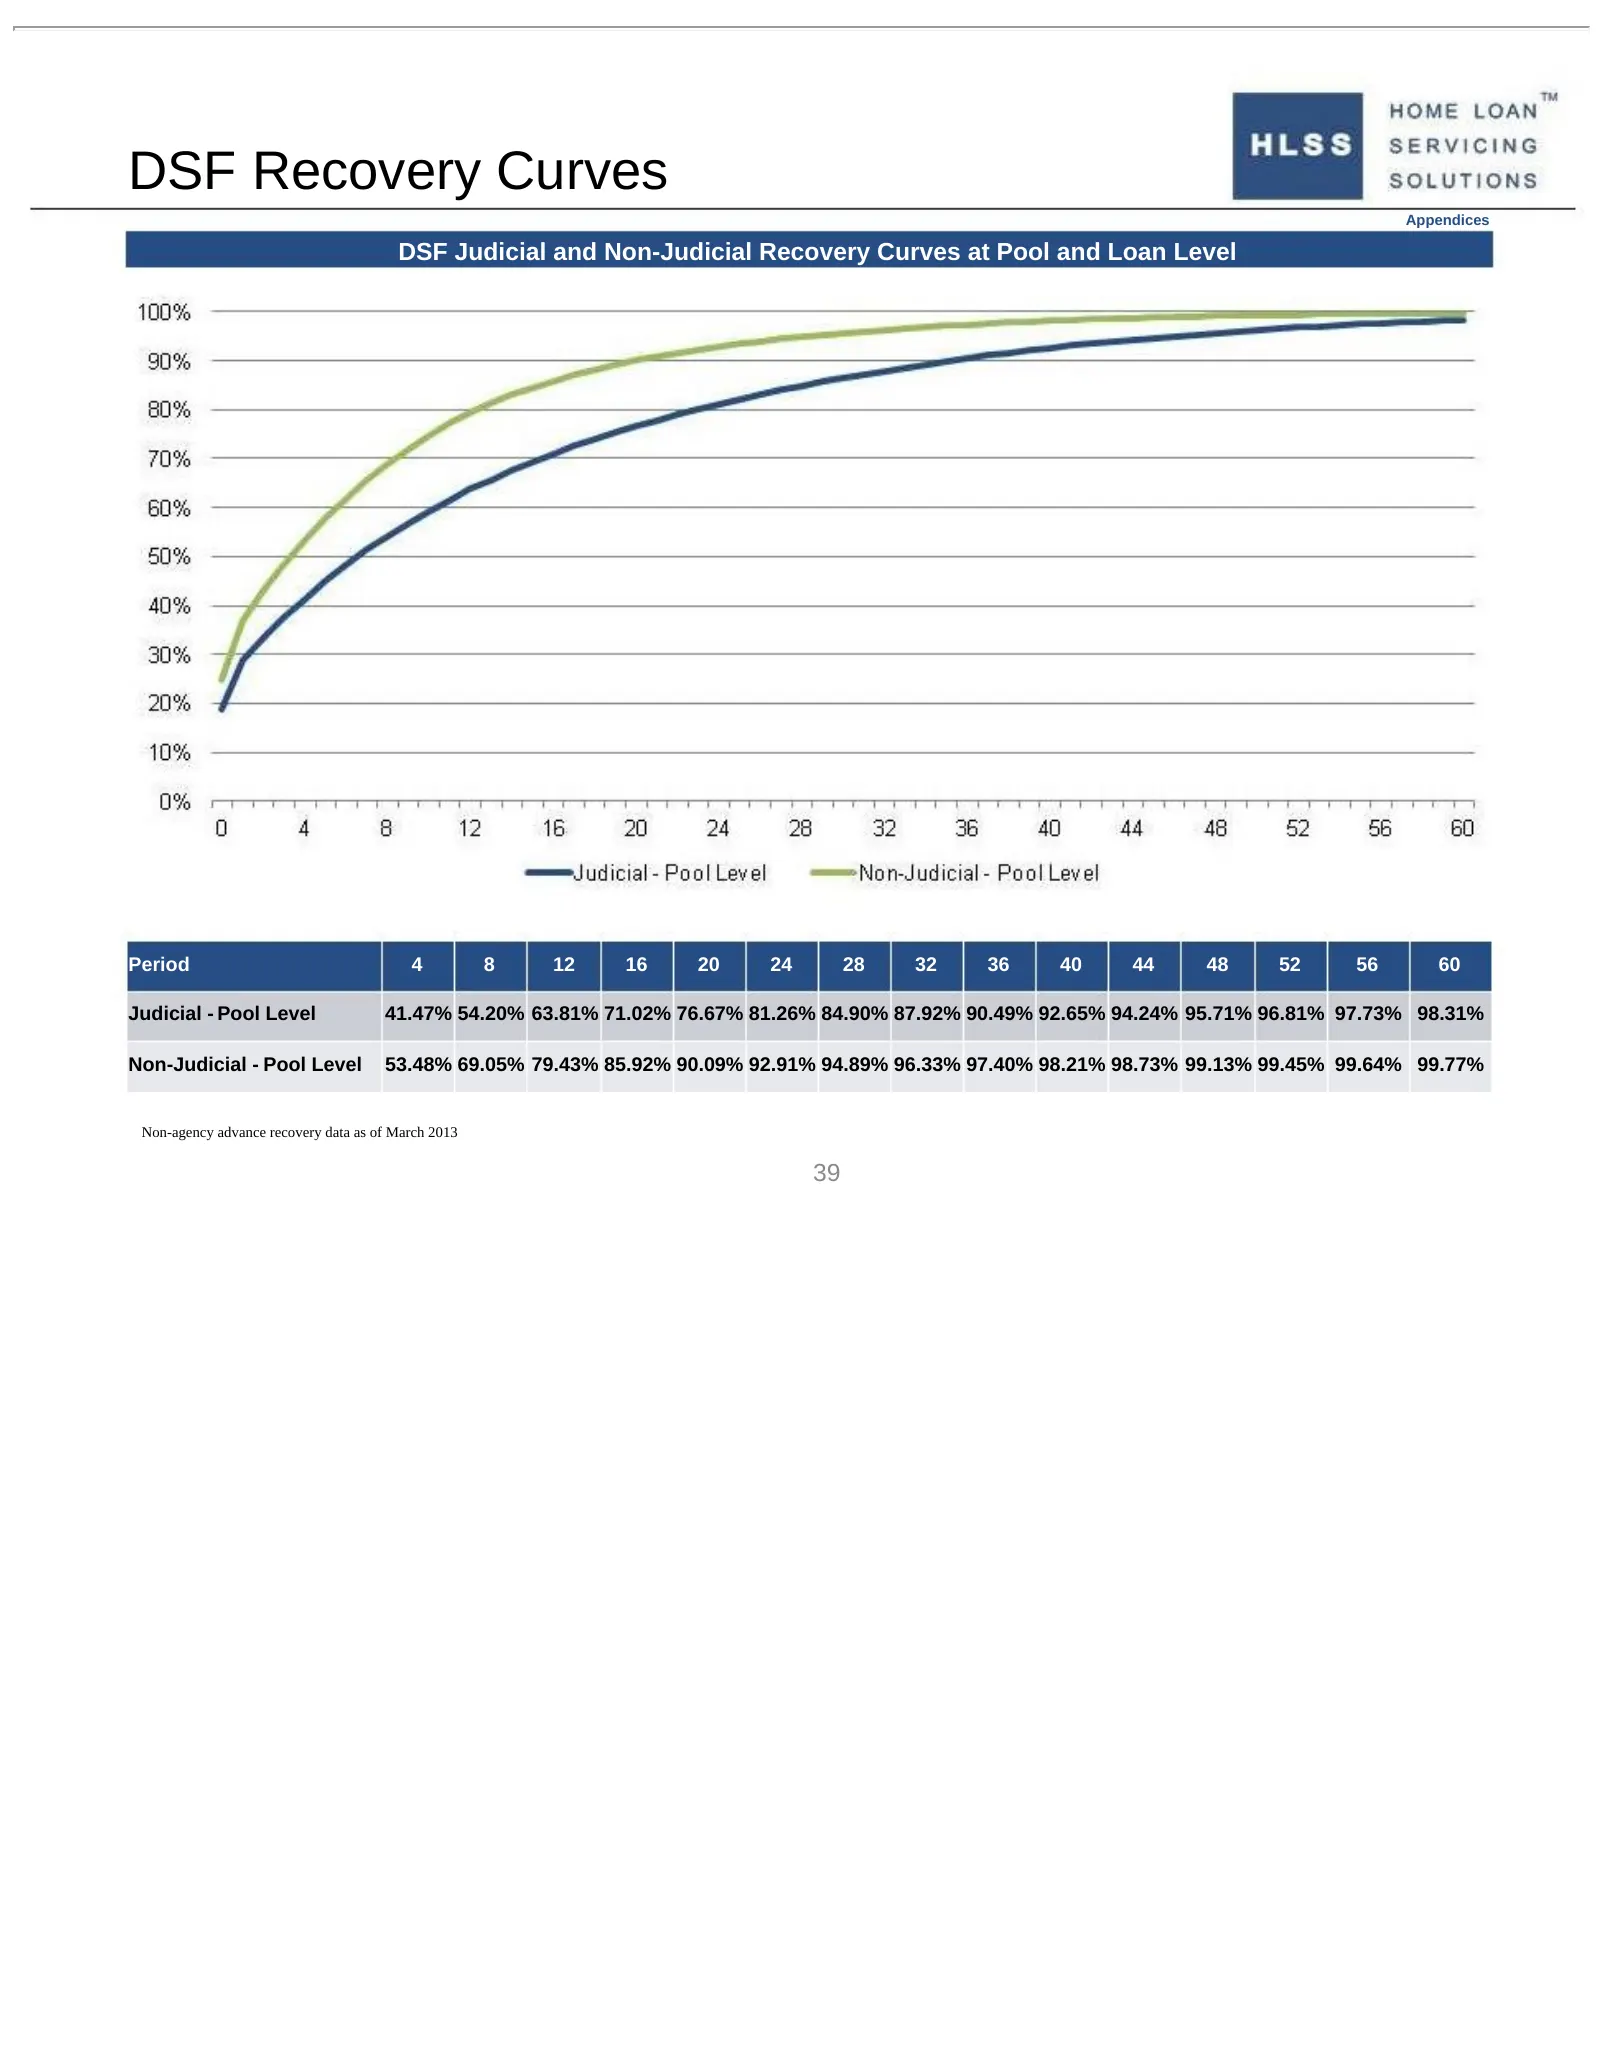
DSF Recovery Curves Appendices DSF Judicial and Non-Judicial Recovery Curves at Pool and Loan Level Period 4 8 12 16 20 24 28 32 36 40 44 48 52 56 60 Judicial - Pool Level 41.47% 54.20% 63.81% 71.02% 76.67% 81.26% 84.90% 87.92% 90.49% 92.65% 94.24% 95.71% 96.81% 97.73% 98.31% Non-Judicial - Pool Lev
Slide 40: Escrow Recovery Curves
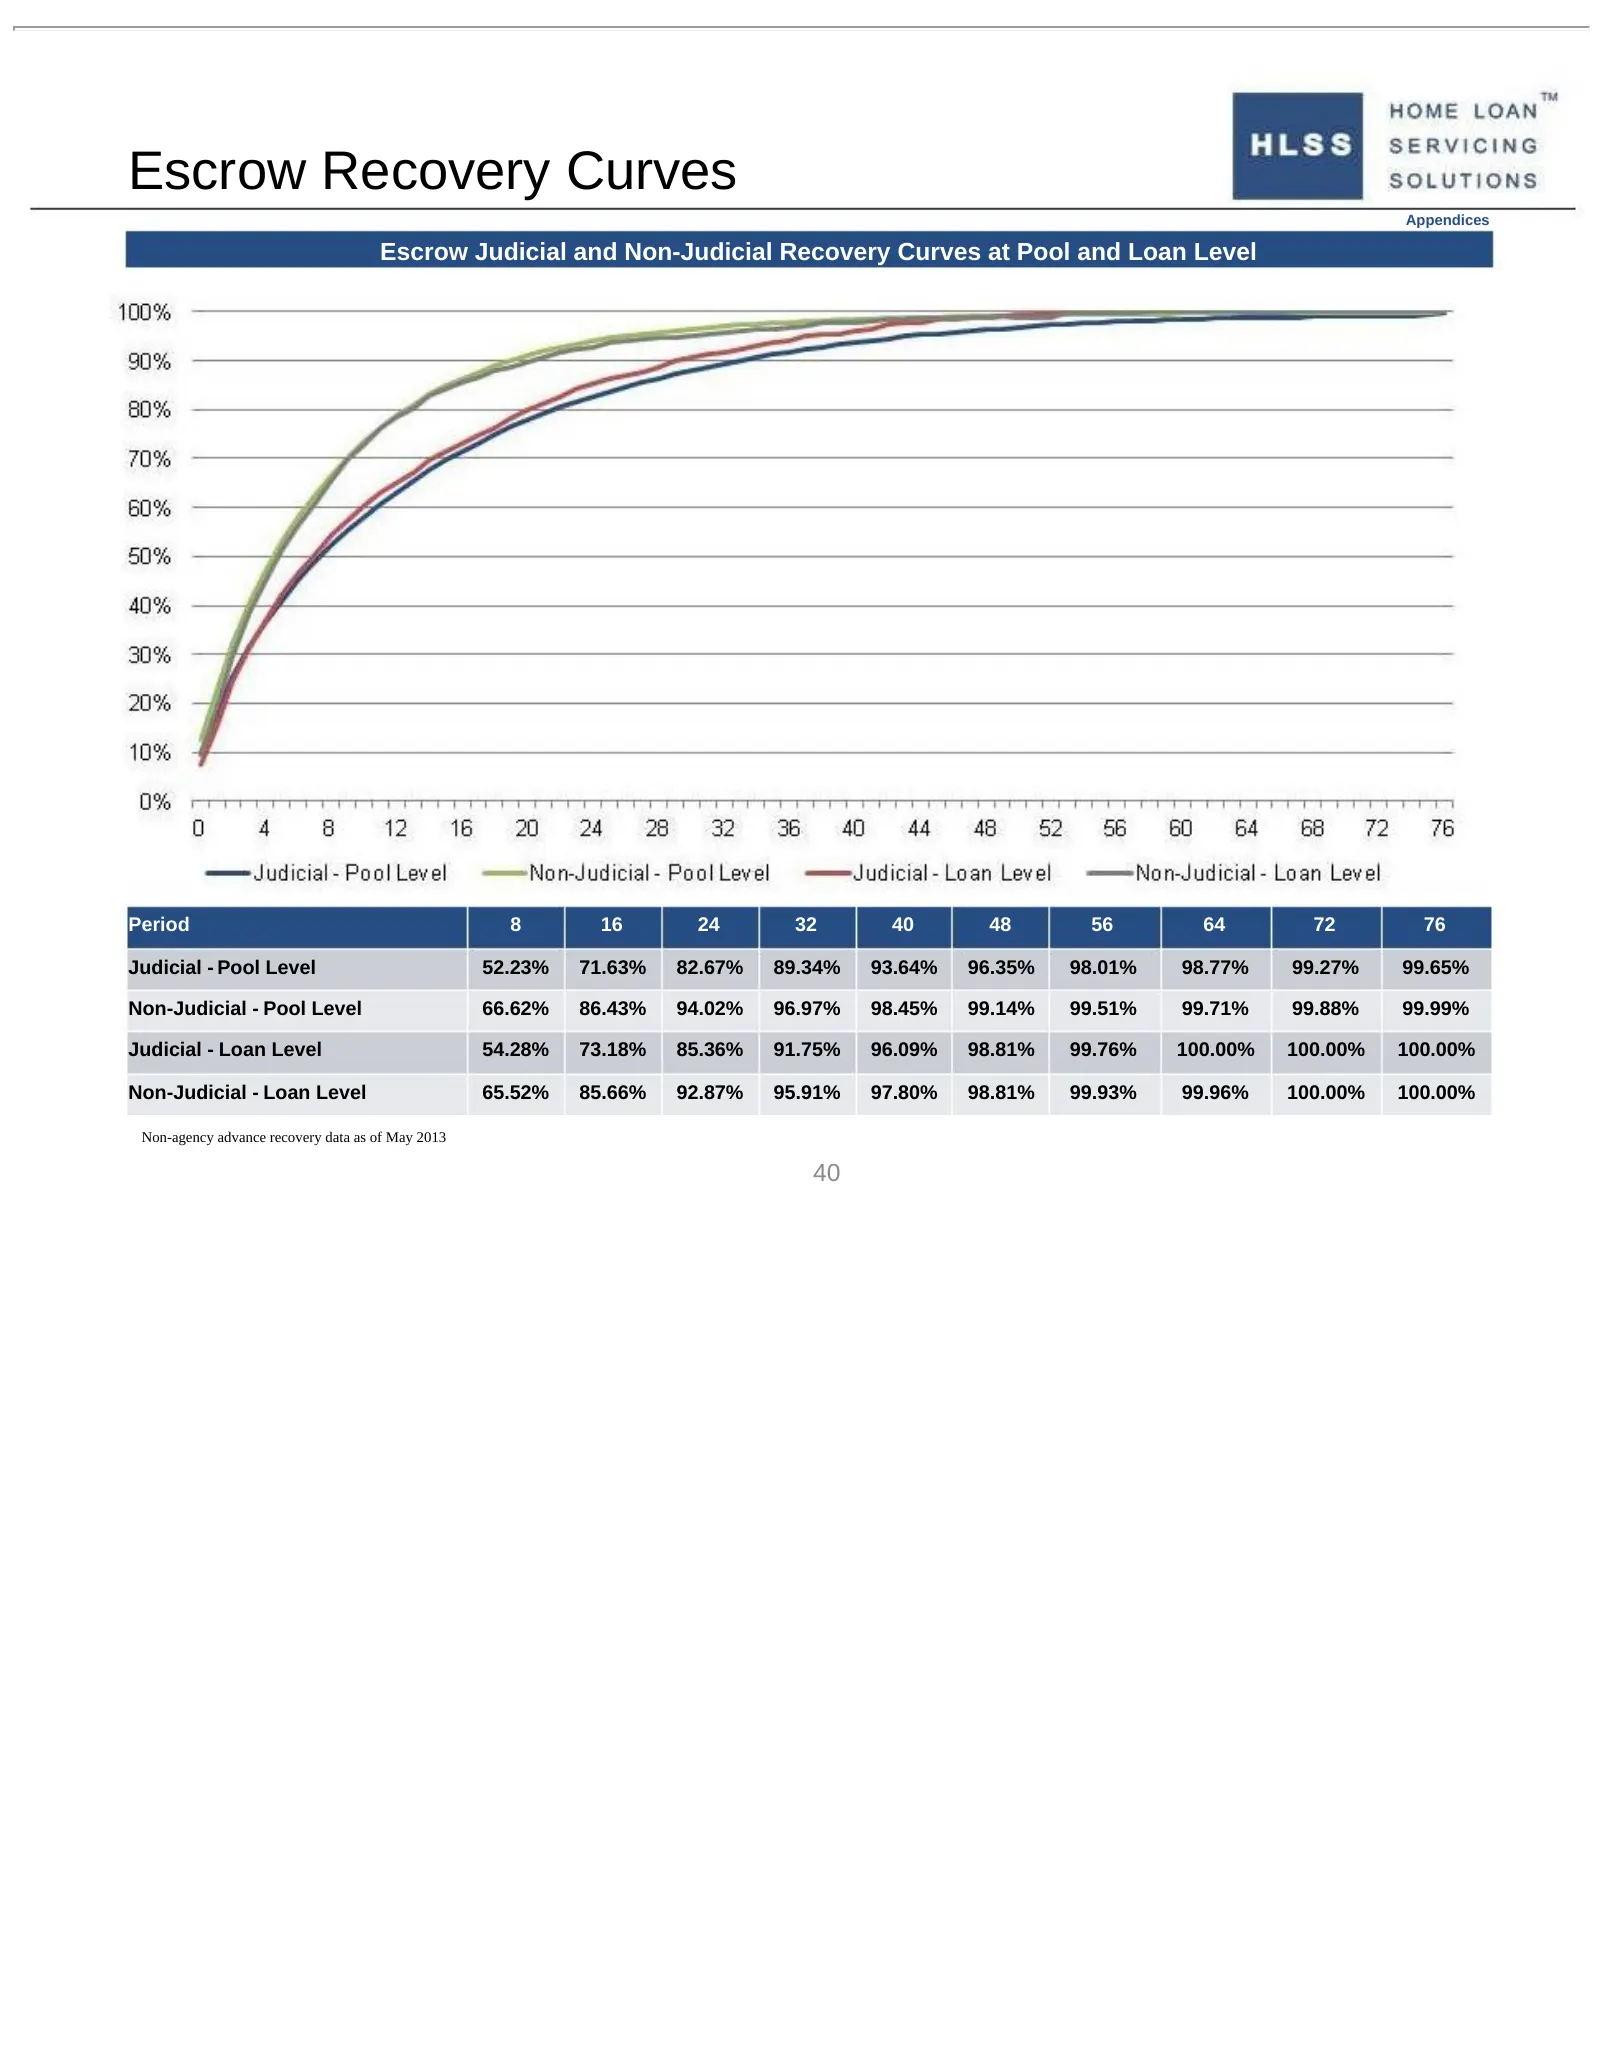
Escrow Recovery Curves Appendices Escrow Judicial and Non-Judicial Recovery Curves at Pool and Loan Level Period 8 16 24 32 40 48 56 64 72 76 Judicial - Pool Level 52.23% 71.63% 82.67% 89.34% 93.64% 96.35% 98.01% 98.77% 99.27% 99.65% Non-Judicial - Pool Level 66.62% 86.43% 94.02% 96.97% 98.45% 99.14
Slide 41: HLSS Servicer Advance Receivables Trust
* * * * * TM HLSS Servicer Advance Receivables Trust
Source: SEC EDGAR · 8-K filed Oct 7, 2013
More decks from Home Loan Servicing Solutions Ltd
 Merger or Acquisition (February 2015)6 slides · Feb 23, 2015
 Q3 2014 Earnings Presentation15 slides · Oct 21, 2014
 Debt Investor Presentation (September 2014)40 slides · Sep 22, 2014
 Investor Presentation (September 2014)14 slides · Sep 8, 2014
 Investor Presentation (May 2014)17 slides · May 20, 2014
 Debt Investor Presentation (January 2014)45 slides · Jan 23, 2014