Daseke — Hennessy Capital Acquisition Corp II — SPAC Merger (June 2016)
33 slides from Daseke's SPAC merger presentation, Jun 13, 2016
Slide 1: Investor Presentation June 2016
1 Investor Presentation June 2016
Slide 2: Disclaimers
Disclaimers The information in this presentation (this “Presentation”) is being provided by Hennessy Capital Acquisition Corp. II (“HCAC” ) t o you (“Recipient”, “you” or “your”) in connection with HCAC’s proposed acquisition of USI Senior Holdings, Inc. and its subsidiaries, including United Subcon
Slide 3: Disclaimers: Forward-Looking Statements
Disclaimers 3 Forward - Looking Statements This Presentation includes “forward - looking statements” within the meaning of the “safe harbor” provisions of the United States Private Securities Litigation Reform Act of 1995 . Forward - looking statements may be identified by the use of words such as “
Slide 4: Transaction Overview
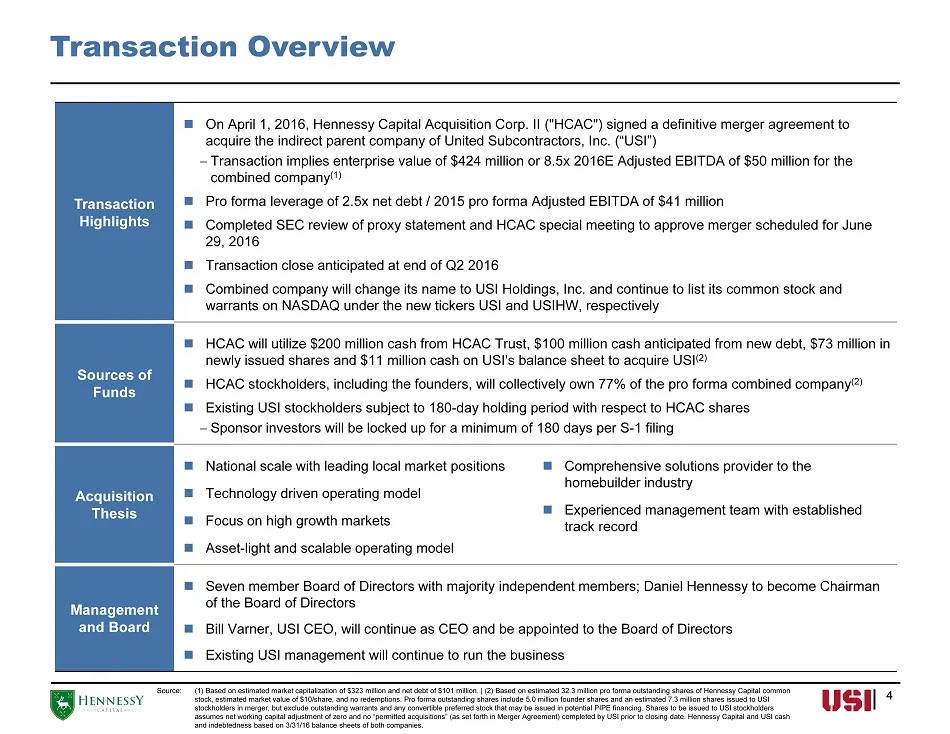
Transaction Overview 4 Transaction Highlights On April 1, 2016 , Hennessy Capital Acquisition Corp. II ("HCAC") signed a definitive merger agreement to acquire the indirect parent company of United Subcontractors, Inc. (“USI”) Transaction implies enterprise value of $424 million or 8.5x 2016E Ad
Slide 5: Transaction Overview: Sources, Uses and Ownership
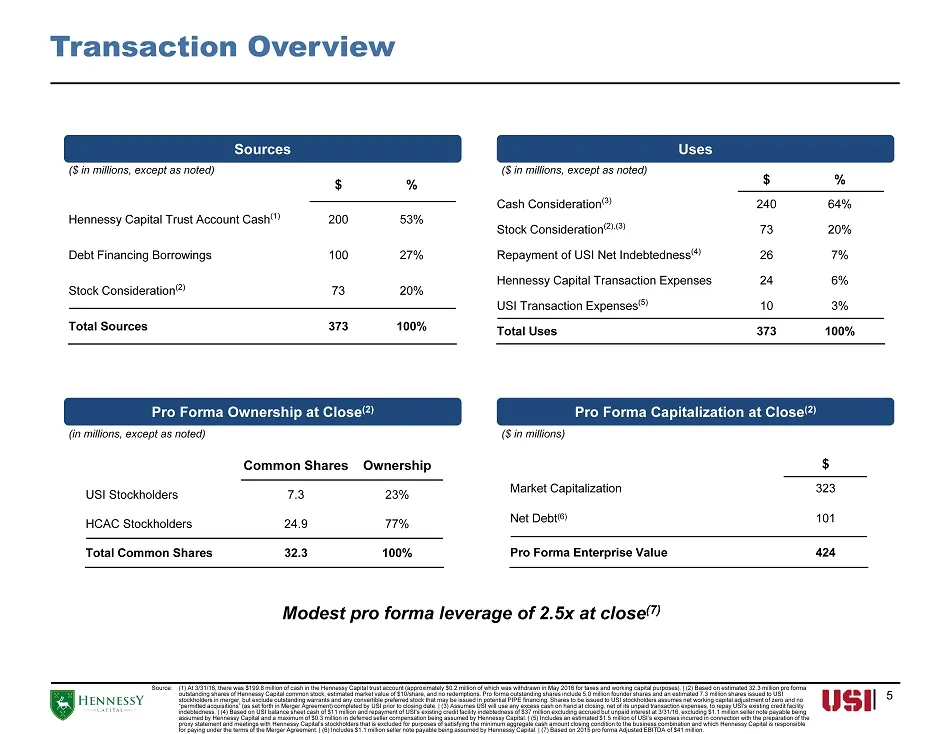
Transaction Overview 5 Sources $ % Hennessy Capital Trust Account Cash (1) 200 53% Debt Financing Borrowings 100 27% Stock Consideration (2) 73 20% Total Sources 373 100% ($ in millions, except as noted) Common Shares Ownership USI Stockholders 7.3 23% HCAC Stockholders 24.9 77% Total Common Shares
Slide 6: HCAC View of USI
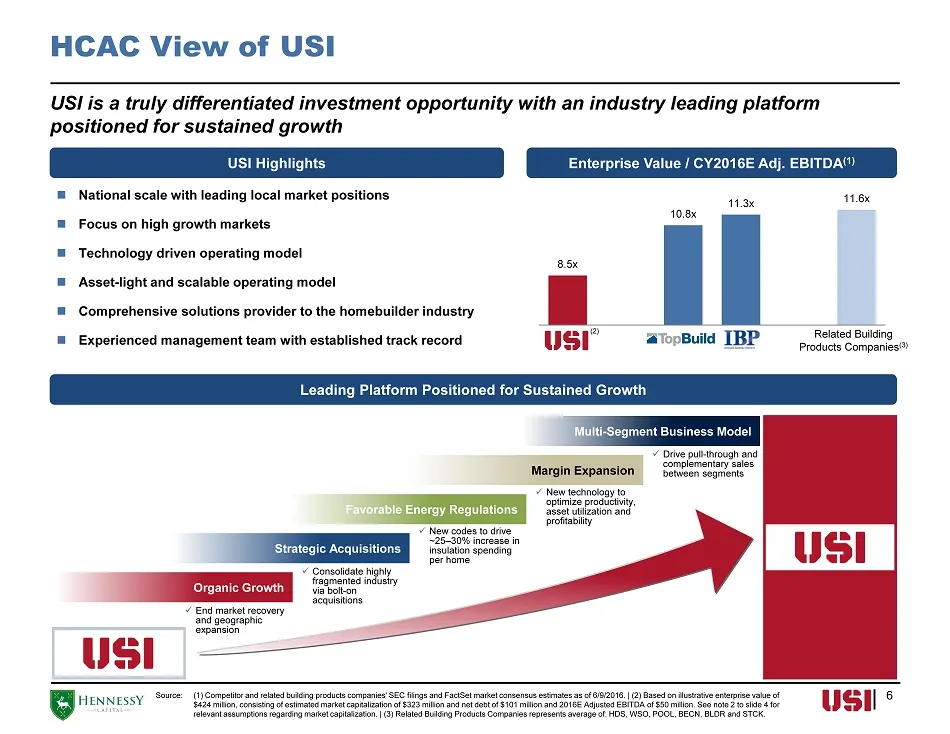
HCAC View of USI 6 National scale with leading local market positions Focus on high growth markets Technology driven operating model Asset - light and scalable operating model Comprehensive solutions provider to the homebuilder industry Experienced management team with established track
Slide 7: Industry Dynamics Support USI Growth Trajectory
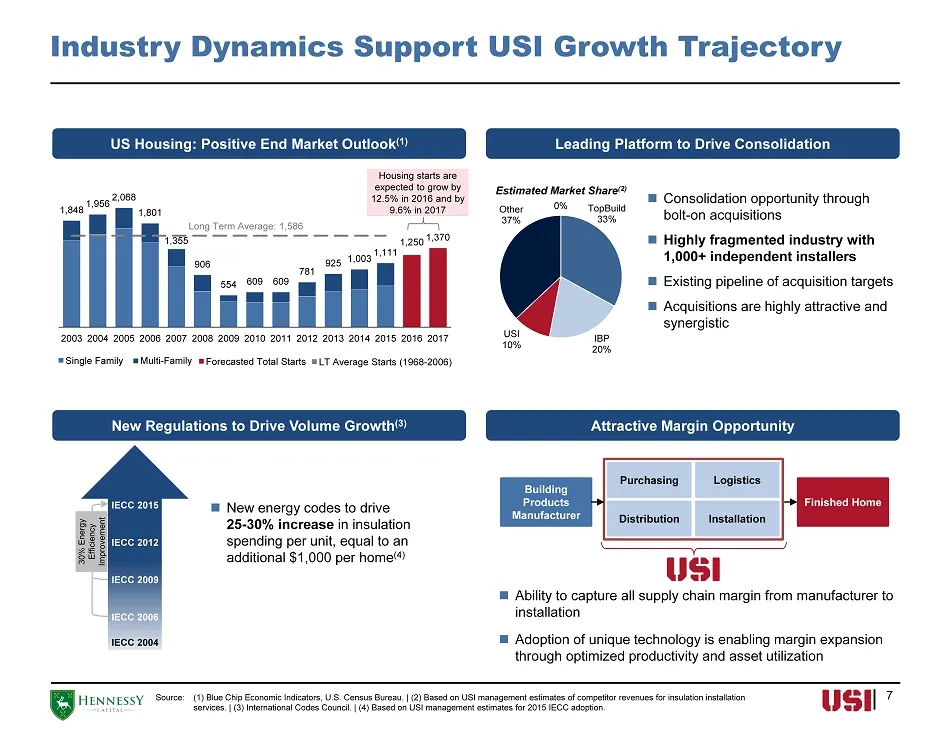
Industry Dynamics Support USI Growth Trajectory Leading Platform to Drive Consolidation US Housing: Positive End Market Outlook (1) New Regulations to Drive Volume Growth (3) Attractive Margin Opportunity TopBuild 33% IBP 20% USI 10% Other 37% 0% 0% Consolidation opportunity through bolt - on
Slide 8: USI Management
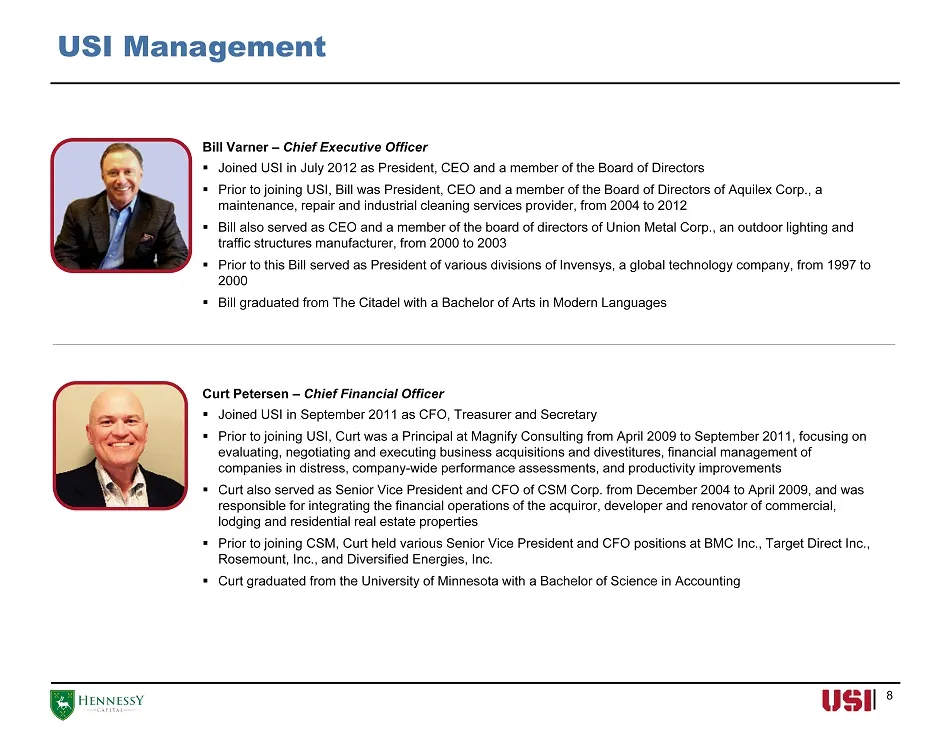
8 Bill Varner – Chief Executive Officer ▪ Joined USI in July 2012 as President , CEO and a member of the Board of Directors ▪ Prior to joining USI, Bill was President, CEO and a member of the Board of Directors of Aquilex Corp., a maintenance , repair and industrial cleaning services provider, from
Slide 9: Table of Contents
Table of Contents I. Company Overview II. Investment Highlights III. Financial Summary IV. Appendix 10 15 25 29 9
Slide 10: I. Company Overview
I. Company Overview \] > HENNESSY a
Slide 11: The USI Platform
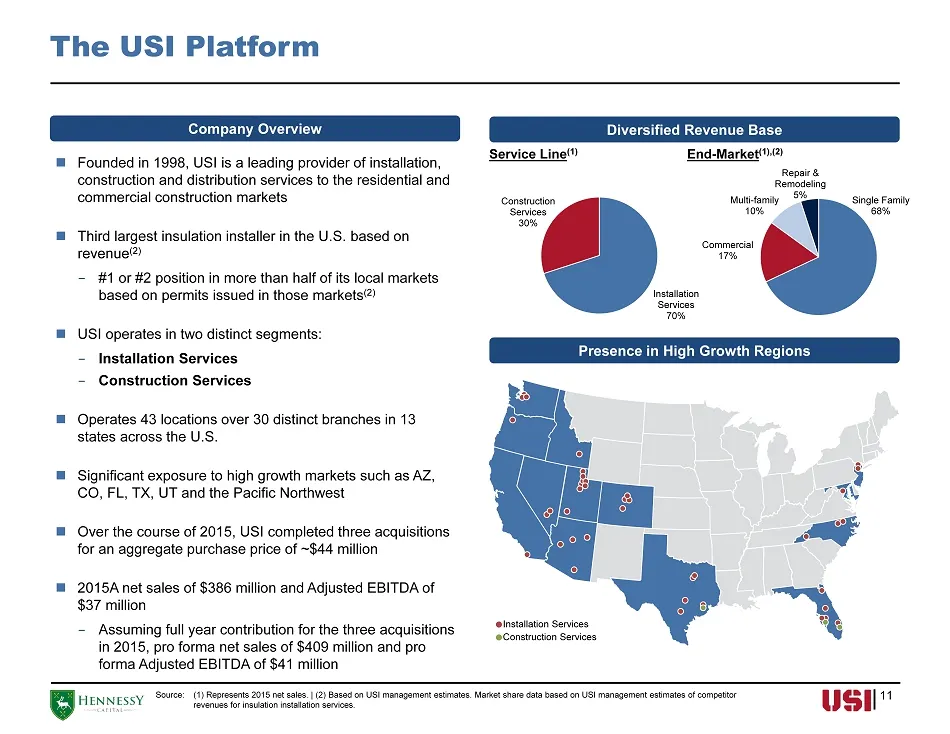
The USI Platform Company Overview Founded in 1998, USI is a leading provider of installation, construction and distribution services to the residential and commercial construction markets Third largest insulation installer in the U.S. based on revenue (2) - #1 or #2 position in more than half of
Slide 12: Diversified Product and Service Offering
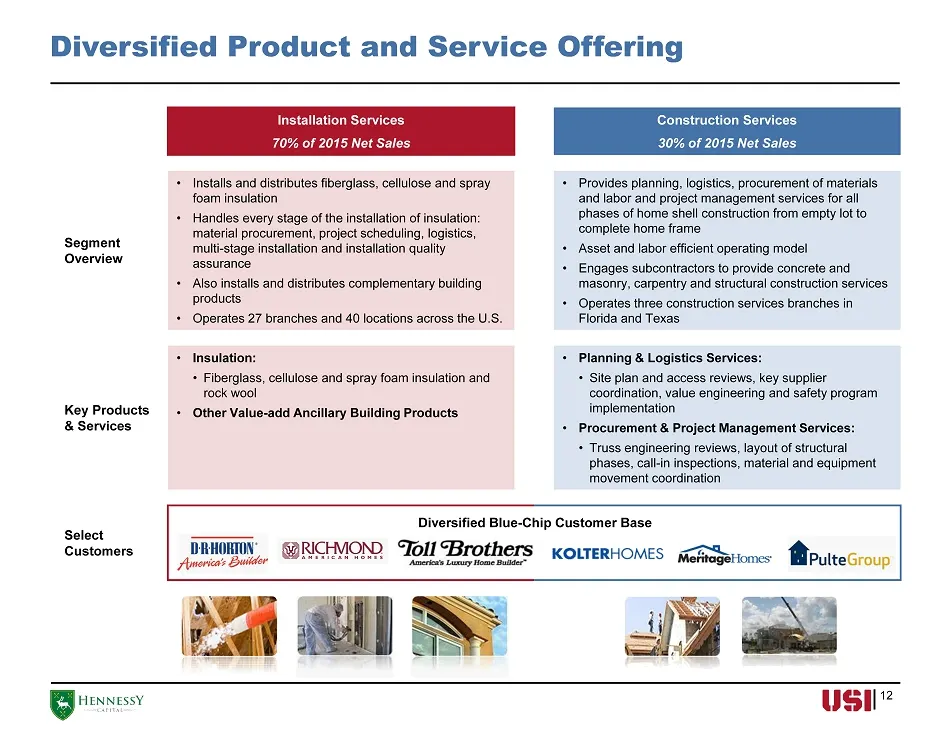
Diversified Product and Service Offering Installation Services 70% of 2015 Net Sales Construction Services 30% of 2015 Net Sales Segment Overview • Installs and distributes fiberglass, cellulose and spray foam insulation • Handles every stage of the installation of insulation: material procurement,
Slide 13: Construction Services Overview
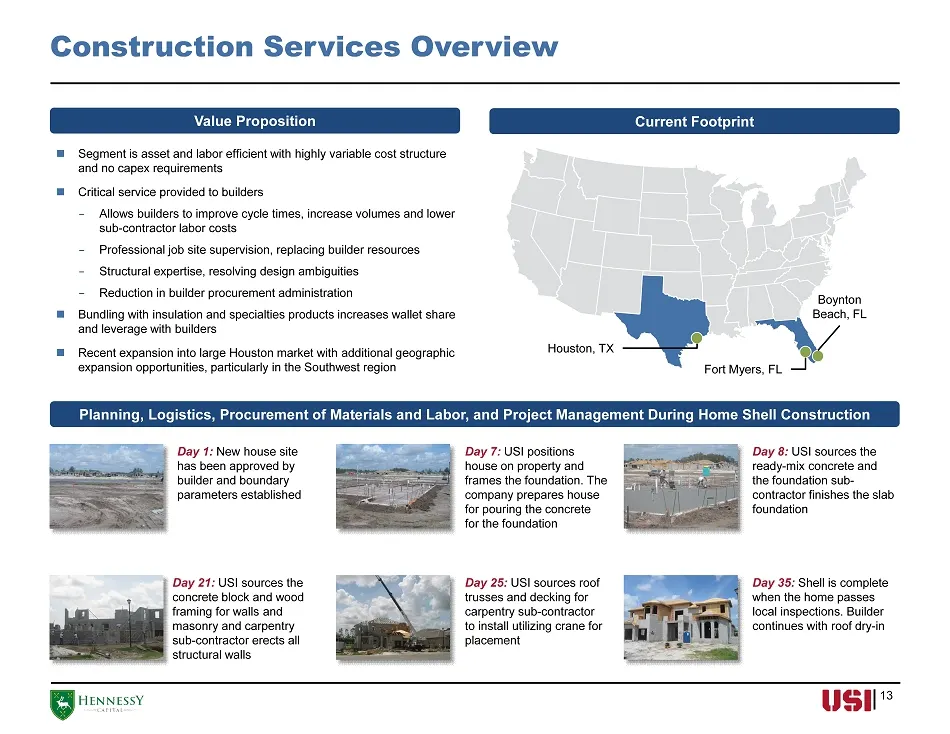
Construction Services Overview 13 Segment is asset and labor efficient with highly variable cost structure and no capex requirements Critical service provided to builders - Allows builders to improve cycle times, increase volumes and lower sub - contractor labor costs - Professional job site sup
Slide 14: Attractive Attributes of a Streamlined Value Chain
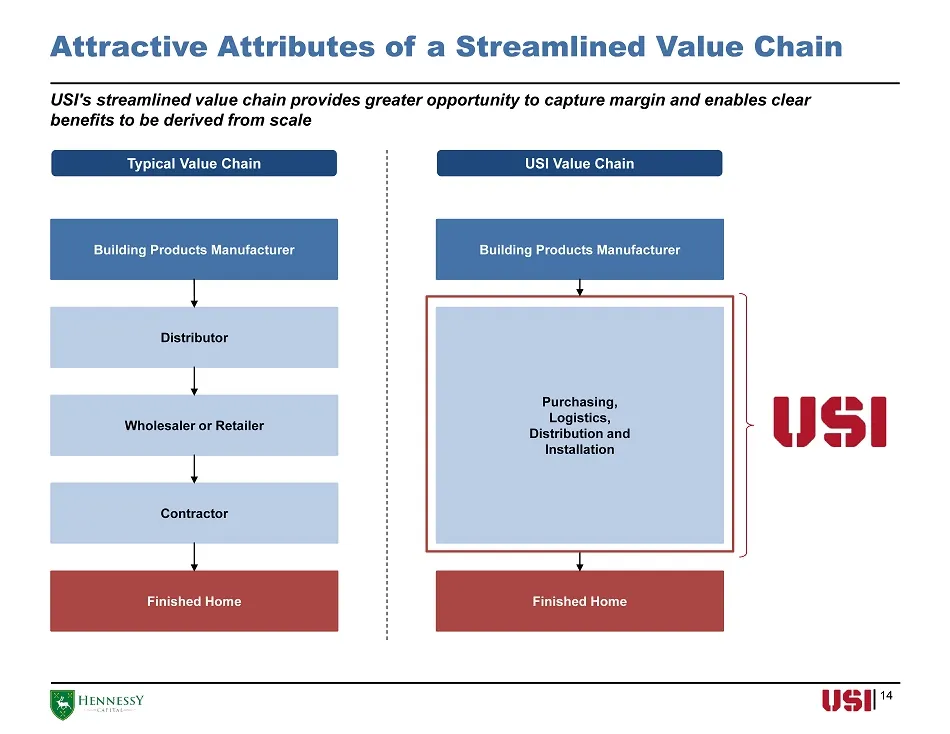
Attractive Attributes of a Streamlined Value Chain 14 USI's streamlined value chain provides greater opportunity to capture margin and enables clear benefits to be derived from scale Typical Value Chain USI Value Chain Building Products Manufacturer Distributor Wholesaler or Retailer Contractor Fini
Slide 15: II. Investment Highlights
IL. Investment Highlights \] > HENNESSY a
Slide 16: Investment Highlights
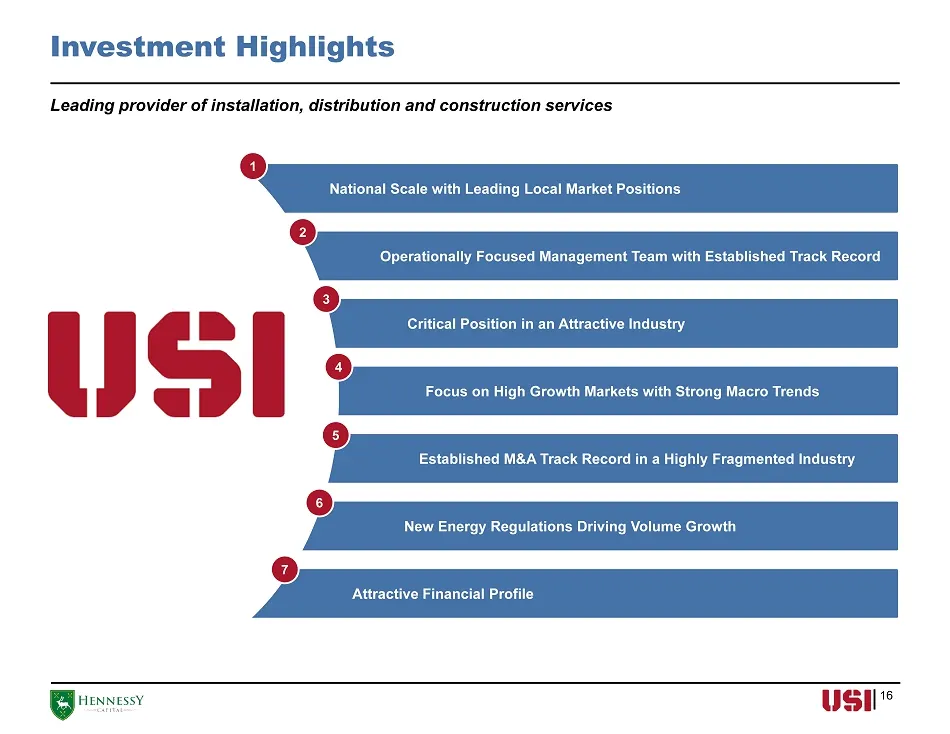
Investment Highlights Leading provider of installation , distribution and construction services 16 National Scale with Leading Local Market Positions Operationally Focused Management Team with Established Track Record Critical Position in an Attractive Industry Focus on High Growth Markets with Stro
Slide 17: National Scale with Leading Local Market Positions
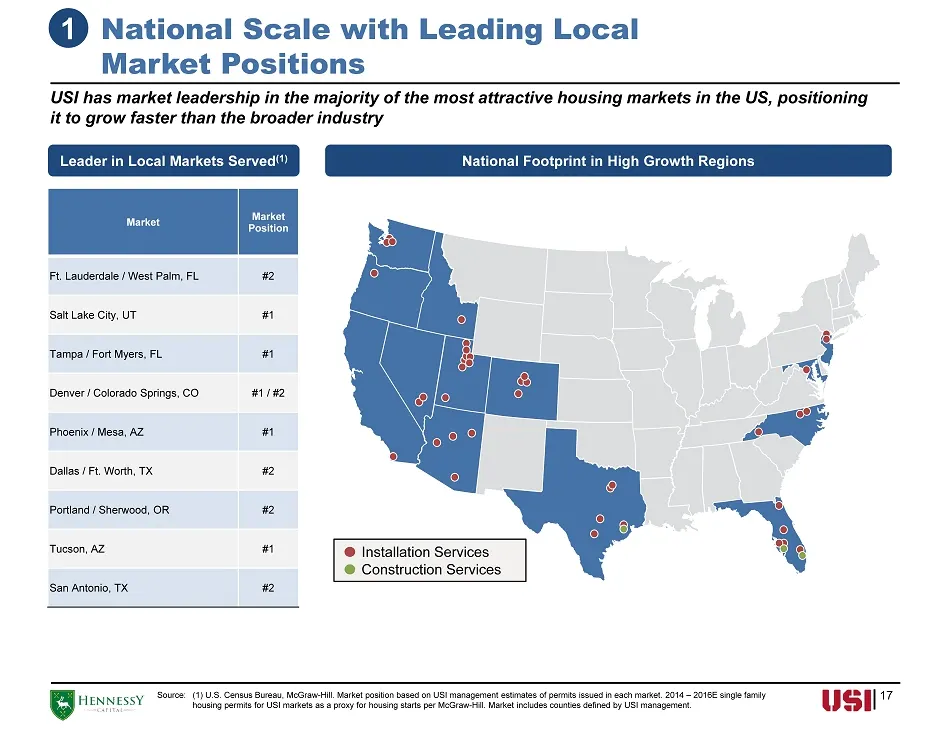
National Scale with Leading Local Market Positions 1 Market Market Position Ft. Lauderdale / West Palm, FL #2 Salt Lake City, UT #1 Tampa / Fort Myers, FL #1 Denver / Colorado Springs, CO #1 / #2 Phoenix / Mesa, AZ #1 Dallas / Ft. Worth, TX #2 Portland / Sherwood, OR #2 Tucson, AZ #1 San Antonio, TX
Slide 18: Operationally Focused Management Team with Established Track Record
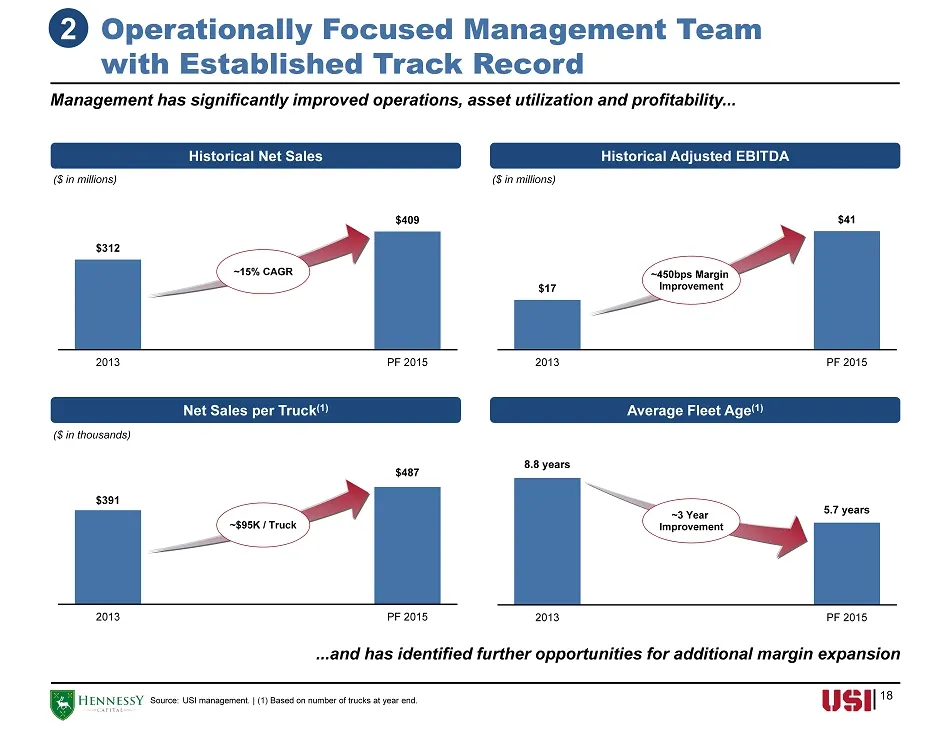
Operationally Focused Management Team with Established Track Record Historical Net Sales Historical Adjusted EBITDA ($ in millions) ($ in millions) Source: USI management. | (1 ) Based on number of trucks at year end. Net Sales per Truck (1) Average Fleet Age (1) ($ in thousands) 2 Management has si
Slide 19: Smart Truck Competitive Advantage
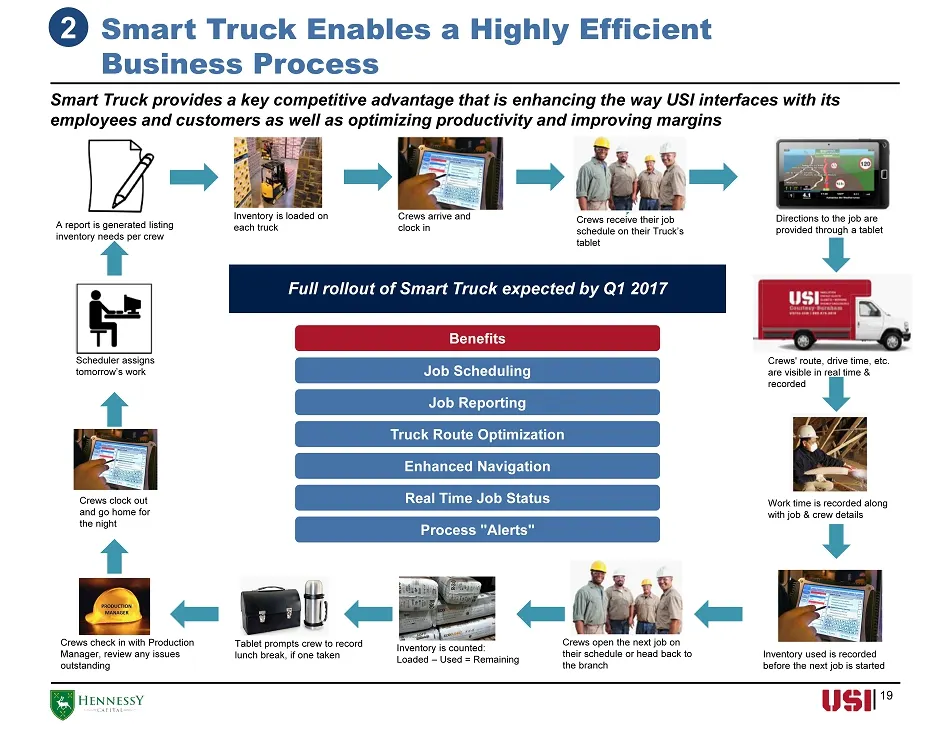
19 Smart Truck provides a key competitive advantage that is enhancing the way USI interfaces with its employees and customers as well as optimizing productivity and improving margins Scheduler assigns tomorrow’s work A report is generated listing inventory needs per crew Inventory is loaded on each
Slide 20: Critical Position in an Attractive Industry
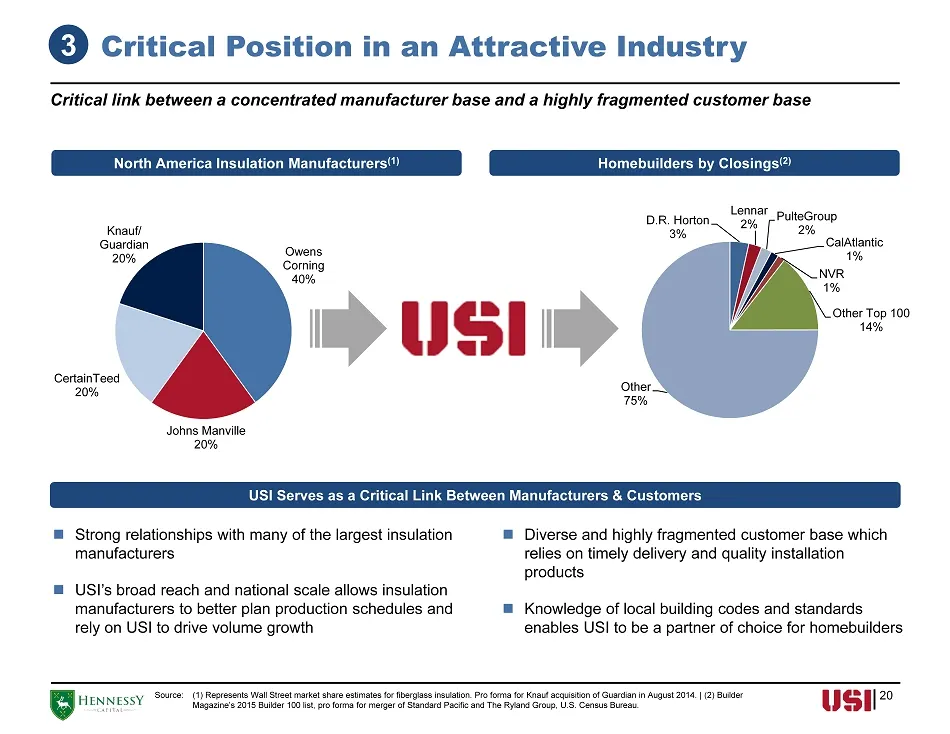
Critical Position in an Attractive Industry Critical link between a concentrated manufacturer base and a highly fragmented customer base North America Insulation Manufacturers (1 ) Homebuilders by Closings (2 ) USI Serves as a Critical Link Between Manufacturers & Customers Strong relationships wi
Slide 21: Focus on High Growth Markets with Strong Macro Trends
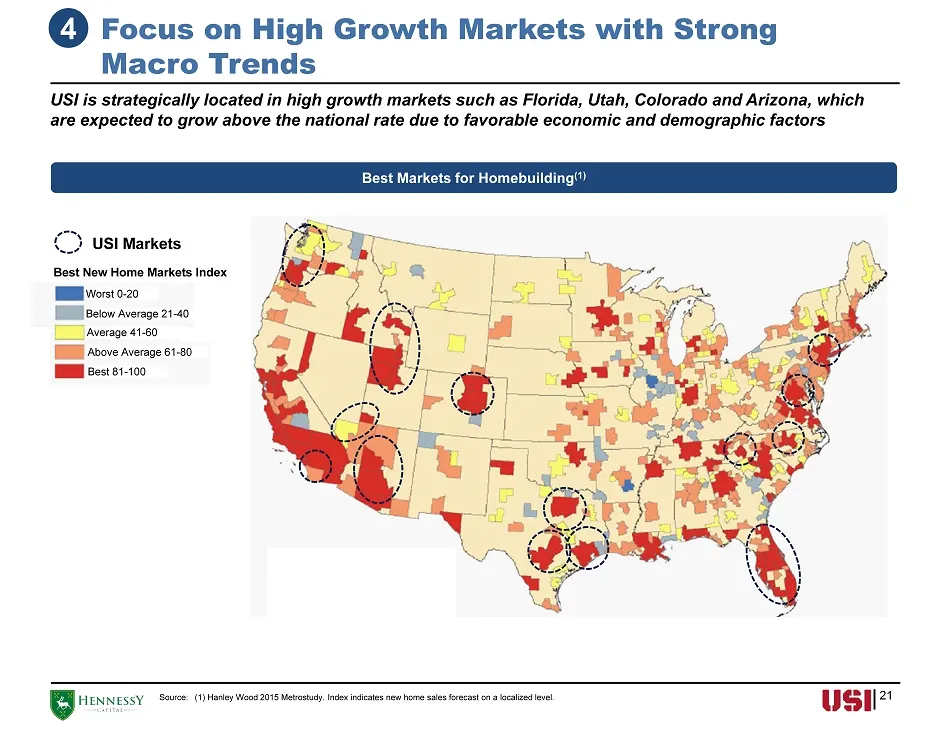
Focus on High Growth Markets with Strong Macro Trends 21 4 USI is strategically located in high growth markets such as Florida, Utah, Colorado and Arizona, which are expected to grow above the national rate due to favorable economic and demographic factors Best New Home Markets Index Best Markets fo
Slide 22: Established M&A Track Record in a Highly Fragmented Industry
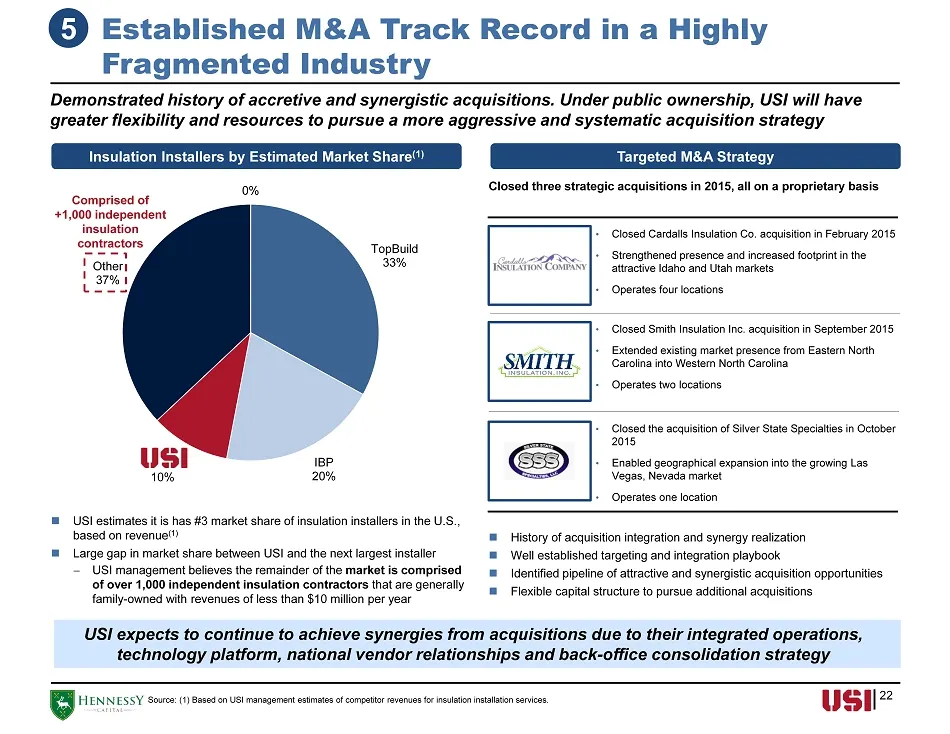
TopBuild 33% IBP 20% USI 10% Other 37% 0% 0% Established M&A Track Record in a Highly Fragmented Industry 22 Insulation Installers by Estimated Market Share (1) Targeted M&A Strategy Closed three strategic acquisitions in 2015, all on a proprietary basis History of acquisition integration and
Slide 23: Attractive New Market Expansion Opportunities
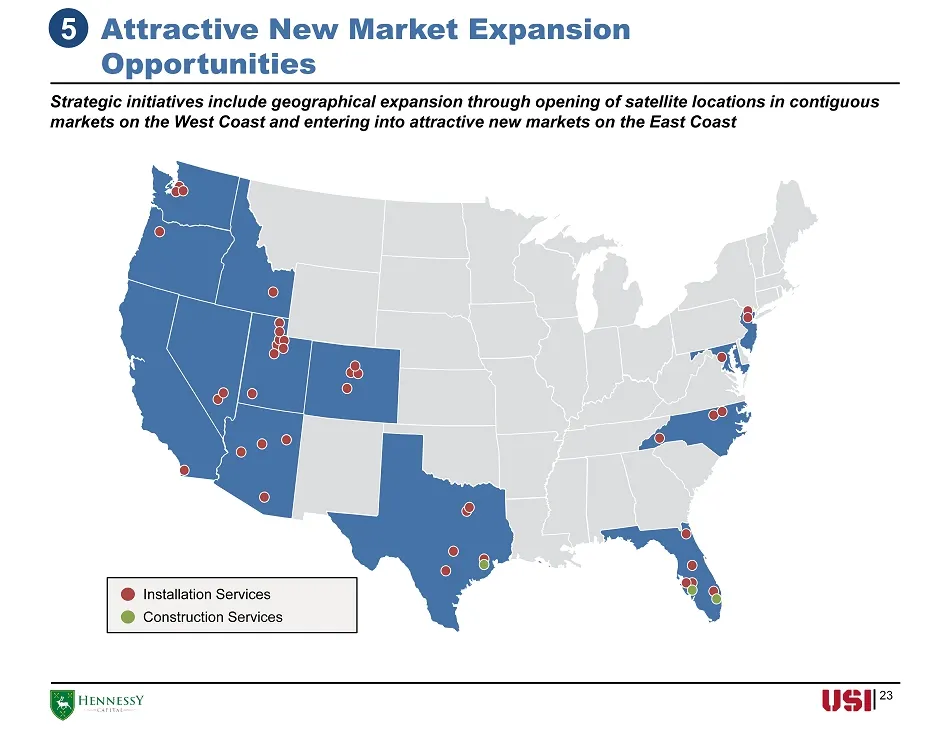
Attractive New Market Expansion Opportunities Strategic initiatives include geographical expansion through opening of satellite locations in contiguous markets on the West Coast and entering into attractive new markets on the East Coast Construction Services Installation Services 5 23
Slide 24: Favorable Energy Regulatory Environment
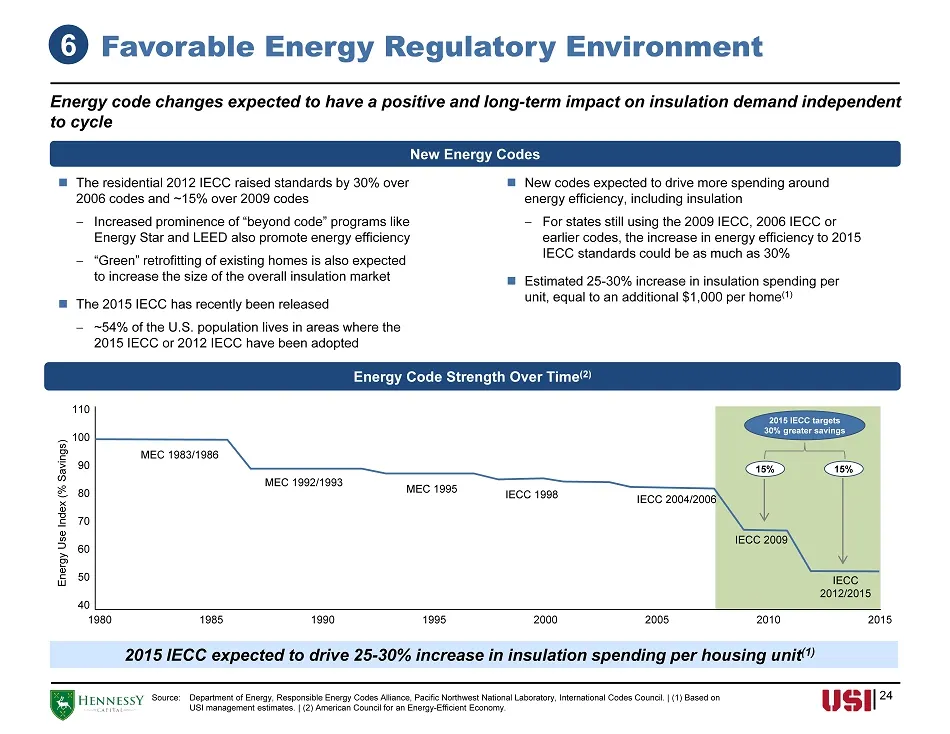
Favorable Energy Regulatory Environment Energy code changes expected to have a positive and long - term impact on insulation demand independent to cycle Energy Code Strength Over Time (2) Source: Department of Energy, Responsible Energy Codes Alliance, Pacific Northwest National Laboratory, Internat
Slide 25: III. Financial Summary
IIL. Financial Summary ] > HENNESSY a
Slide 26: Track Record of Significant Growth and Margin Improvement
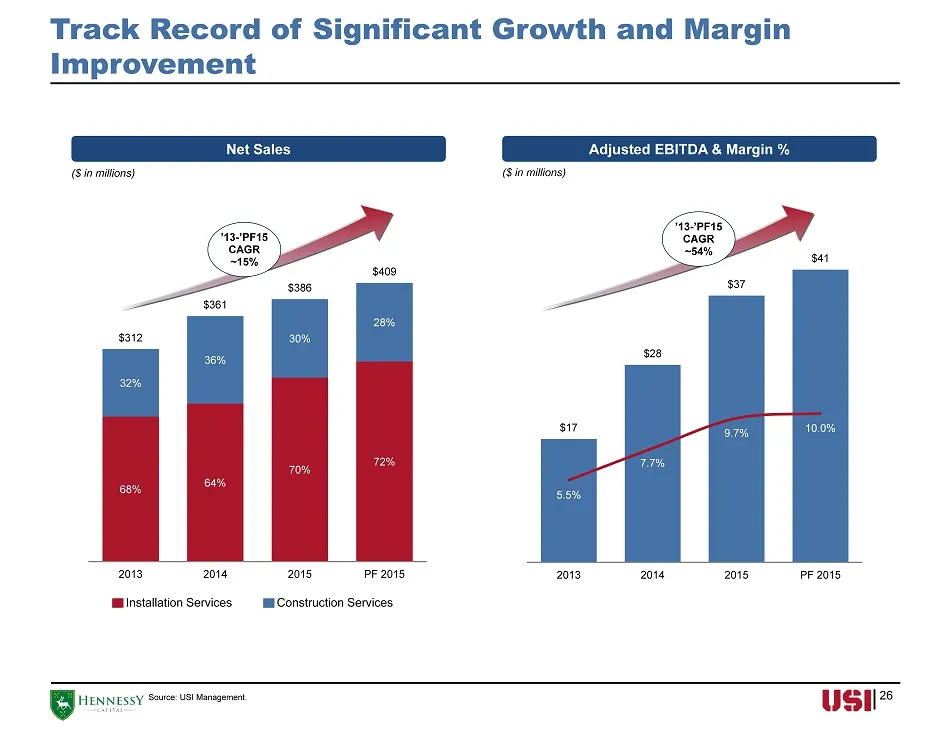
$17 $28 $37 $41 5.5% 7.7% 9.7% 10.0% 2013 2014 2015 PF 2015 68% 64% 70% 72% 32% 36% 30% 28% $312 $361 $386 $409 2013 2014 2015 PF 2015 Track Record of Significant Growth and Margin Improvement Net Sales Source: USI Management. Adjusted EBITDA & Margin % ($ in millions) ($ in millions) Installation S
Slide 27: Strong Q1 Performance Demonstrating USI's Growth Potential
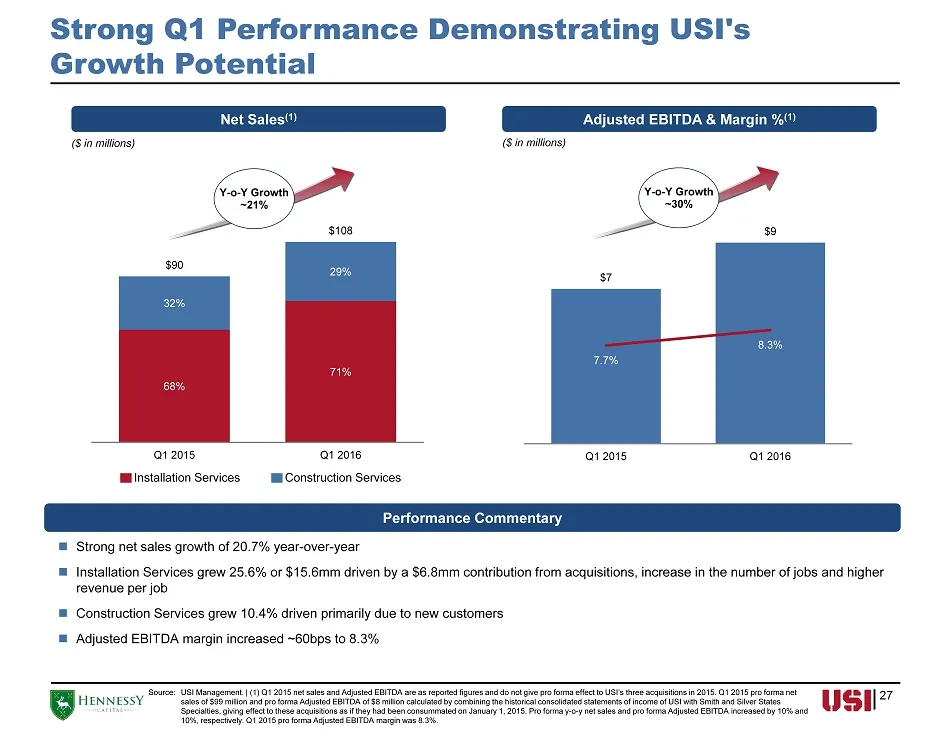
Strong Q1 Performance Demonstrating USI's Growth Potential Net Sales (1) Source : USI Management. | (1) Q1 2015 net sales and Adjusted EBITDA are as reported figures and do not give pro forma effect to USI’s thr ee acquisitions in 2015. Q1 2015 pro forma net sales of $99 million and pro forma Adjust
Slide 28: 2016 Guidance
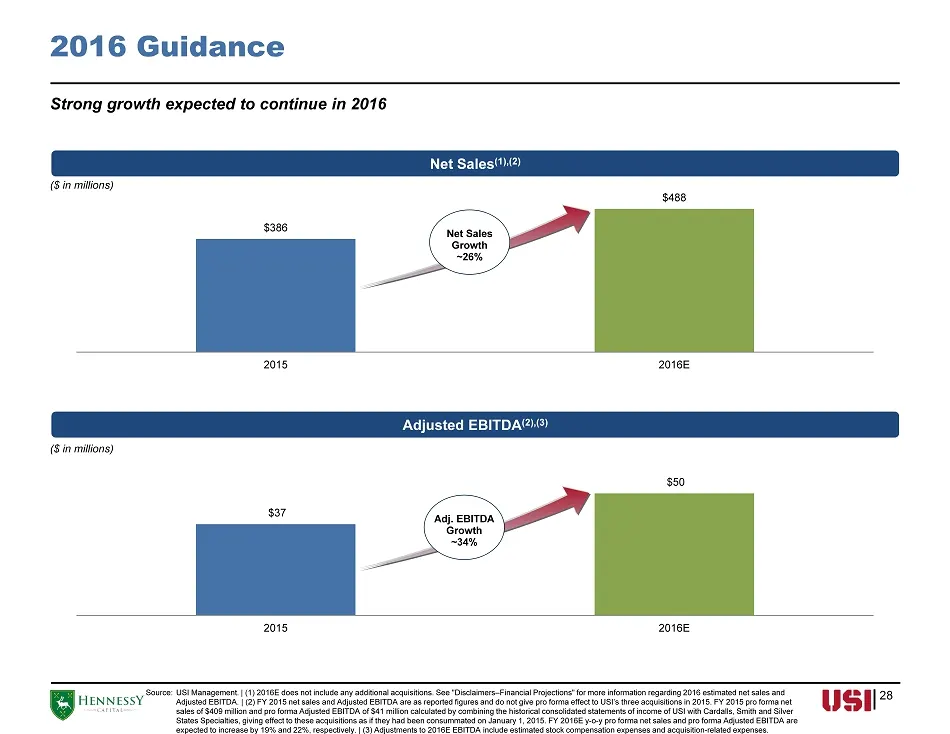
2016 Guidance 28 Source : USI Management. | (1) 2016E does not include any additional acquisitions. See "Disclaimers – Financial Projections" for more in formation regarding 2016 estimated net sales and Adjusted EBITDA. | (2) FY 2015 net sales and Adjusted EBITDA are as reported figures and do not g
Slide 29: IV. Appendix
IV. Appendix \] > HENNESSY a
Slide 30: Financial Summary and Non-GAAP Reconciliations
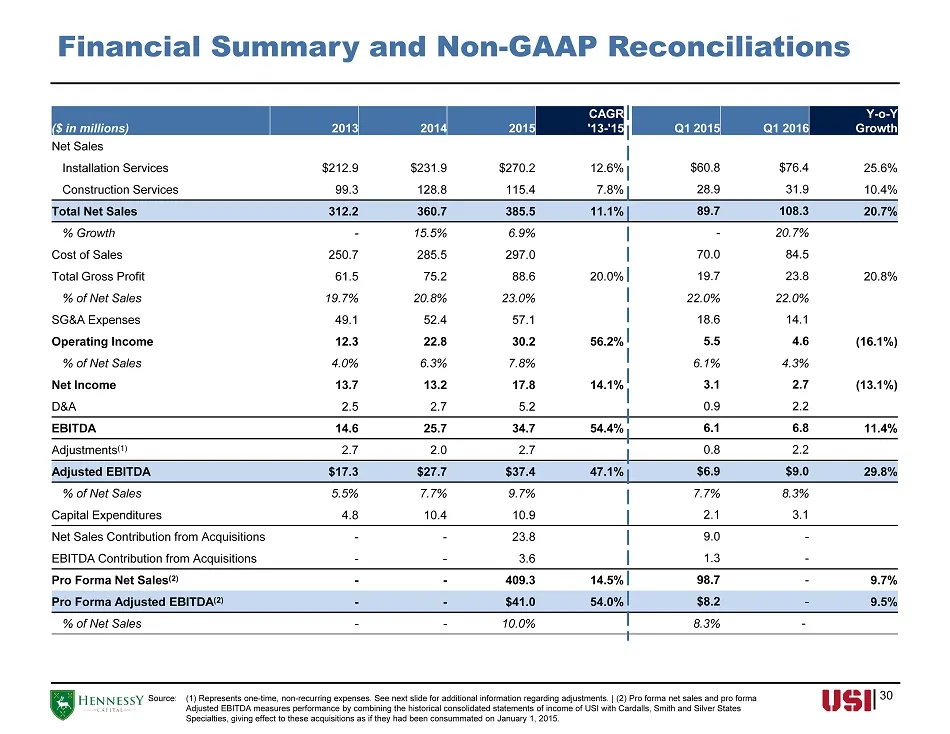
30 Financial Summary and Non - GAAP Reconciliations ($ in millions ) 2013 2014 2015 CAGR '13 - '15 Q1 2015 Q1 2016 Y - o - Y Growth Net Sales Installation Services $212.9 $231.9 $270.2 12.6% $60.8 $76.4 25.6% Construction Services 99.3 128.8 115.4 7.8% 28.9 31.9 10.4% Total Net Sales 312.2 360.7 385
Slide 31: EBITDA Adjustments
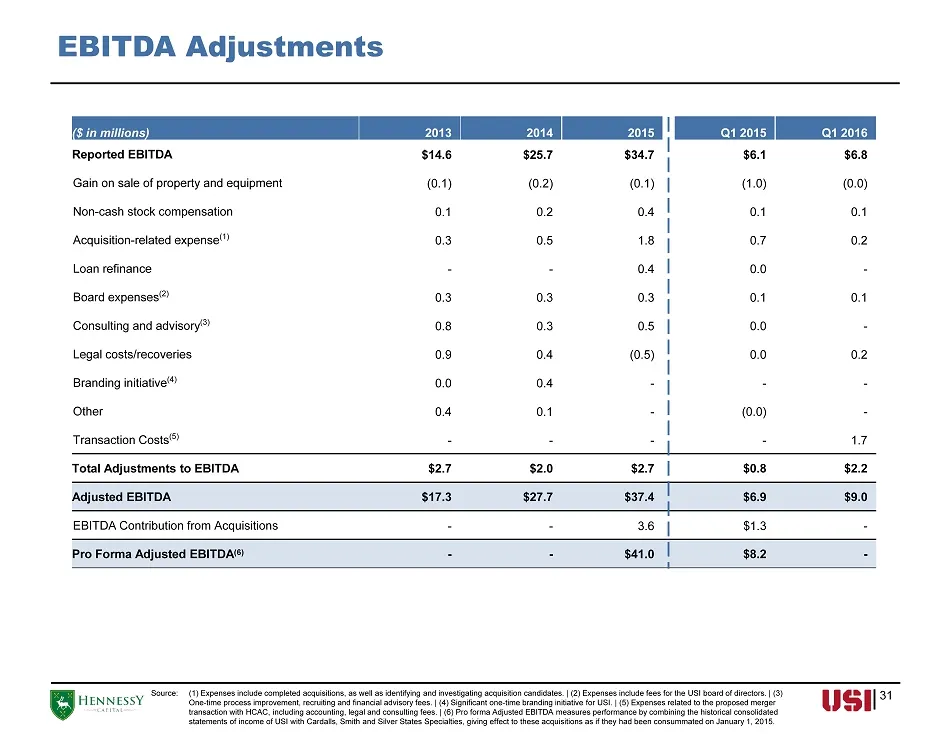
EBITDA Adjustments 31 ($ in millions) 2013 2014 2015 Q1 2015 Q1 2016 Reported EBITDA $14.6 $25.7 $34.7 $6.1 $6.8 Gain on sale of property and equipment (0.1) (0.2) (0.1) (1.0) (0.0) Non - cash stock compensation 0.1 0.2 0.4 0.1 0.1 Acquisition - related expense (1) 0.3 0.5 1.8 0.7 0.2 Loan refinance
Slide 32: Directors
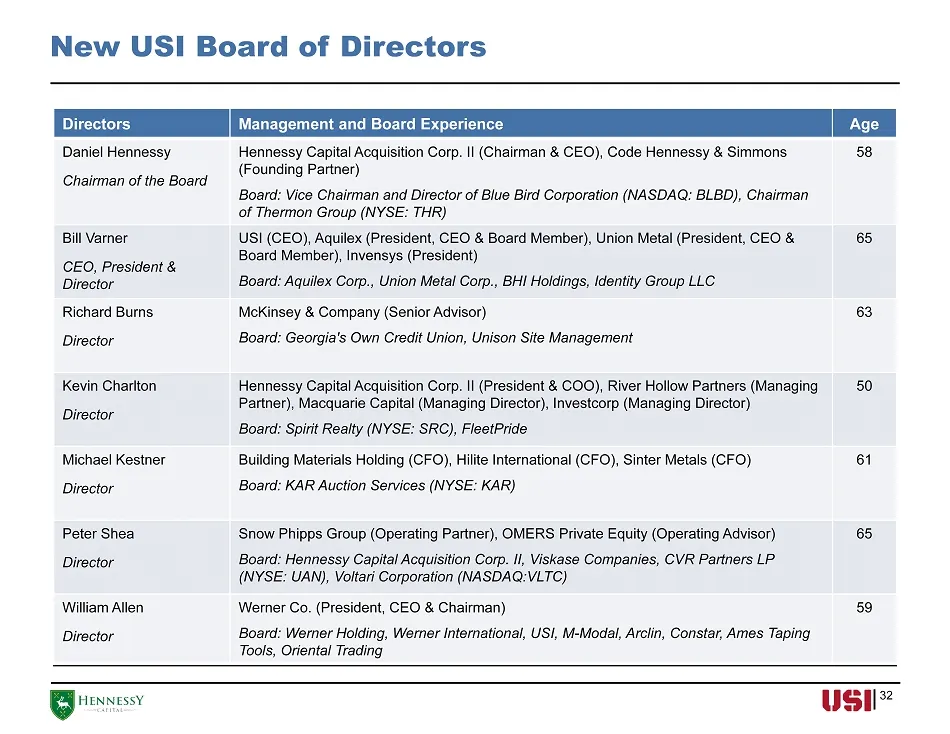
32 Directors Management and Board Experience Age Daniel Hennessy Chairman of the Board Hennessy Capital Acquisition Corp. II (Chairman & CEO), Code Hennessy & Simmons (Founding Partner) Board: Vice Chairman and Director of Blue Bird Corporation (NASDAQ: BLBD), Chairman of Thermon Group (NYSE: THR) 5
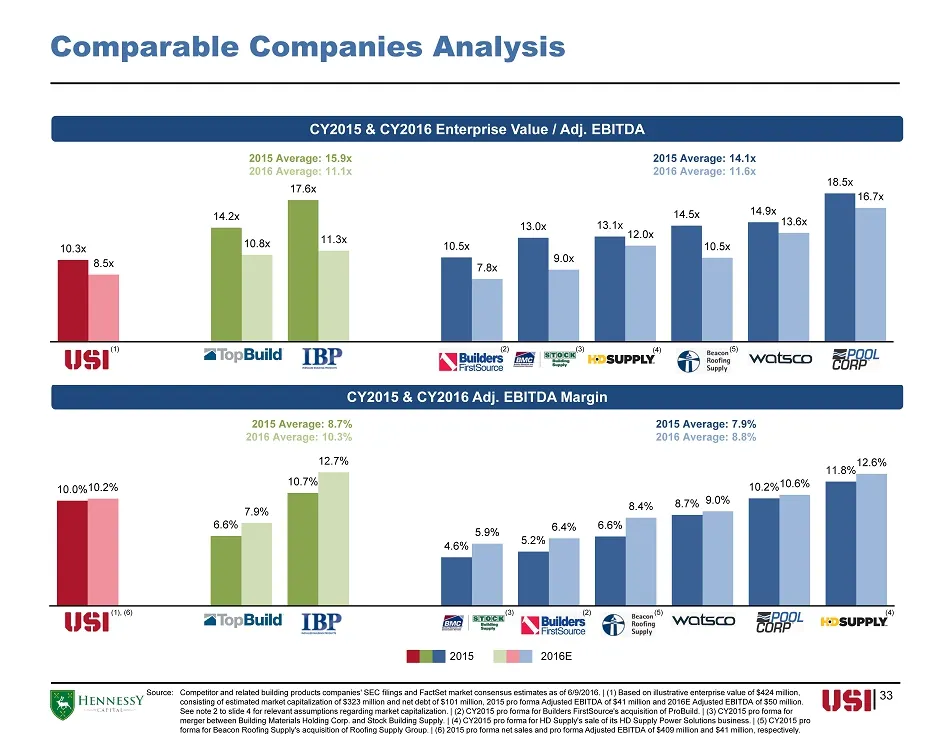
Slide 33: Comparable Companies Analysis
Comparable Companies Analysis 33 CY2015 & CY2016 Enterprise Value / Adj. EBITDA Source : Competitor and related building products companies' SEC filings and FactSet market consensus estimates as of 6/9/2016. | (1) Based on illustrative enterprise value of $ 424 million, consisting of estimated marke
Source: SEC EDGAR · 8-K filed Jun 13, 2016
More decks from Daseke Inc
 Q3 2023 Earnings Presentation38 slides · Nov 9, 2023
 Q2 2023 Earnings Presentation35 slides · Aug 3, 2023
 Q1 2023 Earnings Presentation34 slides · May 9, 2023
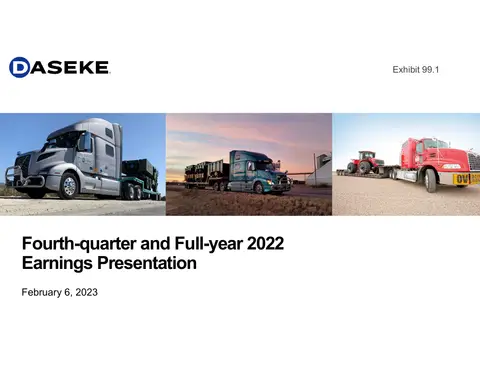 FY2022 Earnings Presentation29 slides · Feb 6, 2023
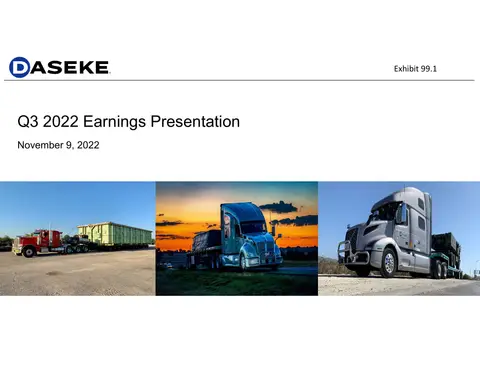 Q3 2022 Earnings Presentation33 slides · Nov 9, 2022
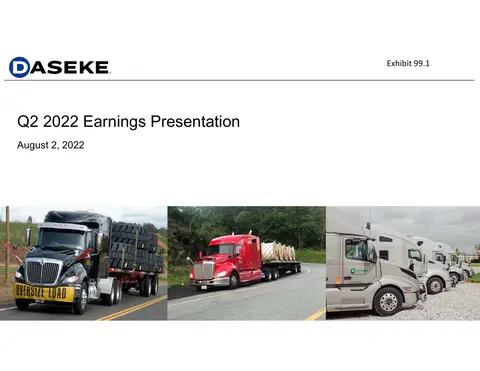 Q2 2022 Earnings Presentation27 slides · Aug 2, 2022