GLG Partners — Barclays Capital Global Financial Services Conference 2009
33 slides from GLG Partners's conference presentation, Sep 16, 2009
Slide 1: Barclays Capital Global Financial Services Conference
GLG Partners, Inc. BARCLAYS CAPITAL GLOBAL FINANCIAL SERVICES CONFERENCE New York September 16, 2009 Exhibit 99.1
Slide 2: Forward-Looking Statements
FORWARD-LOOKING STATEMENTS This presentation contains statements relating to future results (including certain projections and business trends) of GLG Partners, Inc. ("GLG") that are forward-looking statements. Actual results may differ materially from those projected as a result of certain risks an
Slide 3: GLG Overview
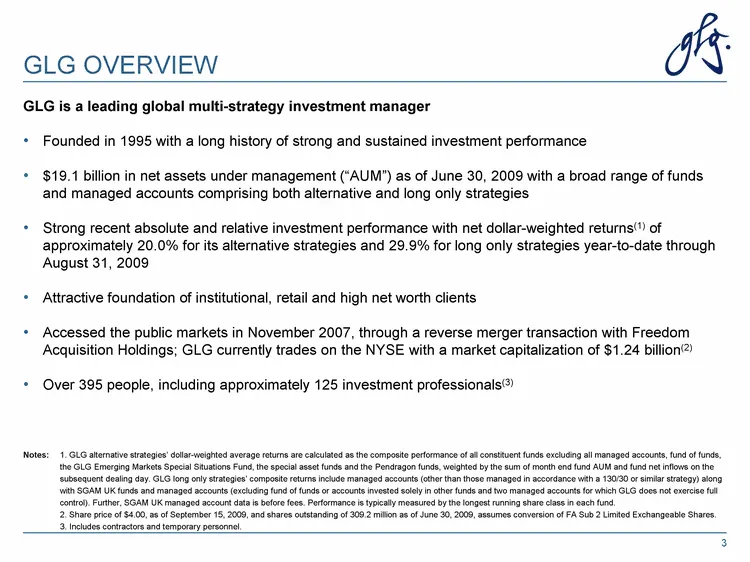
GLG OVERVIEW Notes: 1. GLG alternative strategies' dollar-weighted average returns are calculated as the composite performance of all constituent funds excluding all managed accounts, fund of funds, the GLG Emerging Markets Special Situations Fund, the special asset funds and the Pendragon funds, we
Slide 4: Diversified Multi-Strategy Model
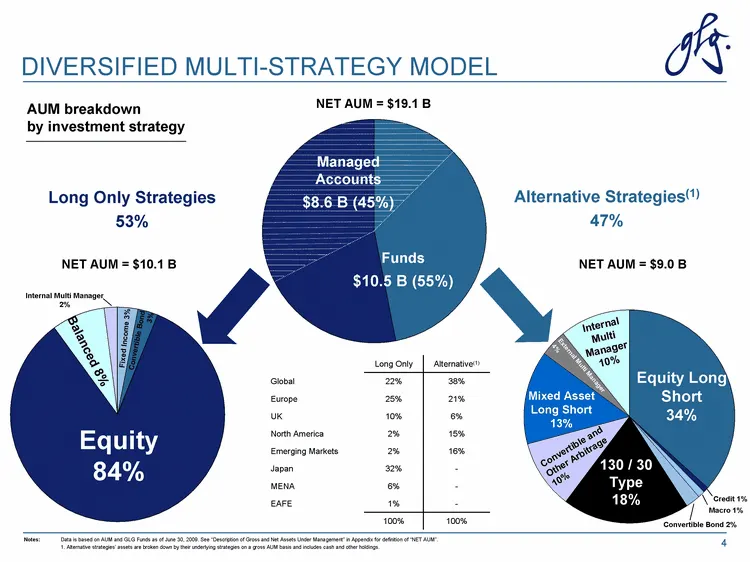
Long Only Strategies 53% Alternative Long Only 47 53 Equity L/S Credit Macro Convert Bond 130/30 Like Convert & Other Mixed Asset L/S Ext MMI Int MMI 34 1 1 2 18 10 13 4 10 FI Converts Equity Balanced MMI 3 3 84 8 2 Alternative Strategies(1) 47% DIVERSIFIED MULTI-STRATEGY MODEL AUM breakdown by inve
Slide 5: Differentiated Investment Approach and Infrastructure
DIFFERENTIATED INVESTMENT APPROACH AND INFRASTRUCTURE Heavy emphasis on fundamental research, tactical trading and a vast network of industry and street contacts. The scale of GLG drives significant access. Investment professionals work on large open research / trading floors. Investment strategies
Slide 6: Attractive Platform for World Class Institutions
ATTRACTIVE PLATFORM FOR WORLD CLASS INSTITUTIONS Superior client focus through dedicated client services team with direct access to the investment management and risk teams and customized, real time client reporting Significant number of clients invested in multiple GLG funds Large proportion of AUM
Slide 7: Long-Term Track Record of Strong Investment Performance
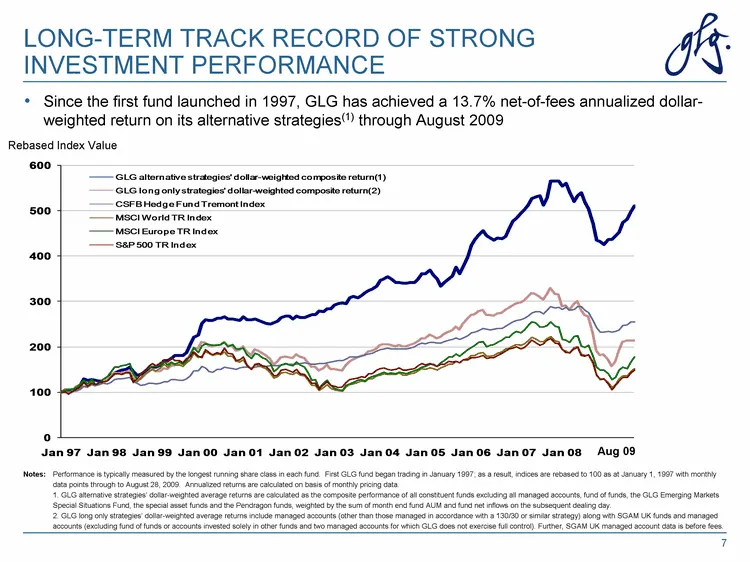
LONG-TERM TRACK RECORD OF STRONG INVESTMENT PERFORMANCE Since the first fund launched in 1997, GLG has achieved a 13.7% net-of-fees annualized dollar- weighted return on its alternative strategies(1) through August 2009 Rebased Index Value 7 Notes: Performance is typically measured by the longest ru
Slide 8: 2009 Investment Performance
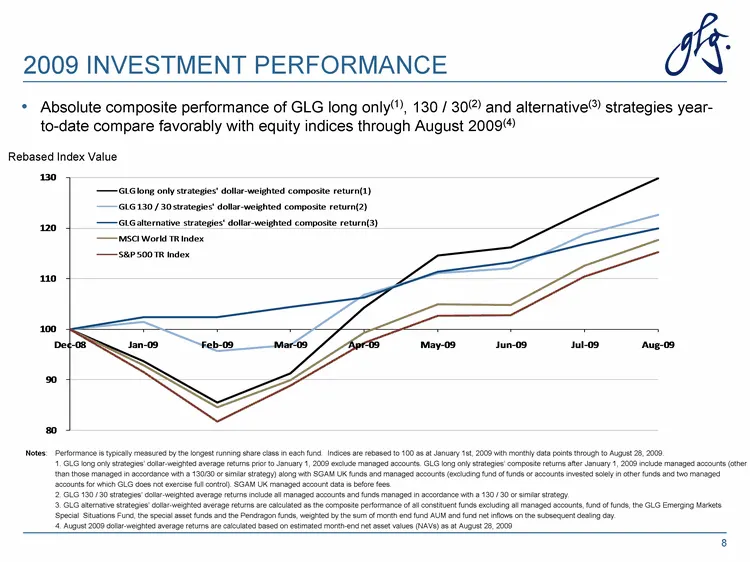
2009 INVESTMENT PERFORMANCE Absolute composite performance of GLG long only(1), 130 / 30(2) and alternative(3) strategies year- to-date compare favorably with equity indices through August 2009(4) Rebased Index Value 8 Notes: Performance is typically measured by the longest running share class in ea
Slide 9: Positive Recent Performance
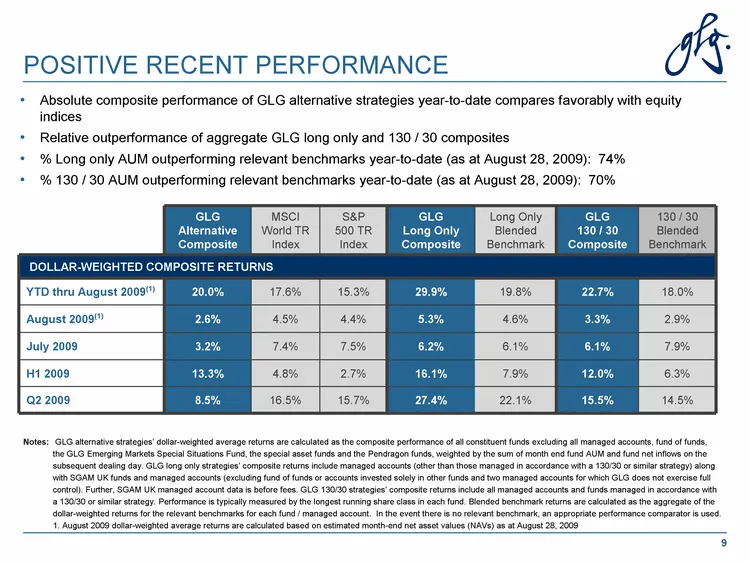
POSITIVE RECENT PERFORMANCE 9 Notes: GLG alternative strategies' dollar-weighted average returns are calculated as the composite performance of all constituent funds excluding all managed accounts, fund of funds, the GLG Emerging Markets Special Situations Fund, the special asset funds and the Pendr
Slide 10: Committed to Take Advantage of Attractive Growth Opportunities
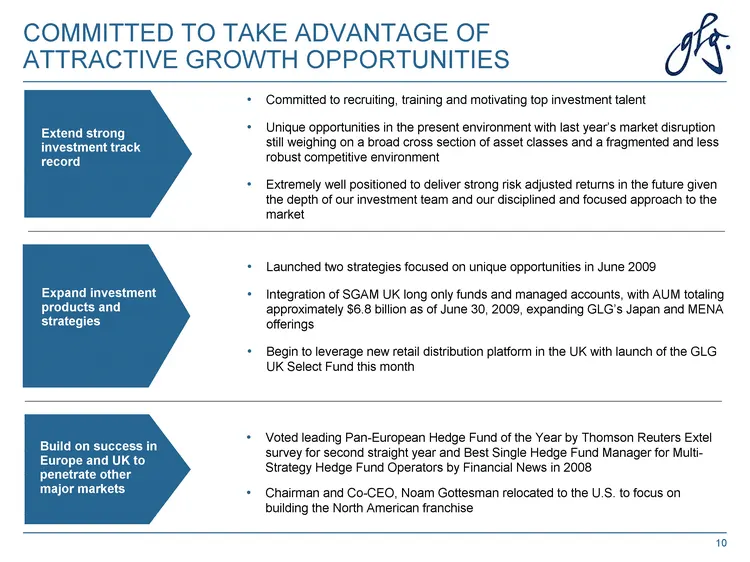
COMMITTED TO TAKE ADVANTAGE OF ATTRACTIVE GROWTH OPPORTUNITIES Committed to recruiting, training and motivating top investment talent Unique opportunities in the present environment with last year's market disruption still weighing on a broad cross section of asset classes and a fragmented and less
Slide 11: Societe Generale Asset Management UK Acquisition
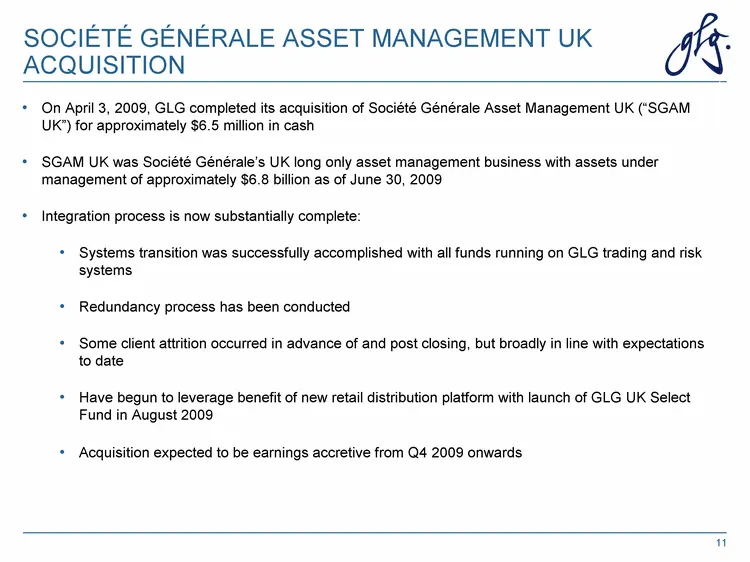
SOCIETE GENERALE ASSET MANAGEMENT UK ACQUISITION 11 On April 3, 2009, GLG completed its acquisition of Societe Generale Asset Management UK ("SGAM UK") for approximately $6.5 million in cash SGAM UK was Societe Generale's UK long only asset management business with assets under management of approxi
Slide 12: SGAM UK AUM and Flow Trends
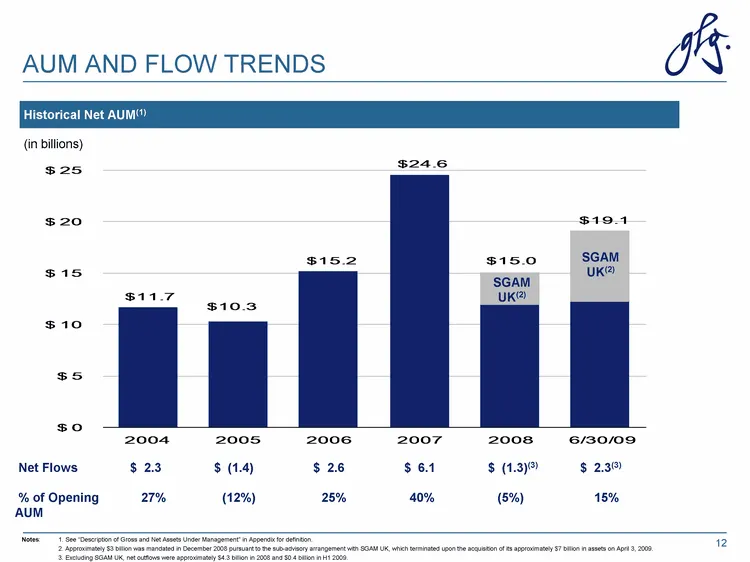
SGAM UK(2) AUM AND FLOW TRENDS Historical Net AUM(1) (in billions) Notes: 1. See "Description of Gross and Net Assets Under Management" in Appendix for definition. 2. Approximately $3 billion was mandated in December 2008 pursuant to the sub-advisory arrangement with SGAM UK, which terminated upon t
Slide 13: AUM Summary
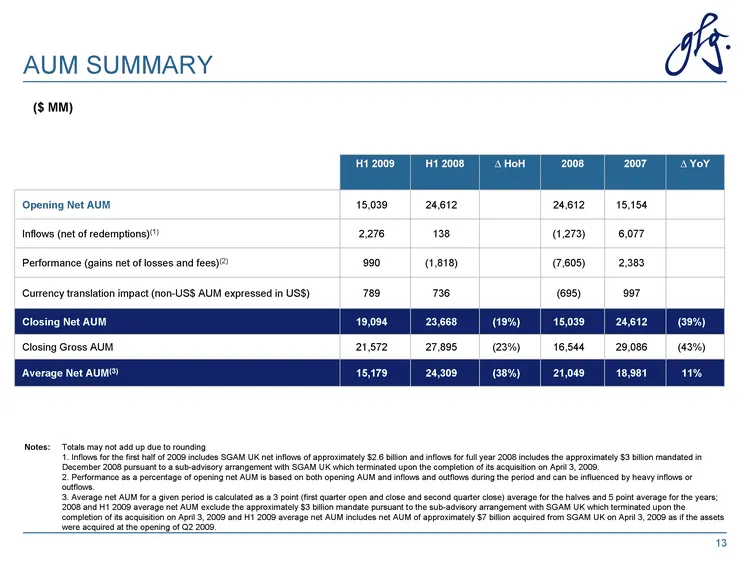
AUM SUMMARY H1 2009 H1 2008 ^ HoH 2008 2007 ^ YoY Opening Net AUM 15,039 24,612 24,612 15,154 Inflows (net of redemptions)(1) 2,276 138 (1,273) 6,077 Performance (gains net of losses and fees)(2) 990 (1,818) (7,605) 2,383 Currency translation impact (non-US$ AUM expressed in US$) 789 736 (695) 997 C
Slide 14: Financial Summary
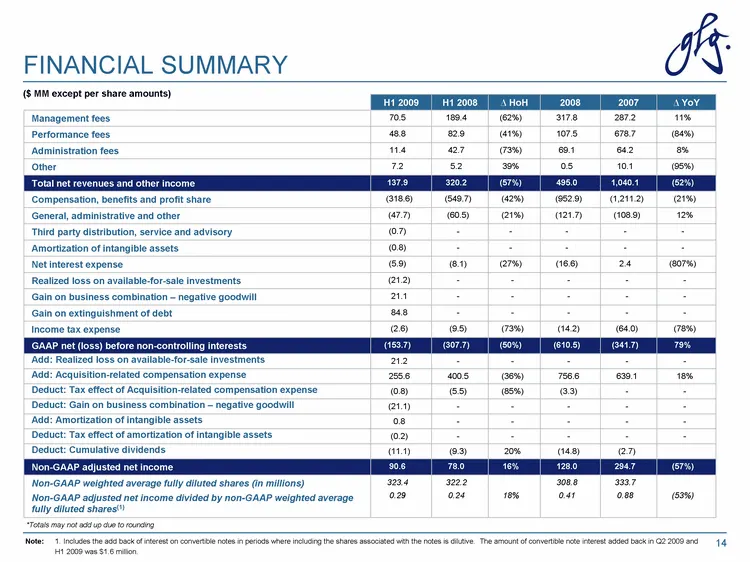
FINANCIAL SUMMARY H1 2009 H1 2008 ^ HoH 2008 2007 ^ YoY Management fees 70.5 189.4 (62%) 317.8 287.2 11% Performance fees 48.8 82.9 (41%) 107.5 678.7 (84%) Administration fees 11.4 42.7 (73%) 69.1 64.2 8% Other 7.2 5.2 39% 0.5 10.1 (95%) Total net revenues and other income 137.9 320.2 (57%) 495.0 1,
Slide 15: Key Performance Ratios
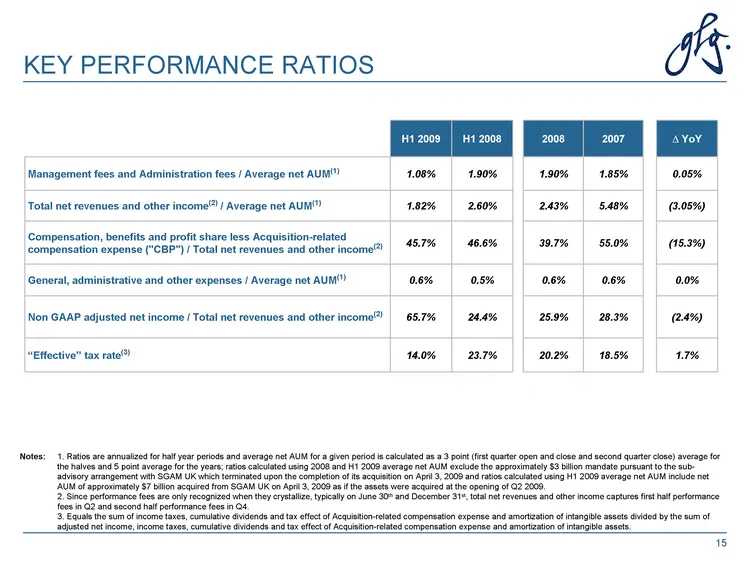
KEY PERFORMANCE RATIOS Notes: 1. Ratios are annualized for half year periods and average net AUM for a given period is calculated as a 3 point (first quarter open and close and second quarter close) average for the halves and 5 point average for the years; ratios calculated using 2008 and H1 2009 av
Slide 16: Investment Highlights
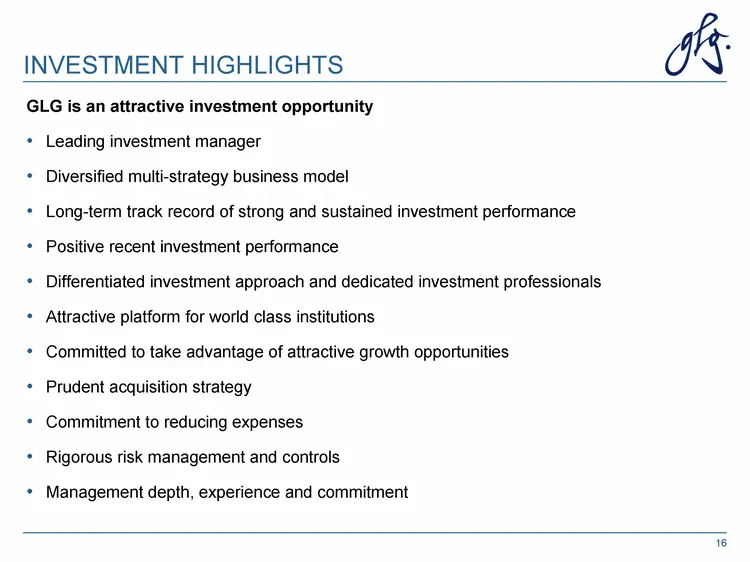
INVESTMENT HIGHLIGHTS GLG is an attractive investment opportunity Leading investment manager Diversified multi-strategy business model Long-term track record of strong and sustained investment performance Positive recent investment performance Differentiated investment approach and dedicated investm
Slide 17: Appendix
APPENDIX 4, :
Slide 18: History of GLG
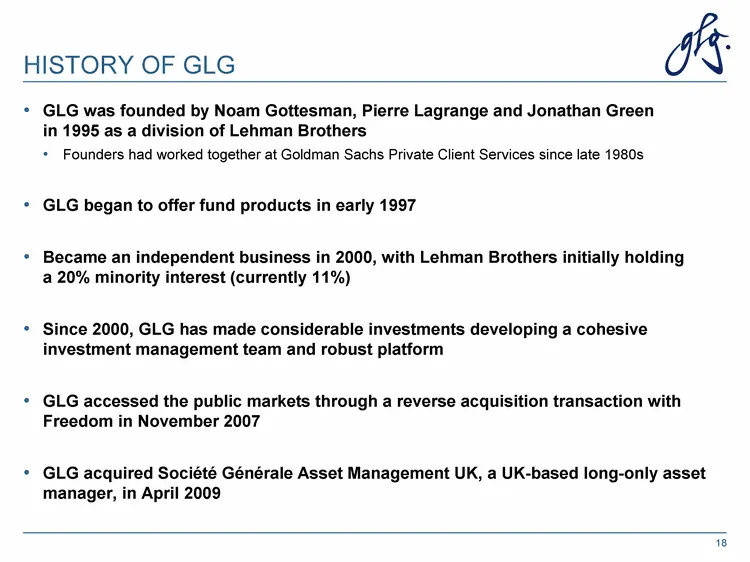
HISTORY OF GLG GLG was founded by Noam Gottesman, Pierre Lagrange and Jonathan Green in 1995 as a division of Lehman Brothers Founders had worked together at Goldman Sachs Private Client Services since late 1980s GLG began to offer fund products in early 1997 Became an independent business in 2000,
Slide 19: Foreign Currency Impact on AUM
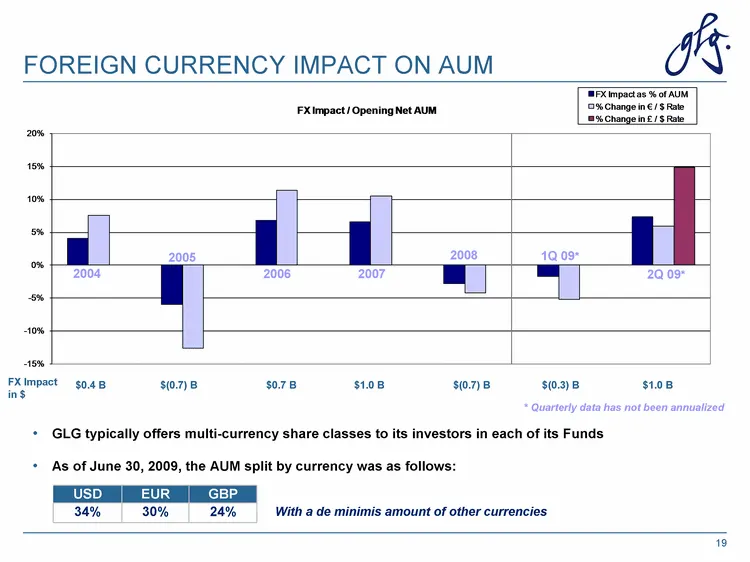
FOREIGN CURRENCY IMPACT ON AUM GLG typically offers multi-currency share classes to its investors in each of its Funds As of June 30, 2009, the AUM split by currency was as follows: 19 $0.4 B $(0.7) B $0.7 B $1.0 B $(0.7) B $(0.3) B $1.0 B 1Q 09* 2004 2005 2006 2007 2008 FX Impact in $ * Quarterly d
Slide 20: Taxes
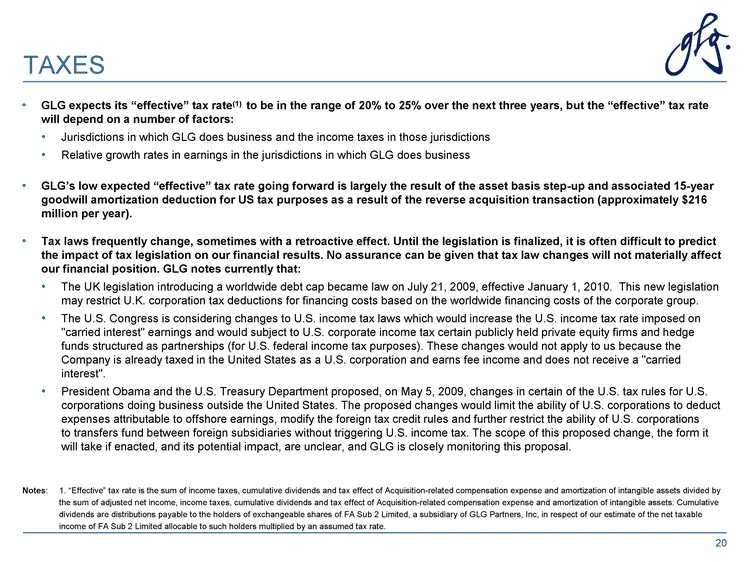
TAXES GLG expects its "effective" tax rate(1) to be in the range of 20% to 25% over the next three years, but the "effective" tax rate will depend on a number of factors: Jurisdictions in which GLG does business and the income taxes in those jurisdictions Relative growth rates in earnings in the jur
Slide 21: Summary of GLG Warrants
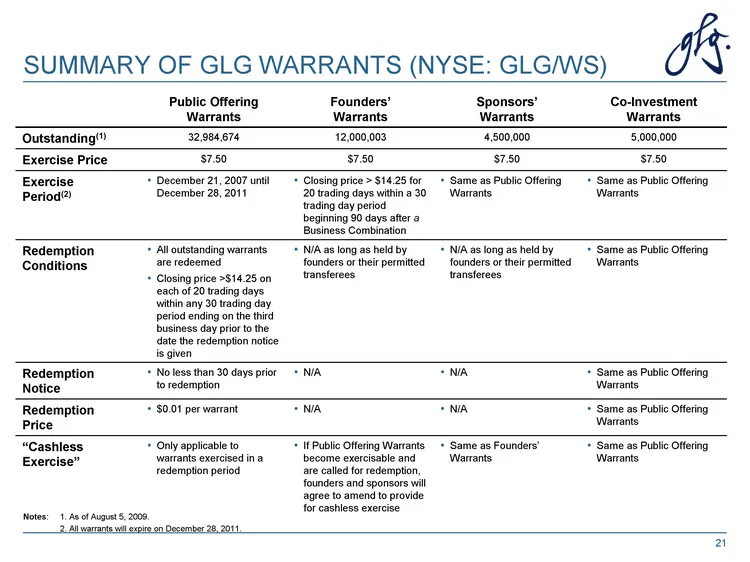
SUMMARY OF GLG WARRANTS (NYSE: GLG/WS) Public Offering Warrants Founders' Warrants Sponsors' Warrants Co-Investment Warrants Outstanding(1) 32,984,674 12,000,003 4,500,000 5,000,000 Exercise Price $7.50 $7.50 $7.50 $7.50 Exercise Period(2) December 21, 2007 until December 28, 2011 Closing price > $1
Slide 22: Share / Warrant Repurchase Program
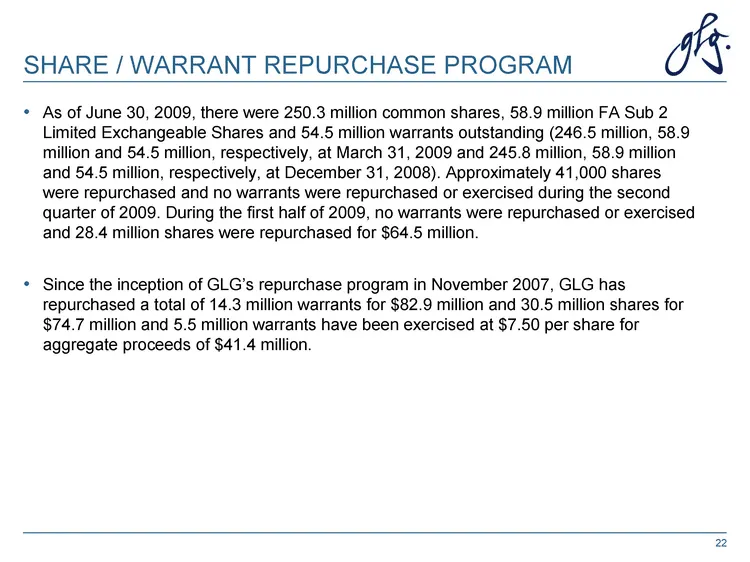
SHARE / WARRANT REPURCHASE PROGRAM As of June 30, 2009, there were 250.3 million common shares, 58.9 million FA Sub 2 Limited Exchangeable Shares and 54.5 million warrants outstanding (246.5 million, 58.9 million and 54.5 million, respectively, at March 31, 2009 and 245.8 million, 58.9 million and 5
Slide 23: Market Capitalization
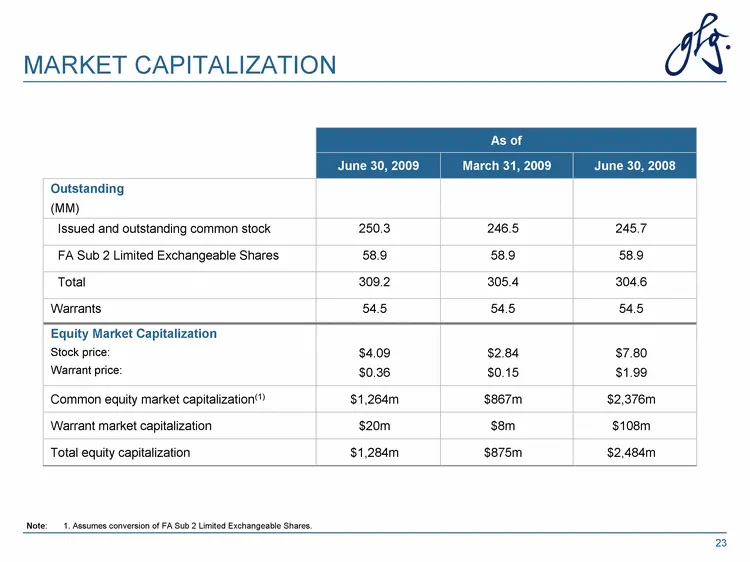
MARKET CAPITALIZATION As of As of As of June 30, 2009 March 31, 2009 June 30, 2008 Outstanding (MM) Issued and outstanding common stock 250.3 246.5 245.7 FA Sub 2 Limited Exchangeable Shares 58.9 58.9 58.9 Total 309.2 305.4 304.6 Warrants 54.5 54.5 54.5 Equity Market Capitalization Stock price: Warr
Slide 24: Composition of Assets Under Management
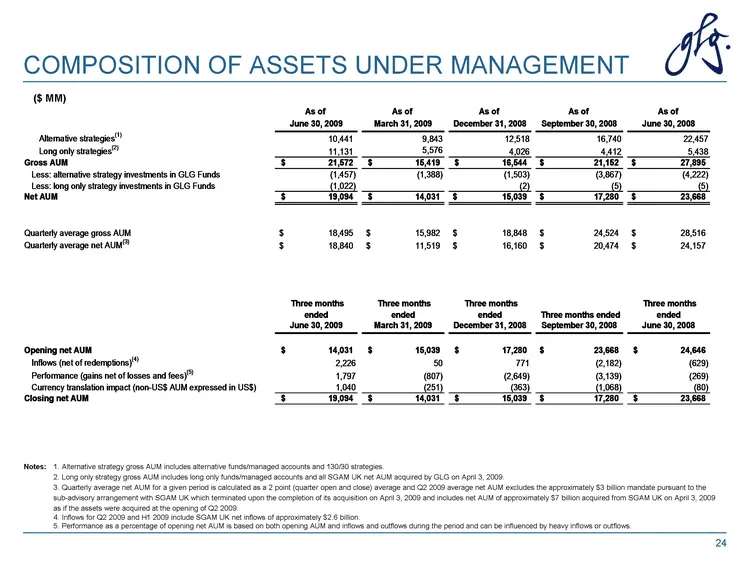
COMPOSITION OF ASSETS UNDER MANAGEMENT 24 Notes: 1. Alternative strategy gross AUM includes alternative funds/managed accounts and 130/30 strategies. 2. Long only strategy gross AUM includes long only funds/managed accounts and all SGAM UK net AUM acquired by GLG on April 3, 2009. 3. Quarterly avera
Slide 25: Description of Gross and Net Assets Under Management
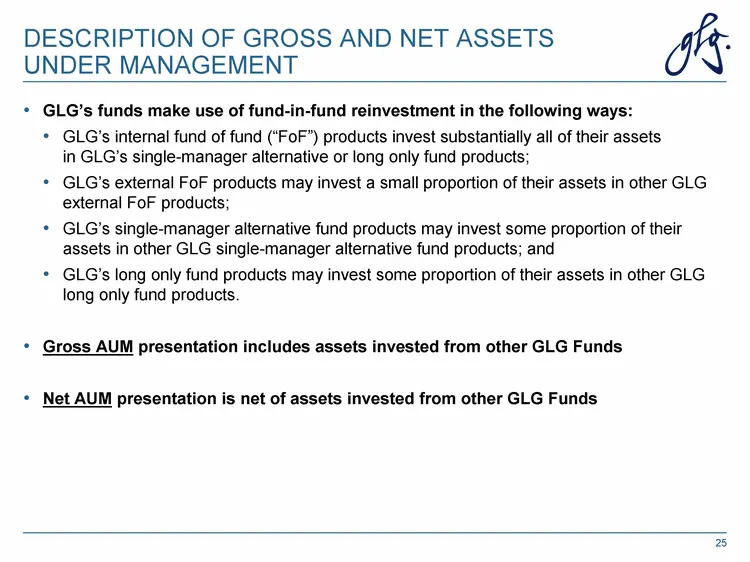
DESCRIPTION OF GROSS AND NET ASSETS UNDER MANAGEMENT GLG's funds make use of fund-in-fund reinvestment in the following ways: GLG's internal fund of fund ("FoF") products invest substantially all of their assets in GLG's single-manager alternative or long only fund products; GLG's external FoF produ
Slide 26: Description of Non-GAAP Weighted Average Fully Diluted Share Count
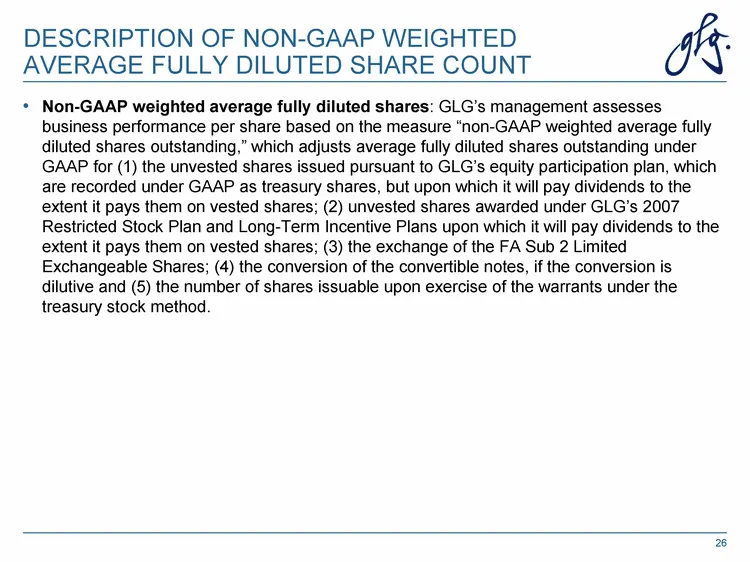
DESCRIPTION OF NON-GAAP WEIGHTED AVERAGE FULLY DILUTED SHARE COUNT 26 Non-GAAP weighted average fully diluted shares: GLG's management assesses business performance per share based on the measure "non-GAAP weighted average fully diluted shares outstanding," which adjusts average fully diluted shares
Slide 27: Reconciliation of Non-GAAP Weighted Average Fully Diluted Shares
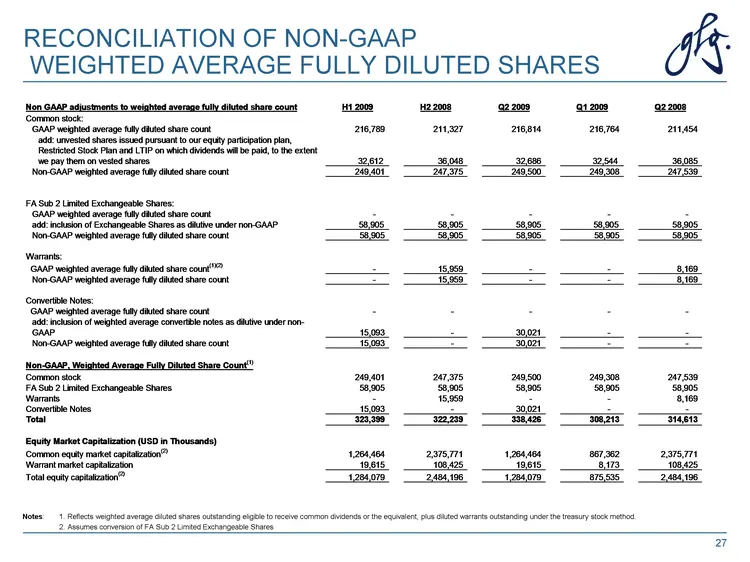
RECONCILIATION OF NON-GAAP WEIGHTED AVERAGE FULLY DILUTED SHARES 27 Notes: 1. Reflects weighted average diluted shares outstanding eligible to receive common dividends or the equivalent, plus diluted warrants outstanding under the treasury stock method. 2. Assumes conversion of FA Sub 2 Limited Exch
Slide 28: Limited Partner Profit Share Arrangement
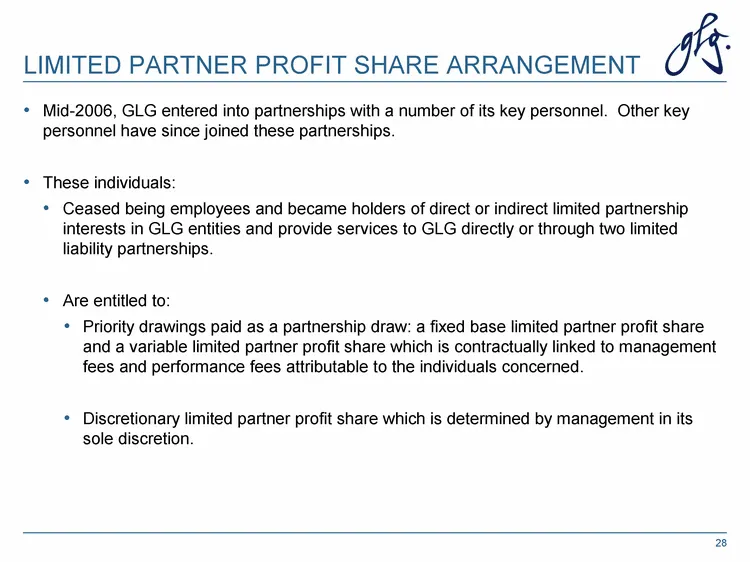
LIMITED PARTNER PROFIT SHARE ARRANGEMENT Mid-2006, GLG entered into partnerships with a number of its key personnel. Other key personnel have since joined these partnerships. These individuals: Ceased being employees and became holders of direct or indirect limited partnership interests in GLG entit
Slide 29: Acquisition-Related Compensation Expense
ACQUISITION-RELATED COMPENSATION EXPENSE Following the reverse acquisition transaction, and as required by SFAS 123(R), GLG's GAAP compensation, benefits and profit share expense reflects share-based and other compensation recognized in respect of: the equity participation plan (including with respe
Slide 30: Compensation, Benefits and Profit Share
COMPENSATION, BENEFITS AND PROFIT SHARE Under GAAP, there is a charge to compensation expense for Acquisition-related compensation expense based on certain service conditions. However, GLG's management believes that this charge does not reflect its ongoing core business operations and compensation e
Slide 31: Reconciliation of Non-GAAP CBP and Non-GAAP Total Expenses
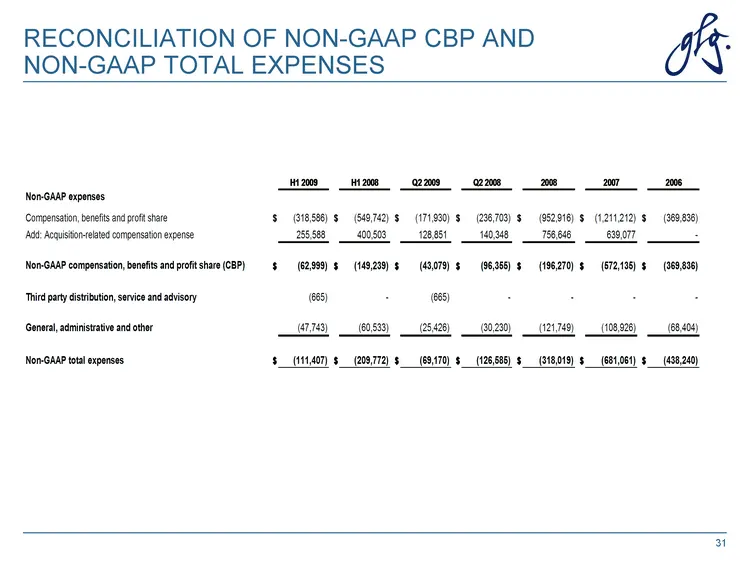
RECONCILIATION OF NON-GAAP CBP AND NON-GAAP TOTAL EXPENSES 31
Slide 32: Adjusted Net Income
ADJUSTED NET INCOME Non-GAAP Adjusted Net Income: GLG's management assesses the underlying performance of its business based on the measure "adjusted net income," which adjusts net income before non-controlling interests for (1) the Acquisition-related compensation expense, (2) to the extent that GL
Slide 33
Source: SEC EDGAR · 8-K filed Sep 16, 2009
More decks from GLG Partners Inc
 Q2 2010 Earnings Presentation37 slides · Aug 9, 2010
 Q1 2010 Earnings Presentation37 slides · May 26, 2010
 Merger or Acquisition (May 2010)43 slides · May 17, 2010
 Q1 2010 Earnings Presentation36 slides · May 6, 2010
 FY2009 Earnings Presentation36 slides · Feb 18, 2010
 Q3 2009 Earnings Presentation35 slides · Nov 5, 2009