Ihs Markit — 2020 Barclays Americas Select Franchise Conference
28 slides from Ihs Markit's conference presentation, May 12, 2020

Slide 1: IHS Markit
IHS Markit A global leader in critical information, analytics, and solutions May 2020 © 2020 IHS MarkitTM. All Rights Reserved. © 2020 IHS MarkitTM. All Rights Reserved.
Slide 2: Forward-looking statements
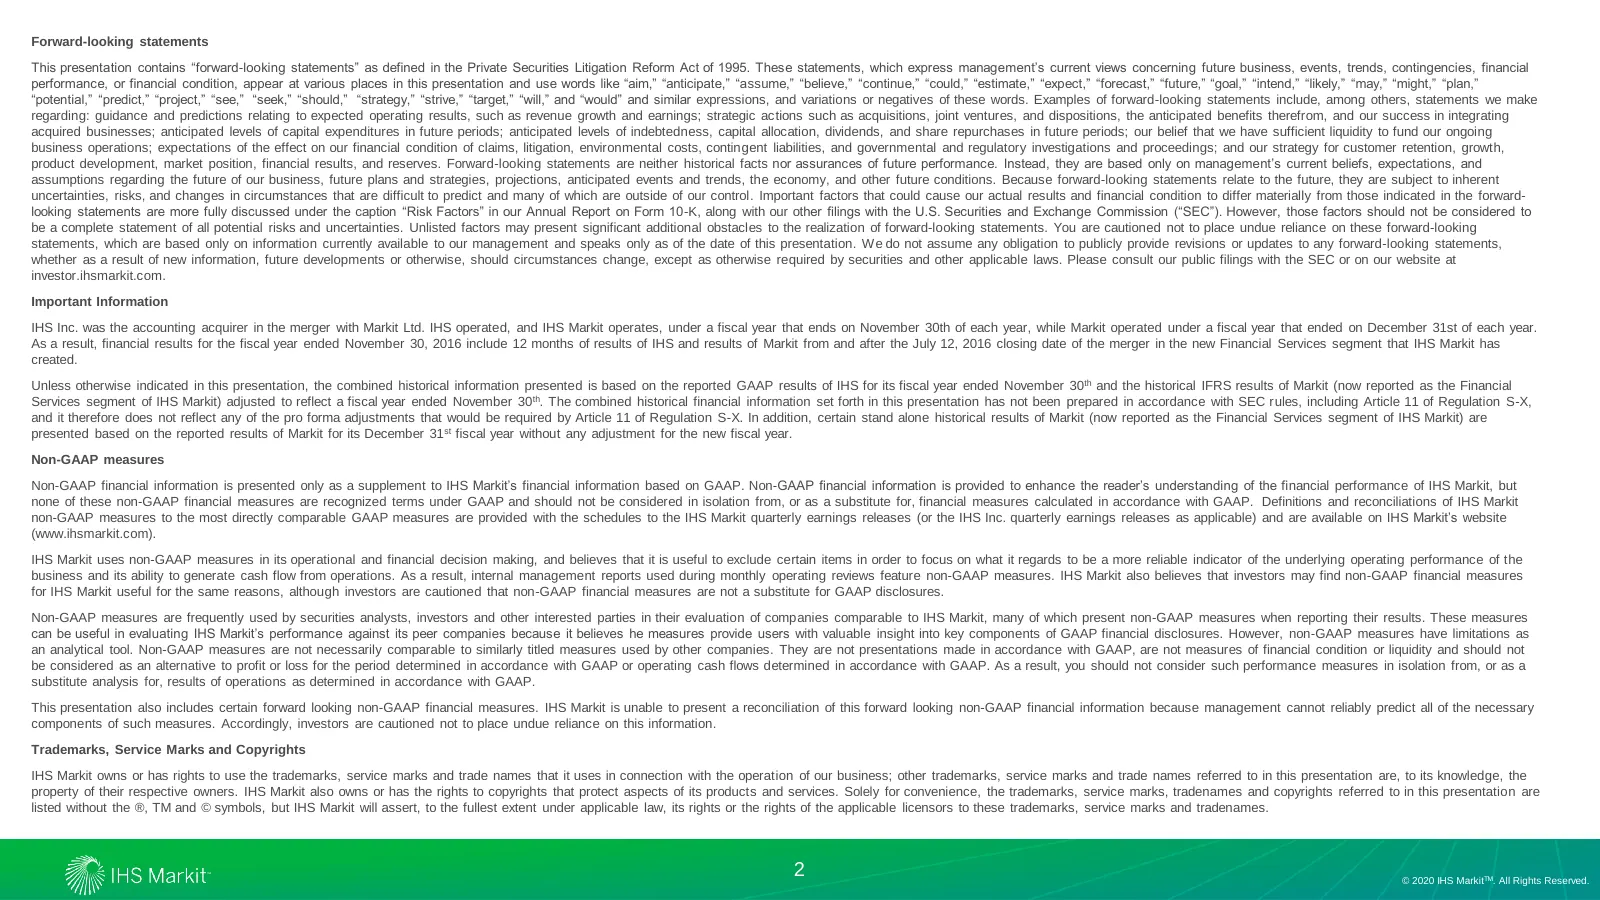
Forward-looking statements This presentation contains “forward-looking statements” as defined in the Private Securities Litigation Reform Act of 1995. These statements, which express management’s current views concerning future business, events, trends, contingencies, financial performance, or finan
Slide 3: We created the global leader in information, analytics and solutions
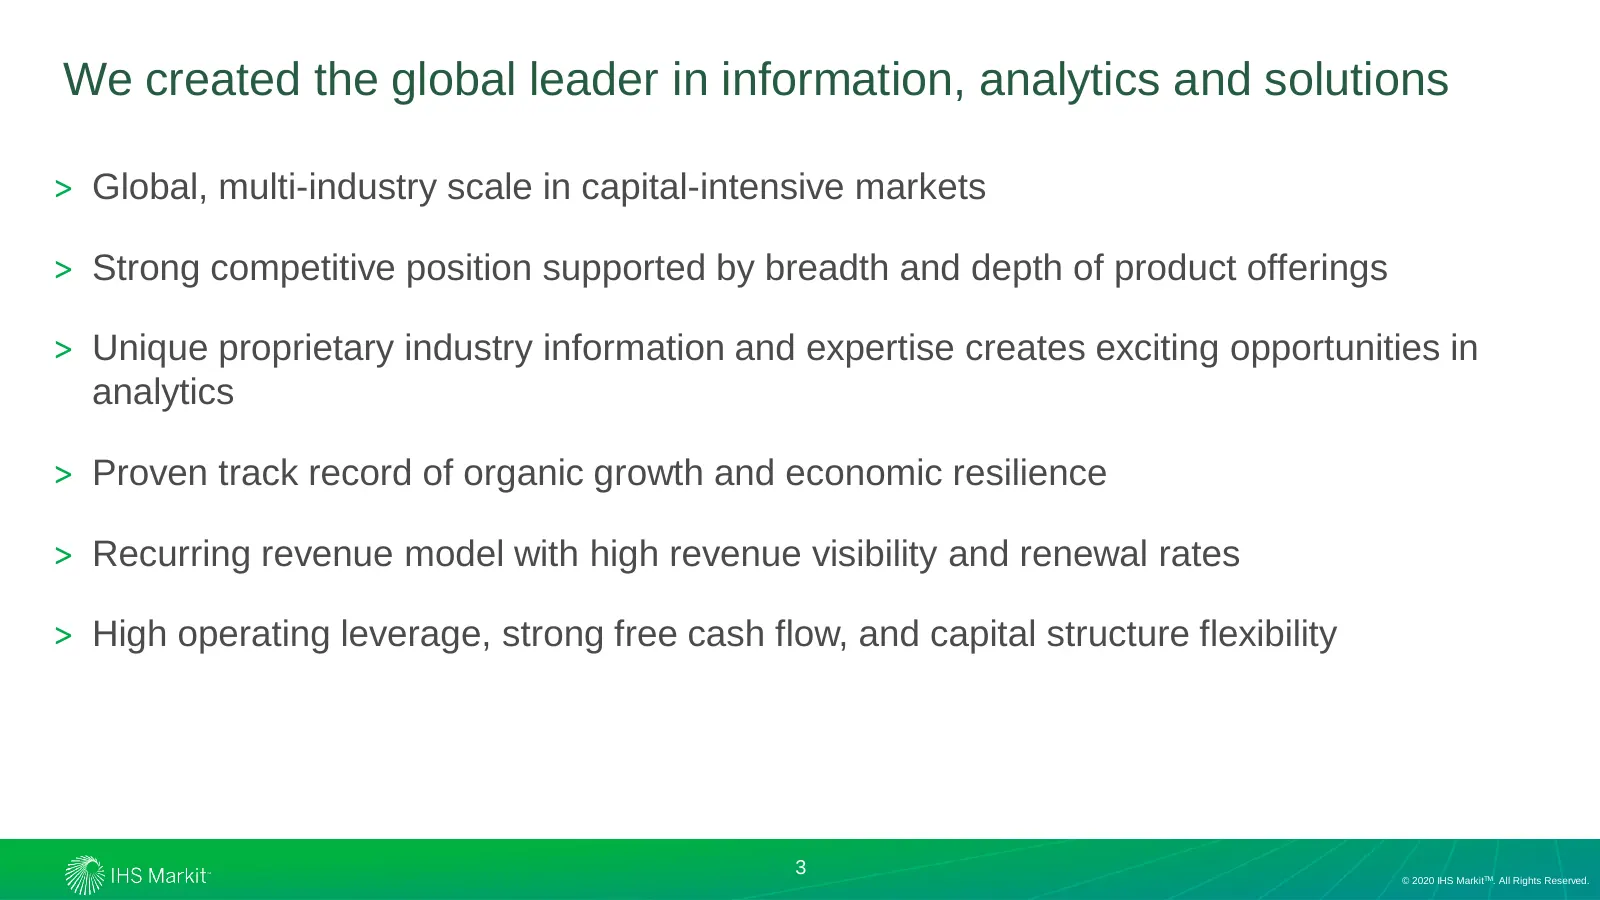
We created the global leader in information, analytics and solutions > Global, multi-industry scale in capital-intensive markets > Strong competitive position supported by breadth and depth of product offerings > Unique proprietary industry information and expertise creates exciting opportunities in
Slide 4: Consistently achieving our long-term financial goals should produce strong shareholder returns
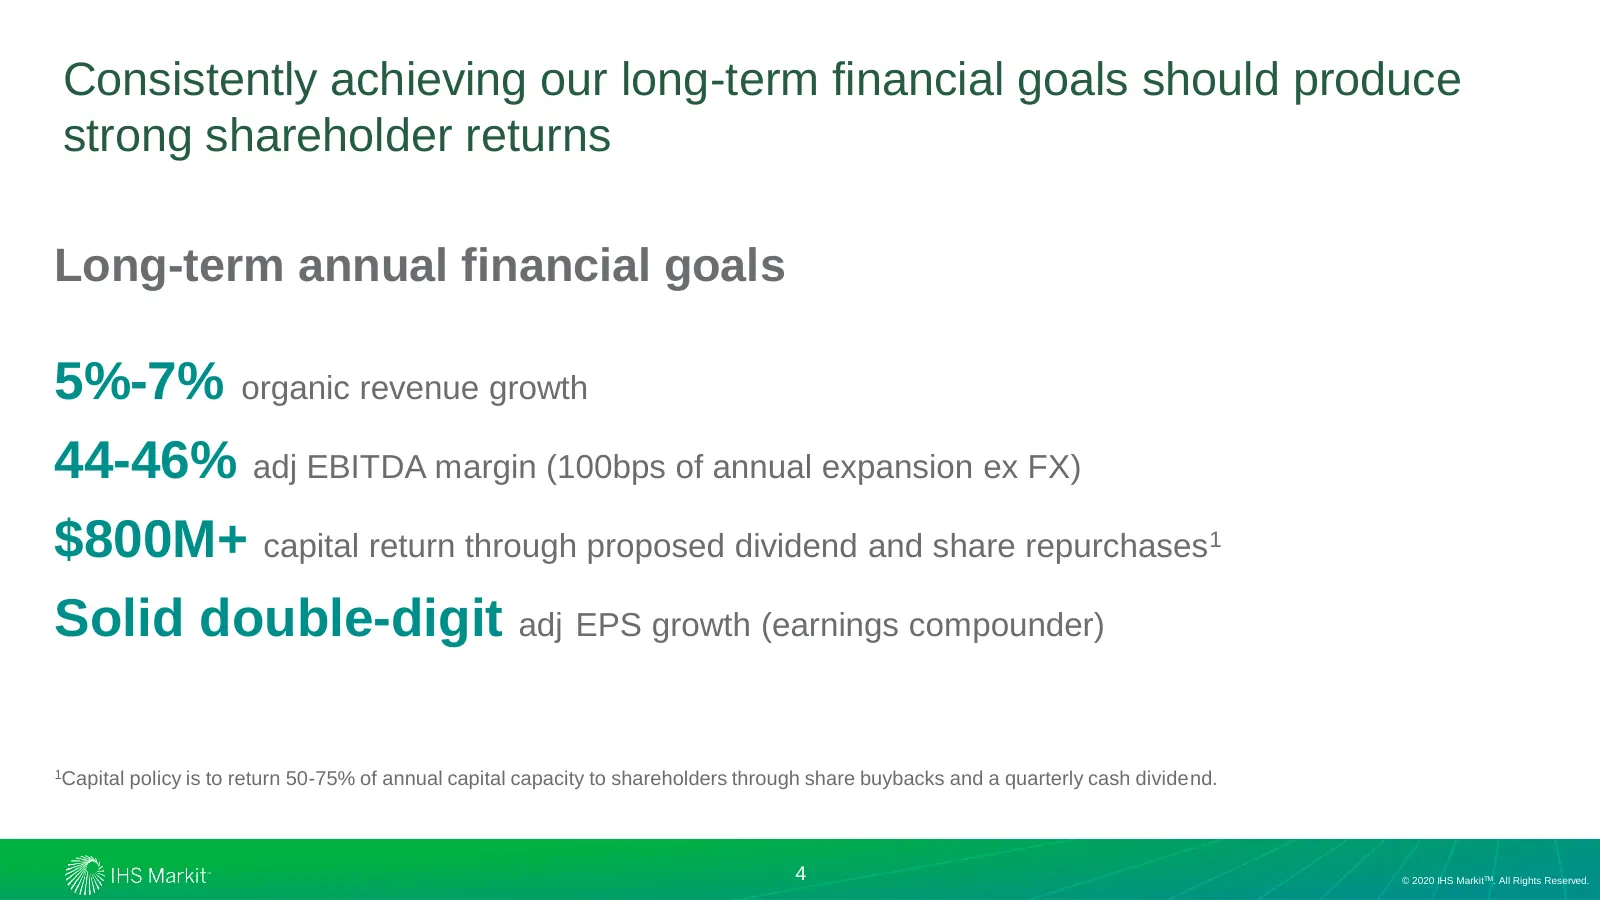
Consistently achieving our long-term financial goals should produce strong shareholder returns Long-term annual financial goals 5%-7% organic revenue growth 44-46% adj EBITDA margin (100bps of annual expansion ex FX) $800M+ capital return through proposed dividend and share repurchases1 Solid double
Slide 5: Our diversified portfolio of leading assets reflects multiple areas of strong performance
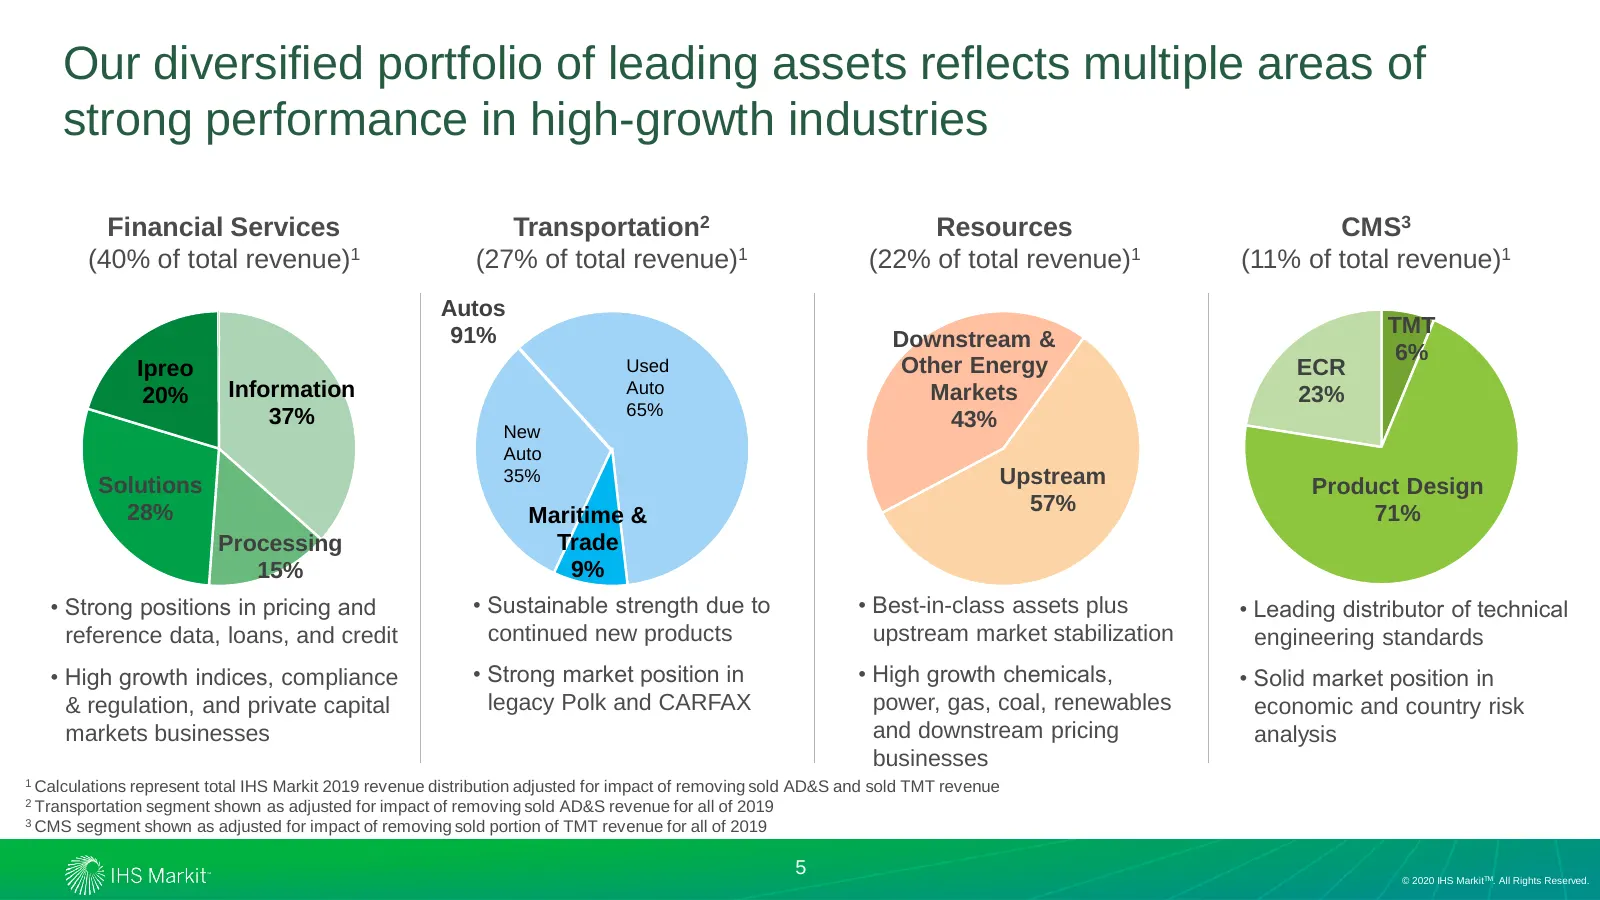
Our diversified portfolio of leading assets reflects multiple areas of strong performance in high-growth industries Financial Services Transportation2 Resources CMS3 (40% of total revenue)1 (27% of total revenue)1 (22% of total revenue)1 (11% of total revenue)1 Autos 91% TMT Downstream & 6% Ipreo Us
Slide 6: We have large proprietary databases in our verticals and workflows
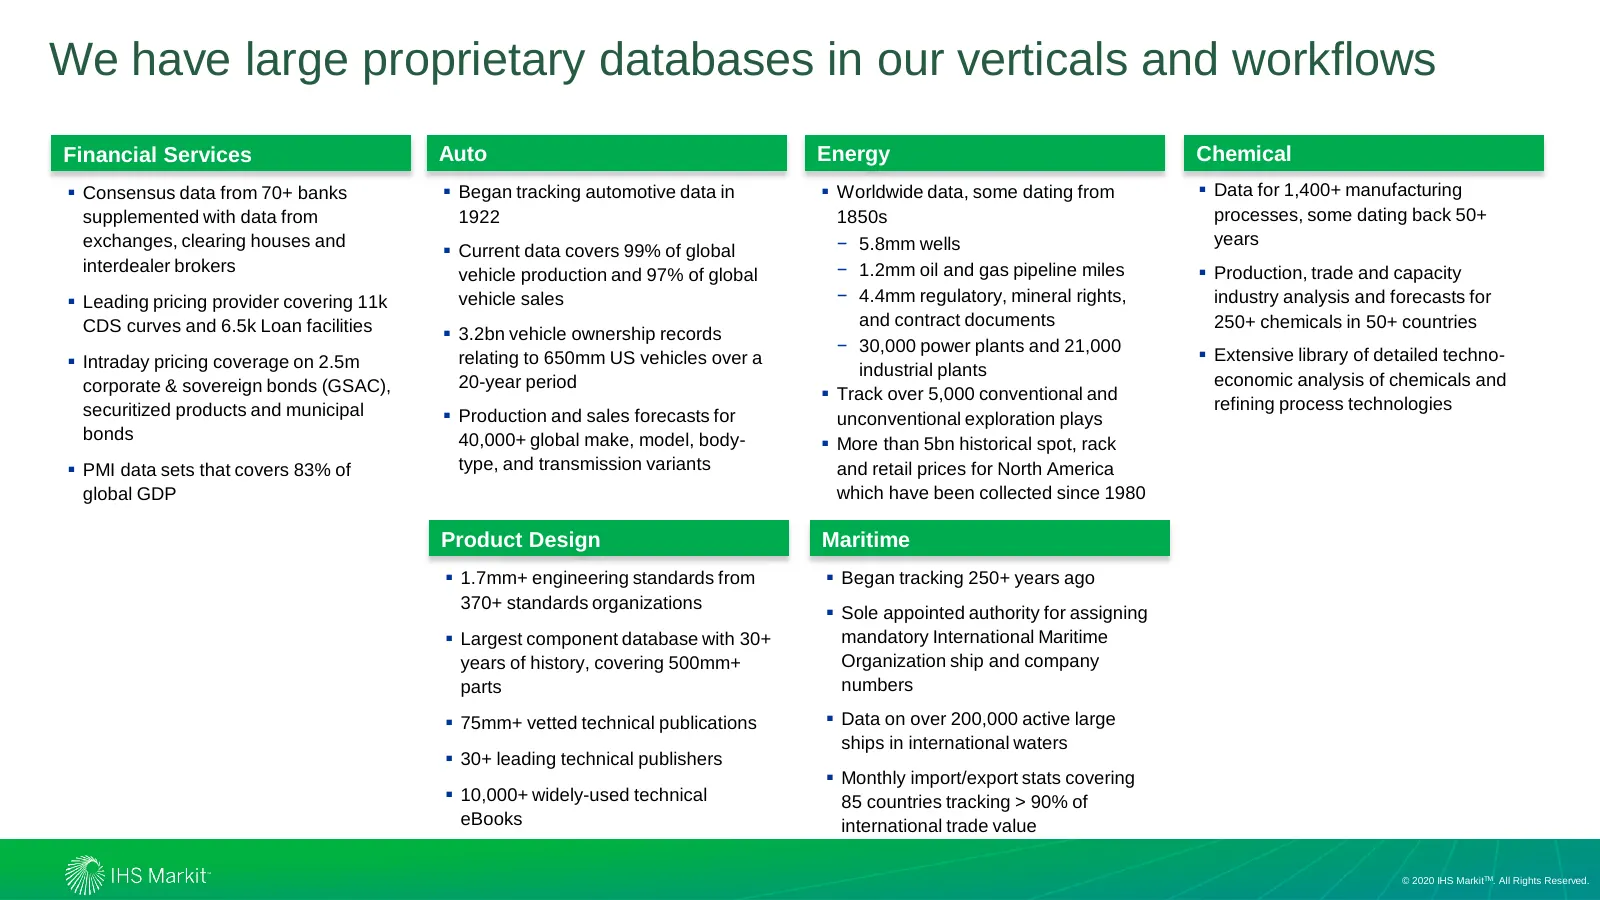
We have large proprietary databases in our verticals and workflows Financial Services Auto Energy Chemical ▪ Consensus data from 70+ banks ▪ Began tracking automotive data in ▪ Worldwide data, some dating from ▪ Data for 1,400+ manufacturing supplemented with data from 1922 1850s processes, some dat
Slide 7: Our information and insights help clients answer critical questions
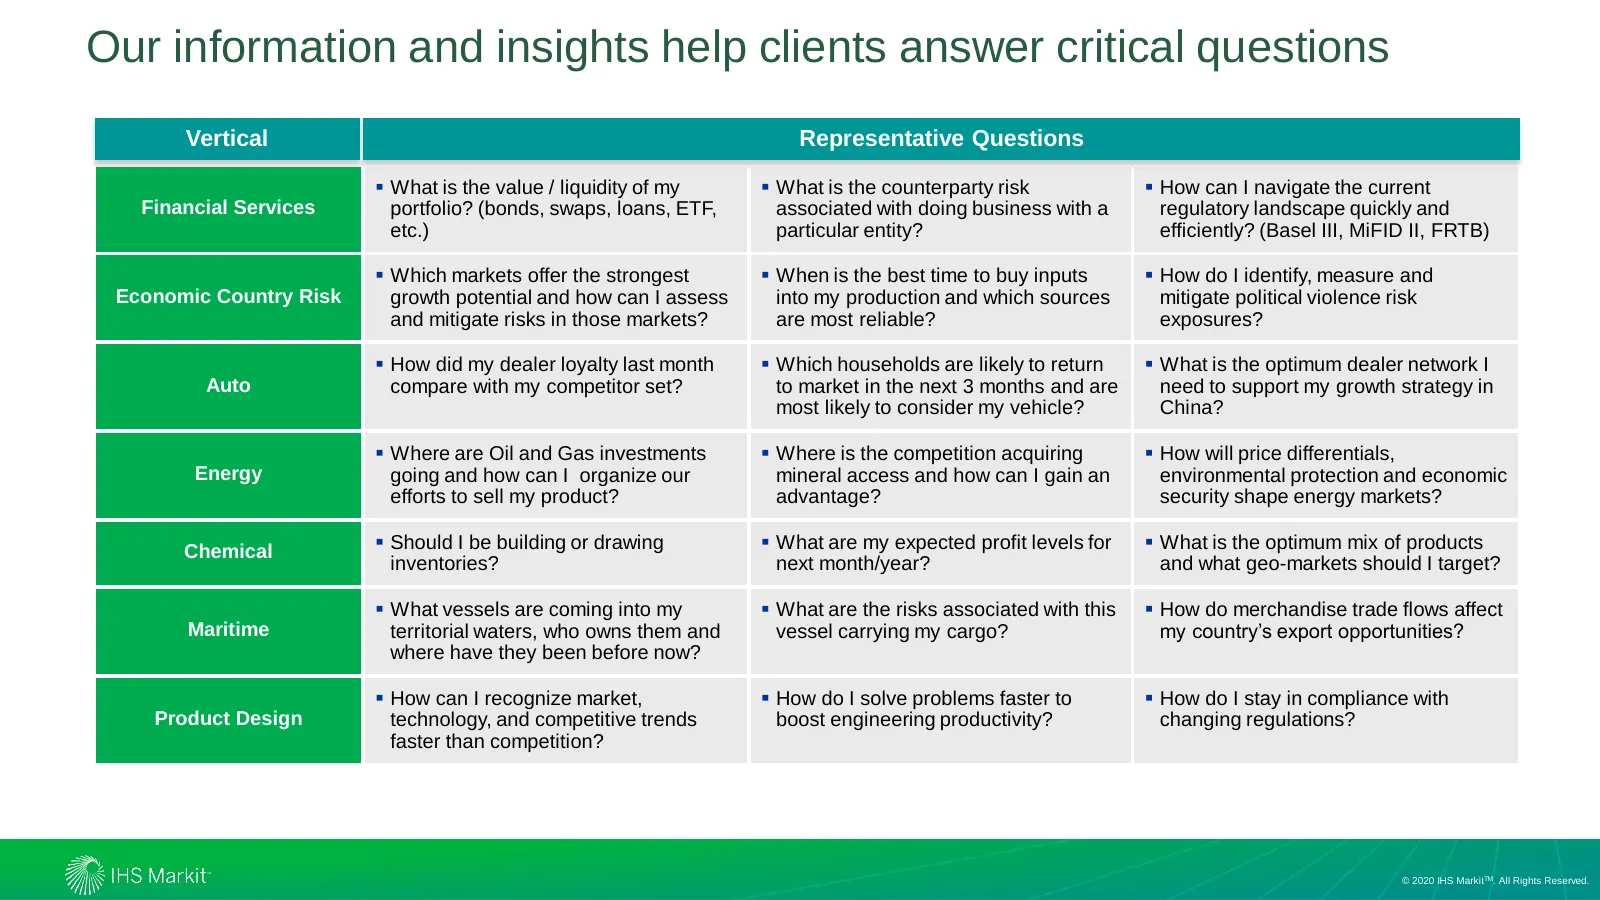
Our information and insights help clients answer critical questions Vertical Representative Questions ▪ What is the value / liquidity of my ▪ What is the counterparty risk ▪ How can I navigate the current Financial Services portfolio? (bonds, swaps, loans, ETF, associated with doing business with a
Slide 8: More than 5,000 analysts, data scientists, financial experts and industry specialists worldwide
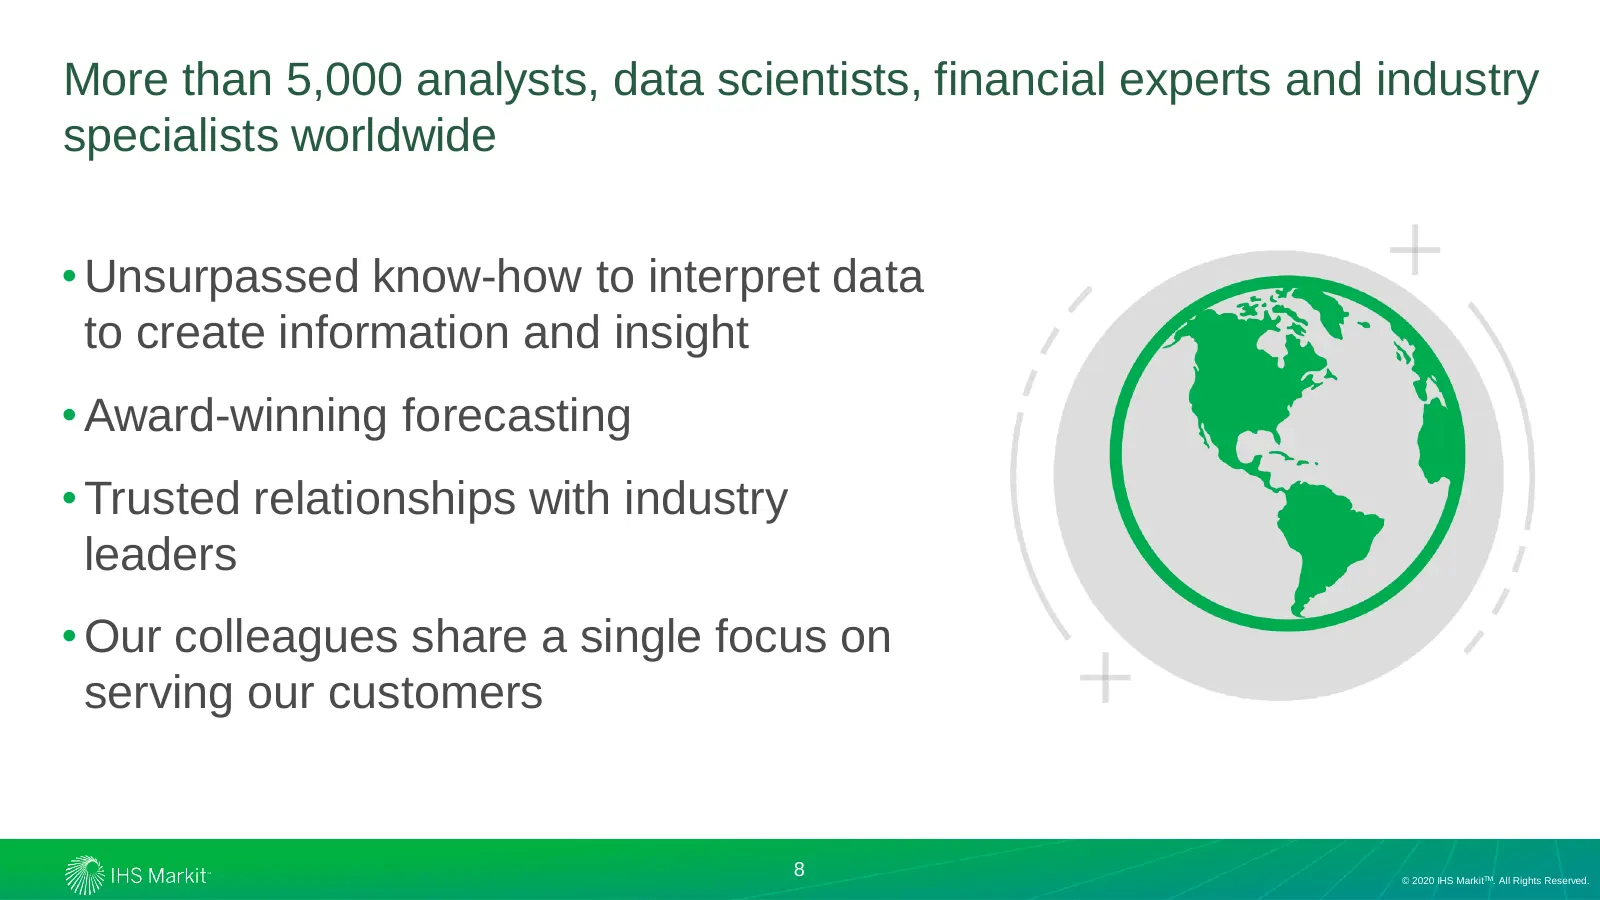
More than 5,000 analysts, data scientists, financial experts and industry specialists worldwide • Unsurpassed know-how to interpret data to create information and insight • Award-winning forecasting • Trusted relationships with industry leaders • Our colleagues share a single focus on serving our cu
Slide 9: Broad and deep customer relationships in our verticals
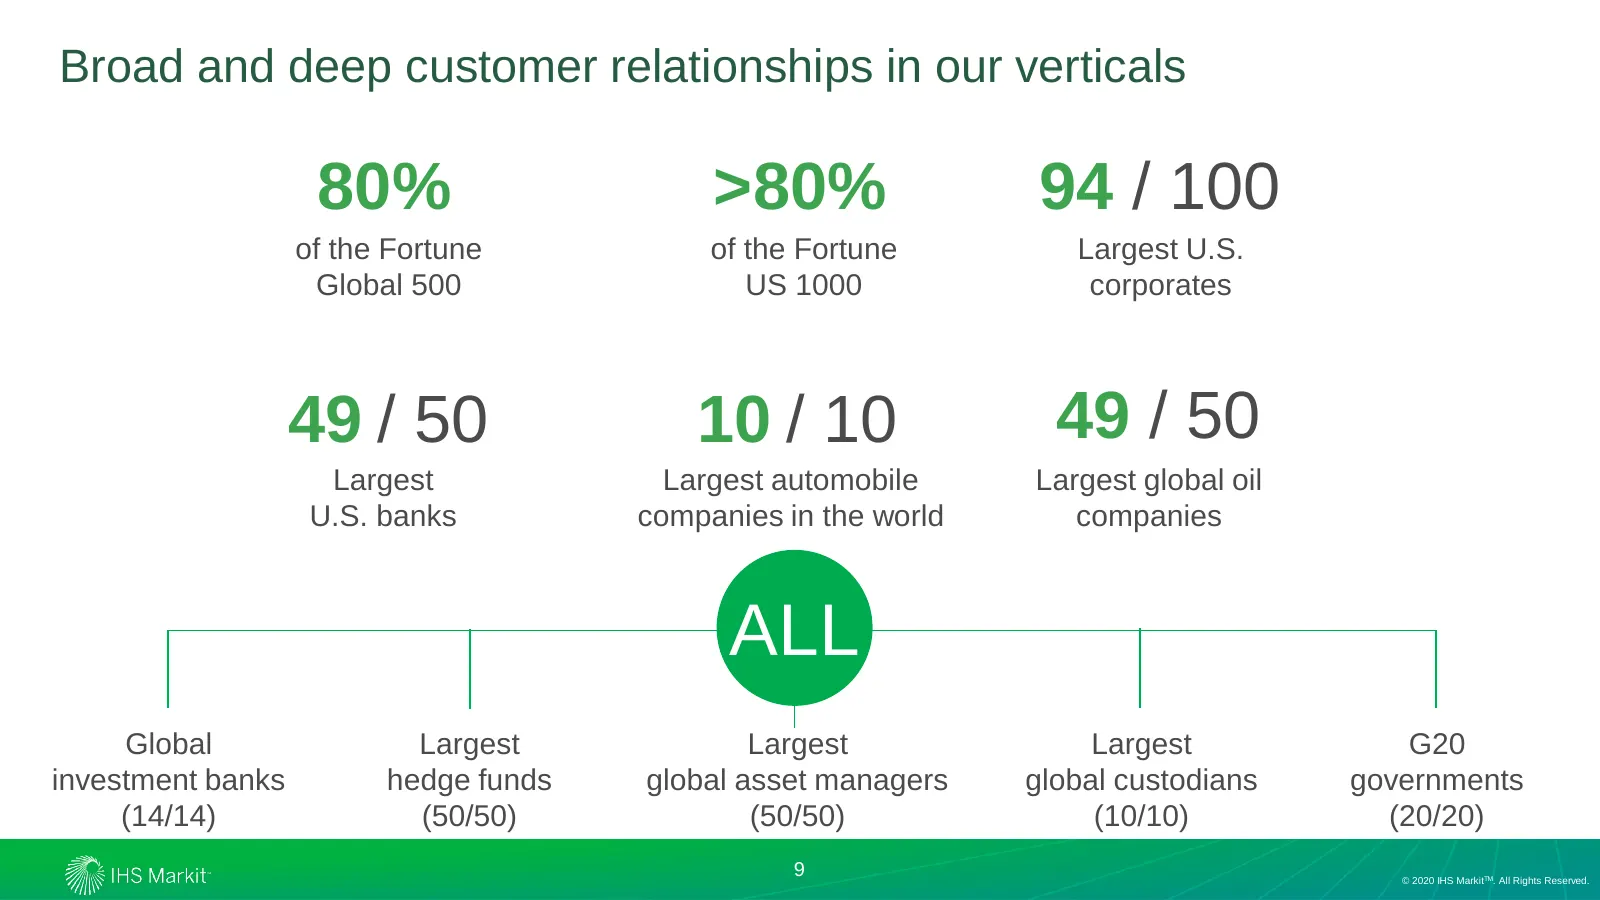
Broad and deep customer relationships in our verticals 80% >80% 94 / 100 of the Fortune of the Fortune Largest U.S. Global 500 US 1000 corporates 49 / 50 10 / 10 49 / 50 Largest Largest automobile Largest global oil U.S. banks companies in the world companies ALL Global Largest Largest Largest G20 i

Slide 10: Our path forward
Our path forward © 2020 IHS MarkitTM. All Rights Reserved. 10 © 2020 IHS MarkitTM. All Rights Reserved.
Slide 11: Our strategy will aid us in consistently achieving our long-term financial goals
Our strategy will aid us in consistently achieving our long-term financial goals • The information services industry is very attractive globally • We have leading assets, talent and competitive positioning in large growing global markets • Advanced analytics and data lake present significant opportu
Slide 12: Information Services is poised to grow at 5.1% vs 2.8% GDP growth
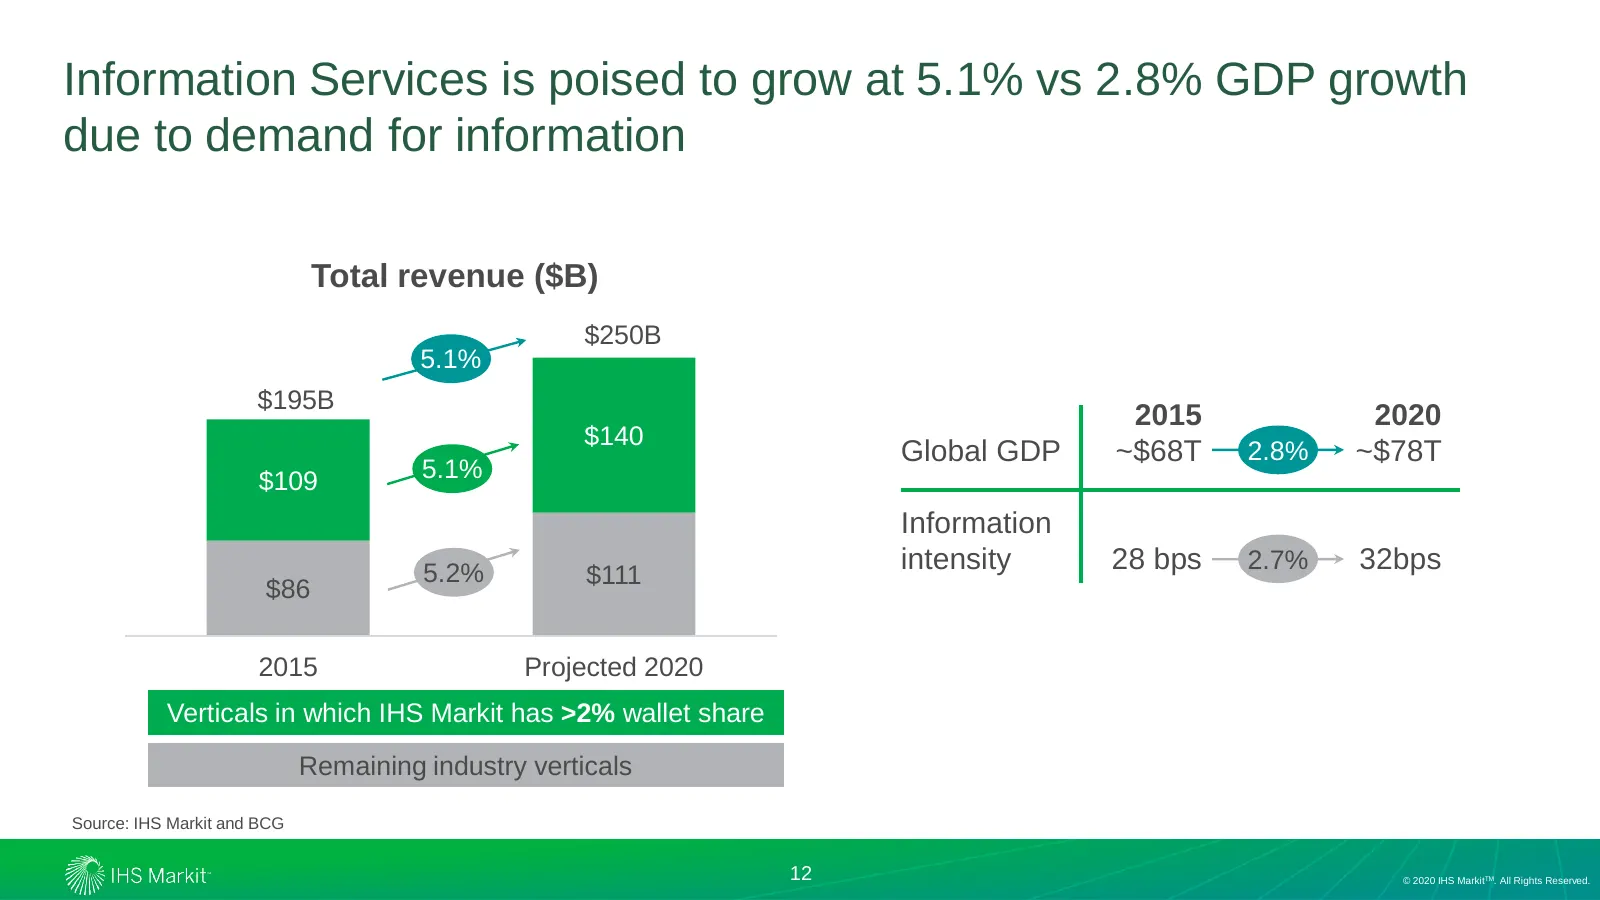
Information Services is poised to grow at 5.1% vs 2.8% GDP growth due to demand for information Total revenue ($B) $250B 5.1% $195B 2015 2020 $140 Global GDP ~$68T 2.8% ~$78T $109 5.1% Information 5.2% $111 intensity 28 bps 2.7% 32bps $86 2015 Projected 2020 Verticals in which IHS Markit has >2% wal
Slide 13: We have a strong foundation that positions us well to compete over the long term
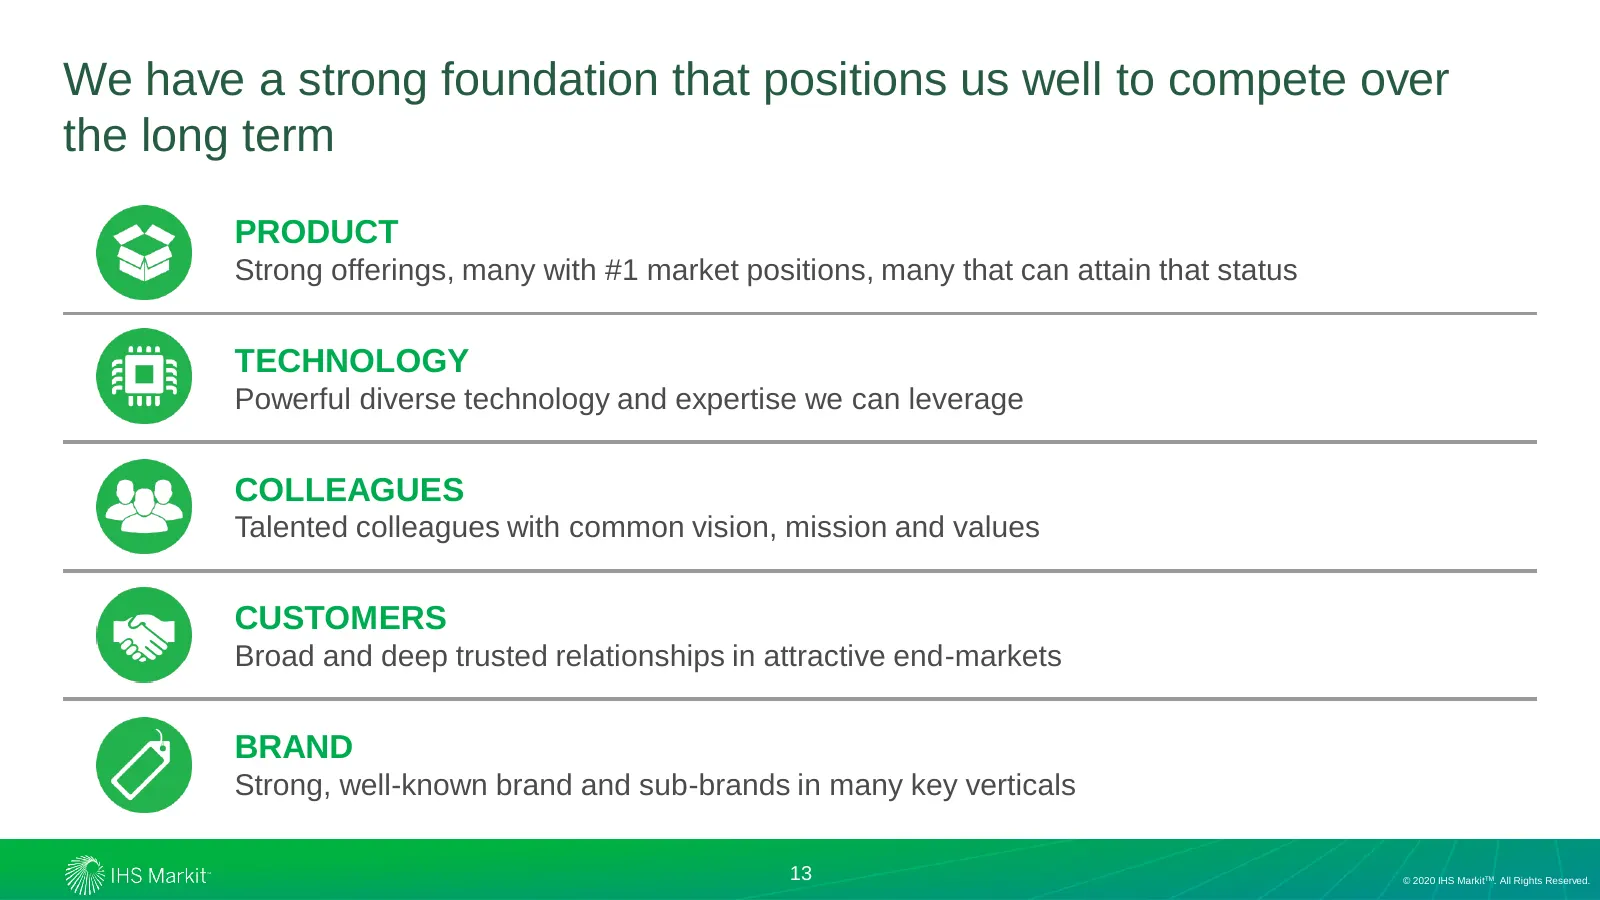
We have a strong foundation that positions us well to compete over the long term PRODUCT Strong offerings, many with #1 market positions, many that can attain that status TECHNOLOGY Powerful diverse technology and expertise we can leverage COLLEAGUES Talented colleagues with common vision, mission a
Slide 14: We will make targeted investments across four key areas
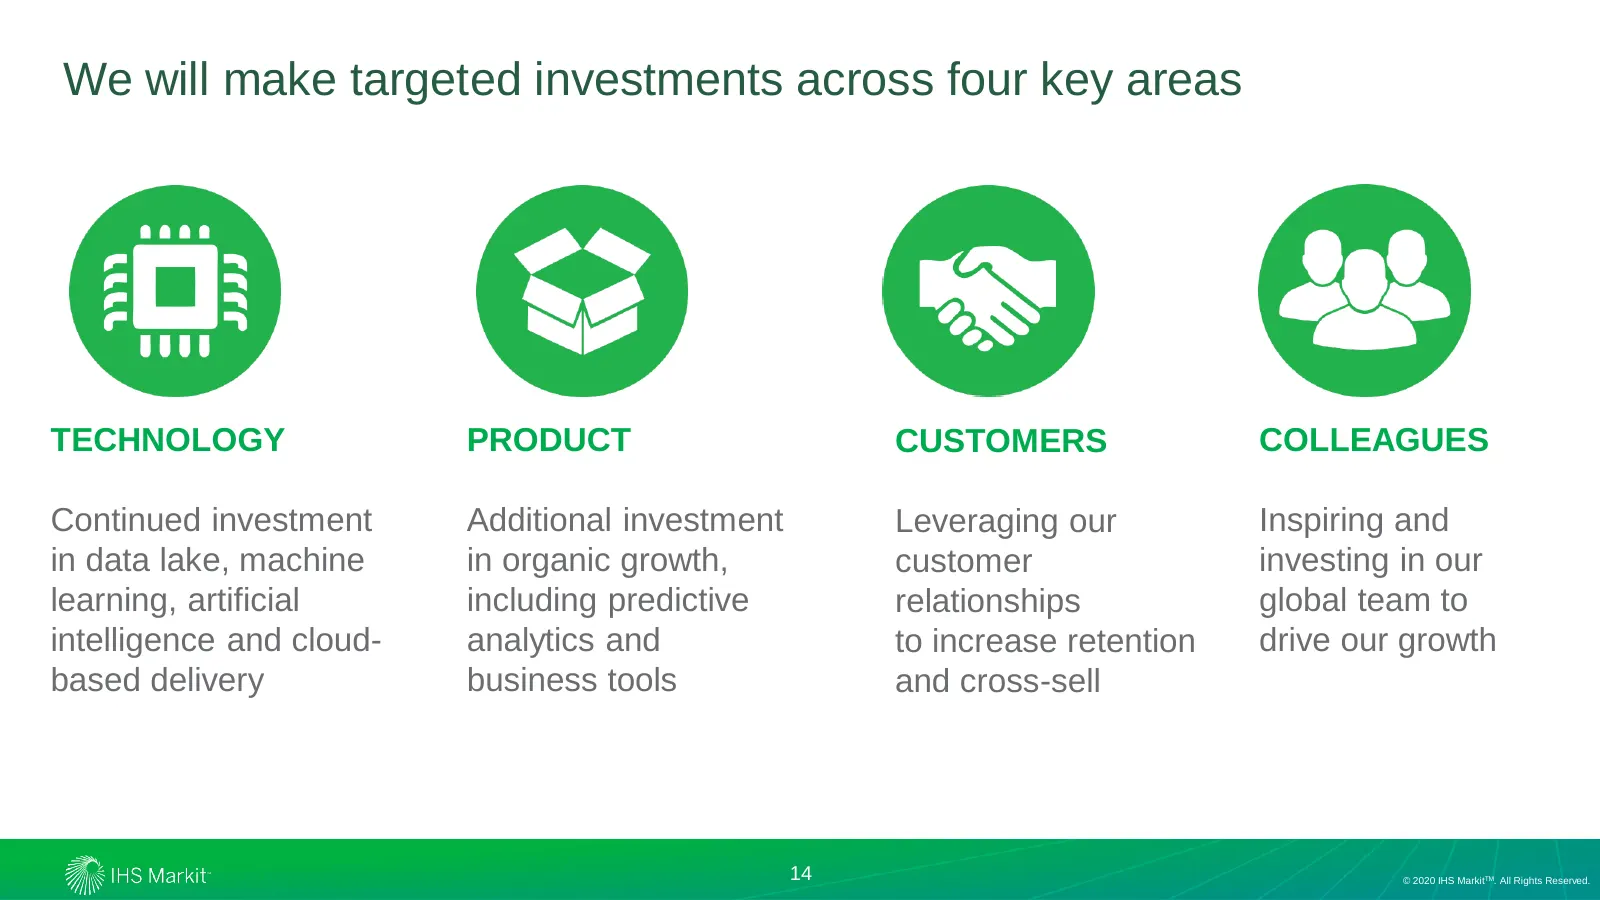
We will make targeted investments across four key areas TECHNOLOGY PRODUCT CUSTOMERS COLLEAGUES Continued investment Additional investment Leveraging our Inspiring and in data lake, machine in organic growth, customer investing in our learning, artificial including predictive relationships global te
Slide 15: Advanced analytics present a significant opportunity for IHS Markit
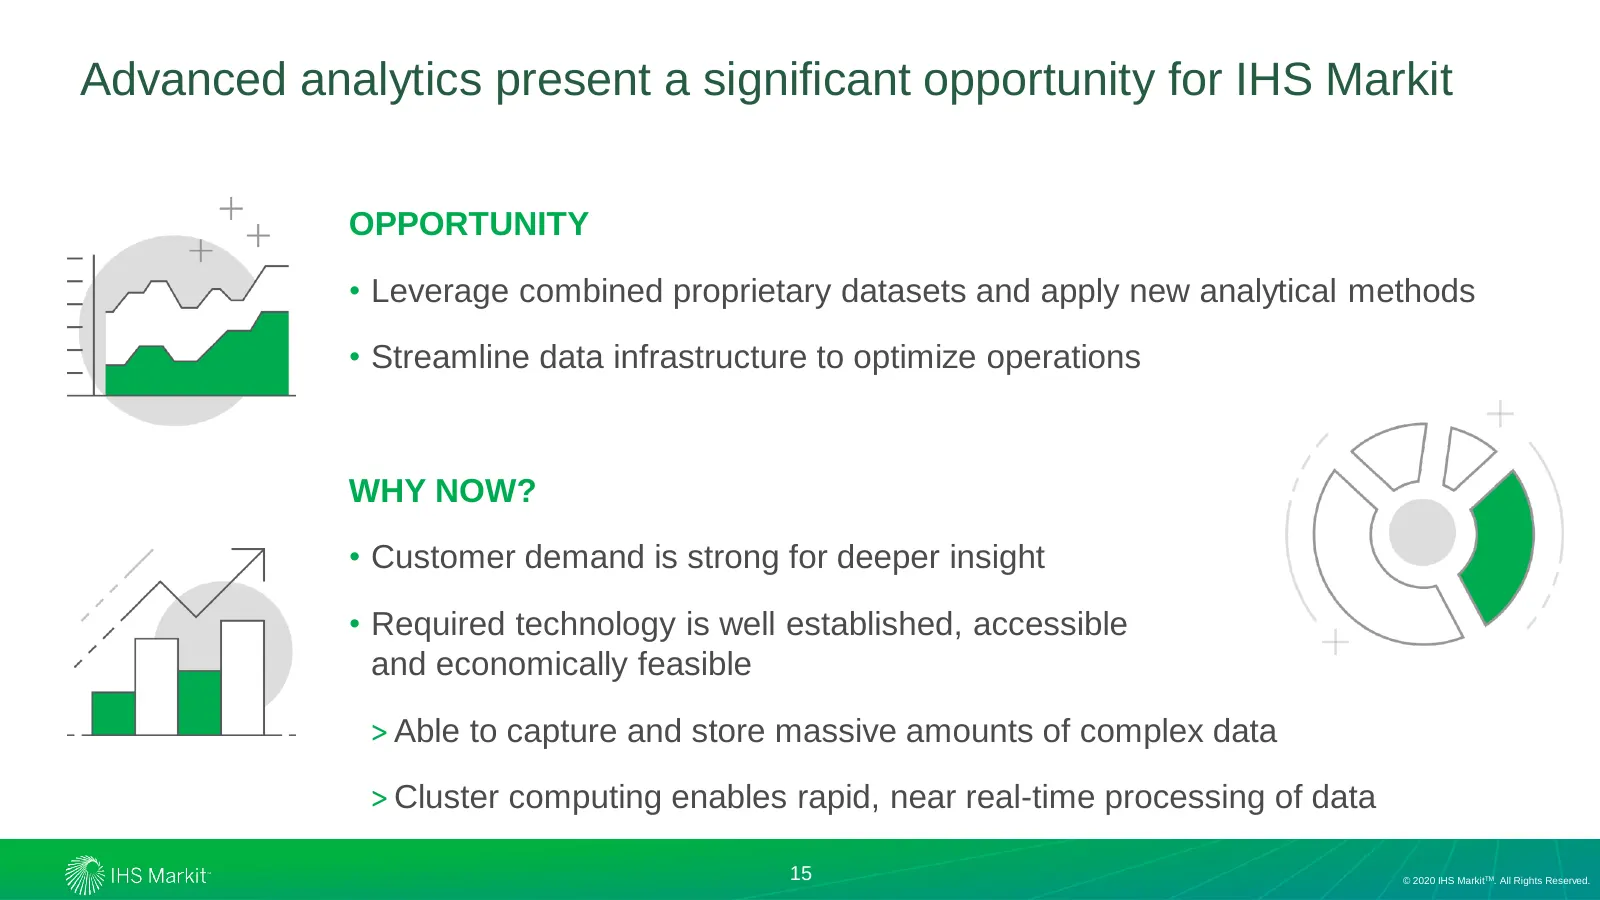
Advanced analytics present a significant opportunity for IHS Markit OPPORTUNITY • Leverage combined proprietary datasets and apply new analytical methods • Streamline data infrastructure to optimize operations WHY NOW? • Customer demand is strong for deeper insight • Required technology is well esta
Slide 16: Leveraging our proprietary data and industry expertise positions us to benefit from increasing demand for analytics
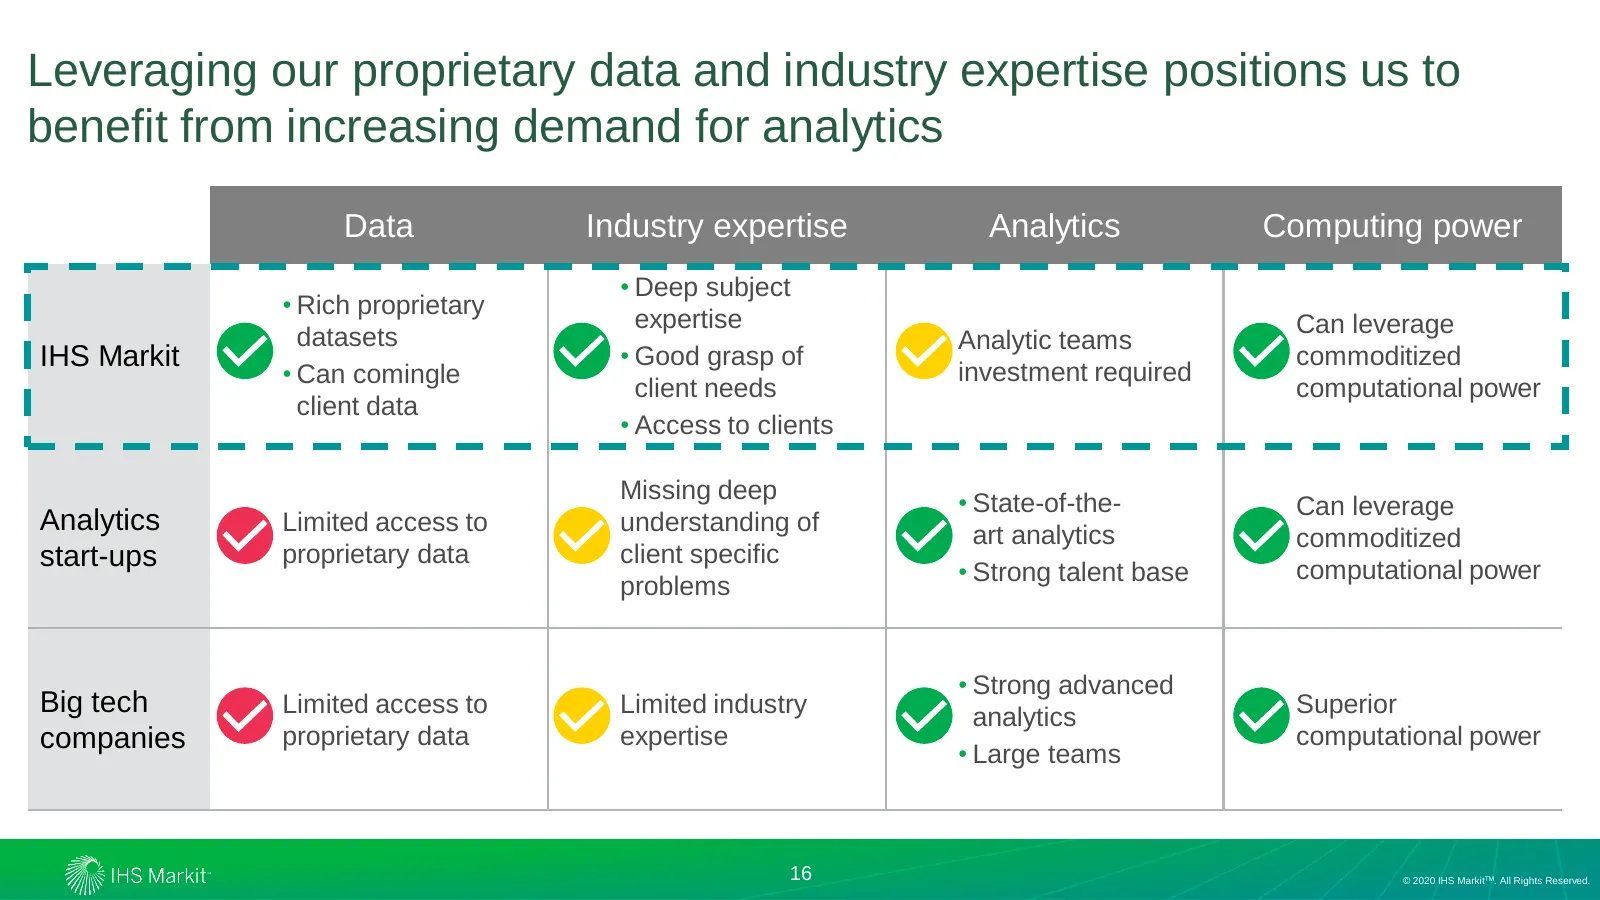
16 Leveraging our proprietary data and industry expertise positions us to benefit from increasing demand for analytics Data Industry expertise Analytics Computing power • Deep subject • Rich proprietary expertise Can leverage datasets Analytic teams IHS Markit • Good grasp of commoditized • Can comi

Slide 17: Financial Performance and Capital Strategy
Financial Performance and Capital Strategy © 2020 IHS MarkitTM. All Rights Reserved. 17 2020 IHS MarkitTM. All Rights Reserved.
Slide 18: IHS Markit business model creates a cycle of profitable growth and reinvestment capacity
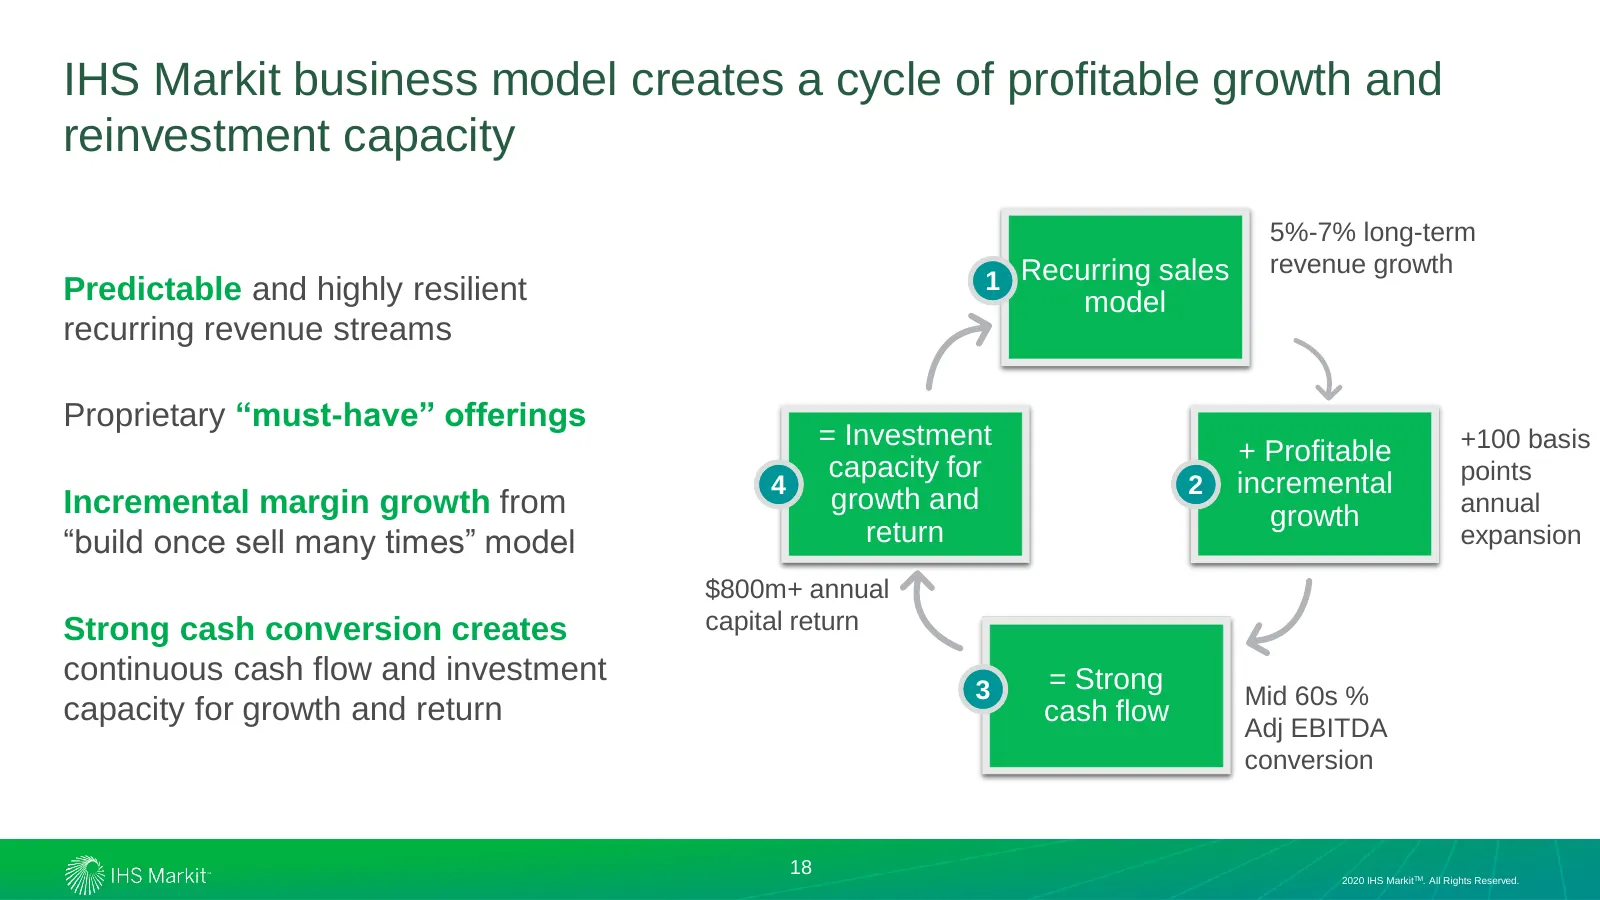
18 IHS Markit business model creates a cycle of profitable growth and reinvestment capacity 5%-7% long-term revenue growth Predictable and highly resilient 1 Recurring sales model recurring revenue streams Proprietary “must-have” offerings = Investment +100 basis + Profitable capacity for points 4 2
Slide 19: Highly recurring revenue delivers strong and resilient growth
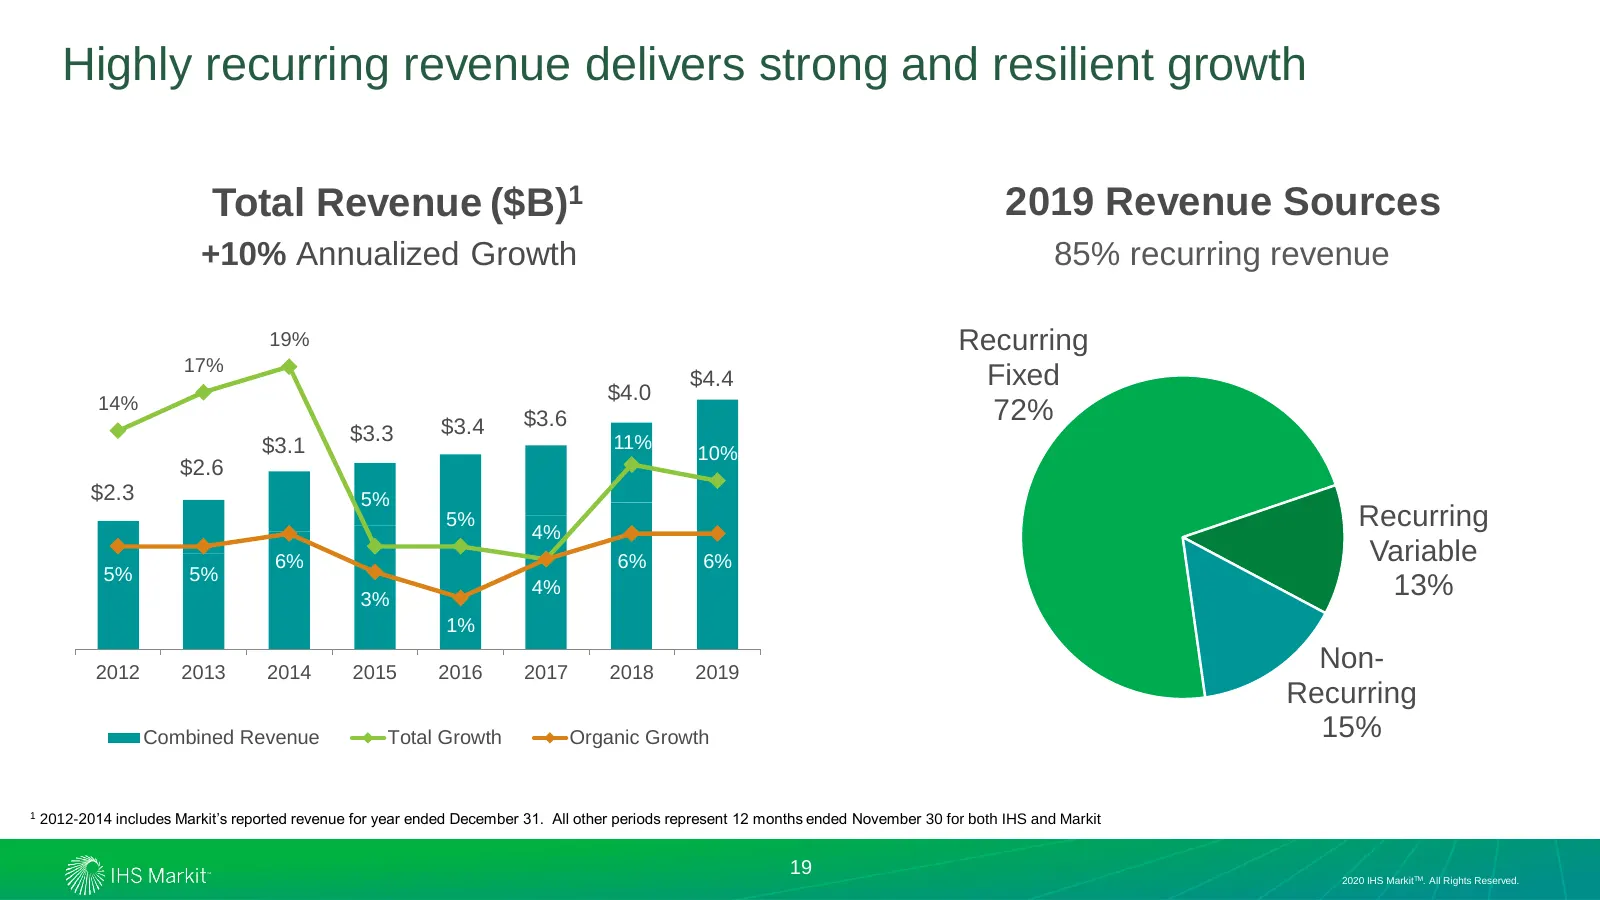
19 Highly recurring revenue delivers strong and resilient growth Total Revenue ($B)1 2019 Revenue Sources +10% Annualized Growth 85% recurring revenue 19% Recurring 17% $4.4 Fixed 14% $4.0 $3.4 $3.6 72% $3.3 11% $3.1 10% $2.6 $2.3 5% 5% 4% Recurring 6% 6% 6% Variable 5% 5% 3% 4% 13% 1% 2012 2013 201
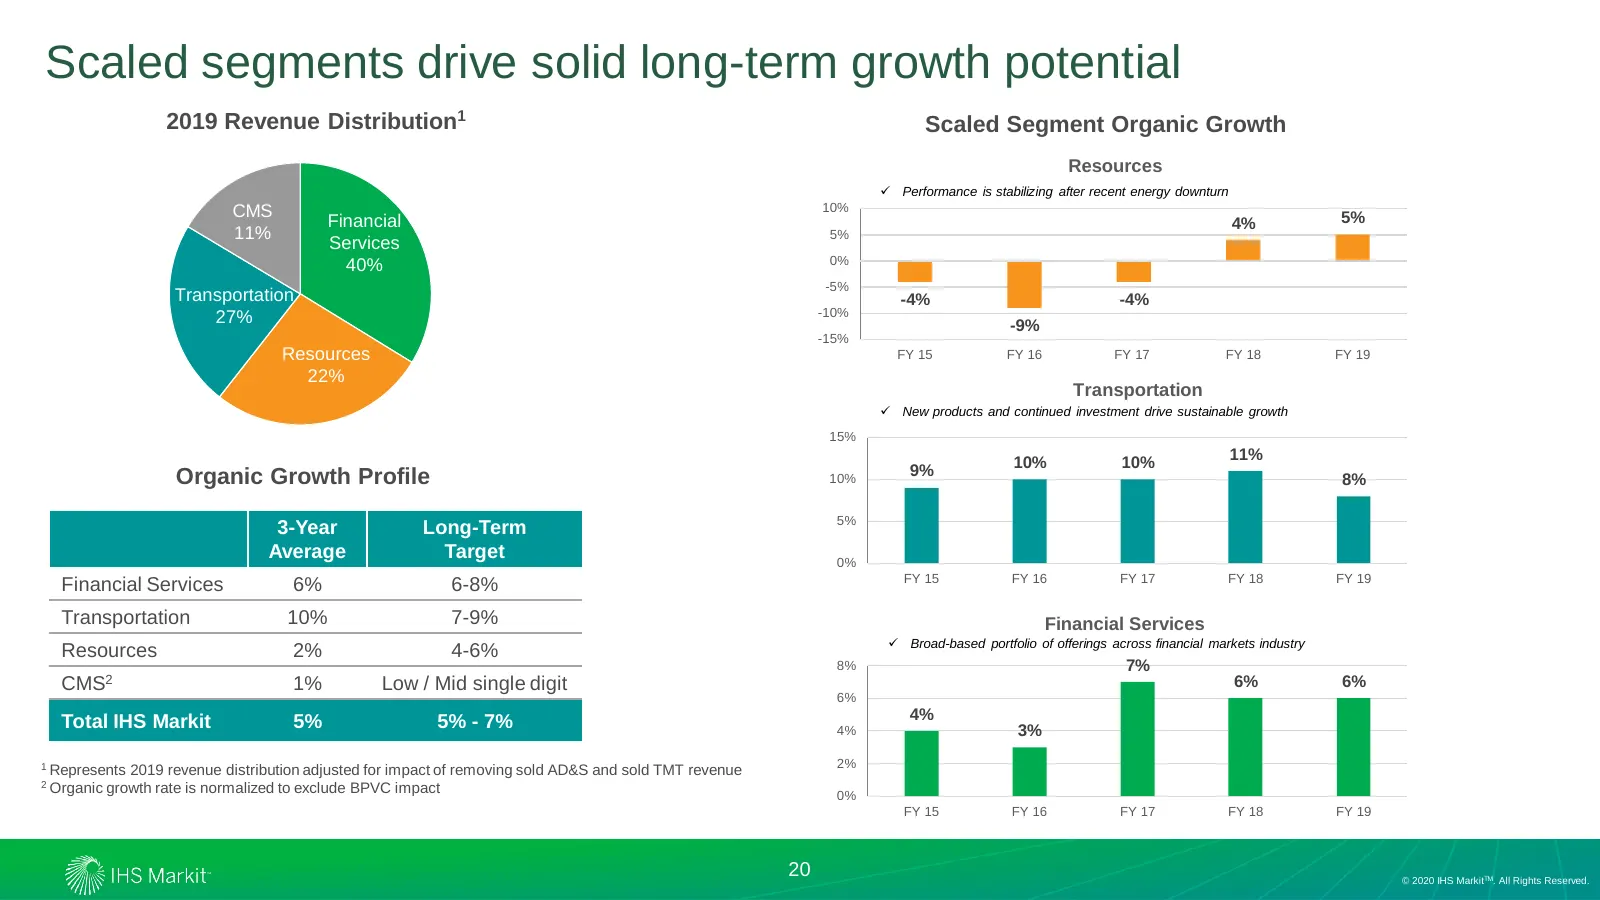
Slide 20: Scaled segments drive solid long-term growth potential
Scaled segments drive solid long-term growth potential 20 2019 Revenue Distribution1 Scaled Segment Organic Growth Resources ✓ Performance is stabilizing after recent energy downturn CMS 10% Financial 4% 5% 11% 5% Services 40% 0% -5% Transportation -4% -4% 27% -10% -9% -15% Resources FY 15 FY 16 FY
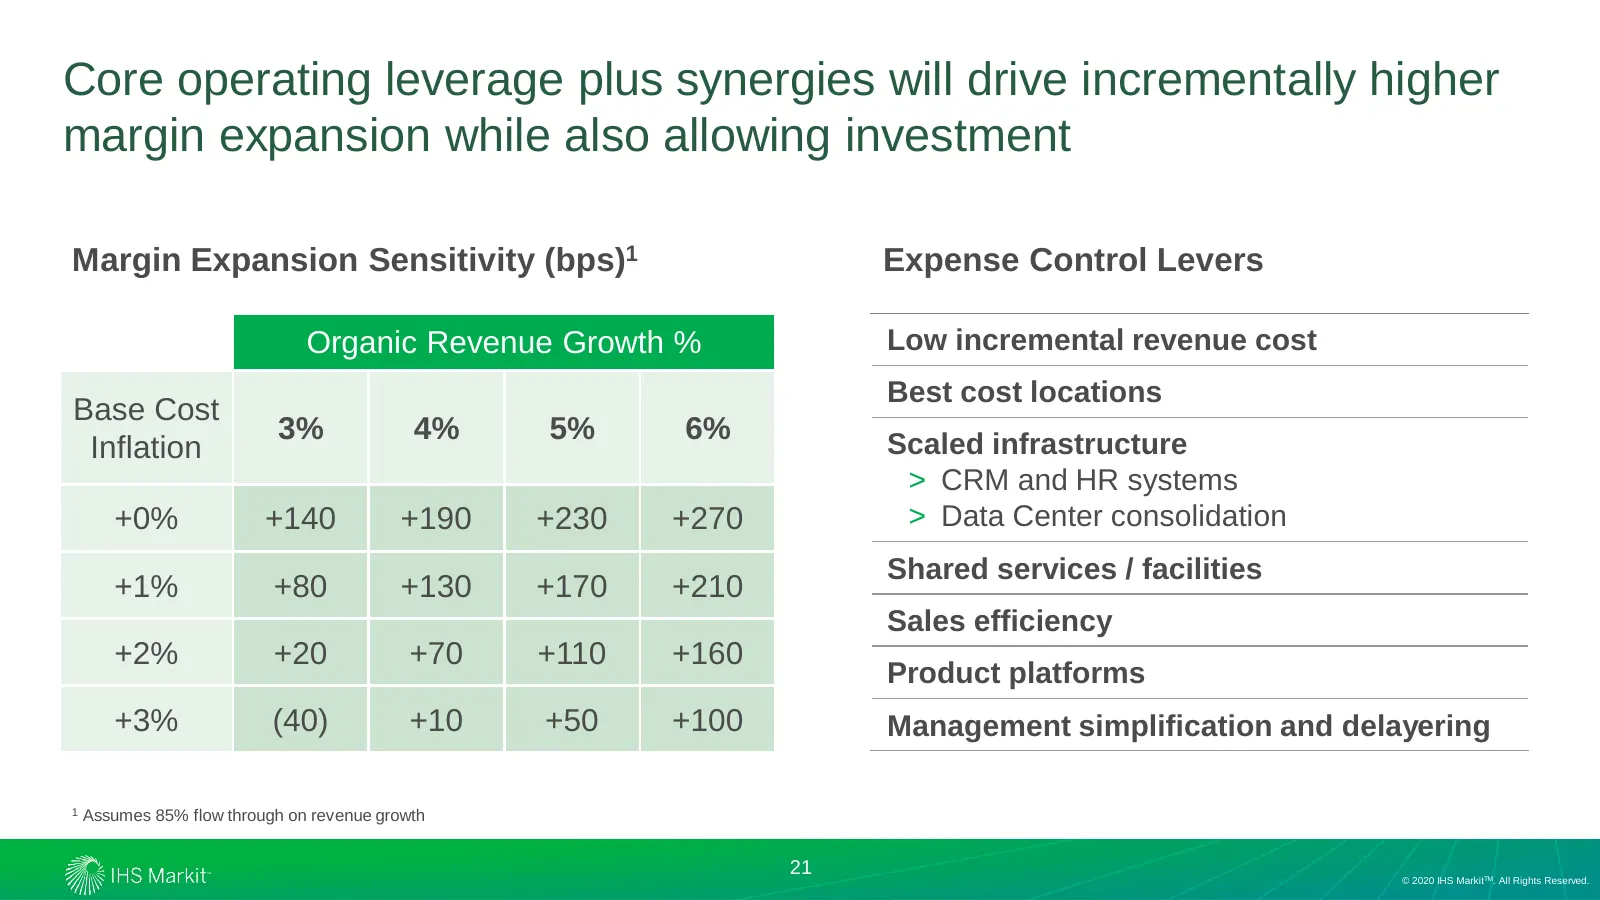
Slide 21: Core operating leverage plus synergies will drive incrementally higher margin expansion
21 Core operating leverage plus synergies will drive incrementally higher margin expansion while also allowing investment Margin Expansion Sensitivity (bps)1 Expense Control Levers Organic Revenue Growth % Low incremental revenue cost Best cost locations Base Cost 3% 4% 5% 6% Scaled infrastructure I
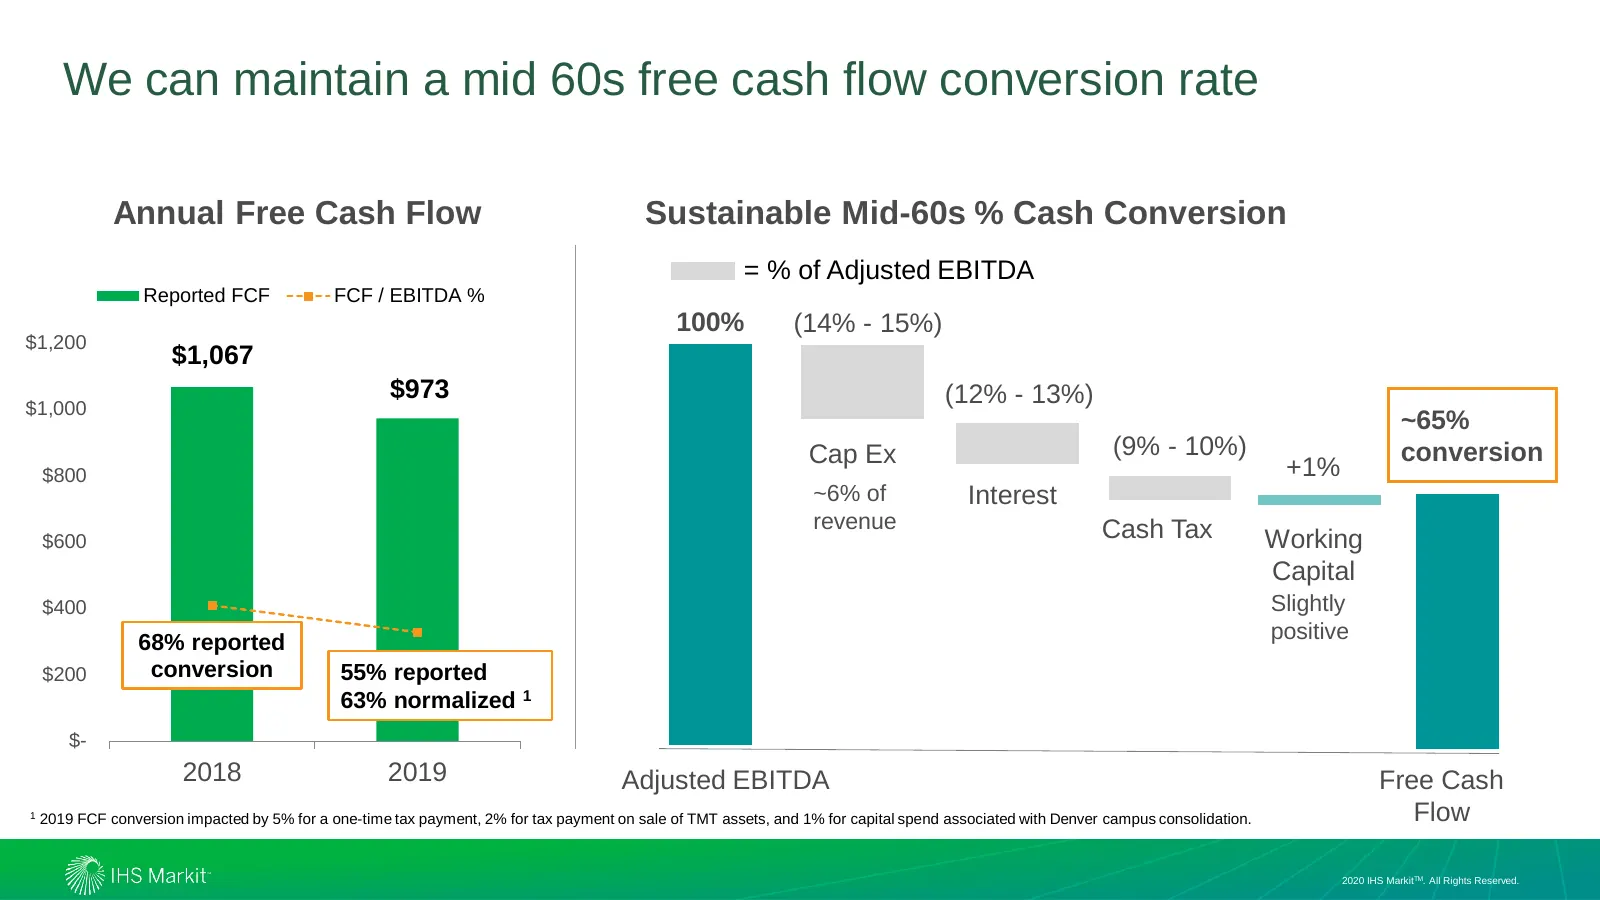
Slide 22: We can maintain a mid 60s free cash flow conversion rate
We can maintain a mid 60s free cash flow conversion rate Annual Free Cash Flow Sustainable Mid-60s % Cash Conversion = % of Adjusted EBITDA Reported FCF FCF / EBITDA % 100% (14% - 15%) $1,200 $1,067 $973 (12% - 13%) $1,000 ~65% Cap Ex (9% - 10%) conversion $800 +1% ~6% of Interest revenue Cash Tax $
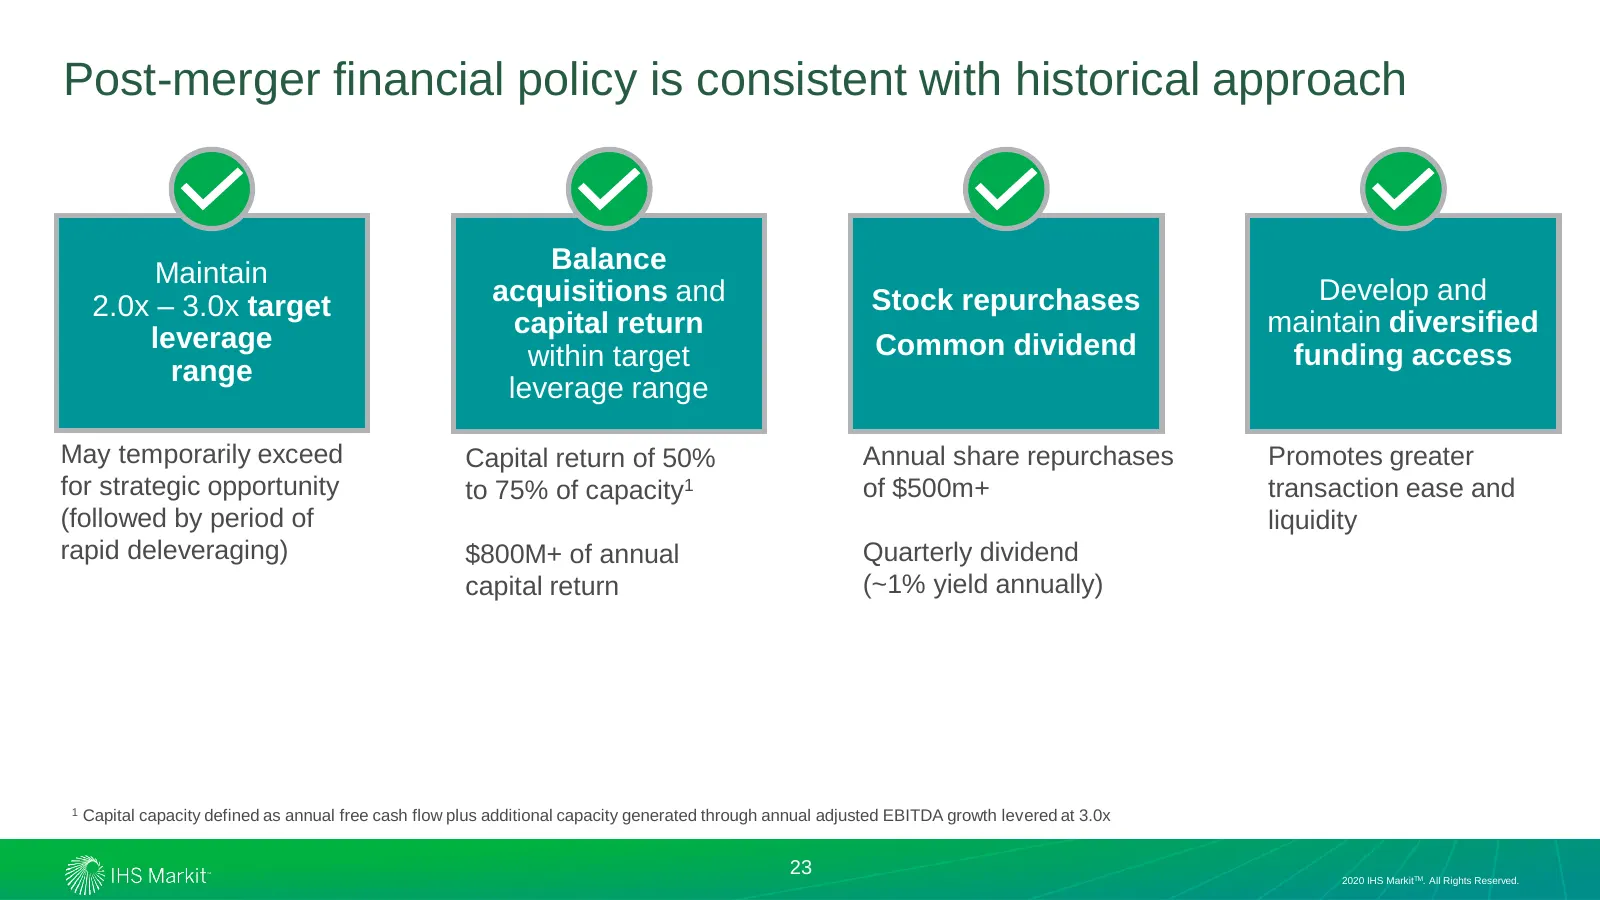
Slide 23: Post-merger financial policy is consistent with historical approach
Post-merger financial policy is consistent with historical approach Maintain Balance acquisitions and Stock repurchases Develop and 2.0x – 3.0x target capital return maintain diversified leverage Common dividend within target funding access range leverage range May temporarily exceed Capital return
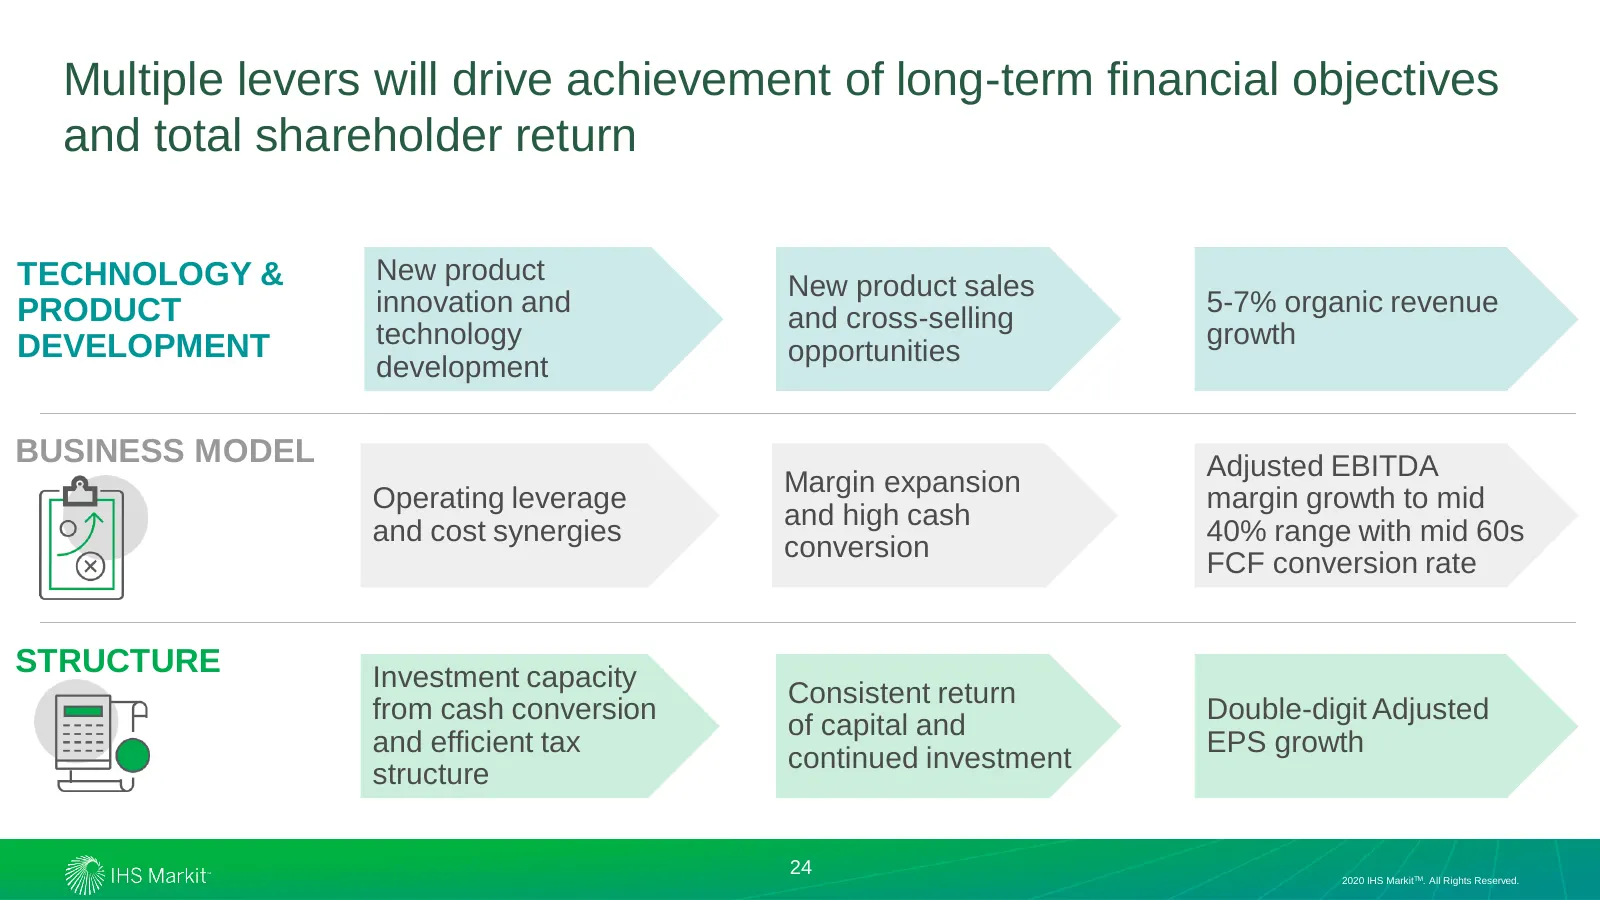
Slide 24: Multiple levers will drive achievement of long-term financial objectives and total shareholder return
24 Multiple levers will drive achievement of long-term financial objectives and total shareholder return TECHNOLOGY & New product New product sales PRODUCT innovation and 5-7% organic revenue and cross-selling DEVELOPMENT technology growth opportunities development BUSINESS MODEL Adjusted EBITDA Mar

Slide 25: Environmental, Social and Corporate Governance
Environmental, Social and Corporate Governance © 2020 IHS MarkitTM. All Rights Reserved. 25 2020 IHS MarkitTM. All Rights Reserved.
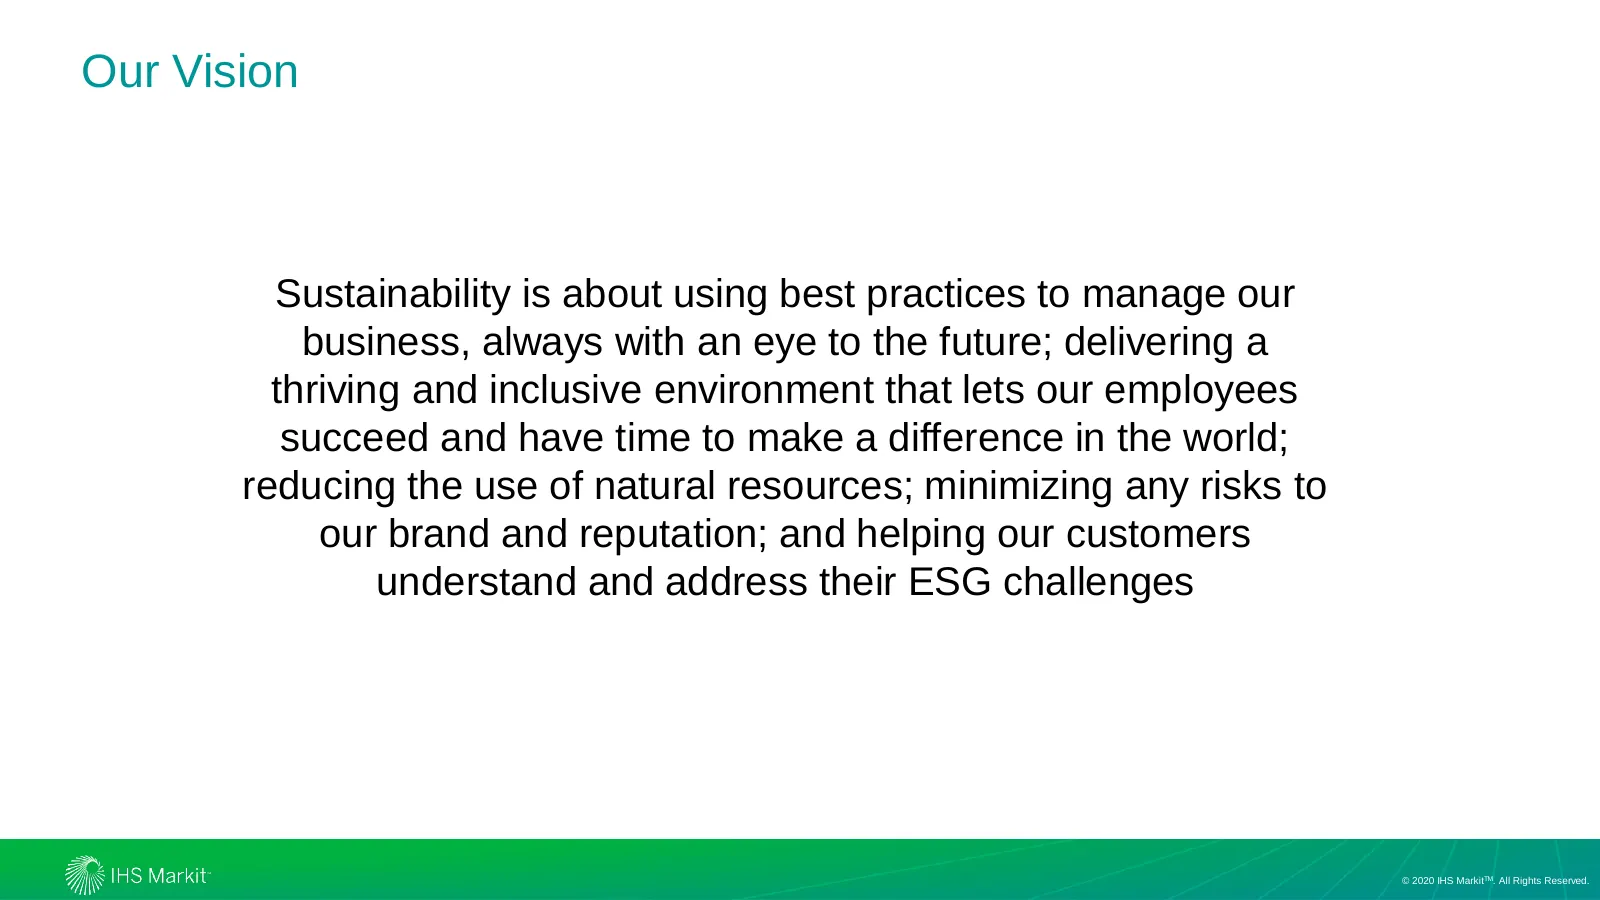
Slide 26: Our Vision
Our Vision Sustainability is about using best practices to manage our business, always with an eye to the future; delivering a thriving and inclusive environment that lets our employees succeed and have time to make a difference in the world; reducing the use of natural resources; minimizing any ris
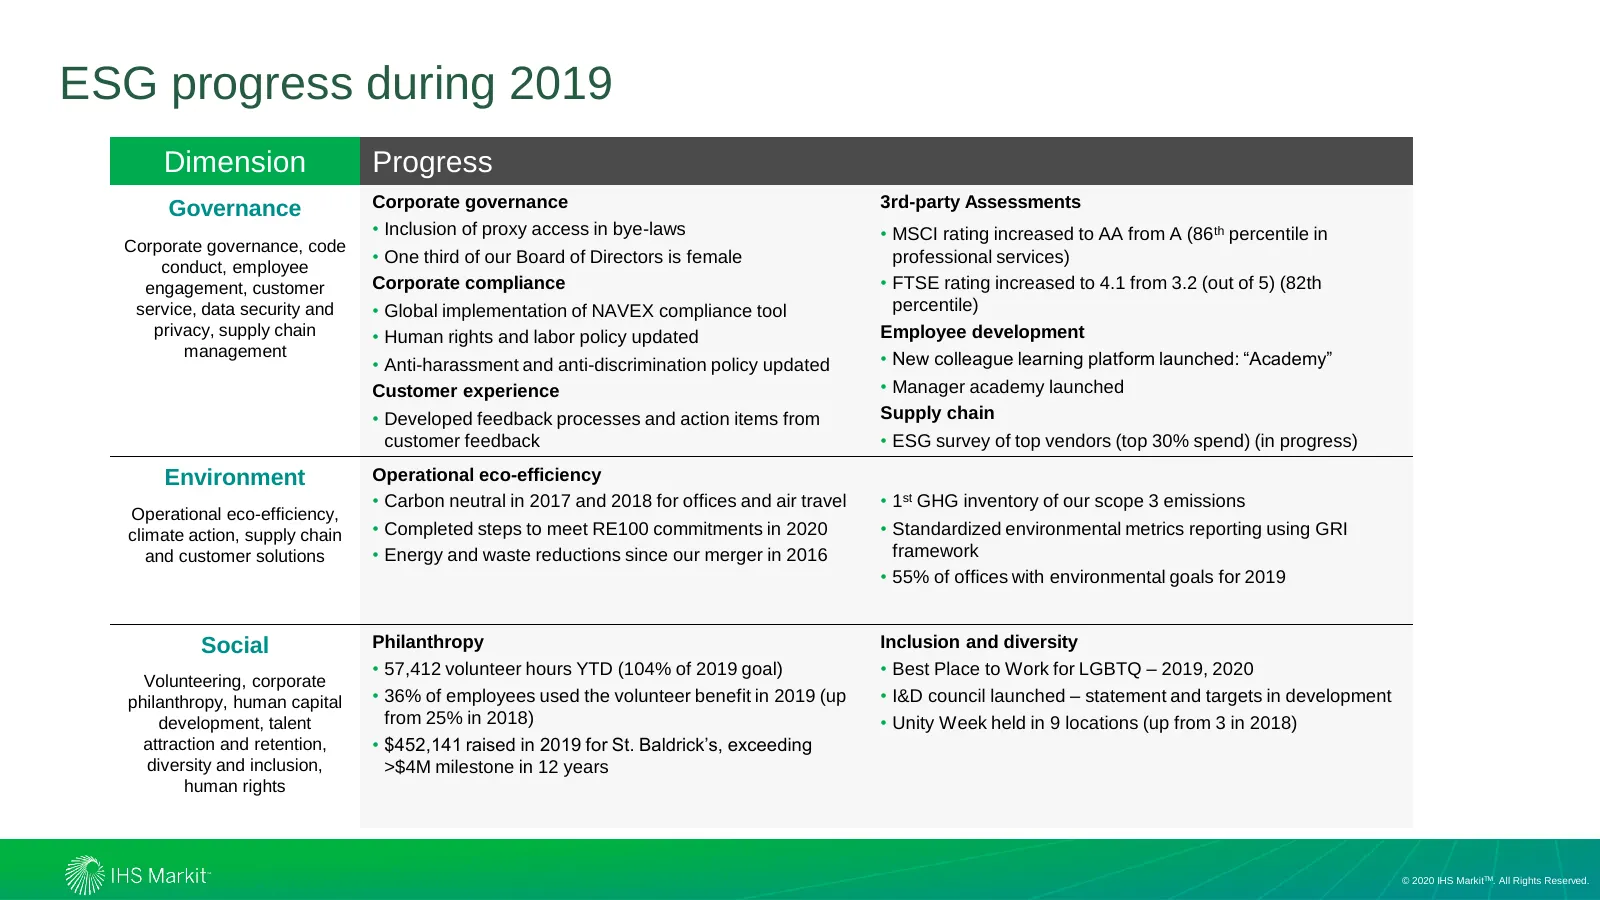
Slide 27: ESG progress during 2019
ESG progress during 2019 Dimension Progress Governance Corporate governance 3rd-party Assessments • Inclusion of proxy access in bye-laws • MSCI rating increased to AA from A (86 th percentile in Corporate governance, code • One third of our Board of Directors is female professional services) conduc
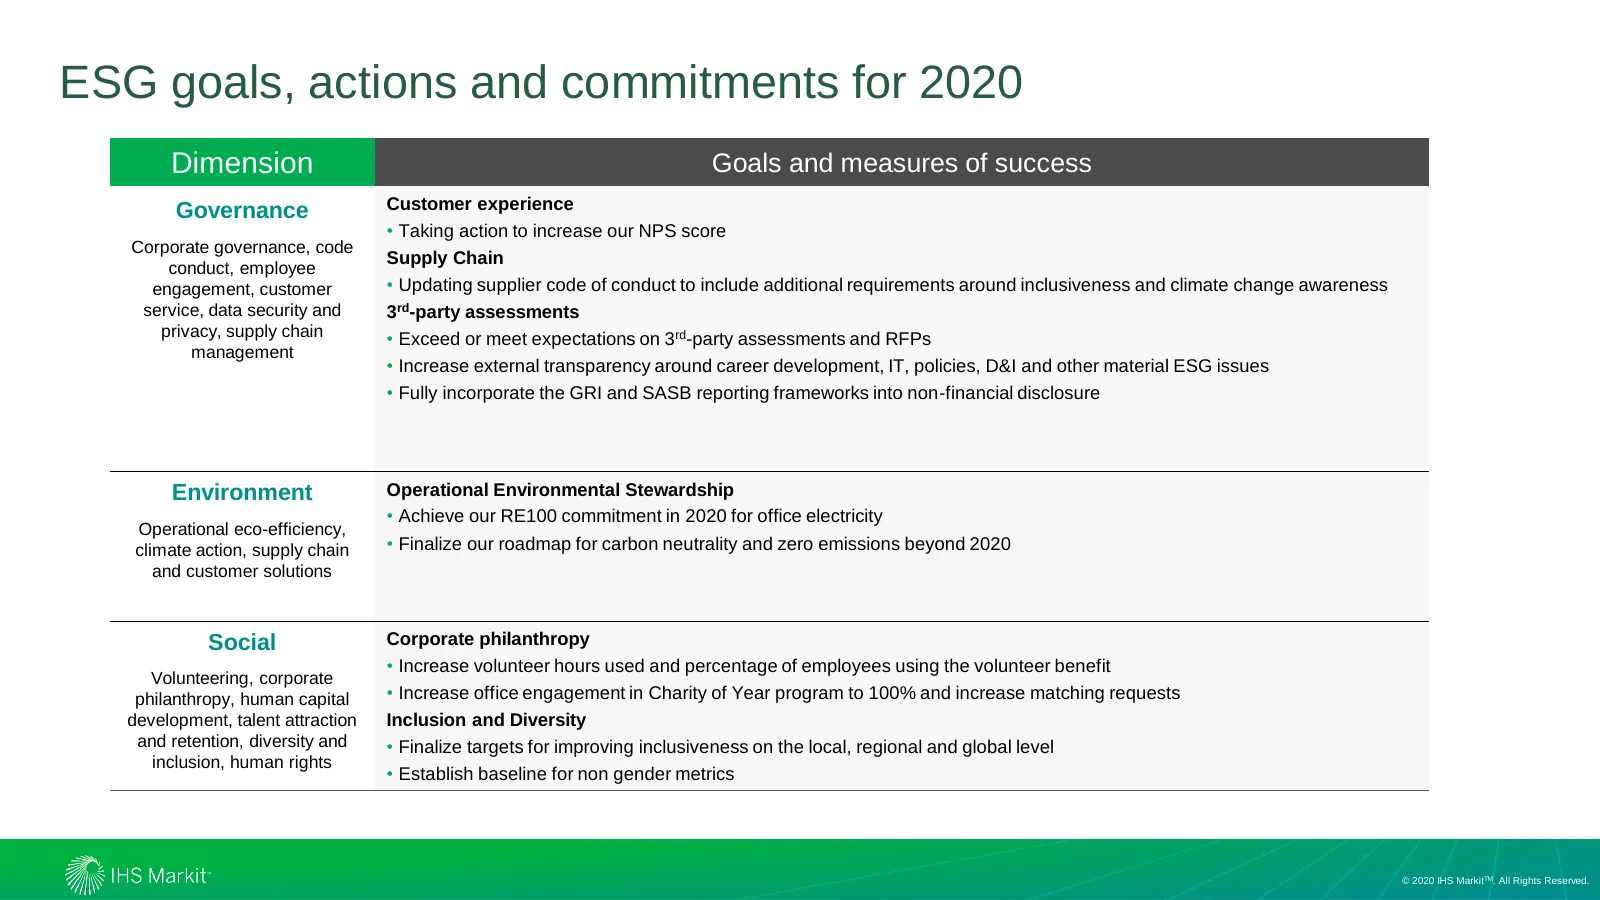
Slide 28: ESG goals, actions and commitments for 2020
ESG goals, actions and commitments for 2020 Dimension Goals and measures of success Governance Customer experience • Taking action to increase our NPS score Corporate governance, code Supply Chain conduct, employee engagement, customer • Updating supplier code of conduct to include additional requir
Source: company website
More decks from Ihs Markit Ltd
 Q4 2021 Earnings Presentation7 slides · Jan 21, 2022
 Q3 2021 Earnings Presentation7 slides · Sep 28, 2021
 Q4 2020 Earnings Presentation7 slides · Jan 13, 2021
 Merger or Acquisition (November 2020)20 slides · Nov 30, 2020
 Q3 2020 Earnings Presentation8 slides · Sep 29, 2020
 Q1 2020 Earnings Presentation10 slides · Mar 24, 2020