DPL — Morgan Stanley 15th Annual Global Electricity & Energy Conference (March 2008)
20 slides from DPL's conference presentation, Mar 31, 2008
Slide 1: Morgan Stanley 15th Annual Global Electricity & Energy Conference
Morgan Stanley 15th Annual Global Electricity & Energy Conference John J. Gillen Senior Vice President and Chief Financial Officer April 2008
Slide 2: Notice Regarding Forward-Looking Statement
1 April 2008 Investor Relations Contact John J. Gillen Senior Vice President and Chief Financial Officer (937) 259-7033 [email protected] Notice Regarding Forward-Looking Statement Certain statements contained in this presentation are “forward-looking statements” within the meaning of the Priva
Slide 3: REG G Disclosure
2 April 2008 Investor Relations Contact John J. Gillen Senior Vice President and Chief Financial Officer (937) 259-7033 [email protected] REG G Disclosure Today’s discussion contains certain non-GAAP financial measures as defined under SEC Regulation G. Generally, a non-GAAP financial measure i
Slide 4: 2007 Highlights
wauae | \l yh i " m NAT ar | i li : April 2008 | 2007 Highlights
Slide 5: Environmental Capital Investment
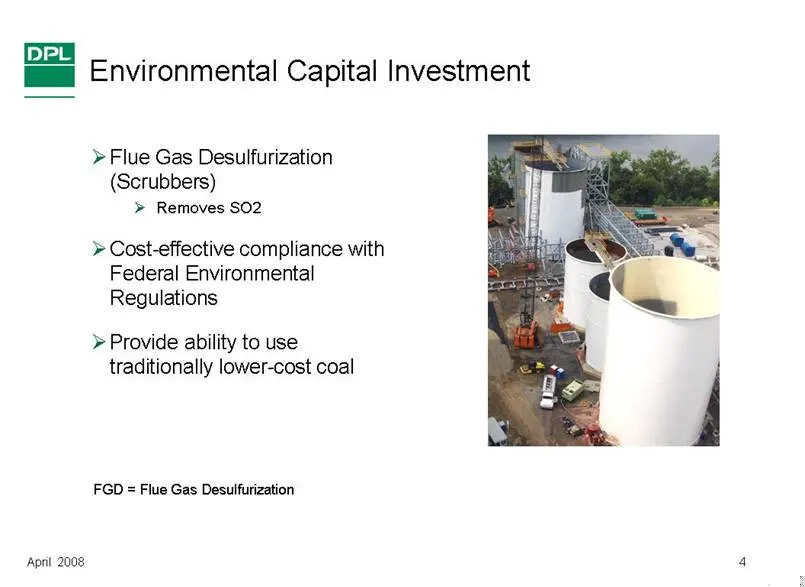
4 April 2008 Environmental Capital Investment Flue Gas Desulfurization (Scrubbers) Removes SO2 Cost-effective compliance with Federal Environmental Regulations Provide ability to use traditionally lower-cost coal FGD = Flue Gas Desulfurization
Slide 6: FGD (scrubbers) Update
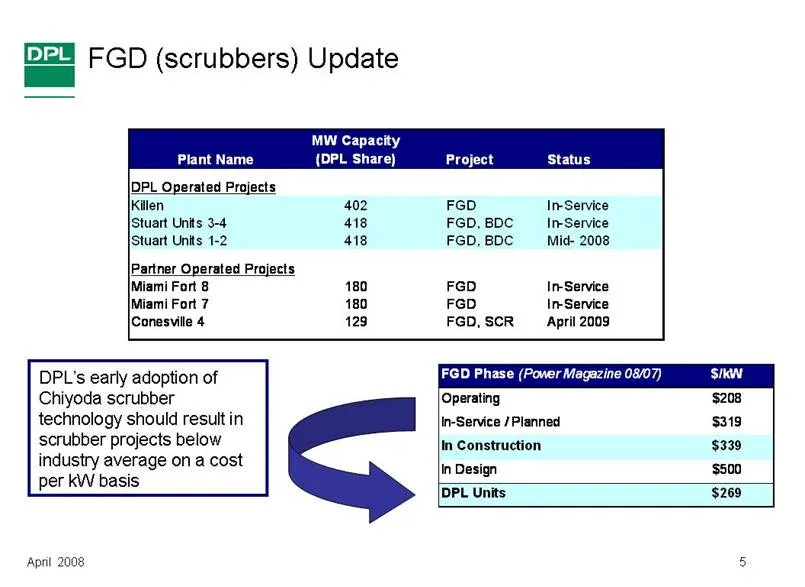
5 April 2008 Plant Name MW Capacity (DPL Share) Project Status DPL Operated Projects Killen 402 FGD In-Service Stuart Units 3-4 418 FGD, BDC In-Service Stuart Units 1-2 418 FGD, BDC Mid- 2008 Partner Operated Projects Miami Fort 8 180 FGD In-Service Miami Fort 7 180 FGD In-Service Conesville 4 129 F
Slide 7: Killen Station Coal Blending Timeline
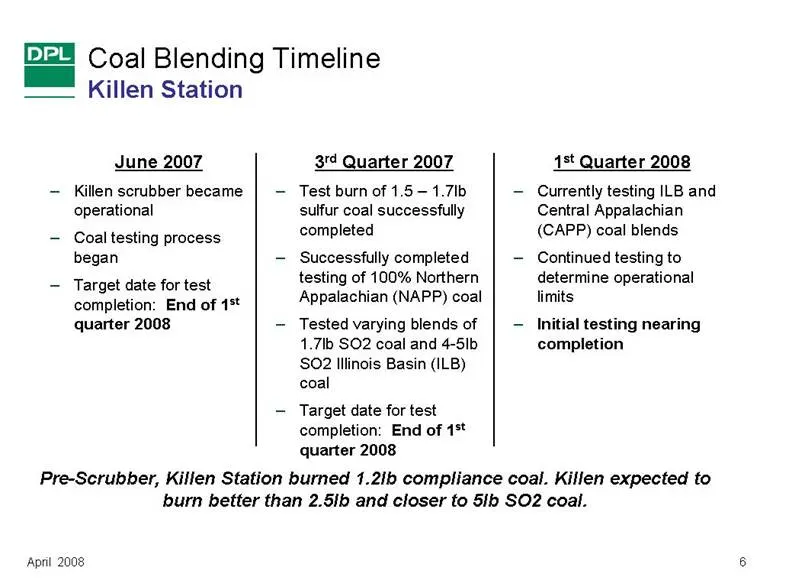
6 April 2008 Killen Station Coal Blending Timeline June 2007 – Killen scrubber became operational – Coal testing process began – Target date for test completion: End of 1st quarter 2008 3rd Quarter 2007 – Test burn of 1.5 – 1.7lb sulfur coal successfully completed – Successfully completed testing of
Slide 8: Stuart Station Coal Blending Timeline
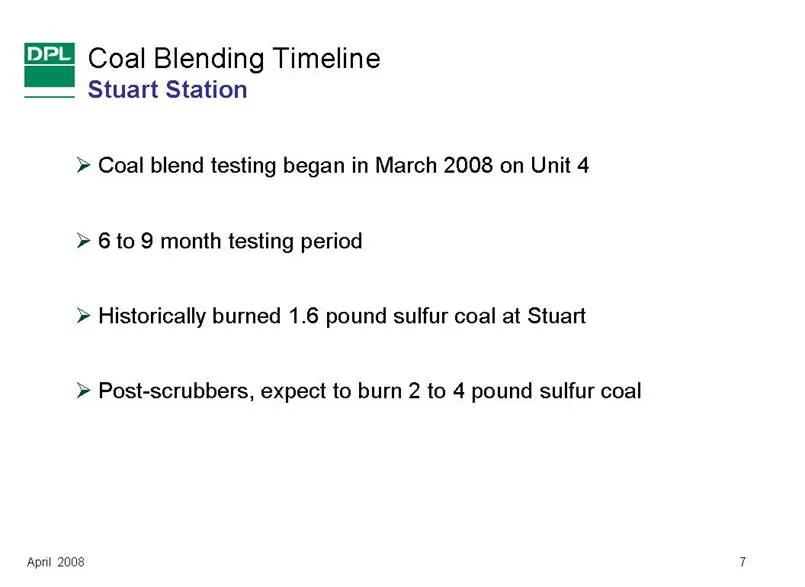
7 April 2008 Stuart Station Coal Blending Timeline Coal blend testing began in March 2008 on Unit 4 6 to 9 month testing period Historically burned 1.6 pound sulfur coal at Stuart Post-scrubbers, expect to burn 2 to 4 pound sulfur coal
Slide 9: Emission Allowances
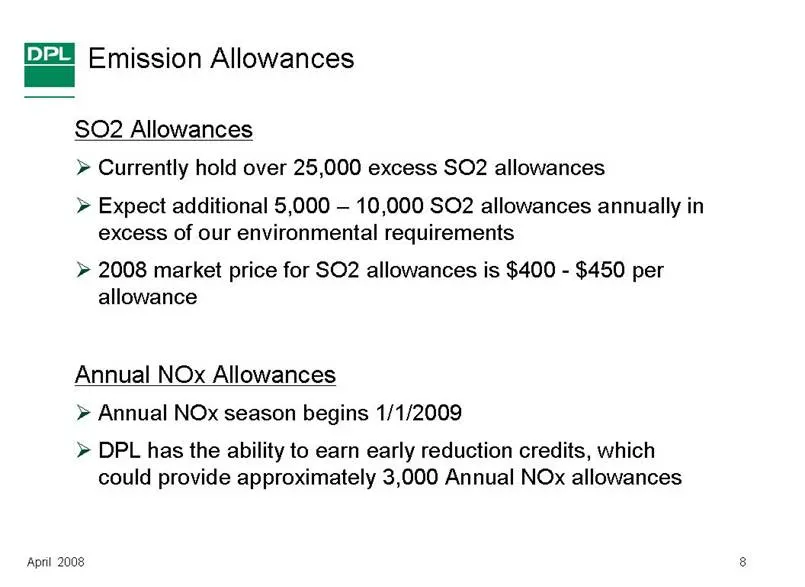
8 April 2008 Emission Allowances SO2 Allowances Currently hold over 25,000 excess SO2 allowances Expect additional 5,000 – 10,000 SO2 allowances annually in excess of our environmental requirements 2008 market price for SO2 allowances is $400 - $450 per allowance Annual NOx Allowances Annual NOx sea
Slide 10: Coal Hedging Fuel Update
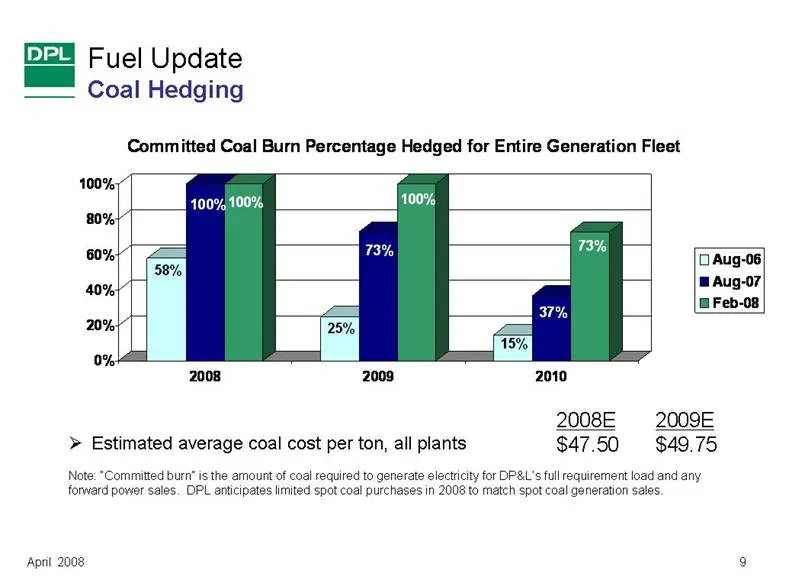
9 April 2008 Coal Hedging Fuel Update Note: “Committed burn” is the amount of coal required to generate electricity for DP&L’s full requirement load and any forward power sales. DPL anticipates limited spot coal purchases in 2008 to match spot coal generation sales. Estimated average coal cost per t
Slide 11: Plant Performance
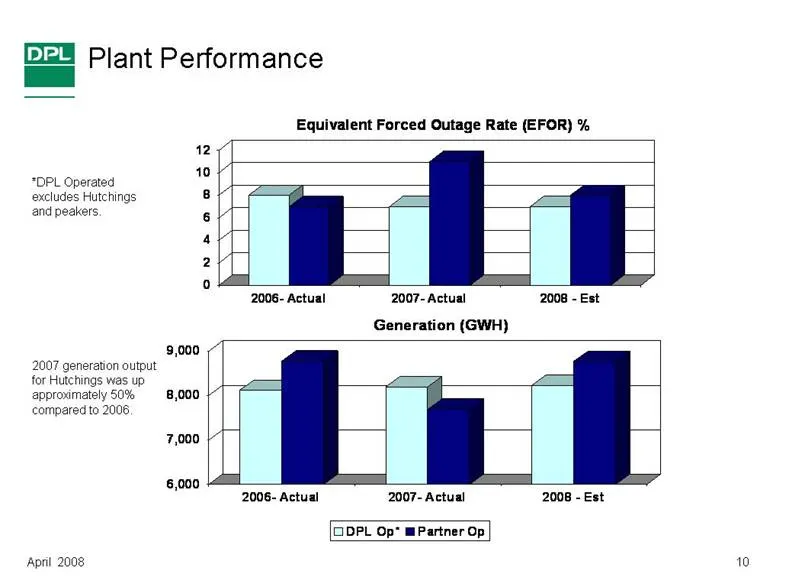
10 April 2008 Plant Performance 0 2 4 6 8 10 12 2006- Actual 2007- Actual 2008 - Est Equivalent Forced Outage Rate (EFOR) % 6,000 7,000 8,000 9,000 2006- Actual 2007- Actual 2008 - Est Generation (GWH) DPL Op* Partner Op *DPL Operated excludes Hutchings and peakers. 2007 generation output for Hutchi
Slide 12: 2007 Corporate Highlights
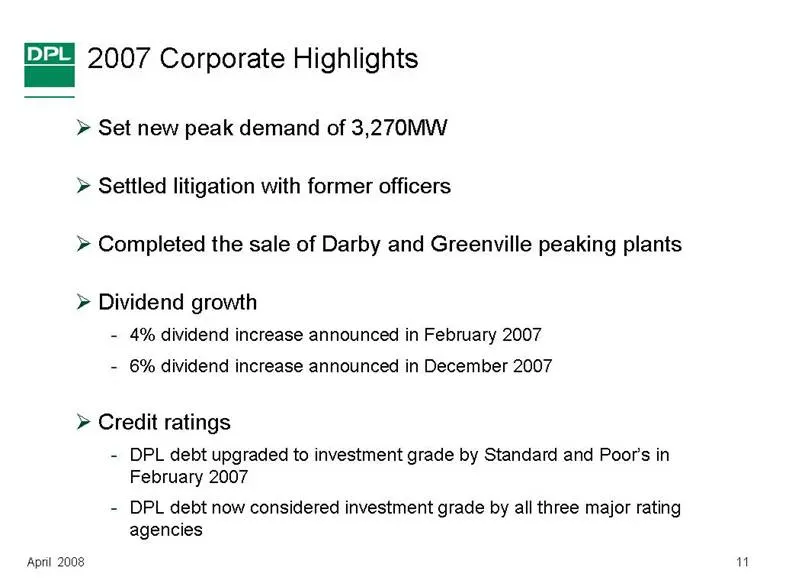
11 April 2008 2007 Corporate Highlights Set new peak demand of 3,270MW Settled litigation with former officers Completed the sale of Darby and Greenville peaking plants Dividend growth - 4% dividend increase announced in February 2007 - 6% dividend increase announced in December 2007 Credit ratings
Slide 13: 2008 Objectives
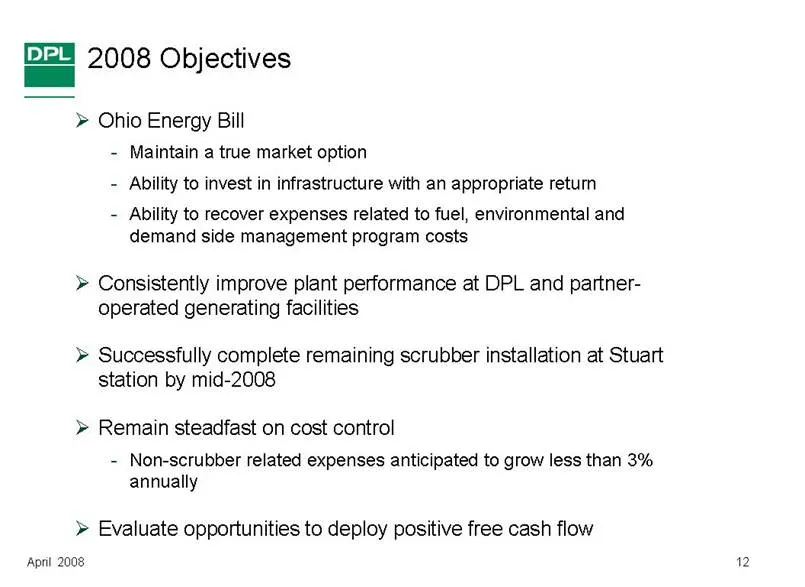
12 April 2008 2008 Objectives Ohio Energy Bill - Maintain a true market option - Ability to invest in infrastructure with an appropriate return - Ability to recover expenses related to fuel, environmental and demand side management program costs Consistently improve plant performance at DPL and part
Slide 14: 2007 Year End Earnings
2007 Year End Earnings April 2008
Slide 15: Earnings Per Share
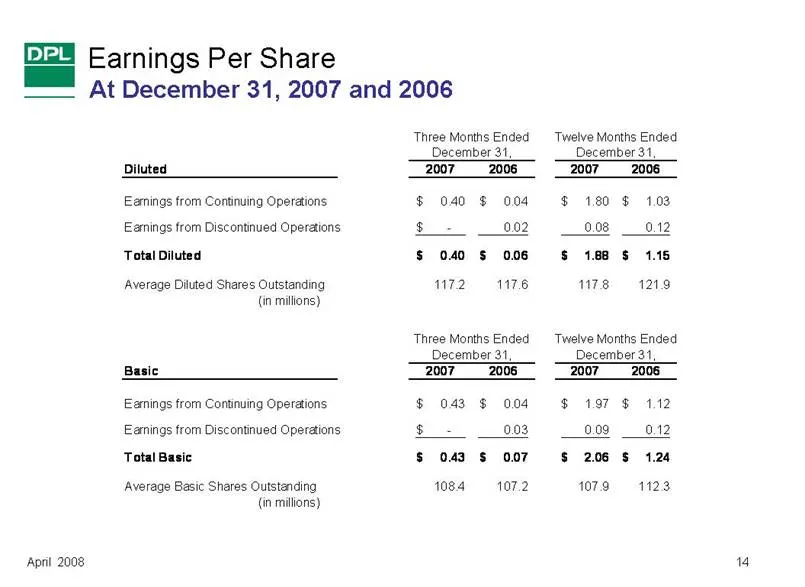
14 April 2008 At December 31, 2007 and 2006 Earnings Per Share Diluted 2007 2006 2007 2006 Earnings from Continuing Operations 0.40 $ 0.04 $ 1.80 $ 1.03 $ Earnings from Discontinued Operations - $ 0.02 0.08 0.12 Total Diluted 0.40 $ 0.06 $ 1.88 $ 1.15 $ Average Diluted Shares Outstanding 117.2 117.6
Slide 16: Non-GAAP Earnings Per Share Reconciliation
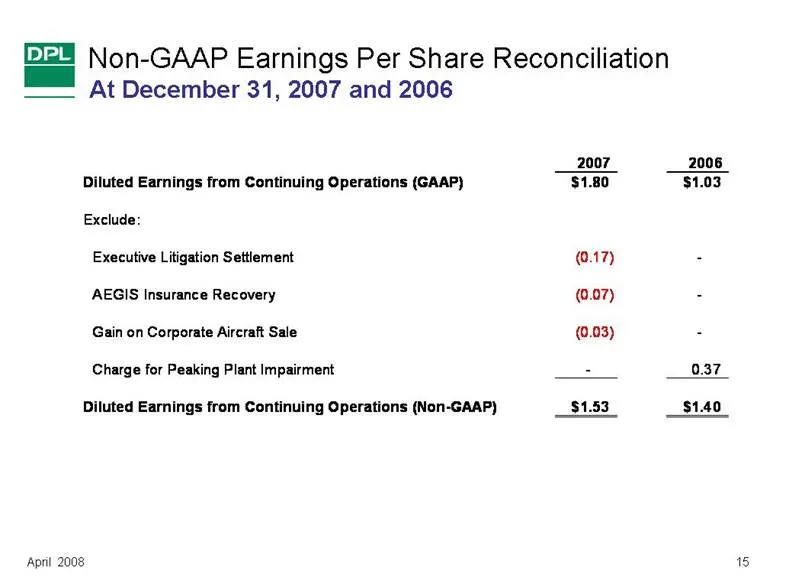
15 April 2008 At December 31, 2007 and 2006 Non-GAAP Earnings Per Share Reconciliation 2007 2006 Diluted Earnings from Continuing Operations (GAAP) $1.80 $1.03 Exclude: Executive Litigation Settlement (0.17) - AEGIS Insurance Recovery (0.07) - Gain on Corporate Aircraft Sale (0.03) - Charge for Peak
Slide 17: Key Drivers of Non-GAAP 2007 Earnings
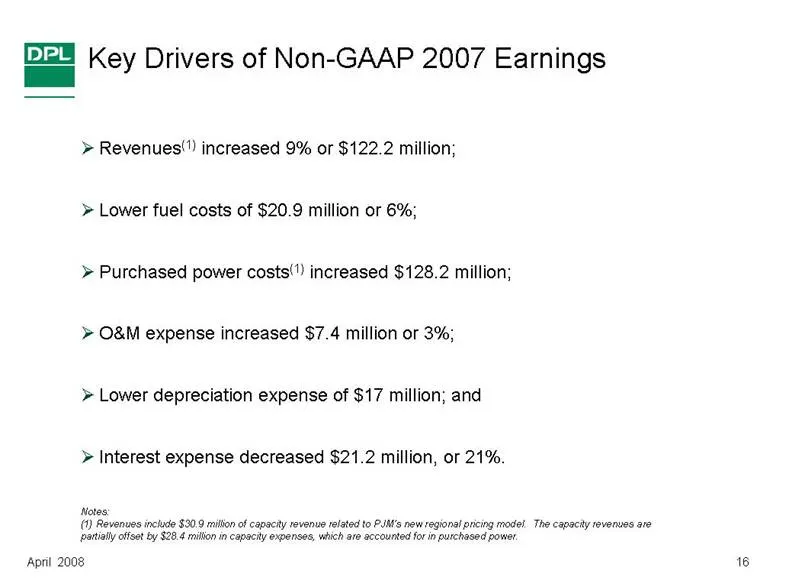
16 April 2008 Key Drivers of Non-GAAP 2007 Earnings Revenues(1) increased 9% or $122.2 million; Lower fuel costs of $20.9 million or 6%; Purchased power costs(1) increased $128.2 million; O&M expense increased $7.4 million or 3%; Lower depreciation expense of $17 million; and Interest expense decrea
Slide 18: 2008-2010 Capital Outlook
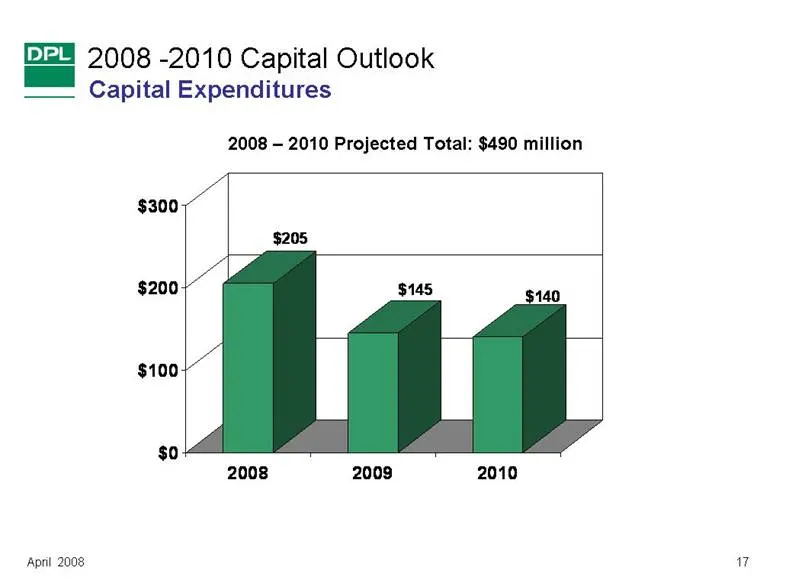
17 April 2008 2008 -2010 Capital Outlook Capital Expenditures $205 $145 $140 $0 $100 $200 $300 2008 2009 2010 2008 – 2010 Projected Total: $490 million
Slide 19: Why Invest in DPL?
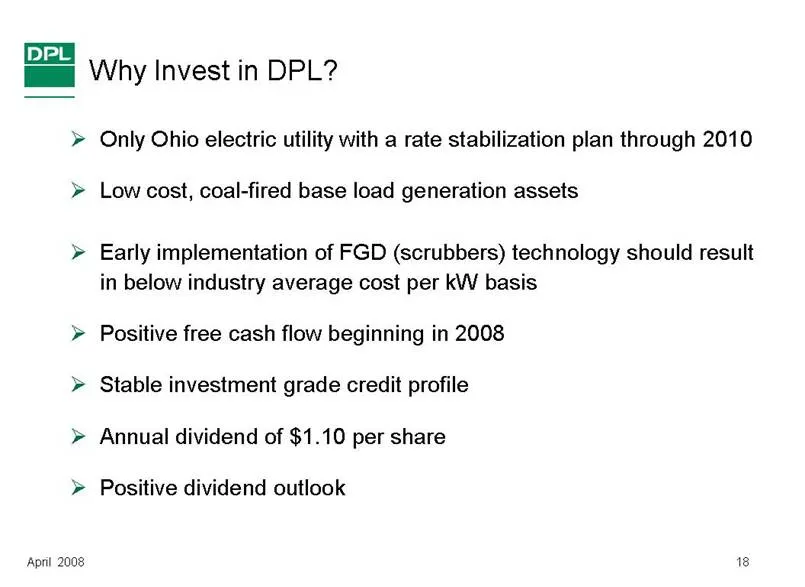
18 April 2008 Only Ohio electric utility with a rate stabilization plan through 2010 Low cost, coal-fired base load generation assets Early implementation of FGD (scrubbers) technology should result in below industry average cost per kW basis Positive free cash flow beginning in 2008 Stable investme
Slide 20: Morgan Stanley 15th Annual Global Electricity & Energy Conference
Morgan Stanley 15th Annual Global Electricity & Energy Conference John J. Gillen Senior Vice President and Chief Financial Officer April 2008
Source: SEC EDGAR · 8-K filed Mar 31, 2008
More decks from DPL Inc
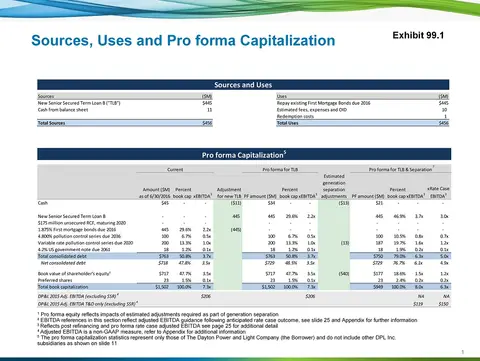 Debt Investor Presentation (August 2016)12 slides · Aug 8, 2016
 Q1 2011 Earnings Presentation28 slides · Apr 29, 2011
 FY2010 Earnings Presentation15 slides · Feb 17, 2011
 Non-Deal Roadshow (December 2010)24 slides · Dec 10, 2010
 Q3 2010 Earnings Presentation18 slides · Oct 29, 2010
 Non-Deal Roadshow (September 2010)24 slides · Sep 14, 2010