Consolidated Communications — Q3 2020 Earnings Presentation
13 slides from Consolidated Communications's earnings presentation, Oct 29, 2020

Slide 1: Q3 2020 Earnings
Q3 2020 Earnings Oct. 29, 2020
Slide 2: Safe Harbor
Safe Harbor The Securities and Exchange Commission (“SEC”) encourages companies to disclose forward - looking information so that investors ca n better understand a company’s future prospects and make informed investment decisions. Certain statements in this communication are forward - looki ng stat
Slide 3: Non-GAAP Measures
Non - GAAP Measures This presentation includes certain non - GAAP historical and forward - looking financial measures, including but not limited to “ EBITDA,” “adjusted EBITDA,” “total net debt to last twelve month adjusted EBITDA ratio ,” and “ free cash flow.” In addition to providing key metrics
Slide 4: Third Quarter 2020 Highlights
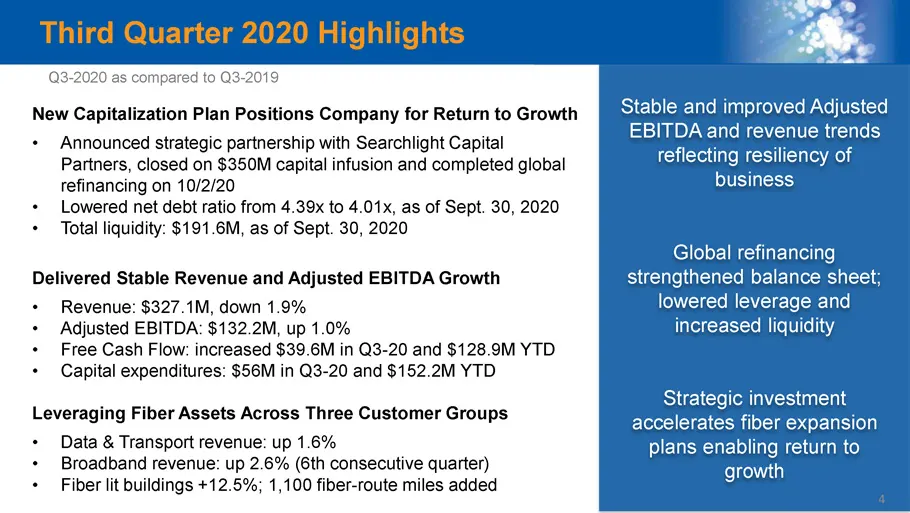
Third Quarter 2020 Highlights New Capitalization Plan Positions Company for Return to Growth • Announced strategic partnership with Searchlight Capital Partners, closed on $350M capital infusion and completed global refinancing on 10/2/20 • Lowered net debt ratio from 4.39x to 4.01x, as of Sept. 30,
Slide 5: The New Consolidated Communications
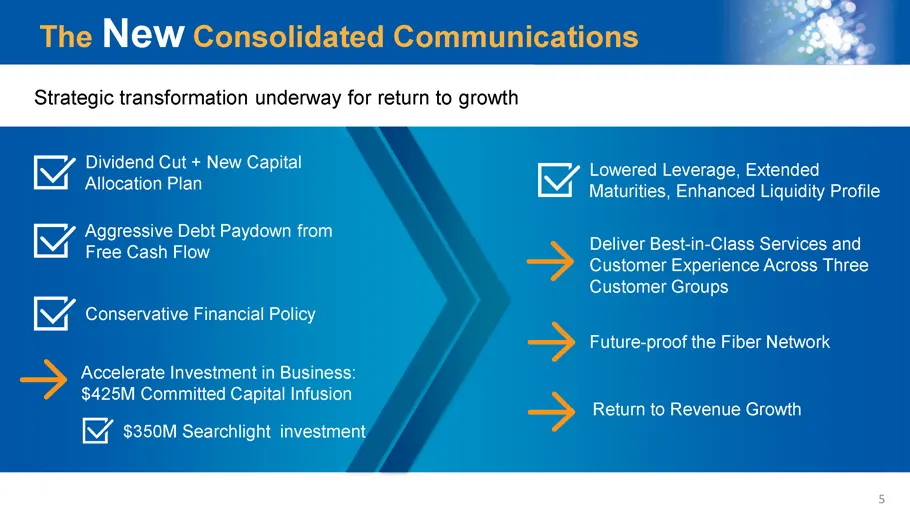
The New Consolidated Communications Strategic transformation underway for return to growth Dividend Cut + New Capital Allocation Plan Aggressive Debt Paydown from Free Cash Flow Conservative Financial Policy Accelerate Investment in Business: $ 425M Committed Capital I nfusion Future - proof the Fib
Slide 6: Third Quarter 2020 Results
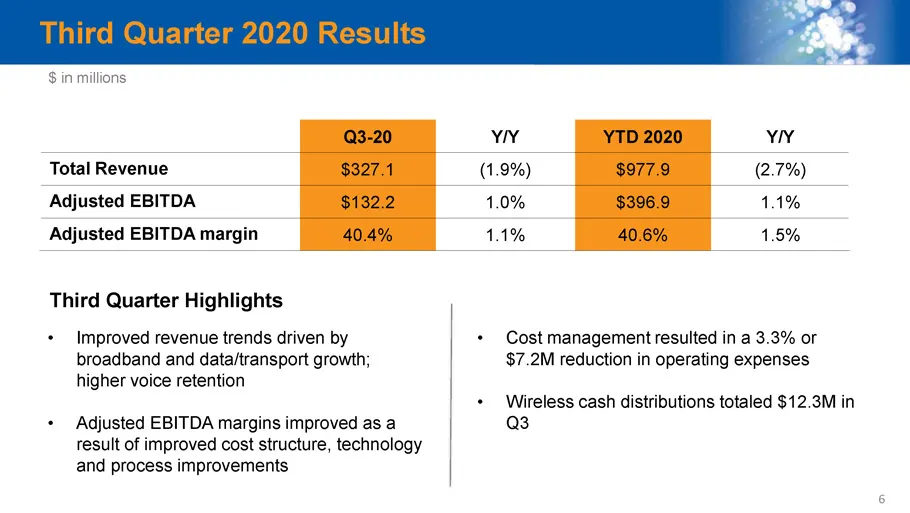
Third Quarter 2020 Results • Improved revenue trends driven by broadband and data/transport growth; higher voice retention • Adjusted EBITDA margins improved as a result of improved cost structure, technology and process improvements $ in millions • Cost management resulted in a 3.3% or $7.2M reduct
Slide 7: Commercial and Carrier Revenue
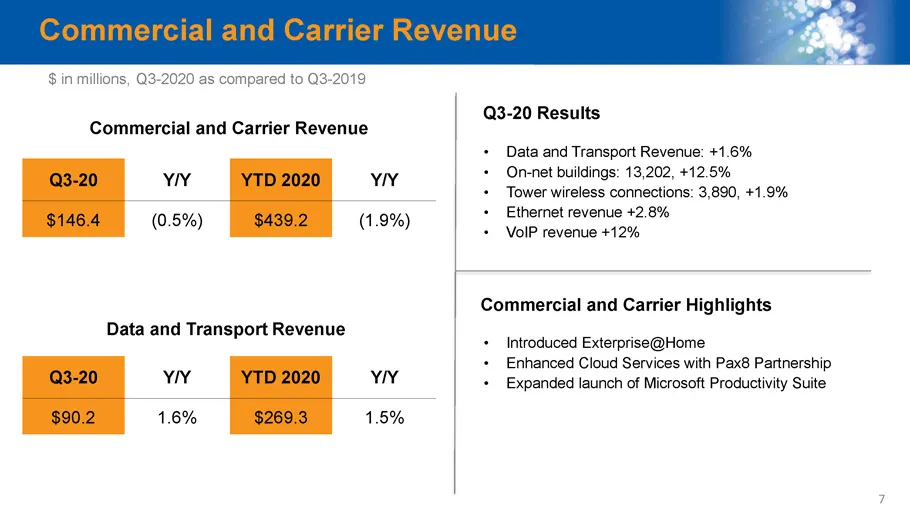
Commercial and Carrier Revenue Data and Transport Revenue $ in millions, Q3 - 2020 as compared to Q3 - 2019 • Data and Transport Revenue: +1.6% • On - net buildings: 13,202, +12.5% • Tower wireless connections: 3,890, +1.9% • Ethernet revenue +2.8% • VoIP revenue +12% • Introduced Exterprise@Home •
Slide 8: Consumer Revenue
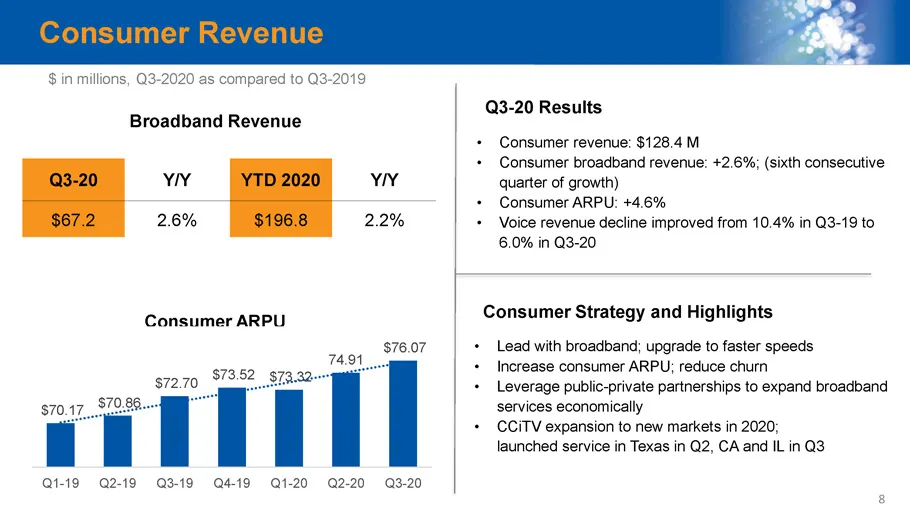
Consumer Revenue • Consumer revenue: $128.4 M • Consumer broadband revenue: +2.6%; (sixth consecutive quarter of growth) • Consumer ARPU: +4.6% • Voice revenue decline improved from 10.4% in Q3 - 19 to 6.0% in Q3 - 20 • Lead with broadband; upgrade to faster speeds • Increase consumer ARPU; reduce c
Slide 9: Capital Allocation and Liquidity Update
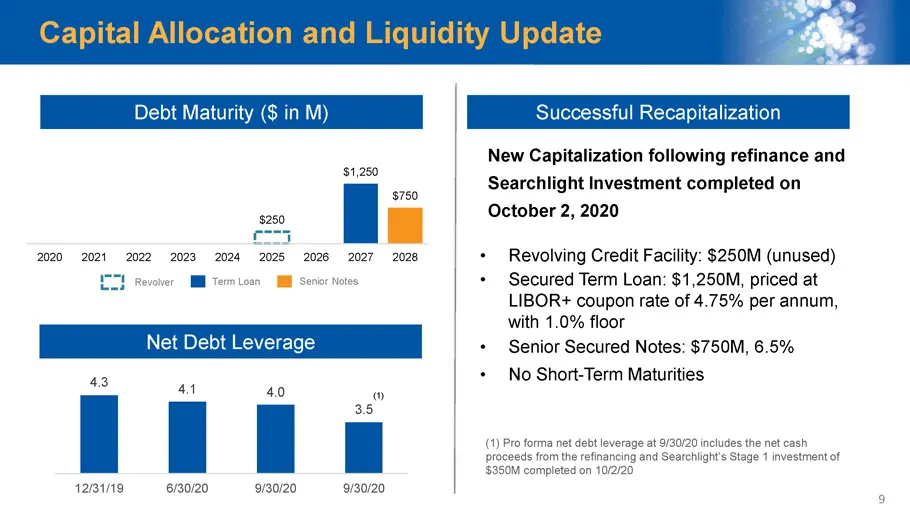
4.3 4.1 4.0 3.5 12/31/19 6/30/20 9/30/20 9/30/20 Capital Allocation and Liquidity Update Debt Maturity ($ in M) Net Debt Leverage • Revolving Credit Facility: $250M (unused) • Secured Term Loan: $1,250M, priced at LIBOR+ coupon rate of 4.75% per annum, with 1.0% floor • Senior Secured Notes: $750M,
Slide 10: Consolidated's Fiber-Rich Network
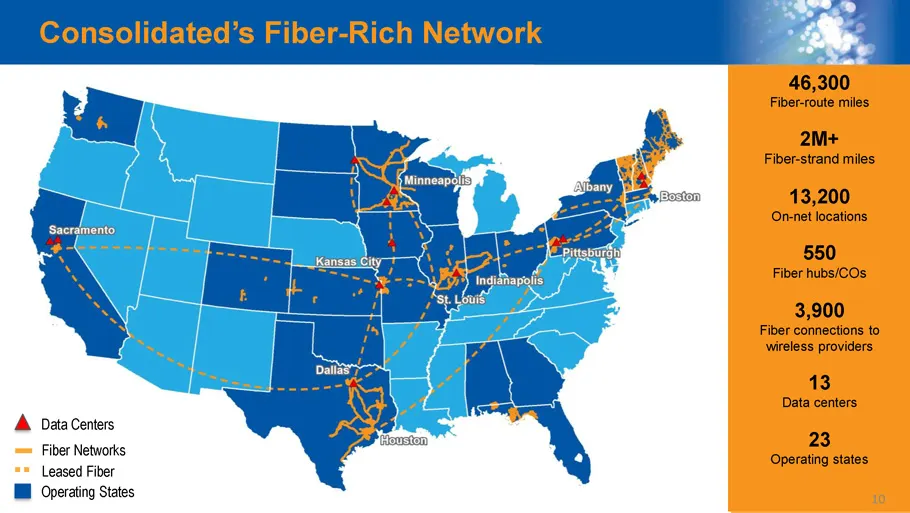
Consolidated’s Fiber - Rich Network 46,300 Fiber - route miles 2M+ Fiber - strand miles 13,200 On - net locations 550 F iber hub s/COs 3,900 F iber connections to wireless providers 13 Data centers 23 Operating states Data Centers Operating States Fiber Networks Leased Fiber 10
Slide 11: Consolidated Strategic Imperatives
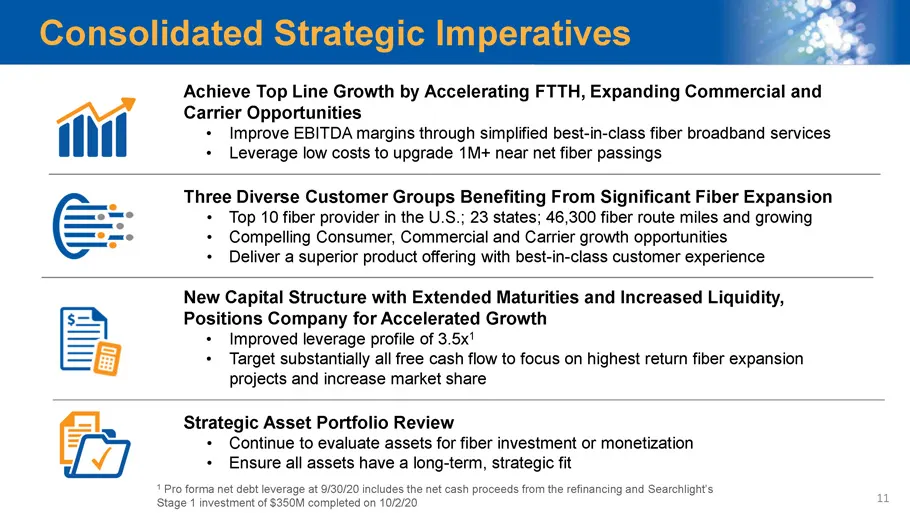
Consolidated Strategic Imperatives New Capital Structure with Extended Maturities and Increased Liquidity, Positions Company for Accelerated Growth • Improved leverage profile of 3.5x 1 • Target substantially all free cash flow to focus on highest return fiber expansion projects and increase market
Slide 12: Free Cash Flow
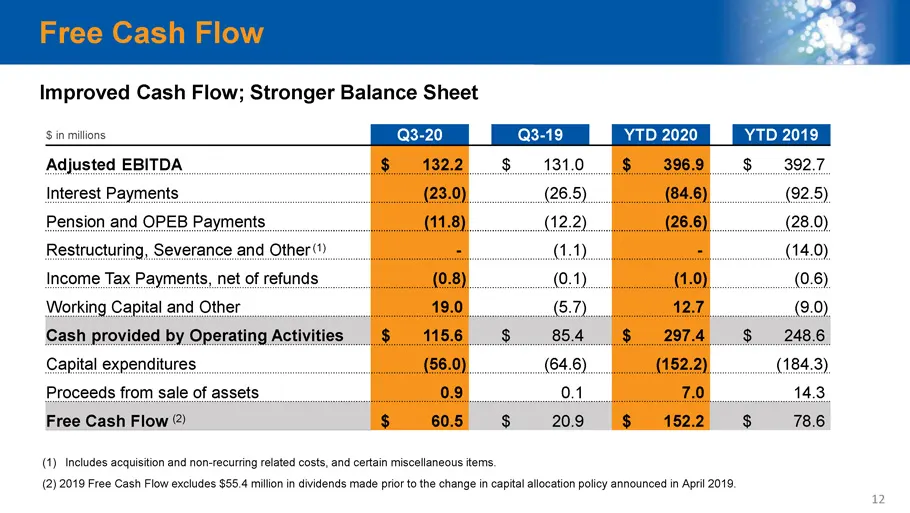
Free Cash Flow (1) Includes acquisition and non - recurring related costs, and certain miscellaneous items. (2) 2019 Free Cash Flow excludes $55.4 million in dividends made prior to the change in capital allocation policy announced in April 2019. Improved Cash Flow; Stronger Balance Sheet $ in milli

Slide 13: Q3 2020 Earnings Q&A
Q&A Q3 2020 Earnings OQ Consolidated’
Source: SEC EDGAR · 8-K filed Oct 29, 2020
More decks from Consolidated Communications
 Proxy Contest (January 2024)34 slides · Jan 11, 2024
 Merger or Acquisition (October 2023)7 slides · Oct 16, 2023
 Q2 2023 Earnings Presentation27 slides · Aug 8, 2023
 Q1 2023 Earnings Presentation28 slides · May 2, 2023
 Shareholder Meeting (May 2023)15 slides · May 1, 2023
 J.P. Morgan Global High Yield & Leveraged Finance Conference 202317 slides · Mar 7, 2023