DPL — Lehman Brothers CEO Energy / Power Conference 2007
28 slides from DPL's conference presentation, Sep 7, 2007
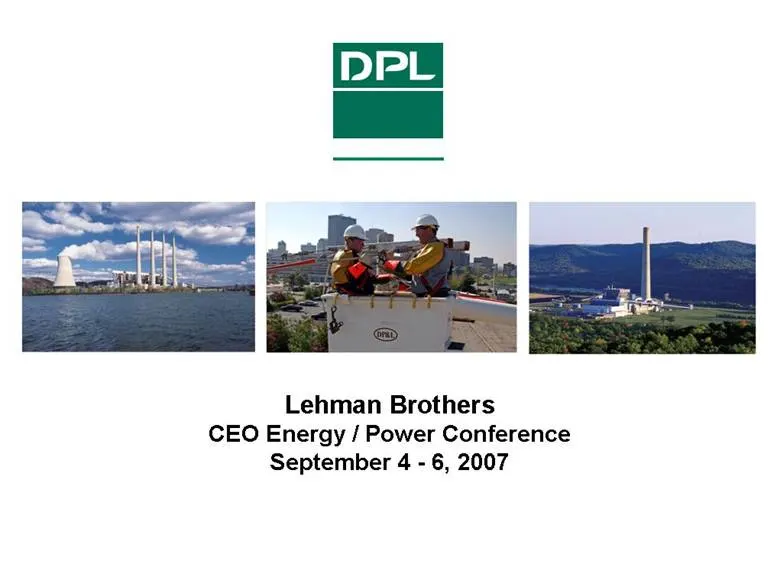
Slide 1: Lehman Brothers CEO Energy / Power Conference September 4-6, 2007
Lehman Brothers CEO Energy / Power Conference September 4 - 6, 2007
Slide 2: Table of Contents
Table of Contents Forward Looking Statement 3 Company Overview 4 Strategic Focus 5 Current Environment 6 Mature Growth Region 7-10 Electric Restructuring 11-13 Fuel Prices 14-17 Environmental Policies 18-20 Generation Technology Development 21-22 Position for Future Growth 23 Appendix 24 Year-to-Dat
Slide 3: Notice Regarding Forward Looking Statement
Notice Regarding Forward Looking Statement Certain statements contained in this presentation are “forward-looking statements” within the meaning of the Private Securities Litigation Reform Act of 1995. Matters discussed in press release that relate to events or developments that are expected to occu
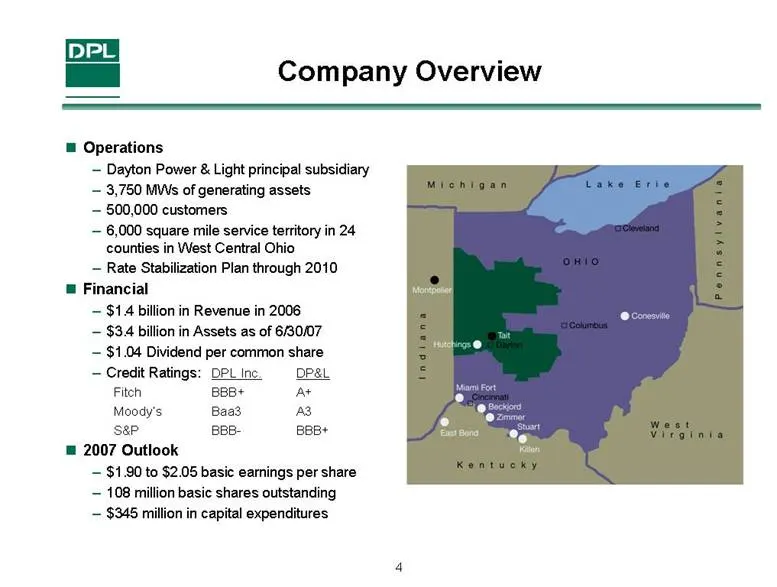
Slide 4: Company Overview
Company Overview Operations Dayton Power & Light principal subsidiary 3,750 MWs of generating assets 500,000 customers 6,000 square mile service territory in 24 counties in West Central Ohio Rate Stabilization Plan through 2010 Financial $1.4 billion in Revenue in 2006 $3.4 billion in Assets as of 6
Slide 5: Strategic Focus
Strategic Focus Invest in our core utility assets and continuously improve operational efficiency Expand the depth and skill sets of our workforce Complete our existing environmental initiatives, while planning for future scenarios Continue to deliver an attractive return to our investors Identify o
Slide 6: Current Environment
Current Environment Service Area is a Mature Growth Region Annual load growth of approximately 1% Unpredictable Outcome to Electric Restructuring Energy Markets Experiencing Volatile Fuel Prices and Increasing Security Concerns Evolving Environmental Policies at both the State and Federal Level Unpr
Slide 7: Mature Growth ...What have we done? Base load coal heat rate
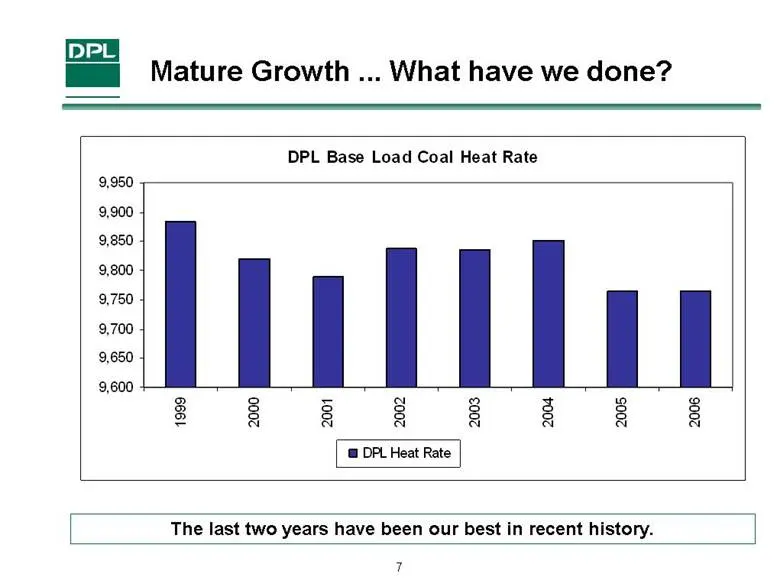
Mature Growth ...What have we done? The last two years have been our best in recent history. DPL Base Load Coal Heat Rate 9,600 9,650 9,700 9,750 9,800 9,850 9,900 9,950 1999 2000 2001 2002 2003 2004 2005 2006 DPL Heat Rate
Slide 8: Mature Growth ...What have we done? Service operations O&M
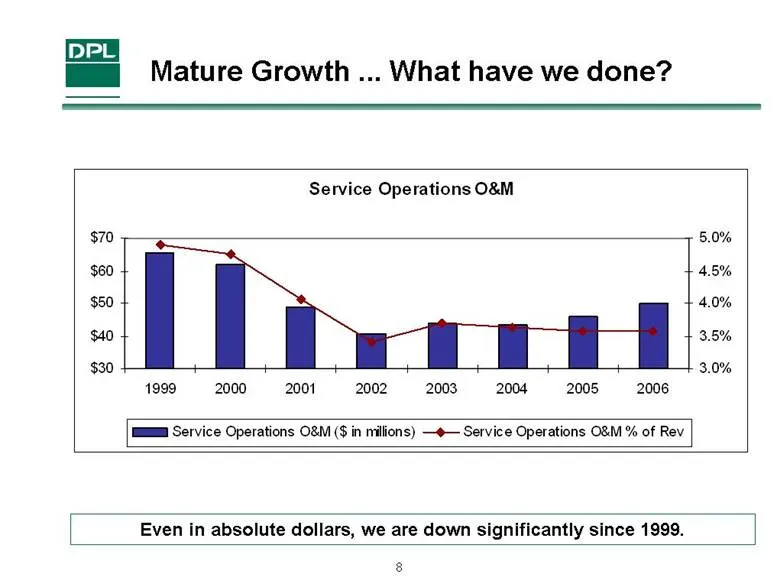
Mature Growth ...What have we done? Even in absolute dollars, we are down significantly since 1999. Service Operations O&M $30 $40 $50 $60 $70 1999 2000 2001 2002 2003 2004 2005 2006 3.0% 3.5% 4.0% 4.5% 5.0% Service Operations O&M ($ in millions) Service Operations O&M % of Rev
Slide 9: Mature Growth ...What have we done? 2006 O&M expense ratio
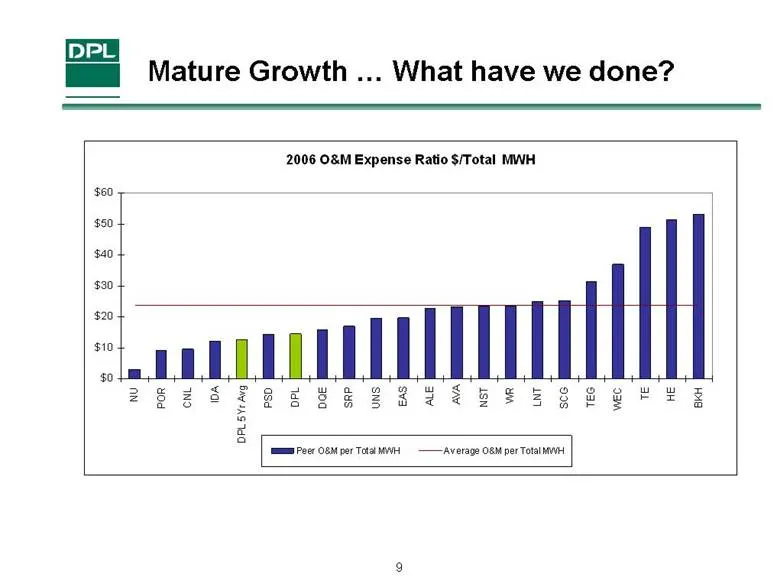
Mature Growth ...What have we done? 2006 O&M Expense Ratio $/Total MWH $0 $10 $20 $30 $40 $50 $60 NU POR CNL IDA DPL 5Yr Avg PSD DPL DQE SRP UNS EAS ALE AVA NST WR LNT SCG TEG WEC TE HE BKH Peer O&M per Total MWH Average O&M per Total MWH
Slide 10: Mature Growth What are we doing?
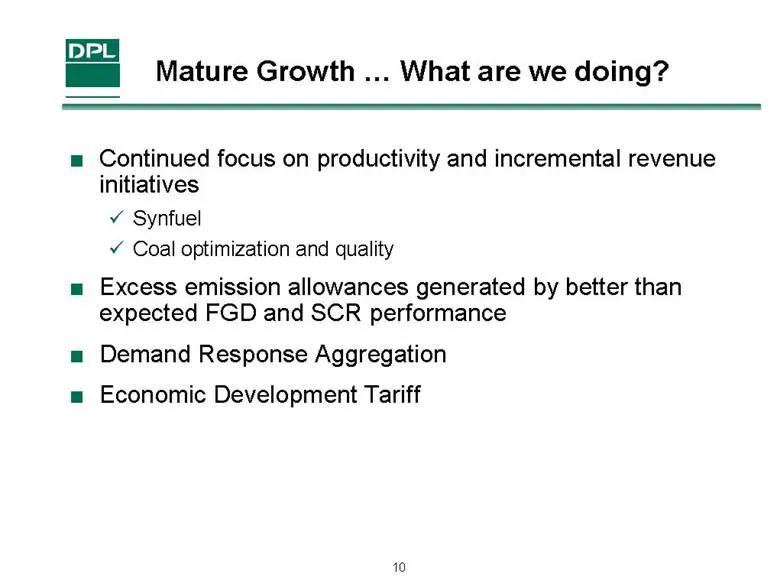
Mature Growth What are we doing? Continued focus on productivity and incremental revenue initiatives Synfuel Coal optimization and quality Excess emission allowances generated by better than expected FGD and SCR performance Demand Response Aggregation Economic Development Tariff
Slide 11: Unpredictable Outcome to Electric Restructuring
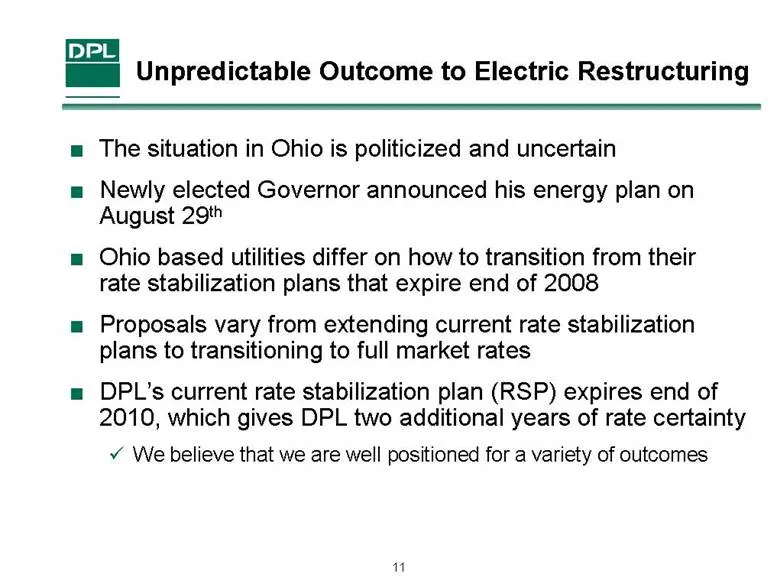
Unpredictable Outcome to Electric Restructuring The situation in Ohio is politicized and uncertain Newly elected Governor announced his energy plan on August 29th Ohio based utilities differ on how to transition from their rate stabilization plans that expire end of 2008 Proposals vary from extendin
Slide 12: DPL's Rate Stabilization Plan
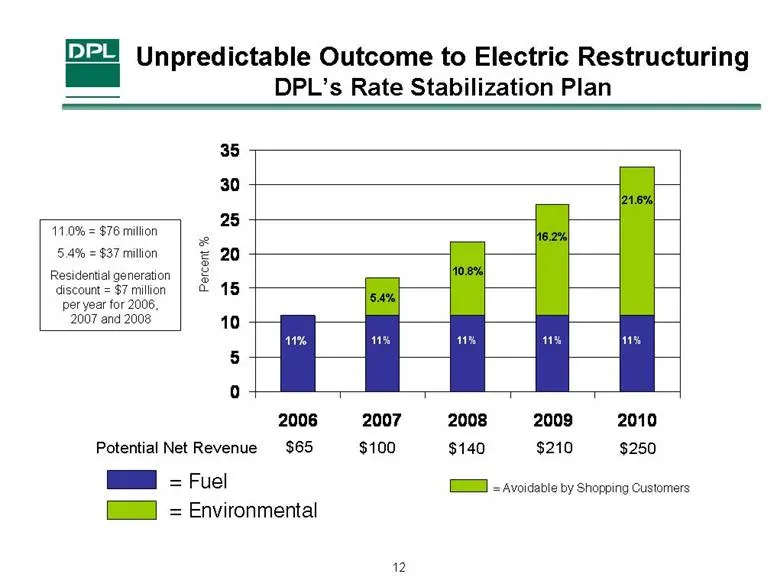
Unpredictable Outcome to Electric Restructuring DPL’s Rate Stabilization Plan 11% 16.4% 21.8% 27.2% 32.6% 11% 5.4% 11% 11% 11% 11% 11.0% = $76 million 5.4% = $37 million Residential generation discount = $7 million per year for 2006, 2007 and 2008 10.8% 16.2% Percent % Potential Net Revenue $65 $100
Slide 13: DPL's Legislative Strategy
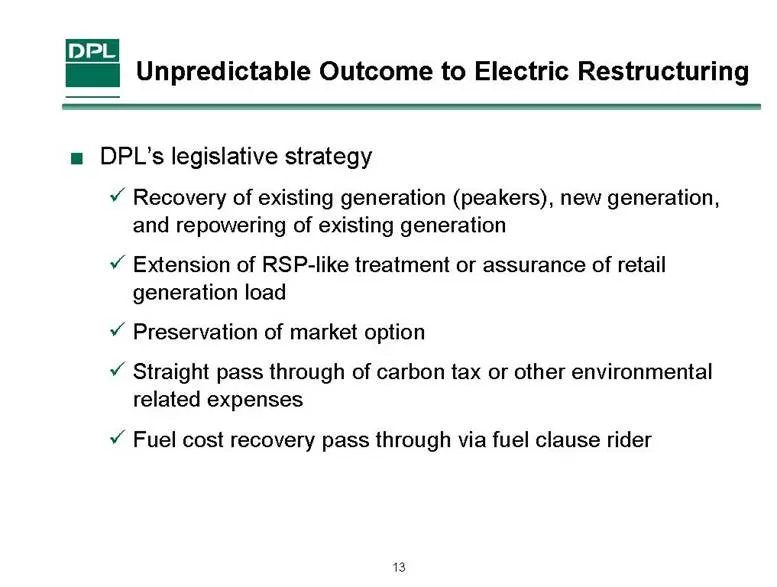
Unpredictable Outcome to Electric Restructuring DPL’s legislative strategy Recovery of existing generation (peakers), new generation, and repowering of existing generation Extension of RSP-like treatment or assurance of retail generation load Preservation of market option Straight pass through of ca
Slide 14: Volatile Fuel Prices Have Impacted Energy Markets
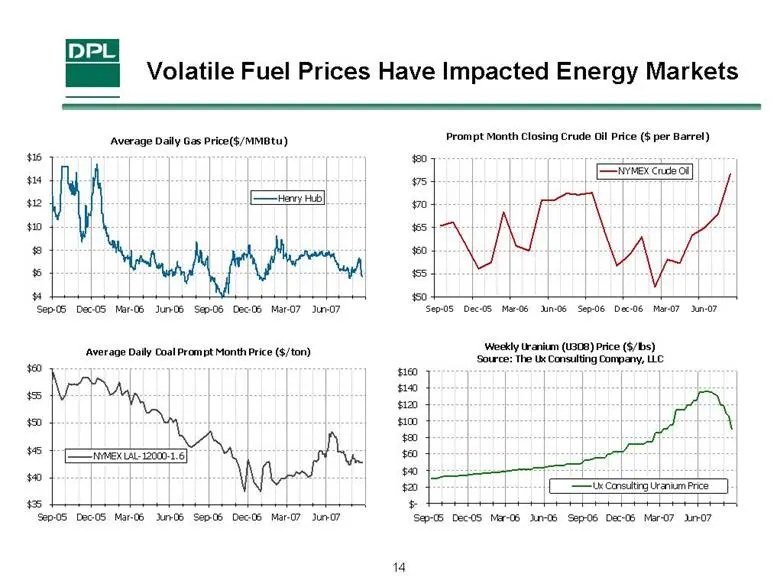
Volatile Fuel Prices Have Impacted Energy Markets Weekly Uranium (U3O8) Price ($/lbs) Source: The Ux Consulting Company, LLC $- $20 $40 $60 $80 $100 $120 $140 $160 Sep-05 Dec-05 Mar-06 Jun-06 Sep-06 Dec-06 Mar-07 Jun-07 Ux Consulting Uranium Price Prompt Month Closing Crude Oil Price ($ per Barrel)
Slide 15: Volatile Fuel Prices: Coal Burn Hedged for DPL Operated Plants
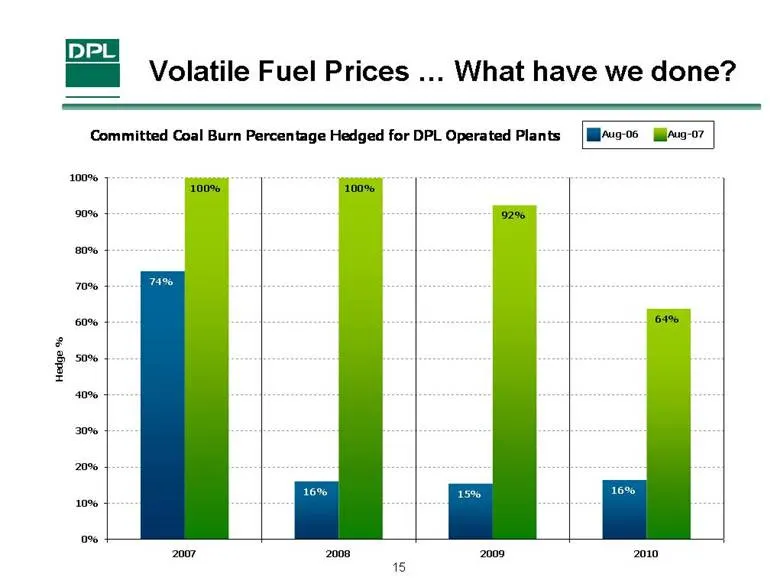
Volatile Fuel Prices What have we done? Committed Coal Burn Percentage Hedged for DPL Operated Plants 74% 16% 15% 16% 100% 100% 92% 64% 0% 10% 20% 30% 40% 50% 60% 70% 80% 90% 100% 2007 2008 2009 2010 Hedge % Aug-06 Aug-07
Slide 16: Volatile Fuel Prices: Coal Burn Hedged for Entire Fleet
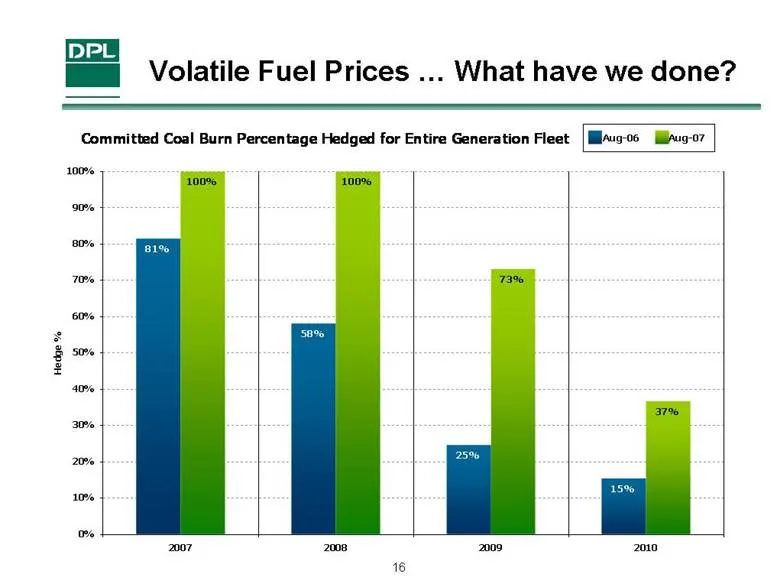
Volatile Fuel Prices ... What have we done? Committed Coal Burn Percentage Hedged for Entire Generation Fleet 81% 58% 25% 15% 100% 100% 73% 37% 0% 10% 20% 30% 40% 50% 60% 70% 80% 90% 100% 2007 2008 2009 2010 Hedge % Aug-06 Aug-07
Slide 17: Volatile Fuel Prices ... What have we done?
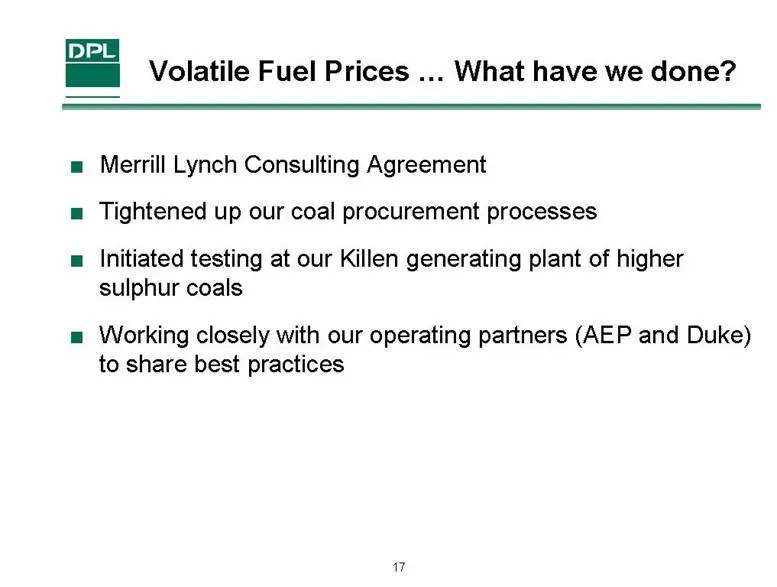
Volatile Fuel Prices ... What have we done? Merrill Lynch Consulting Agreement Tightened up our coal procurement processes Initiated testing at our Killen generating plant of higher sulphur coals Working closely with our operating partners (AEP and Duke) to share best practices
Slide 18: Evolving Environmental Policies
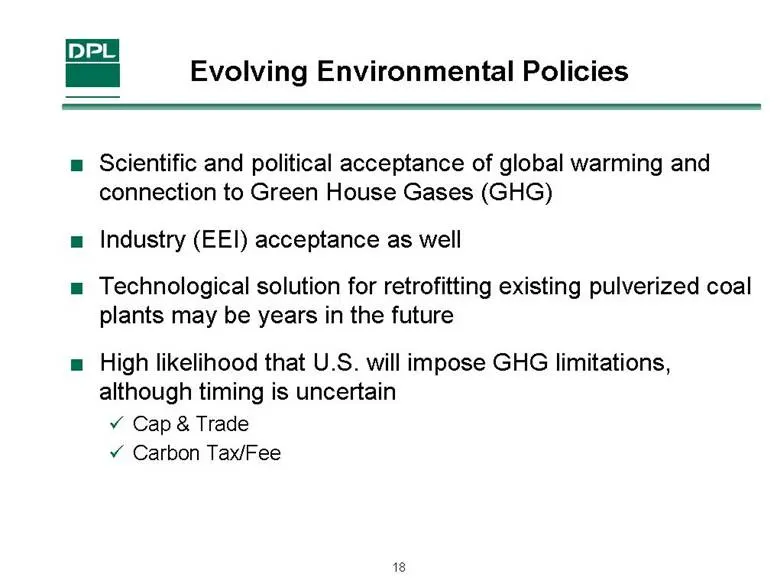
Evolving Environmental Policies Scientific and political acceptance of global warming and connection to Green House Gases (GHG) Industry (EEI) acceptance as well Technological solution for retrofitting existing pulverized coal plants may be years in the future High likelihood that U.S. will impose G
Slide 19: Evolving Environmental Policies: What have we done?
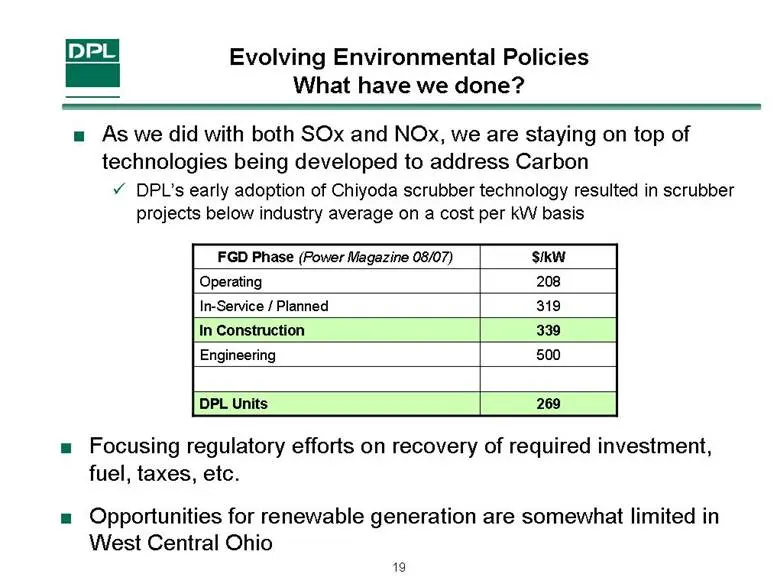
Evolving Environmental Policies What have we done? As we did with both SOx and NOx, we are staying on top of technologies being developed to address Carbon DPL’s early adoption of Chiyoda scrubber technology resulted in scrubber projects below industry average on a cost per kW basis 269 DPL Units 50
Slide 20: Evolving Environmental Policies: What are we working towards?
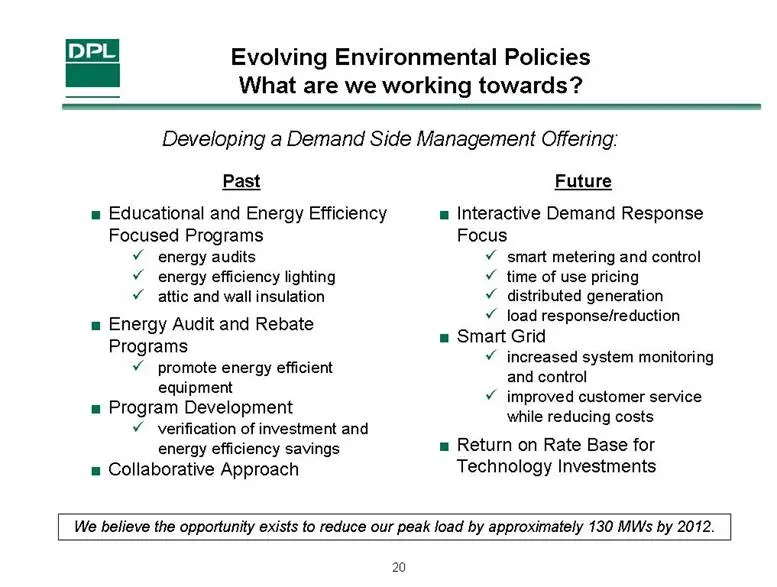
Past Educational and Energy Efficiency Focused Programs energy audits energy efficiency lighting attic and wall insulation Energy Audit and Rebate Programs promote energy efficient equipment Program Development verification of investment and energy efficiency savings Collaborative Approach Future In
Slide 21: Unpredictable Generation Technology Development
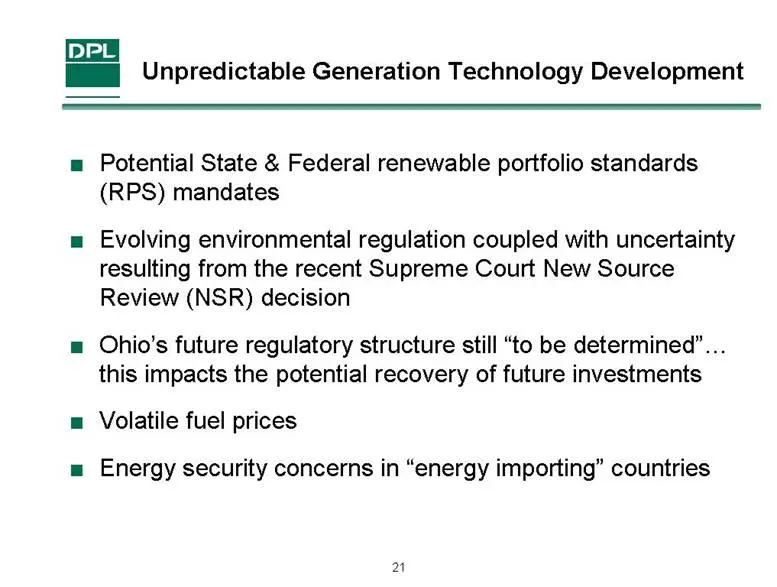
Unpredictable Generation Technology Development Potential State & Federal renewable portfolio standards (RPS) mandates Evolving environmental regulation coupled with uncertainty resulting from the recent Supreme Court New Source Review (NSR) decision Ohio’s future regulatory structure still “to be d
Slide 22: Unpredictable Generation Technology Development: What have we done?
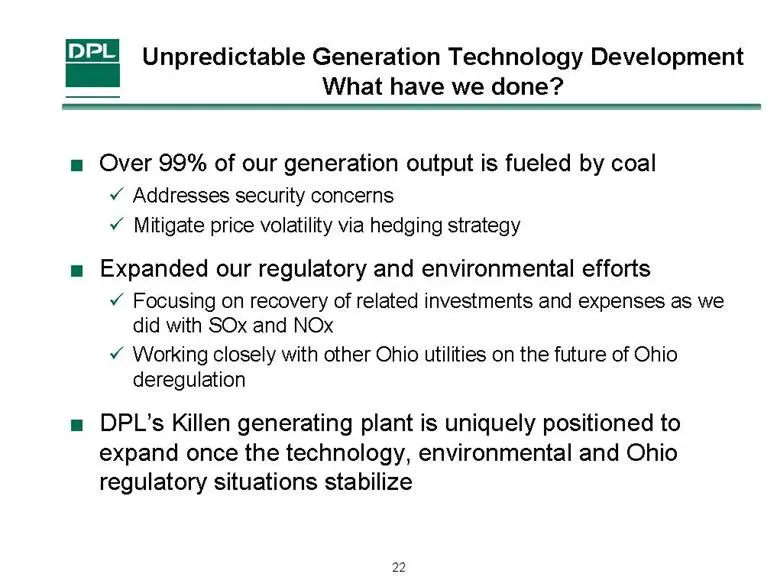
Unpredictable Generation Technology Development What have we done? Over 99% of our generation output is fueled by coal Addresses security concerns Mitigate price volatility via hedging strategy Expanded our regulatory and environmental efforts Focusing on recovery of related investments and expenses
Slide 23: DPL is Positioned for Future Growth
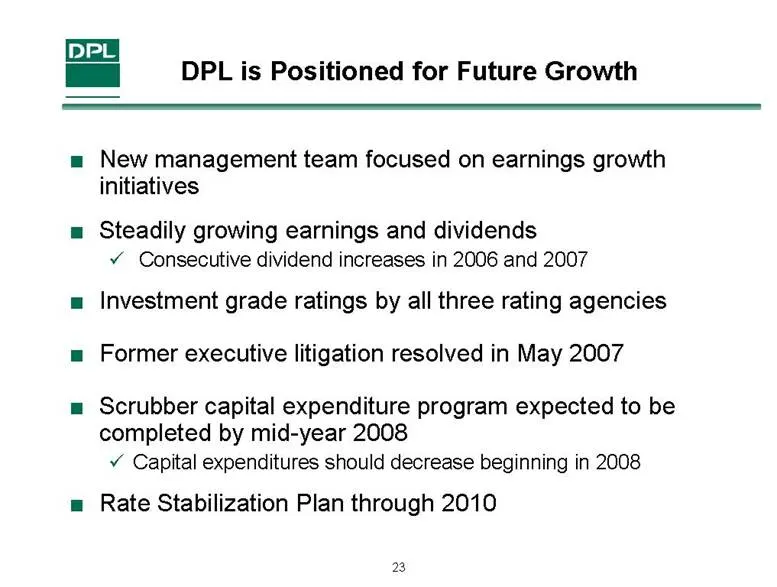
DPL is Positioned for Future Growth New management team focused on earnings growth initiatives Steadily growing earnings and dividends Consecutive dividend increases in 2006 and 2007 Investment grade ratings by all three rating agencies Former executive litigation resolved in May 2007 Scrubber capit
Slide 24: Appendix
DPL Appendix
Slide 25: Year-to-Date Highlights
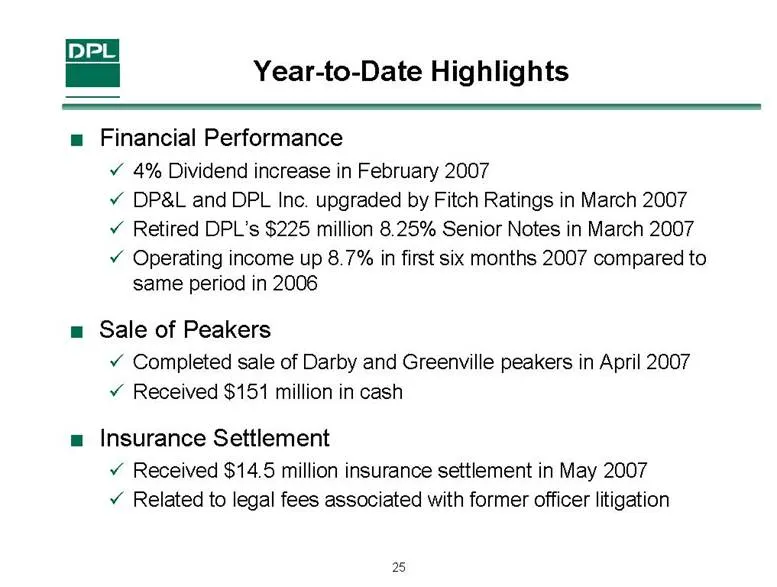
Year-to-Date Highlights Financial Performance 4% Dividend increase in February 2007 DP&L and DPL Inc. upgraded by Fitch Ratings in March 2007 Retired DPL’s $225 million 8.25% Senior Notes in March 2007 Operating income up 8.7% in first six months 2007 compared to same period in 2006 Sale of Peakers
Slide 26: Year-to-Date Highlights
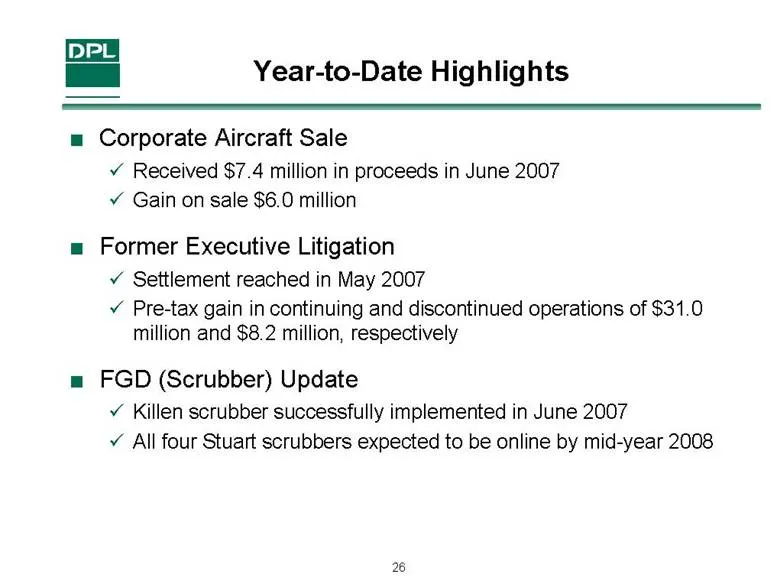
Year-to-Date Highlights Corporate Aircraft Sale Received $7.4 million in proceeds in June 2007 Gain on sale $6.0 million Former Executive Litigation Settlement reached in May 2007 Pre-tax gain in continuing and discontinued operations of $31.0 million and $8.2 million, respectively FGD (Scrubber) Up
Slide 27: Earnings Per Share
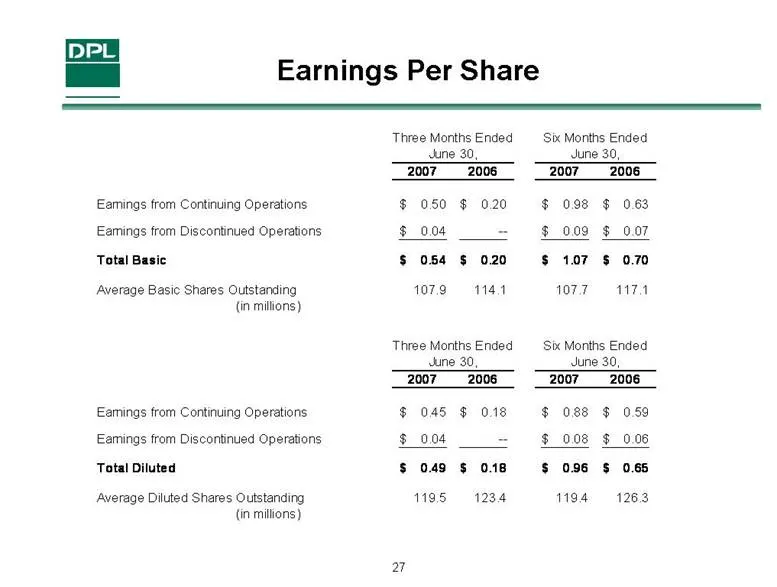
Earnings Per Share 2007 2006 2007 2006 Earnings from Continuing Operations 0.50 $ 0.20 $ 0.98 $ 0.63 $ Earnings from Discontinued Operations 0.04 $ -- 0.09 $ 0.07 $ Total Basic 0.54 $ 0.20 $ 1.07 $ 0.70 $ Average Basic Shares Outstanding 107.9 114.1 107.7 117.1 2007 2006 2007 2006 Earnings from Cont
Slide 28: Lehman Brothers CEO Energy / Power Conference September 4-6, 2007
Lehman Brothers CEO Energy / Power Conference September 4 - 6, 2007
Source: SEC EDGAR · 8-K filed Sep 7, 2007
More decks from DPL Inc
 Debt Investor Presentation (August 2016)12 slides · Aug 8, 2016
 Q1 2011 Earnings Presentation28 slides · Apr 29, 2011
 FY2010 Earnings Presentation15 slides · Feb 17, 2011
 Non-Deal Roadshow (December 2010)24 slides · Dec 10, 2010
 Q3 2010 Earnings Presentation18 slides · Oct 29, 2010
 Non-Deal Roadshow (September 2010)24 slides · Sep 14, 2010