Mr. Cooper — Nationstar Mortgage Holdings — Investor Presentation (December 2015)
18 slides from Mr. Cooper's investor presentation, Dec 17, 2015
Slide 1: Nationstar Update December 17, 2015
Nationstar Update December 17, 2015 Helping You Achieve More
Slide 2: Disclaimers
Disclaimers Forward Looking Statements Any statements in this presentation that are not historical or current facts are forward looking statements. These forward looking statements include, but are not limited to, statements regarding: our 2016 corporate initiatives and goals, servicing profitabilit
Slide 3: Nationstar Overview
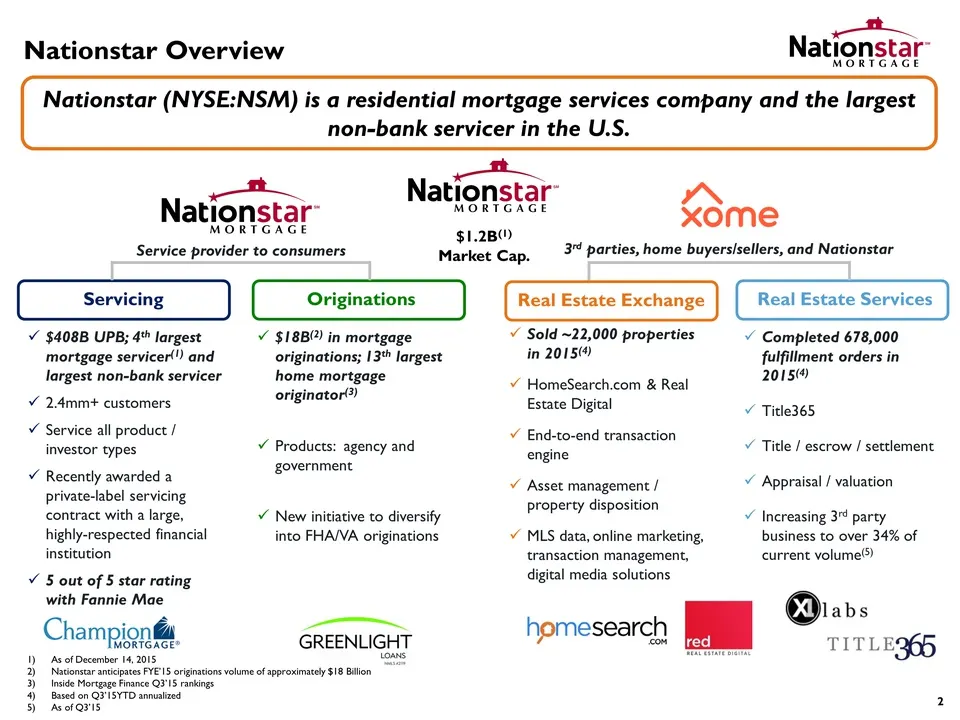
Nationstar Overview Nationstar (NYSE:NSM) is a residential mortgage services company and the largest non-bank servicer in the U.S. Servicing Originations $408B UPB; 4th largest mortgage servicer(1) and largest non-bank servicer 2.4mm+ customers Service all product / investor types Recently awarded a
Slide 4: 2015 Highlights
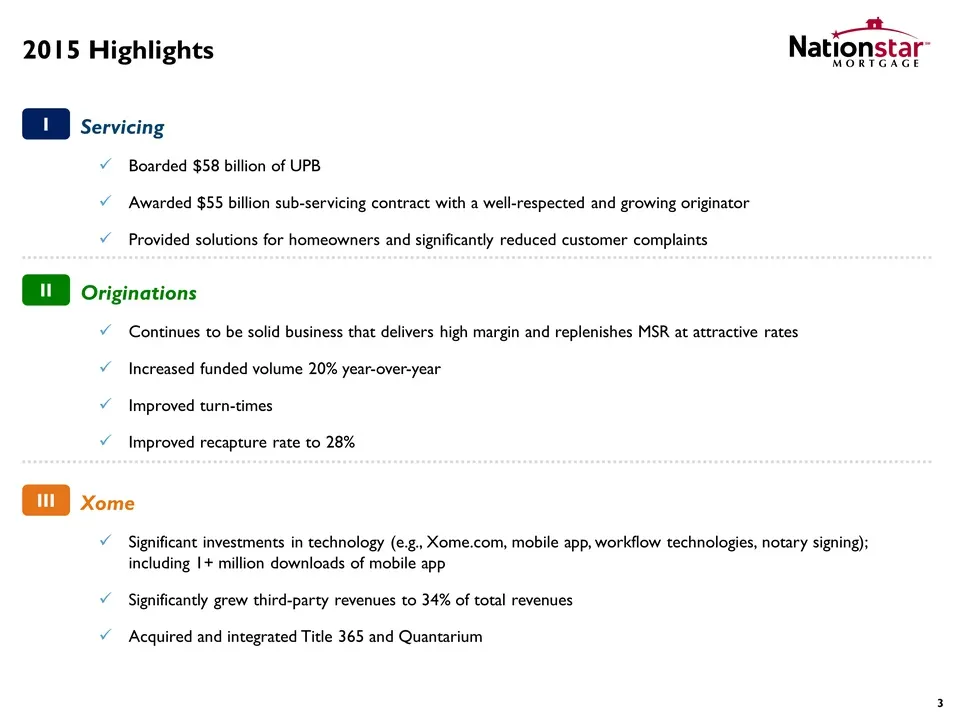
2015 Highlights I Servicing Boarded $58 billion of UPB Awarded $55 billion sub-servicing contract with a well-respected and growing originator Provided solutions for homeowners and significantly reduced customer complaints II Originations Continues to be solid business that delivers high margin and
Slide 5: Cash Flow Earnings Per Share
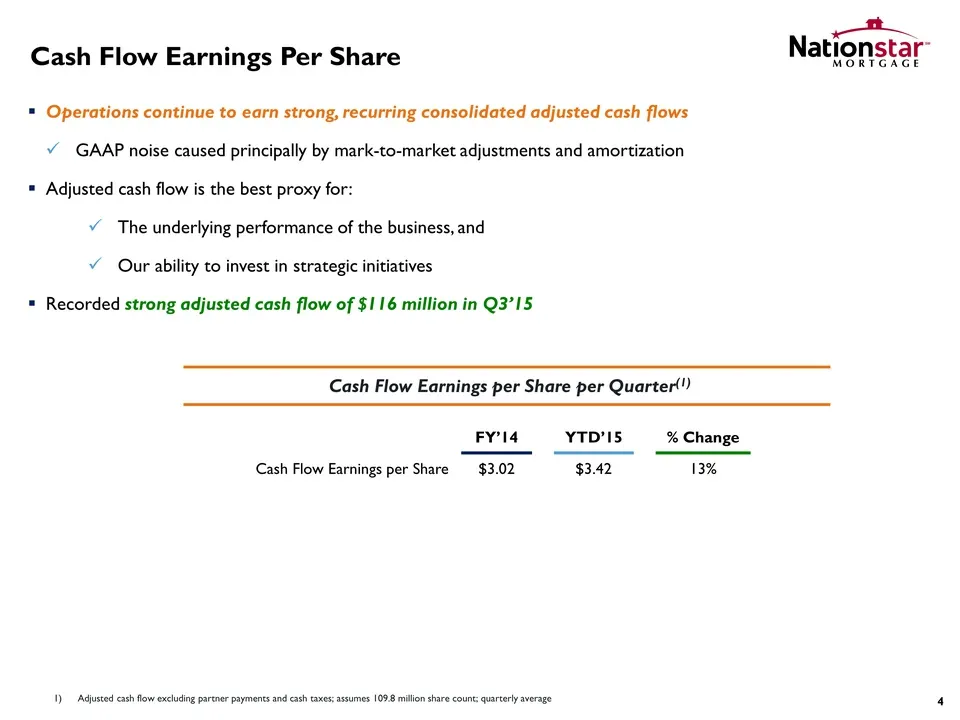
Cash Flow Earnings Per Share Operations continue to earn strong, recurring consolidated adjusted cash flows GAAP noise caused principally by mark-to-market adjustments and amortization Adjusted cash flow is the best proxy for: The underlying performance of the business, and Our ability to invest in
Slide 6: Capital Allocation Strategy
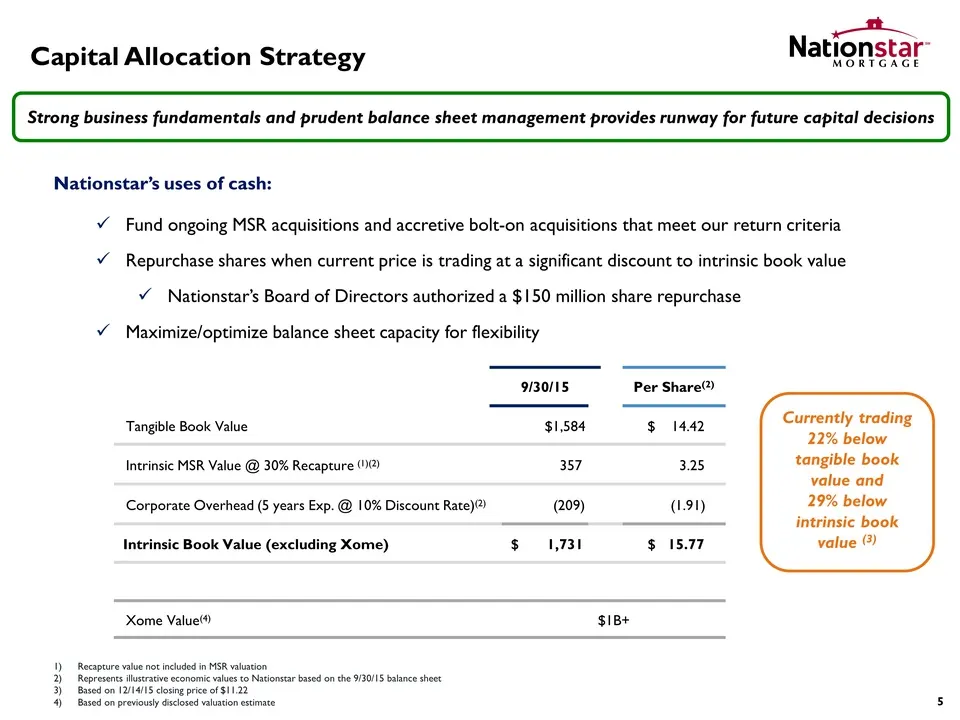
Capital Allocation Strategy Strong business fundamentals and prudent balance sheet management provides runway for future capital decisions Nationstar uses of cash: Fund ongoing MSR acquisitions and accretive bolt-on acquisitions that meet our return criteria Repurchase shares when current price is t
Slide 7: Servicing Highlights
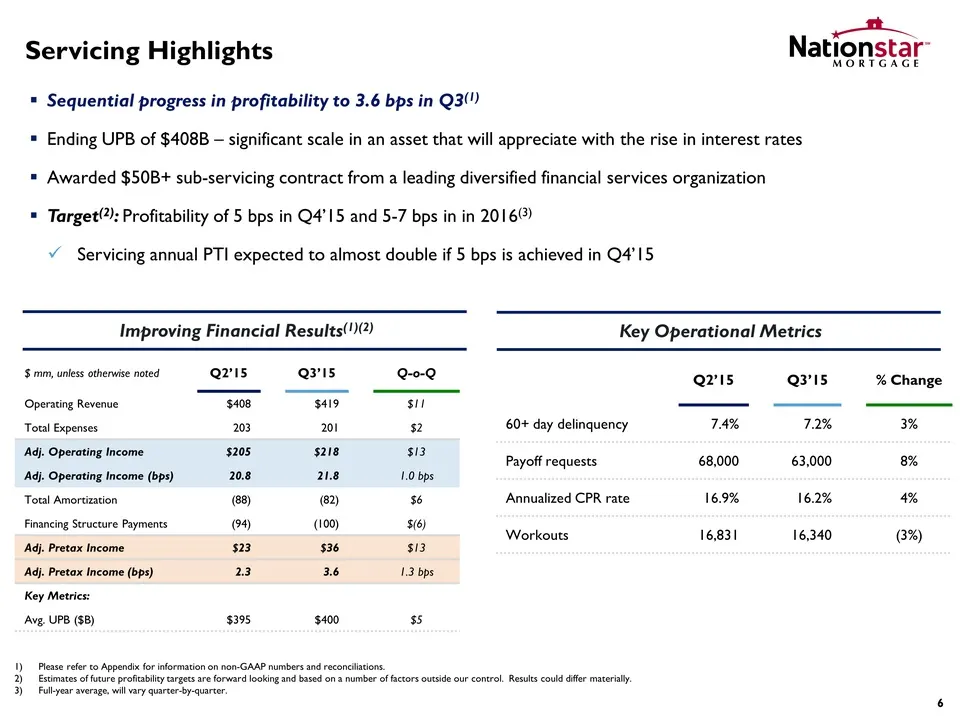
Servicing Highlights Sequential progress in profitability to 3.6 bps in Q3(1) Ending UPB of $408B – significant scale in an asset that will appreciate with the rise in interest rates Awarded $50B+ sub-servicing contract from a leading diversified financial services organization Target(2): Profitabil
Slide 8: Positioned for a Rising Rate Environment
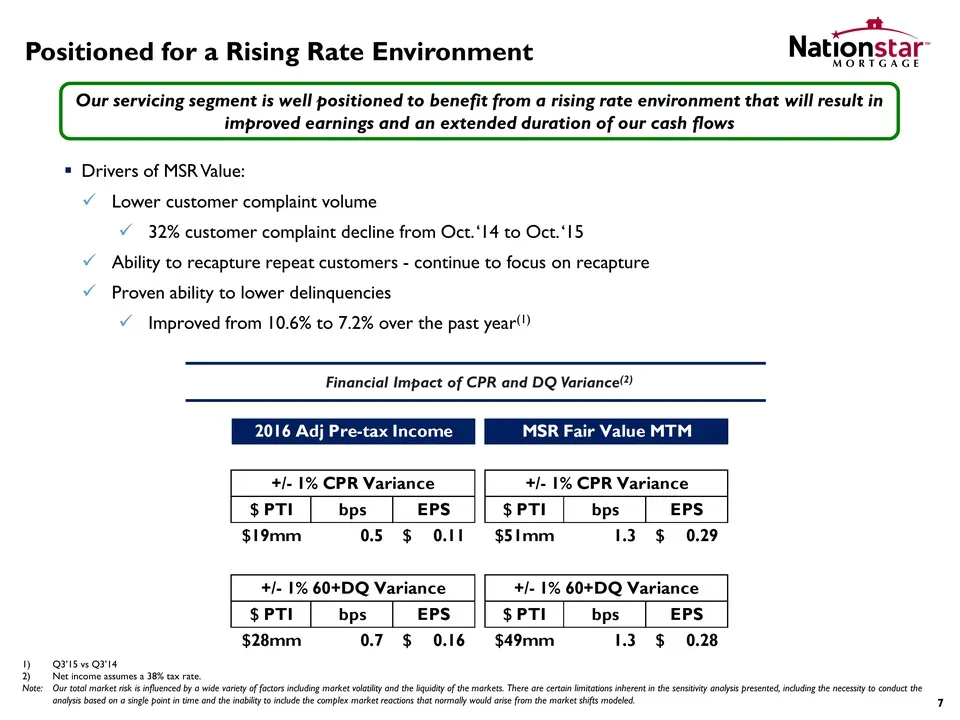
Positioned for a Rising Rate Environment Our servicing segment is well positioned to benefit from a rising rate environment that will result in improved earnings and an extended duration of our cash flows Drivers of MSR Value: Lower customer complaint volume 32% customer complaint decline from Oct.
Slide 9: Originations Highlights
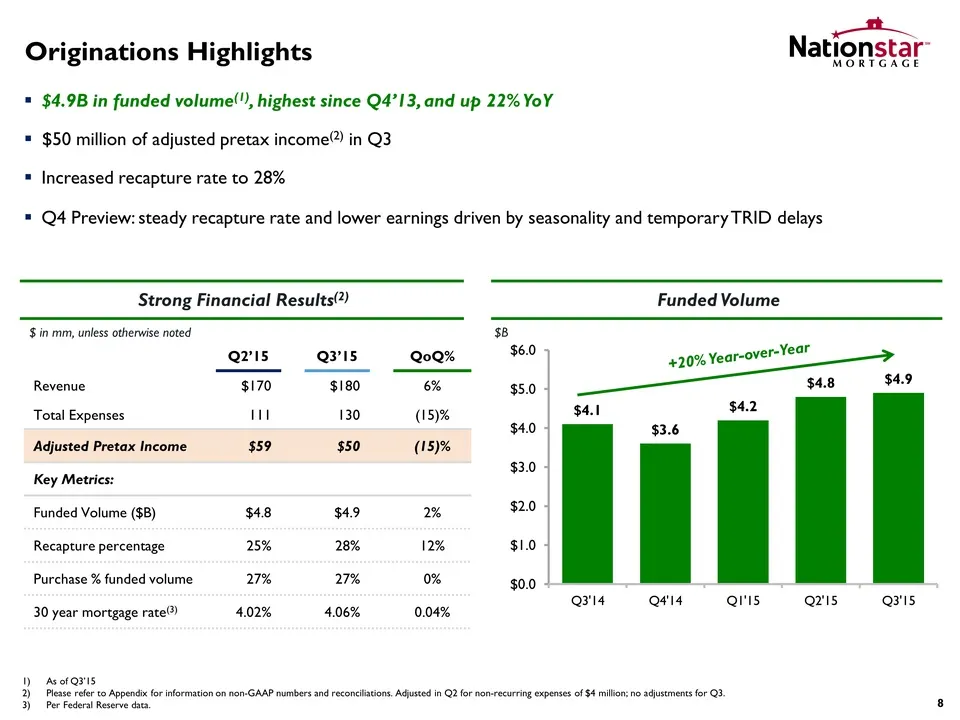
Originations Highlights $4.9B in funded volume(1), highest since Q4’13, and up 22% YoY $50 million of adjusted pretax income(2) in Q3 Increased recapture rate to 28% Q4 Preview: steady recapture rate and lower earnings driven by seasonality and temporary TRID delays Strong Financial Results(2) $ in
Slide 10: Building Off A Strong Platform
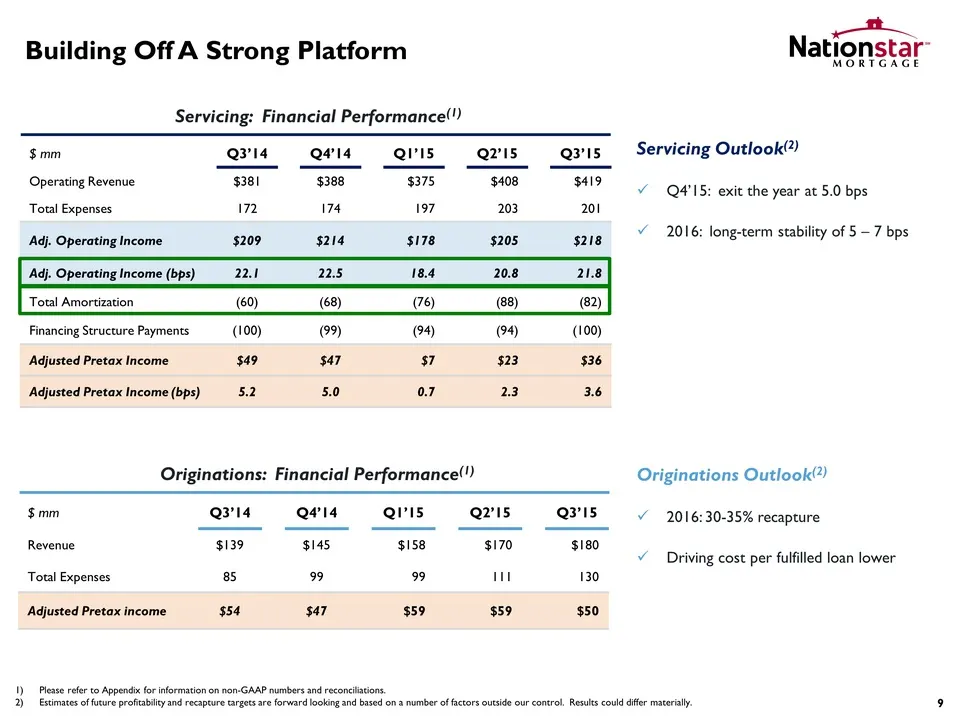
Building Off A Strong Platform Servicing: Financial Performance(1) $ mm Q3’14 Q4’14 Q1’15 Q2’15 Q3’15 Operating Revenue $381 $388 $375 $408 $419 Total Expenses 172 174 197 203 201 Adj. Operating Income $209 $214 $178 $205 $218 Adj. Operating Income (bps) 22.1 22.5 18.4 20.8 21.8 Total Amortization (
Slide 11: Xome Highlights
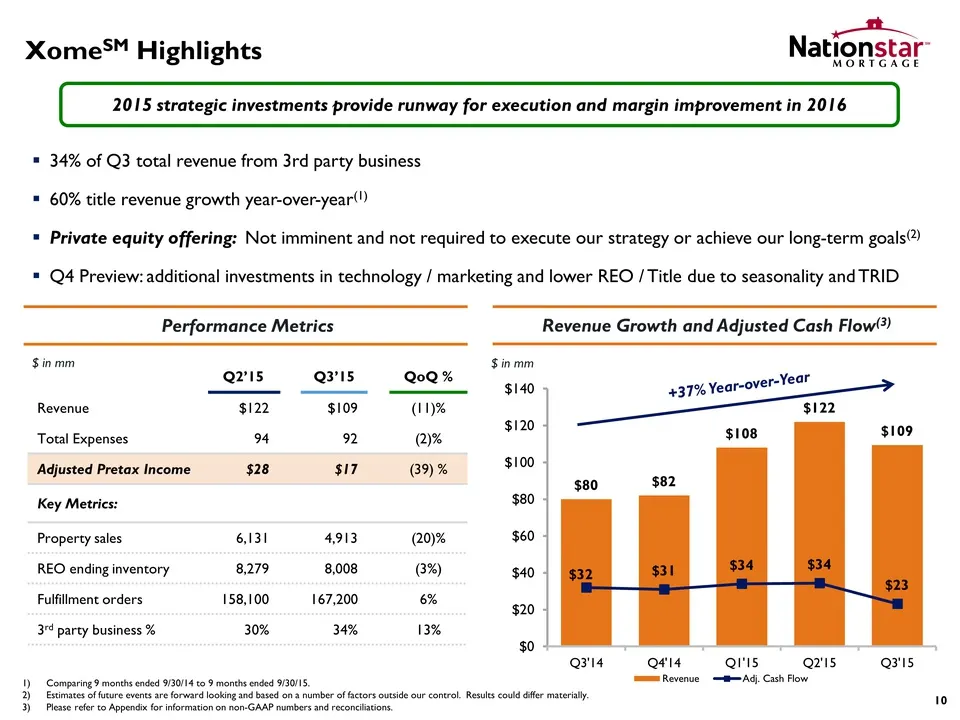
XomeSM Highlights 2015 strategic investments provide runway for execution and margin improvement in 2016 34% of Q3 total revenue from 3rd party business 60% title revenue growth year-over-year(1) Private equity offering: Not imminent and not required to execute our strategy or achieve our long-term
Slide 12: Our Commitment to Customer Experience
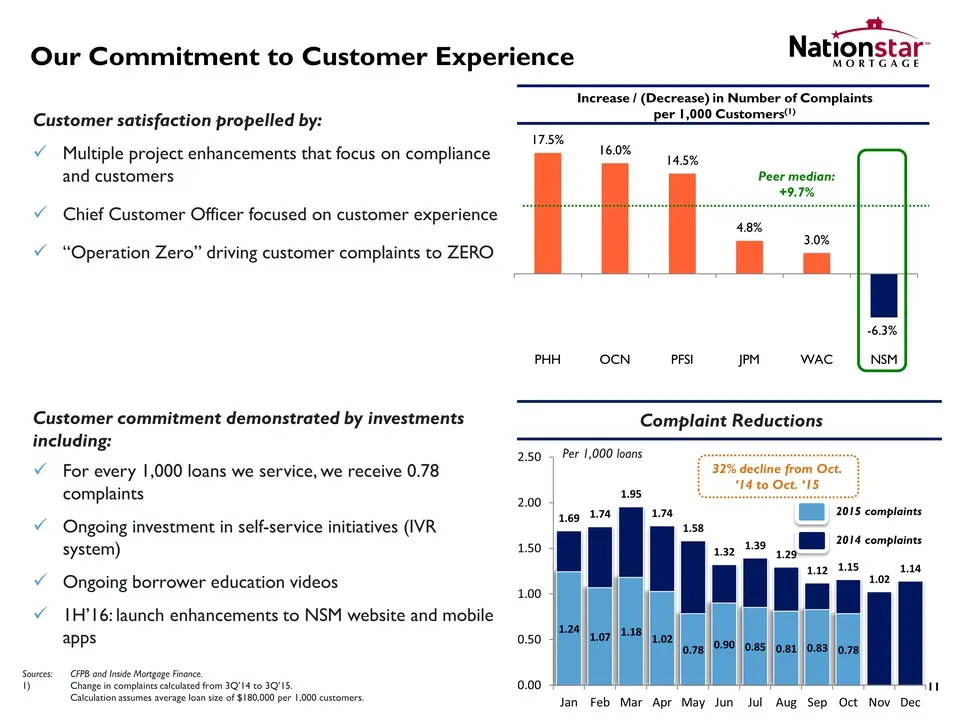
Our Commitment to Customer Experience Customer satisfaction propelled by: Multiple project enhancements that focus on compliance and customers Chief Customer Officer focused on customer experience “Operation Zero” driving customer complaints to ZERO Increase / (Decrease) in Number of Complaints per
Slide 13: Experienced Senior Management Team
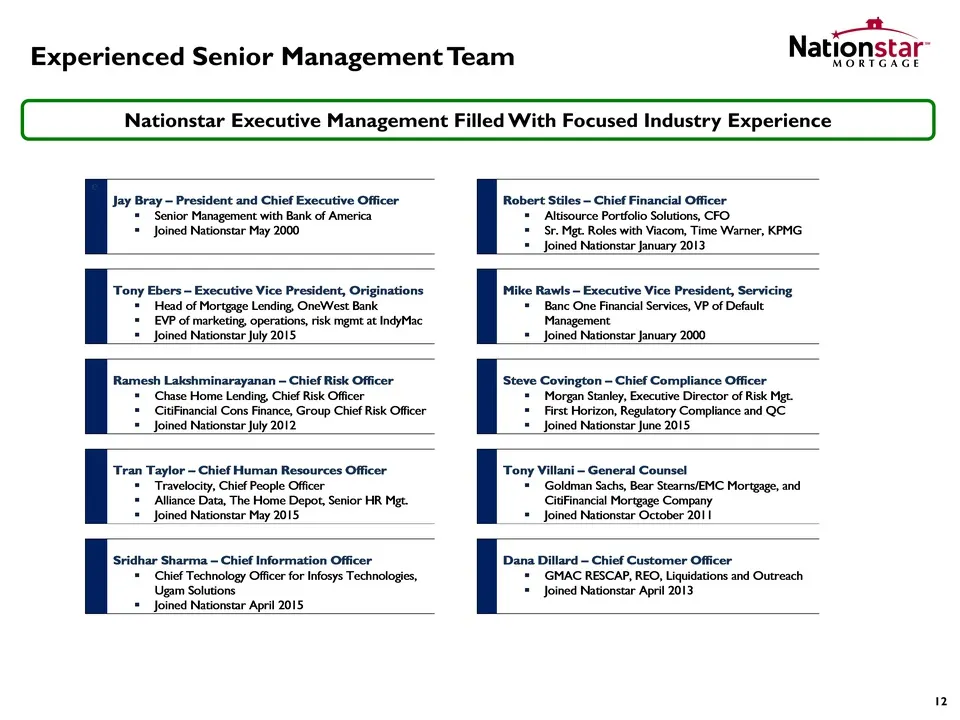
Experienced Senior Management Team Nationstar Executive Management Filled With Focused Industry Experience Jay Bray – President and Chief Executive Officer Senior Management with Bank of America Joined Nationstar May 2000 Robert Stiles – Chief Financial Officer Altisource Portfolio Solutions, CFO Sr
Slide 14: Endnotes
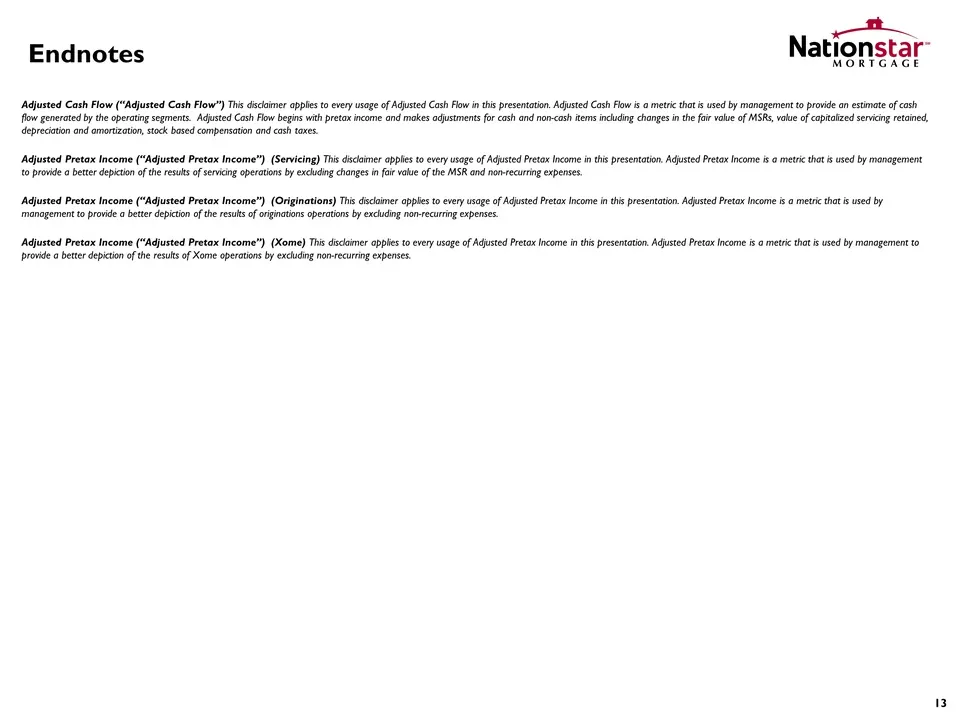
Endnotes Adjusted Cash Flow (“Adjusted Cash Flow”) This disclaimer applies to every usage of Adjusted Cash Flow in this presentation. Adjusted Cash Flow is a metric that is used by management to provide an estimate of cash flow generated by the operating segments. Adjusted Cash Flow begins with pret

Slide 15: Appendix
Appendix 14
Slide 16: Segment Adjusted Cash Flow Reconciliations
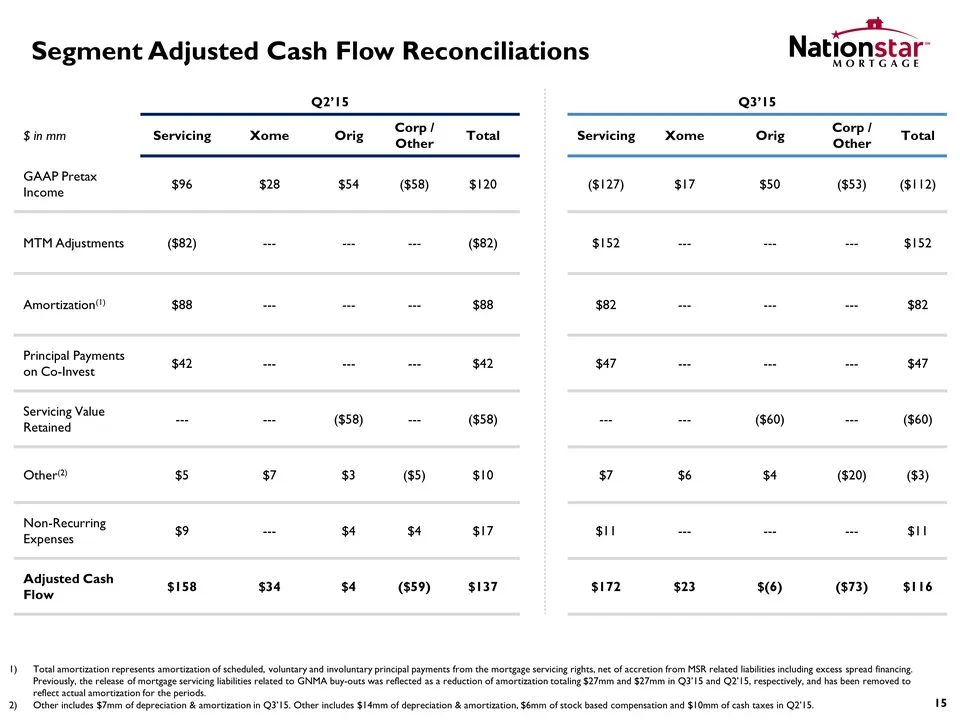
Segment Adjusted Cash Flow Reconciliations Q2’15 Q3’15 $ in mm Servicing Xome Orig Corp / Other Total Servicing Xome Orig Corp / Other Total GAAP Pretax Income $96 $28 $54 ($58) $120 ($127) $17 $50 ($53) ($112) MTM Adjustments ($82) --- --- --- ($82) $152 --- --- --- $152 Amortization(1) $88 --- ---
Slide 17: Servicing: Operational P&L
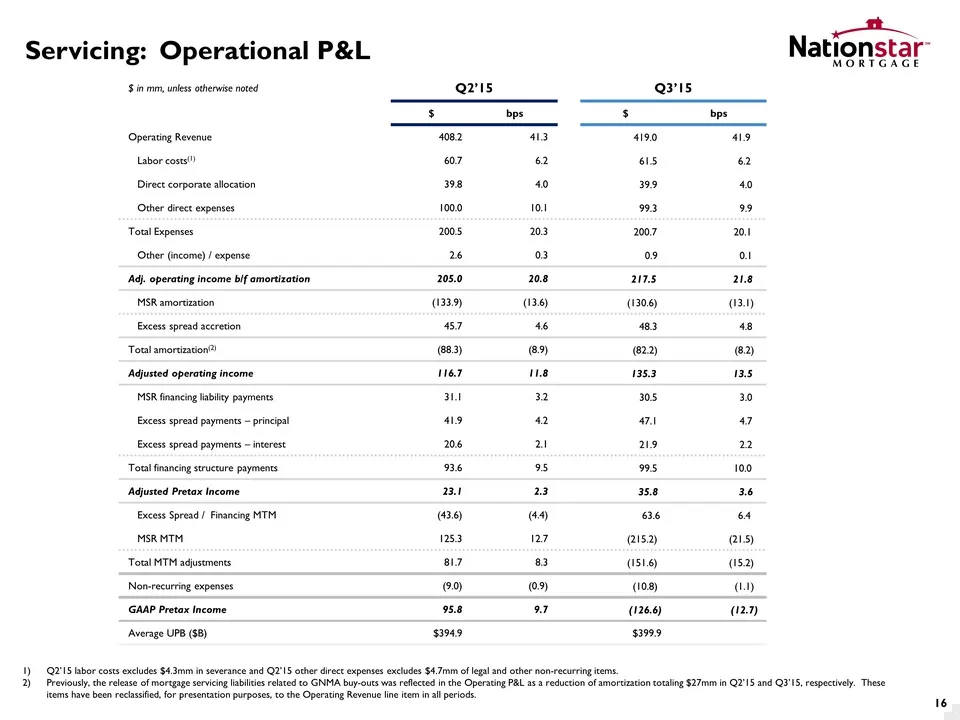
Servicing: Operational P&L $ in mm, unless otherwise noted Q2’15 Q3’15 $ bps $ bps Operating Revenue 408.2 41.3 419.0 41.9 Labor costs(1) 60.7 6.2 61.5 6.2 Direct corporate allocation 39.8 4.0 39.9 4.0 Other direct expenses 100.0 10.1 99.3 9.9 Total Expenses 200.5 20.3 200.7 20.1 Other (income) / ex
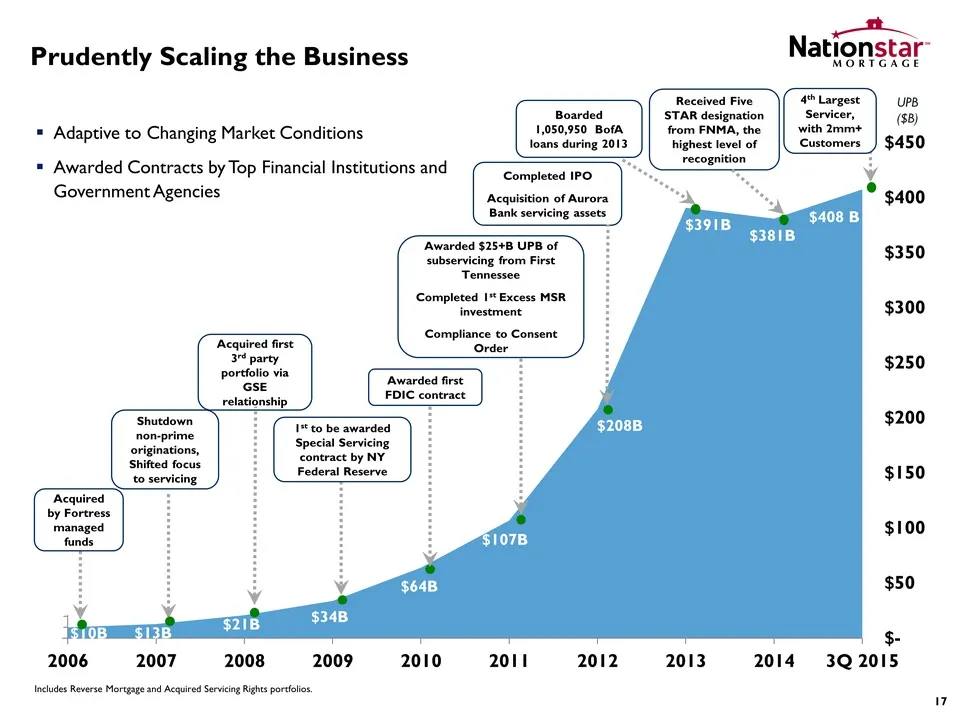
Slide 18: Prudently Scaling the Business
Prudently Scaling the Business Adaptive to Changing Market Conditions Awarded Contracts by Top Financial Institutions and Government Agencies UPB ($B) $10B $13B $21B $34B $64B $107B $208B $391B $381B $408 B $- $50 $100 $150 $200 $250 $300 $350 $400 $450 2006 2007 2008 2009 2010 2011 2012 2013 2014 3
Source: SEC EDGAR · 8-K filed Dec 17, 2015
More decks from Mr. Cooper Group Inc
 Q2 2025 Earnings Presentation25 slides · Jul 23, 2025
 Q1 2025 Earnings Presentation24 slides · Apr 23, 2025
 Merger or Acquisition (March 2025)23 slides · Mar 31, 2025
 Q4 2024 Earnings Presentation29 slides · Feb 12, 2025
 Q3 2024 Earnings Presentation29 slides · Oct 23, 2024
 Q2 2024 Earnings Presentation26 slides · Jul 25, 2024