Chesapeake Lodging Trust — Institutional Investor and Security Analyst Conference 2015
68 slides from Chesapeake Lodging Trust's conference presentation, Sep 29, 2015

Slide 1: Institutional Investor and Security Analyst Conference
Agenda Page [ C L I E N T N A M E ] Presentation1 September 29, 2015 Institutional Investor and Security Analyst Conference
Slide 2: Forward-looking statements
2 This presentation contains forward-looking statements that relate to future events or our future financial performance. We generally identify forward-looking statements by terminology such as “may,” “will,” “should,” “expects,” “plans,” “anticipates,” “could,” “intends,” “target,” “projects,” “con
Slide 3: Welcome, Presenters and Agenda
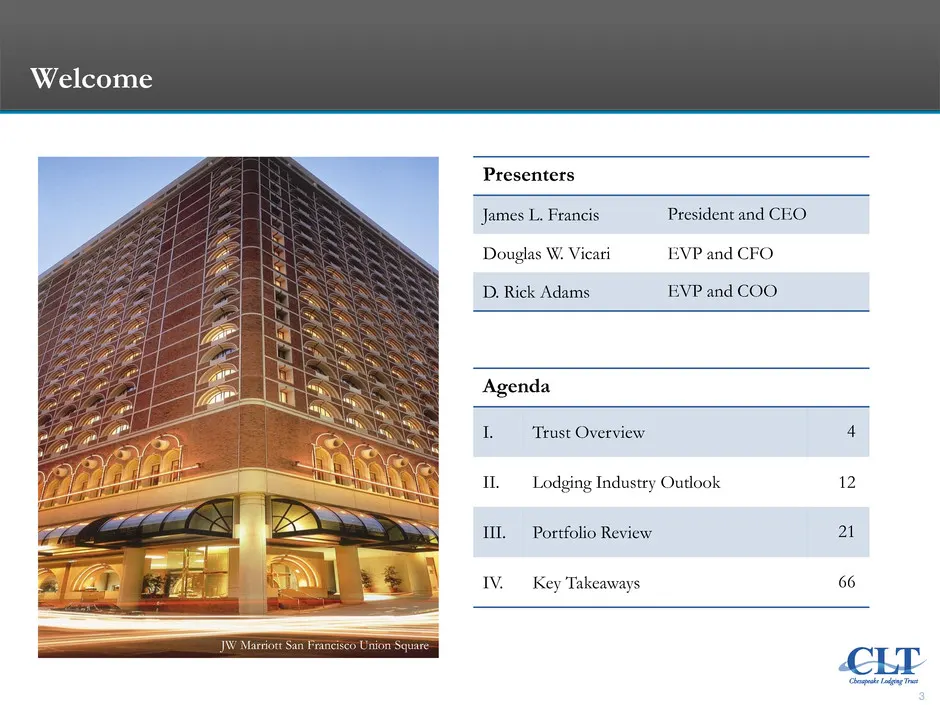
3 Welcome JW Marriott San Francisco Union Square Presenters James L. Francis President and CEO Douglas W. Vicari EVP and CFO D. Rick Adams EVP and COO Agenda I. Trust Overview 4 II. Lodging Industry Outlook 12 III. Portfolio Review 21 IV. Key Takeaways 66

Slide 4: Trust Overview
4 Trust Overview
Slide 5: Well-Positioned Portfolio, Strong Balance Sheet and Dividend
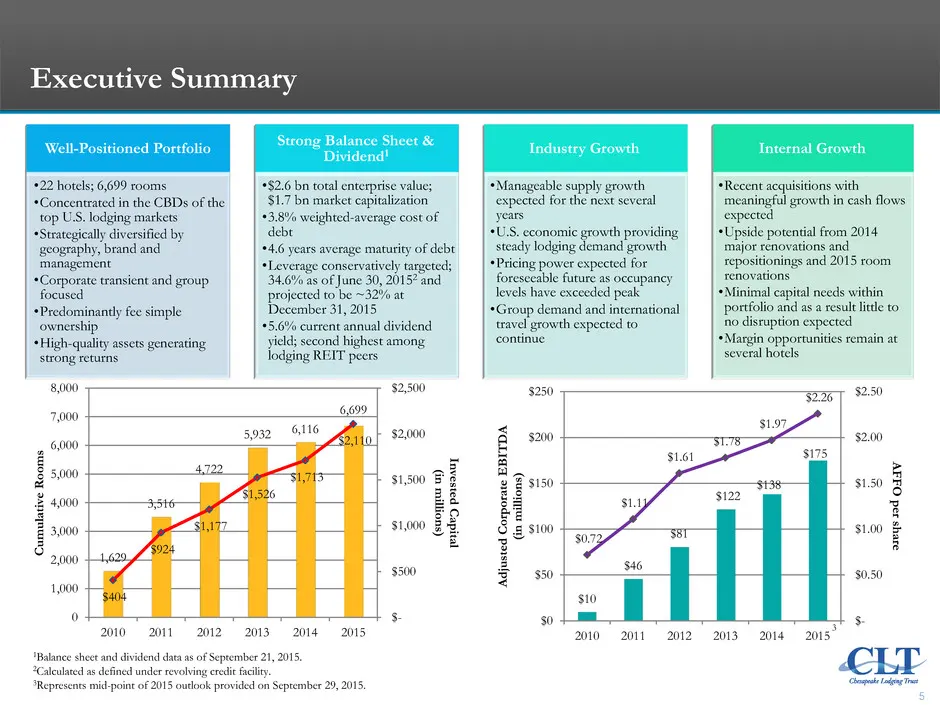
5 Well-Positioned Portfolio •22 hotels; 6,699 rooms •Concentrated in the CBDs of the top U.S. lodging markets •Strategically diversified by geography, brand and management •Corporate transient and group focused •Predominantly fee simple ownership •High-quality assets generating strong returns Strong
Slide 6: Portfolio Map
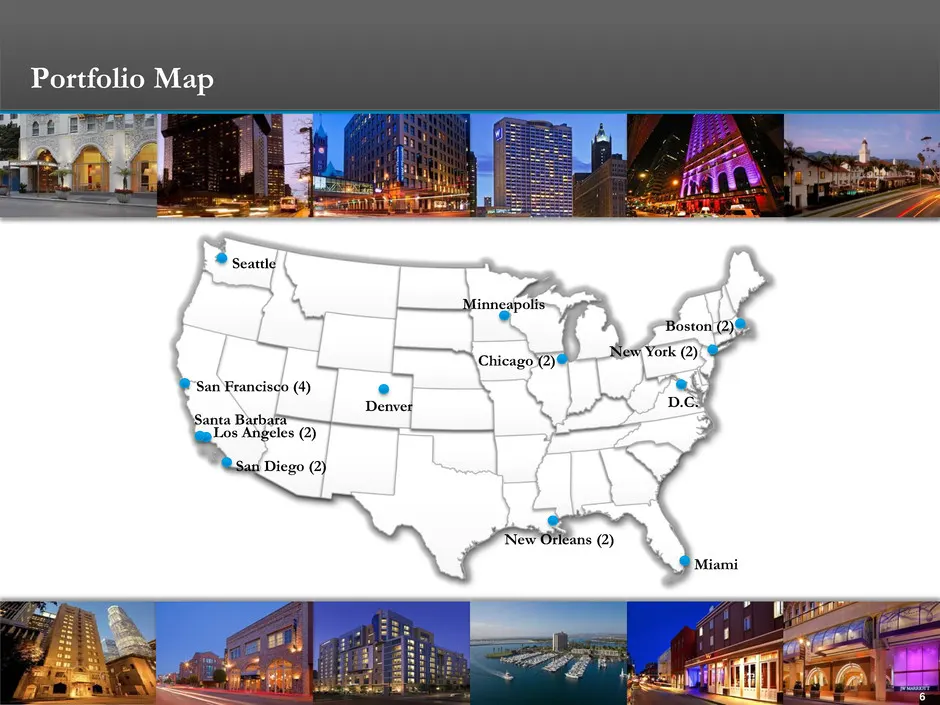
6 Denver Seattle Minneapolis Chicago (2) New Orleans (2) D.C. New York (2) Boston (2) San Francisco (4) Los Angeles (2) San Diego (2) Santa Barbara Portfolio Map Miami
Slide 7: Portfolio Segmentation
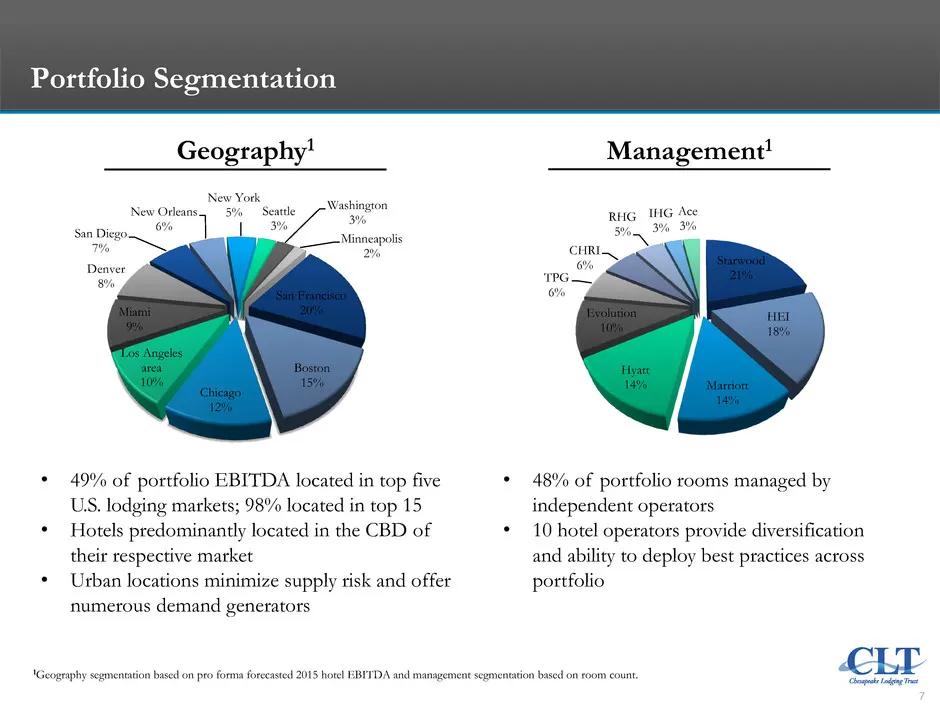
7 Starwood 21% HEI 18% Marriott 14% Hyatt 14% Evolution 10% TPG 6% CHRI 6% RHG 5% IHG 3% Ace 3% Management1 Geography1 San Francisco 20% Boston 15% Chicago 12% Los Angeles area 10% Miami 9% Denver 8% San Diego 7% New Orleans 6% New York 5% Seattle 3% Washington 3% Minneapolis 2% • 49% of portfolio E
Slide 8: Portfolio Segmentation
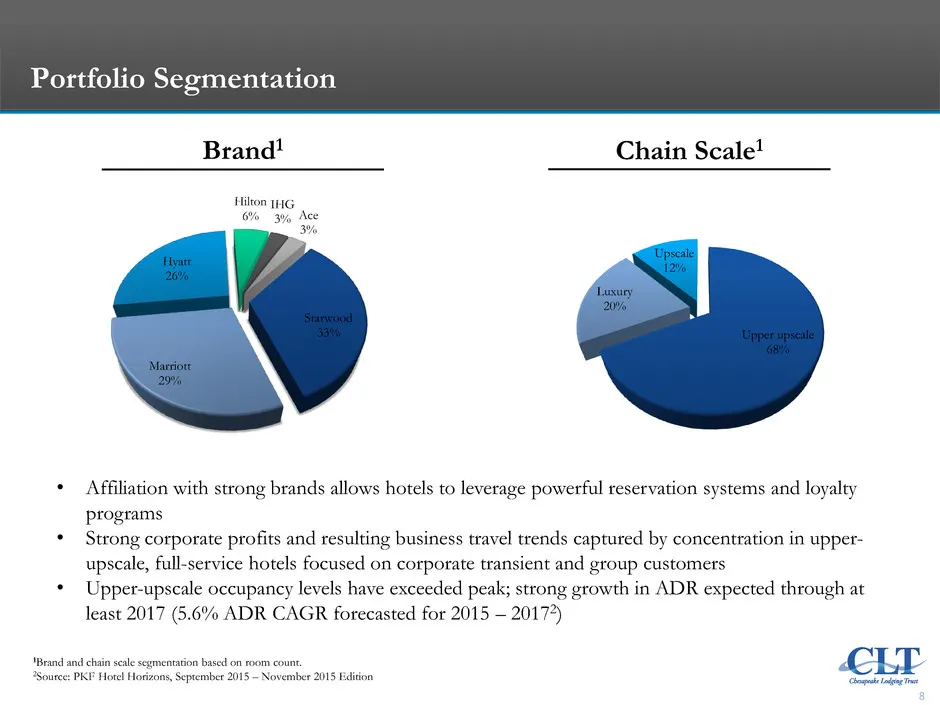
8 Upper upscale 68% Luxury 20% Upscale 12% Chain Scale1 Brand1 Starwood 33% Marriott 29% Hyatt 26% Hilton 6% IHG 3% Ace 3% • Affiliation with strong brands allows hotels to leverage powerful reservation systems and loyalty programs • Strong corporate profits and resulting business travel trends capt
Slide 9: Strong Balance Sheet
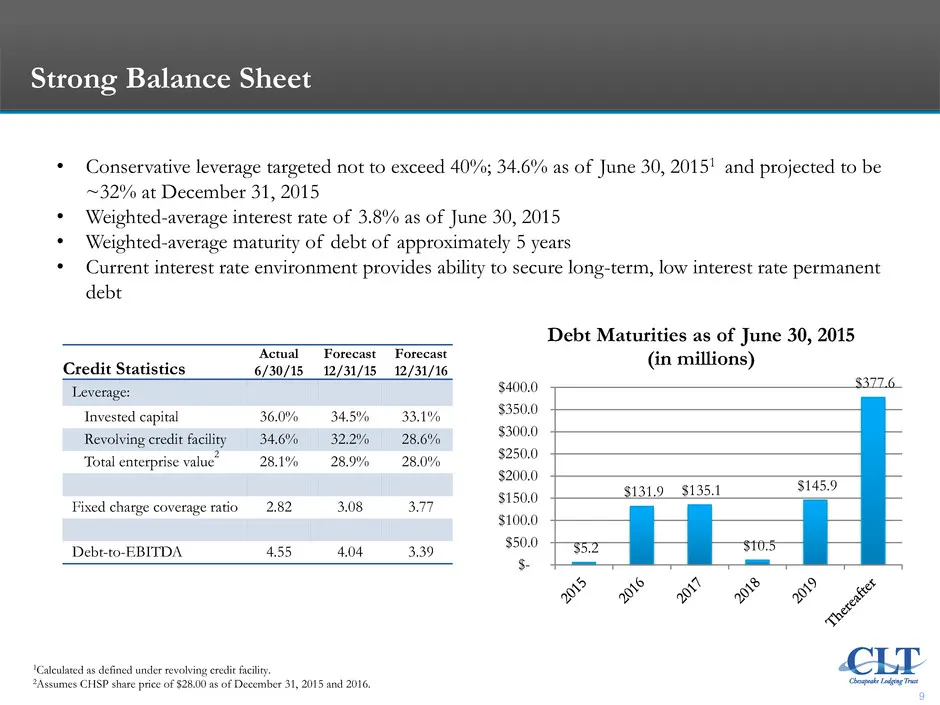
9 • Conservative leverage targeted not to exceed 40%; 34.6% as of June 30, 20151 and projected to be ~32% at December 31, 2015 • Weighted-average interest rate of 3.8% as of June 30, 2015 • Weighted-average maturity of debt of approximately 5 years • Current interest rate environment provides abilit
Slide 10: Growing Dividend
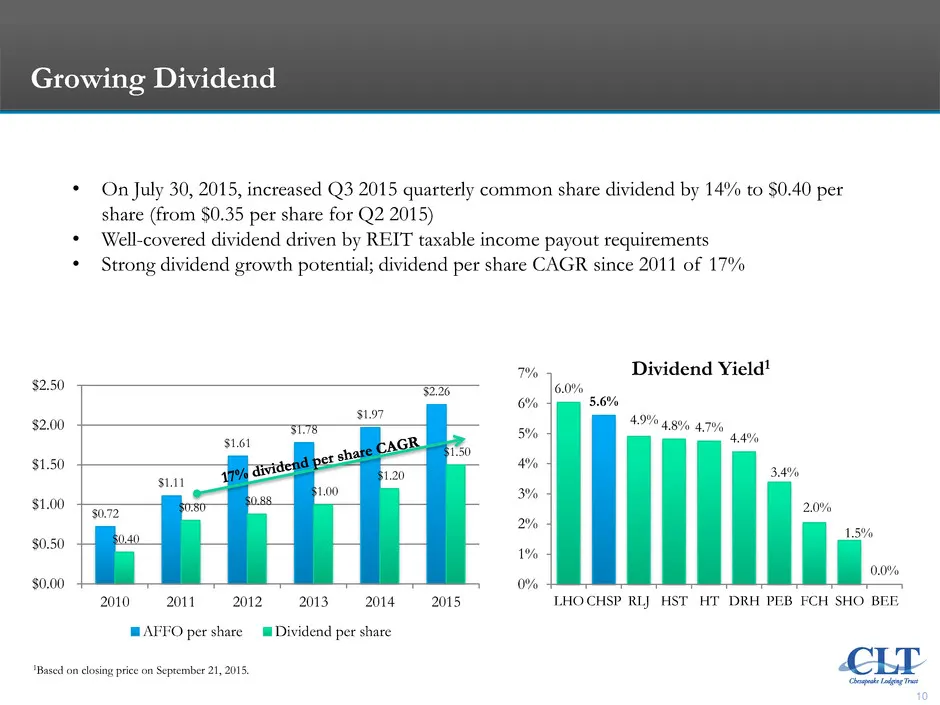
10 6.0% 5.6% 4.9% 4.8% 4.7% 4.4% 3.4% 2.0% 1.5% 0.0% 0% 1% 2% 3% 4% 5% 6% 7% LHO CHSP RLJ HST HT DRH PEB FCH SHO BEE Dividend Yield1 • On July 30, 2015, increased Q3 2015 quarterly common share dividend by 14% to $0.40 per share (from $0.35 per share for Q2 2015) • Well-covered dividend driven by RE
Slide 11: Solid Investment Execution
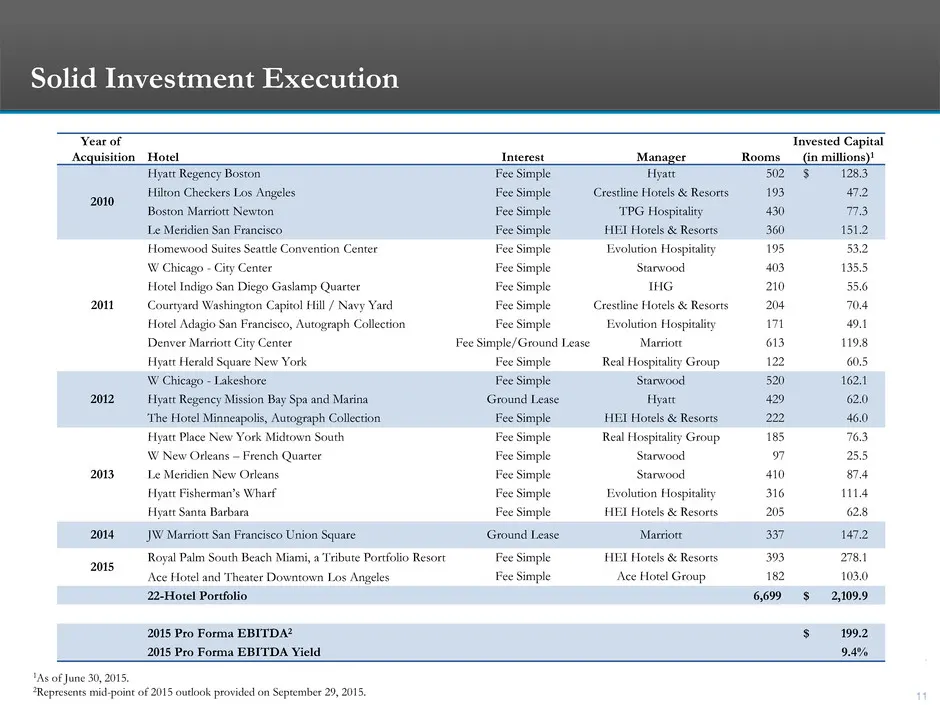
11 Solid Investment Execution Year of Acquisition Hotel Interest Manager Rooms Invested Capital (in millions)1 2010 Hyatt Regency Boston Fee Simple Hyatt 502 $ 128.3 Hilton Checkers Los Angeles Fee Simple Crestline Hotels & Resorts 193 47.2 Boston Marriott Newton Fee Simple TPG Hospitality 430 77.3

Slide 12: Lodging Industry Outlook
12 Lodging Industry Outlook
Slide 13: Positive Lodging Fundamentals Expected to Continue
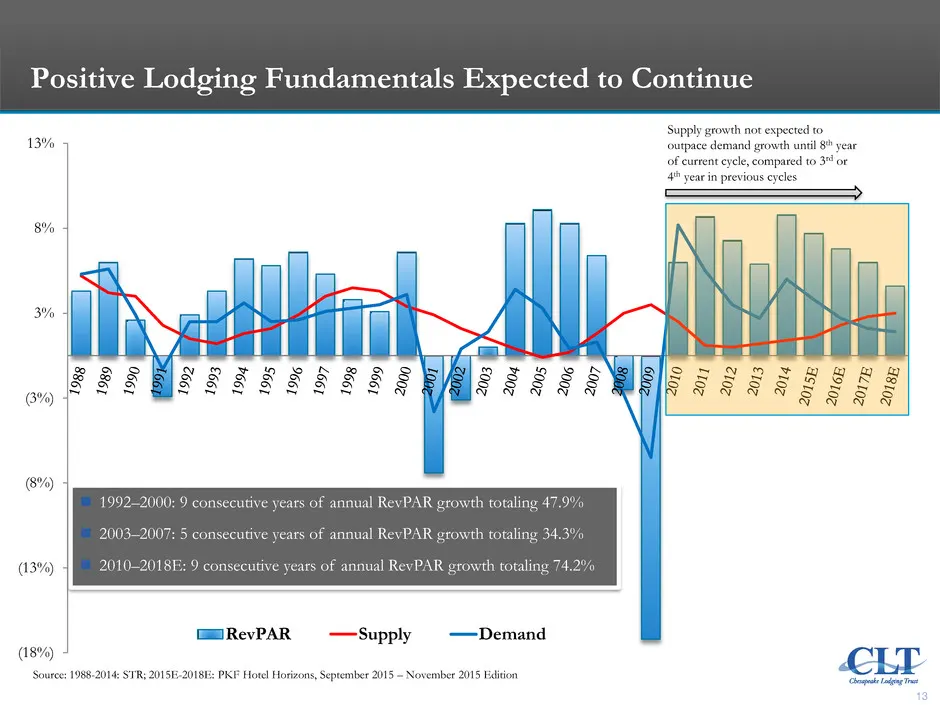
13 (18%) (13%) (8%) (3%) 3% 8% 13% RevPAR Supply Demand 1992–2000: 9 consecutive years of annual RevPAR growth totaling 47.9% 2003–2007: 5 consecutive years of annual RevPAR growth totaling 34.3% 2010–2018E: 9 consecutive years of annual RevPAR growth totaling 74.2% Source: 1988-2014: STR; 201
Slide 14: Rate Driven RevPAR Growth
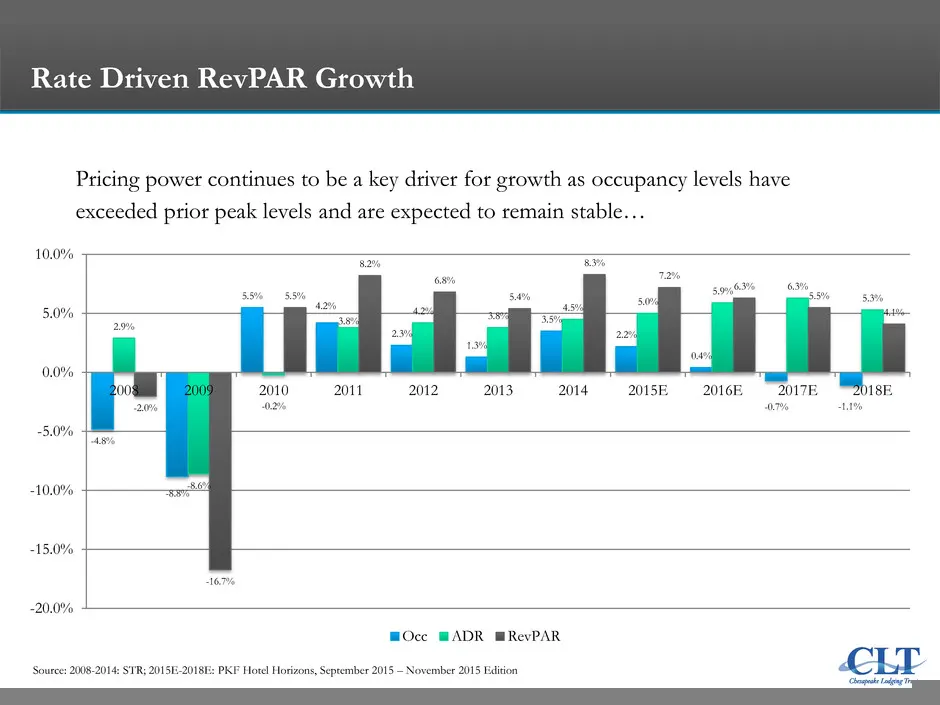
14 Rate Driven RevPAR Growth Pricing power continues to be a key driver for growth as occupancy levels have exceeded prior peak levels and are expected to remain stable… Source: 2008-2014: STR; 2015E-2018E: PKF Hotel Horizons, September 2015 – November 2015 Edition -4.8% -8.8% 5.5% 4.2% 2.3% 1.3% 3.
Slide 15: U.S. Lodging Supply Picture
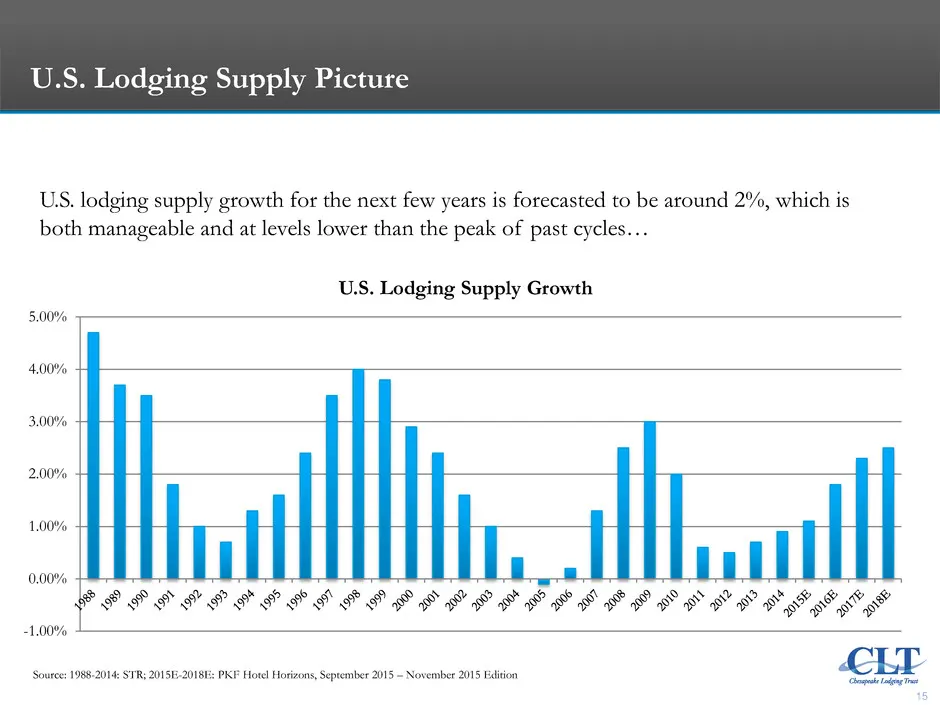
15 Hyatt Fisherman’s Wharf Hyatt Regency Boston U.S. Lodging Supply Picture -1.00% 0.00% 1.00% 2.00% 3.00% 4.00% 5.00% U.S. Lodging Supply Growth U.S. lodging supply growth for the next few years is forecasted to be around 2%, which is both manageable and at levels lower than the peak of past cycles
Slide 16: U.S. Lodging Pipeline by Stage
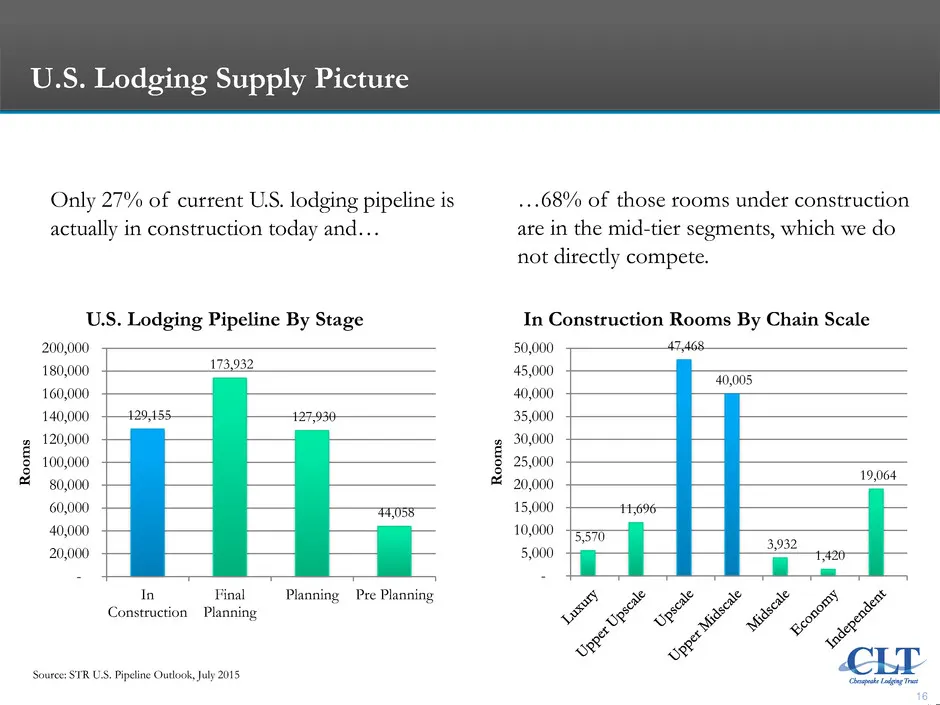
16 Hyatt Fisherman’s Wharf Hyatt Regency Boston U.S. Lodging Supply Picture 129,155 173,932 127,930 44,058 - 20,000 40,000 60,000 80,000 100,000 120,000 140,000 160,000 180,000 200,000 In Construction Final Planning Planning Pre Planning R oo m s U.S. Lodging Pipeline By Stage 5,570 11,696 47,468 40
Slide 17: Several Catalysts for Lodging Demand
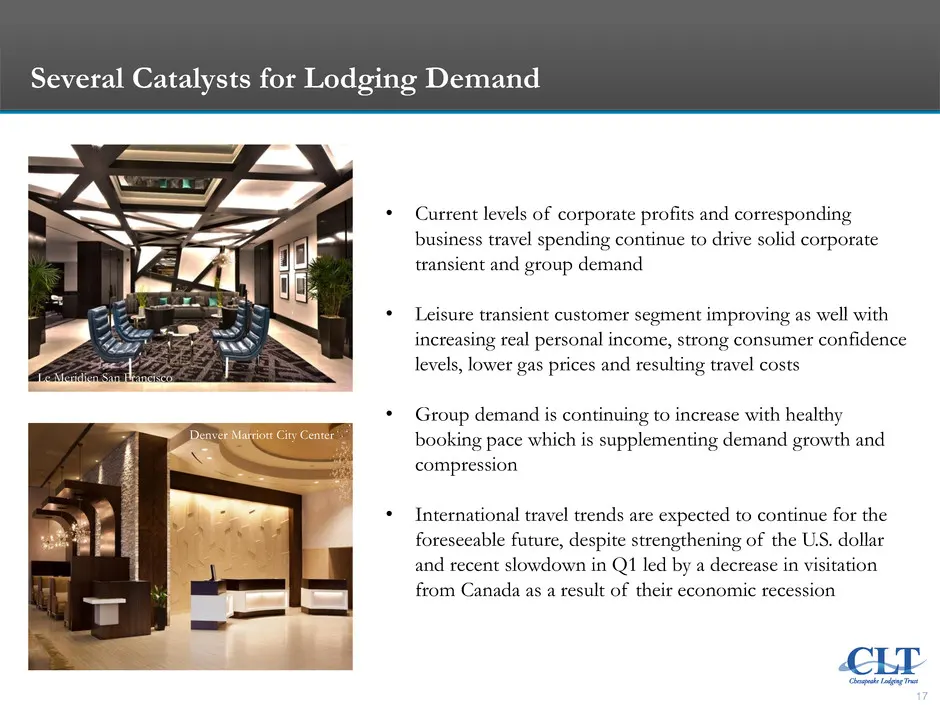
17 • Current levels of corporate profits and corresponding business travel spending continue to drive solid corporate transient and group demand • Leisure transient customer segment improving as well with increasing real personal income, strong consumer confidence levels, lower gas prices and result
Slide 18: International Travel Remains Favorable Despite Recent Headwinds
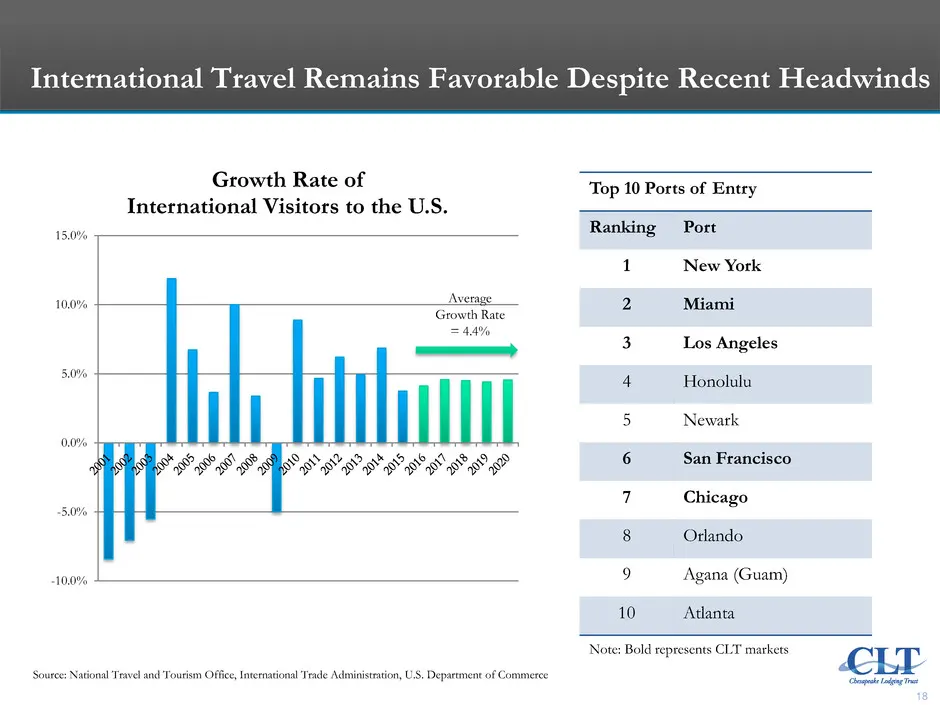
18 International Travel Remains Favorable Despite Recent Headwinds -10.0% -5.0% 0.0% 5.0% 10.0% 15.0% Growth Rate of International Visitors to the U.S. Average Growth Rate = 4.4% Source: National Travel and Tourism Office, International Trade Administration, U.S. Department of Commerce Top 10 Ports
Slide 19: Prognosticators
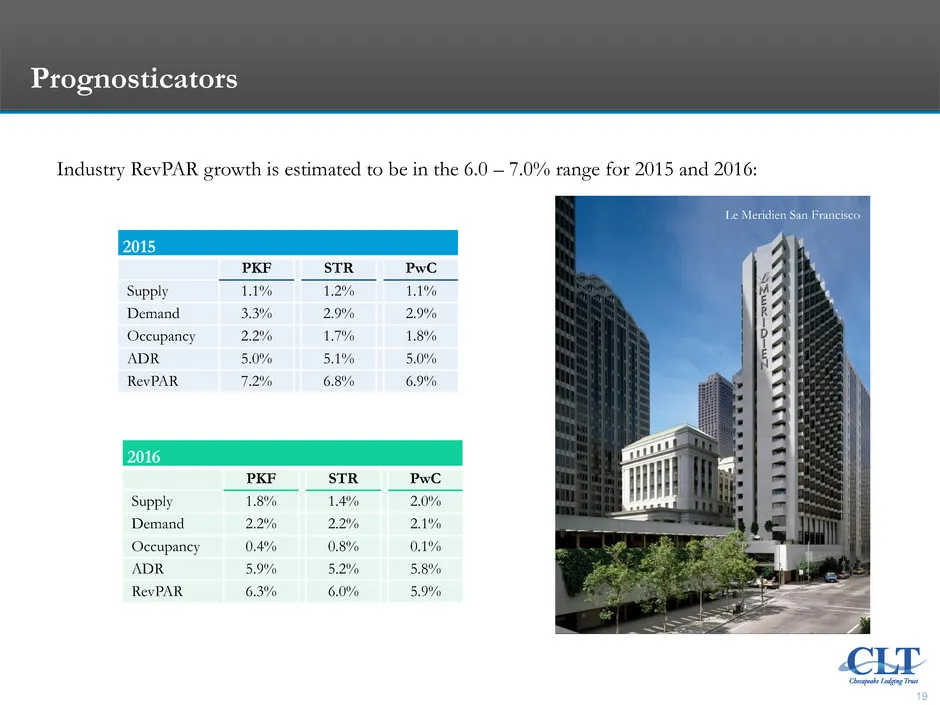
19 Hyatt Fisherman’s Wharf Hyatt Regency Boston Prognosticators Industry RevPAR growth is estimated to be in the 6.0 – 7.0% range for 2015 and 2016: 2015 PKF STR PwC Supply 1.1% 1.2% 1.1% Demand 3.3% 2.9% 2.9% Occupancy 2.2% 1.7% 1.8% ADR 5.0% 5.1% 5.0% RevPAR 7.2% 6.8% 6.9% 2016 PKF STR PwC Supply
Slide 20: Lodging Industry Summary
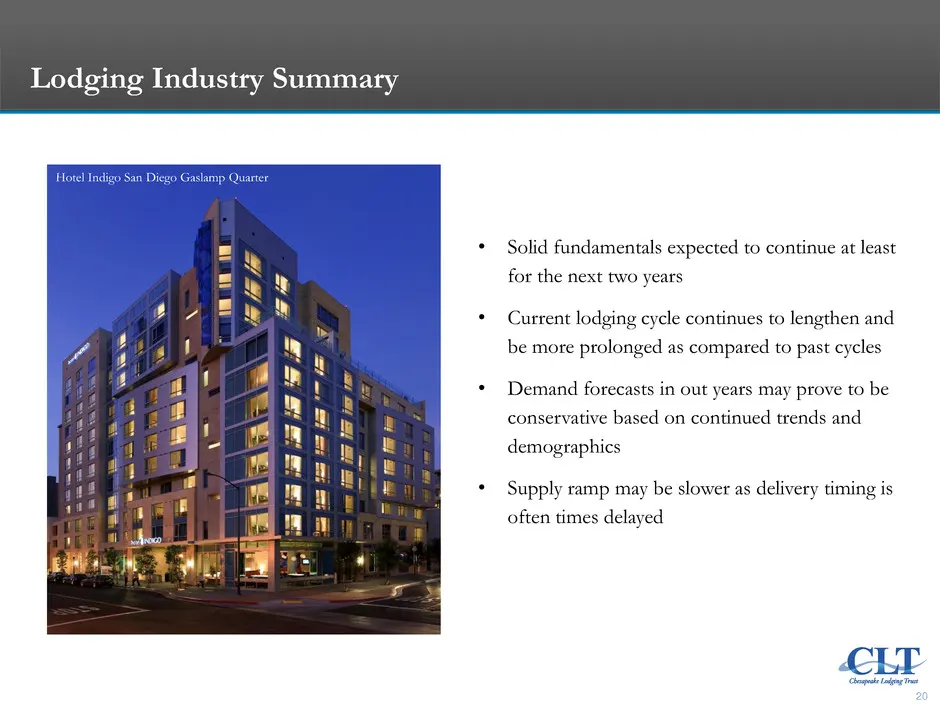
20 Hyatt Fisherman’s Wharf Hyatt Regency Boston Lodging Industry Summary • Solid fundamentals expected to continue at least for the next two years • Current lodging cycle continues to lengthen and be more prolonged as compared to past cycles • Demand forecasts in out years may prove to be conservati

Slide 21: Portfolio Review
21 Portfolio Review
Slide 22: Second Half 2015 Commentary
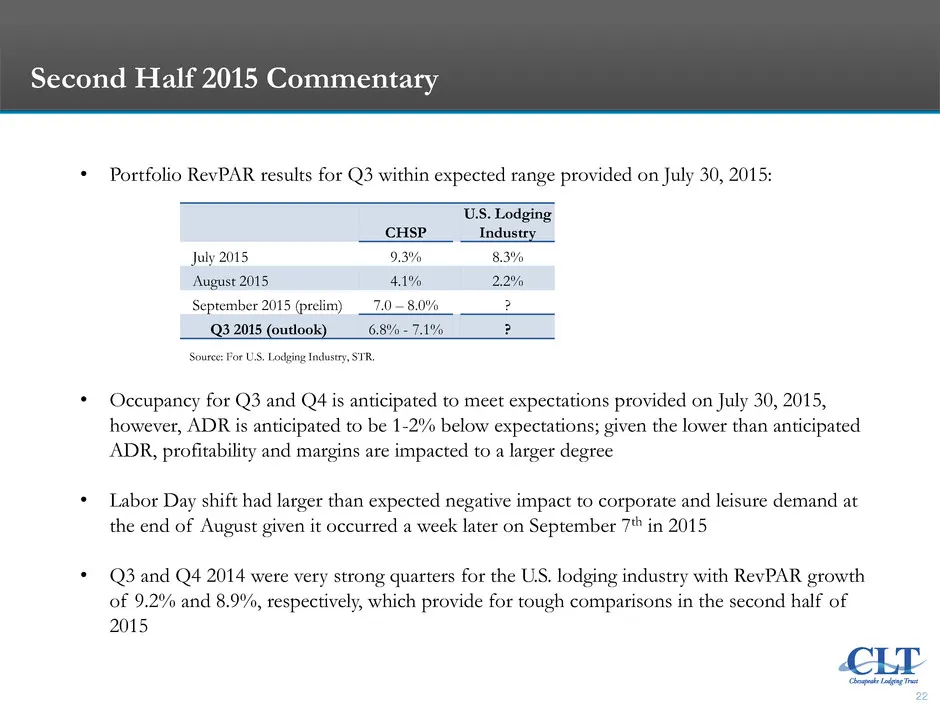
22 Second Half 2015 Commentary • Portfolio RevPAR results for Q3 within expected range provided on July 30, 2015: • Occupancy for Q3 and Q4 is anticipated to meet expectations provided on July 30, 2015, however, ADR is anticipated to be 1-2% below expectations; given the lower than anticipated ADR,
Slide 23: Second Half 2015 Commentary (continued)
23 Second Half 2015 Commentary (continued) • Very strong performance from hotels located in Boston and Seattle • Our downtown Los Angeles hotels continue very strong performance and the Ace continues to steal market share from West Hollywood • Weaker than expected performance in a few markets/select
Slide 24: Outlook Update
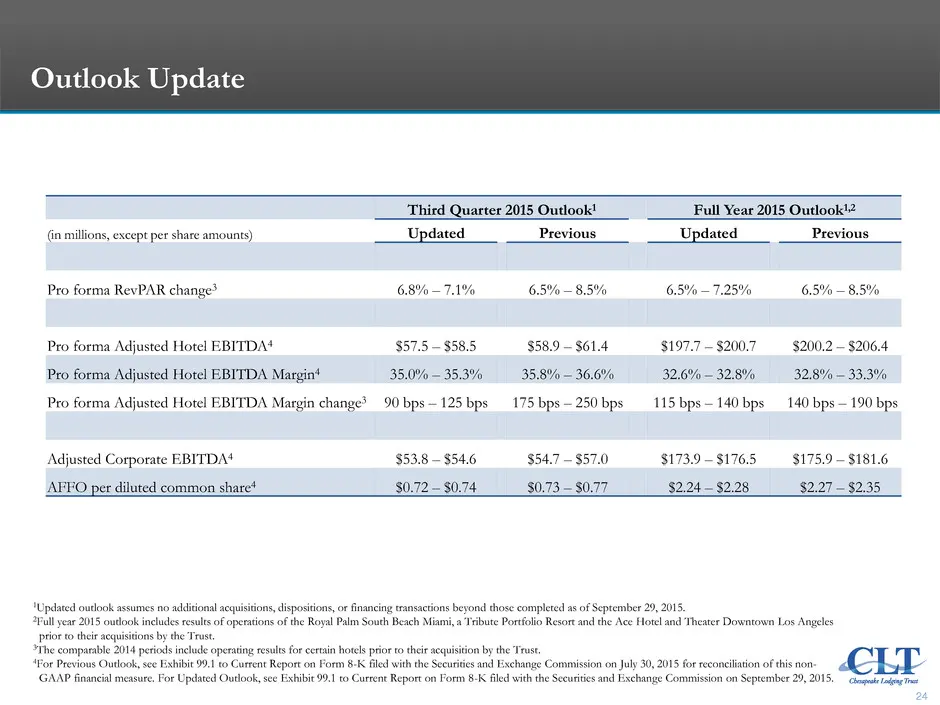
24 Outlook Update Third Quarter 2015 Outlook1 Full Year 2015 Outlook1,2 (in millions, except per share amounts) Updated Previous Updated Previous Pro forma RevPAR change3 6.8% – 7.1% 6.5% – 8.5% 6.5% – 7.25% 6.5% – 8.5% Pro forma Adjusted Hotel EBITDA4 $57.5 – $58.5 $58.9 – $61.4 $197.7 – $200.7 $20
Slide 25: Lodging Demand Expected to Be Strong in Our MSAs
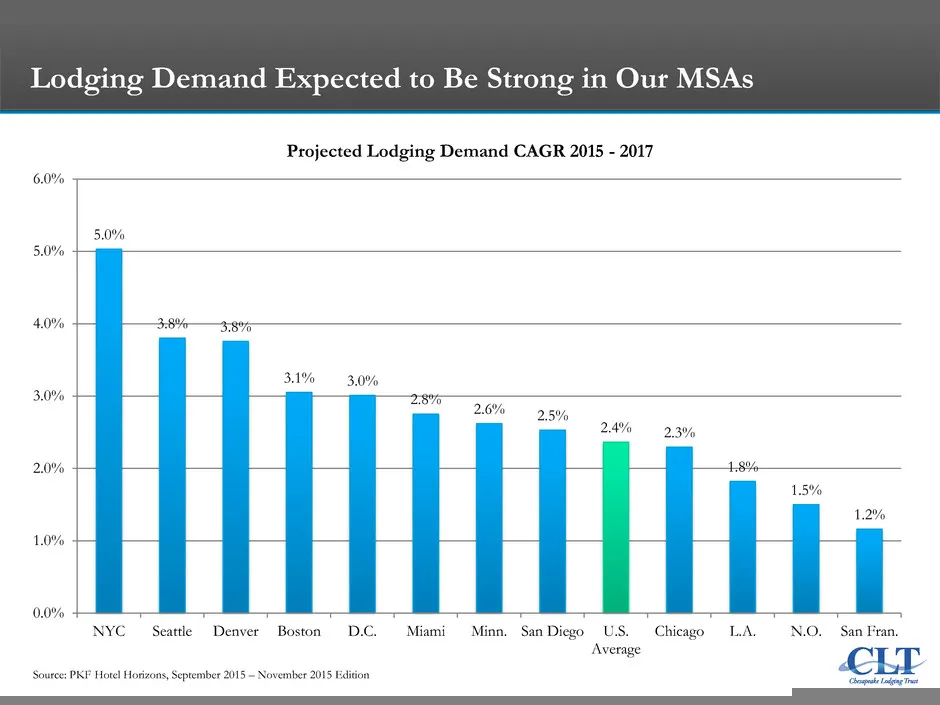
25 Lodging Demand Expected to Be Strong in Our MSAs Source: PKF Hotel Horizons, September 2015 – November 2015 Edition 5.0% 3.8% 3.8% 3.1% 3.0% 2.8% 2.6% 2.5% 2.4% 2.3% 1.8% 1.5% 1.2% 0.0% 1.0% 2.0% 3.0% 4.0% 5.0% 6.0% NYC Seattle Denver Boston D.C. Miami Minn. San Diego U.S. Average Chicago L.A. N.
Slide 26: Historically Our Tracts Have Outperformed The MSAs
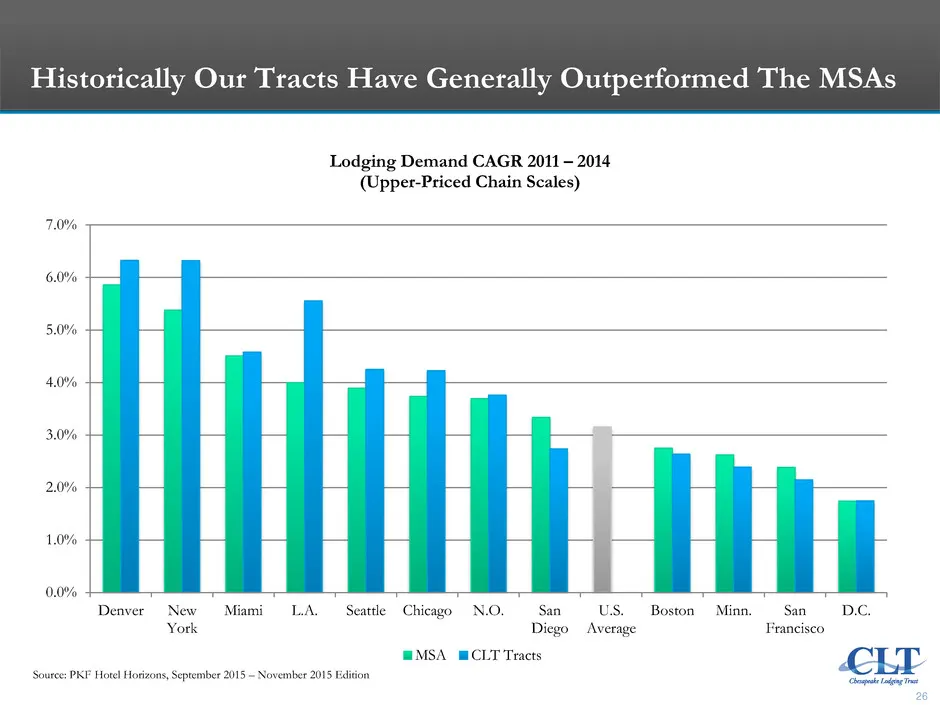
26 Historically Our Tracts Have Generally Outperformed The MSAs Source: PKF Hotel Horizons, September 2015 – November 2015 Edition 0.0% 1.0% 2.0% 3.0% 4.0% 5.0% 6.0% 7.0% Denver New York Miami L.A. Seattle Chicago N.O. San Diego U.S. Average Boston Minn. San Francisco D.C. Lodging Demand CAGR 2011 –
Slide 27: Convention Calendars
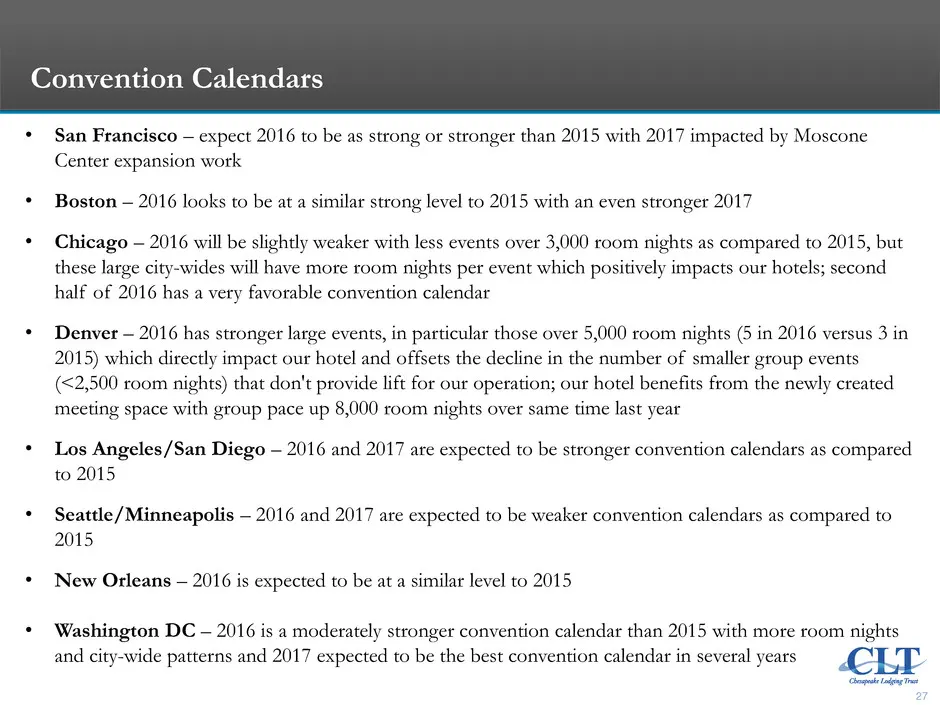
27 Convention Calendars • San Francisco – expect 2016 to be as strong or stronger than 2015 with 2017 impacted by Moscone Center expansion work • Boston – 2016 looks to be at a similar strong level to 2015 with an even stronger 2017 • Chicago – 2016 will be slightly weaker with less events over 3,00
Slide 28: Relevant Lodging Supply
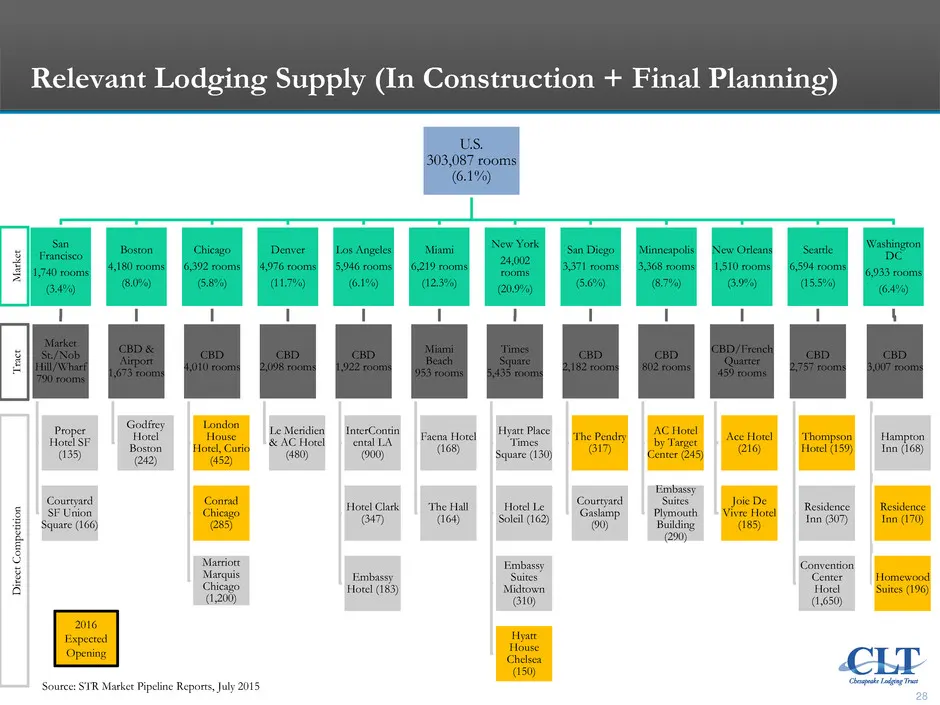
28 Relevant Lodging Supply (In Construction + Final Planning) U.S. 303,087 rooms (6.1%) San Francisco 1,740 rooms (3.4%) Market St./Nob Hill/Wharf 790 rooms Proper Hotel SF (135) Courtyard SF Union Square (166) Boston 4,180 rooms (8.0%) CBD & Airport 1,673 rooms Godfrey Hotel Boston (242) Chicago 6,
Slide 29: Portfolio Concentrated in Markets With Strong Performance
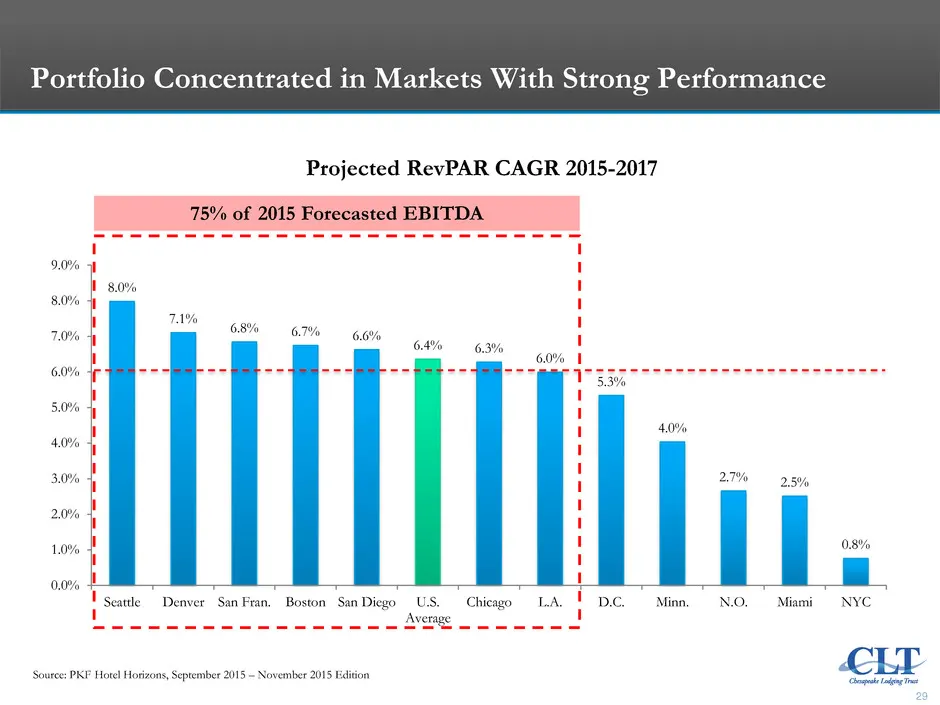
29 Portfolio Concentrated in Markets With Strong Performance Source: PKF Hotel Horizons, September 2015 – November 2015 Edition 75% of 2015 Forecasted EBITDA Projected RevPAR CAGR 2015-2017 8.0% 7.1% 6.8% 6.7% 6.6% 6.4% 6.3% 6.0% 5.3% 4.0% 2.7% 2.5% 0.8% 0.0% 1.0% 2.0% 3.0% 4.0% 5.0% 6.0% 7.0% 8.0%
Slide 30: Strong Footprint Positioned For Continued Growth
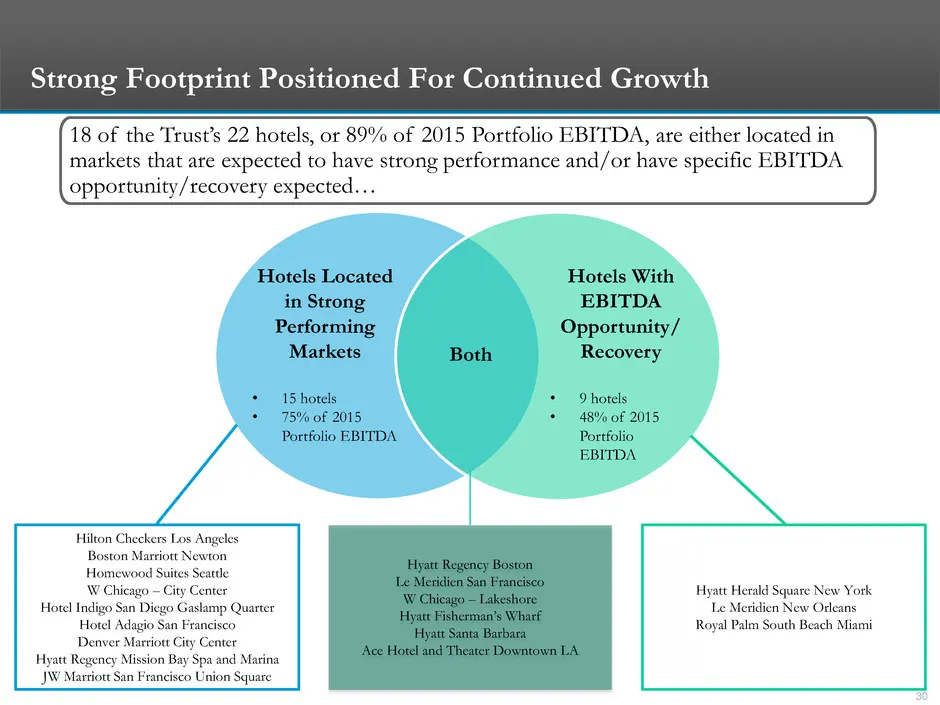
30 Strong Footprint Positioned For Continued Growth Hyatt Herald Square New York Le Meridien New Orleans Royal Palm South Beach Miami Hyatt Regency Boston Le Meridien San Francisco W Chicago – Lakeshore Hyatt Fisherman’s Wharf Hyatt Santa Barbara Ace Hotel and Theater Downtown LA Hilton Checkers Los

Slide 31: San Francisco
31 San Francisco
Slide 32: Market Overview
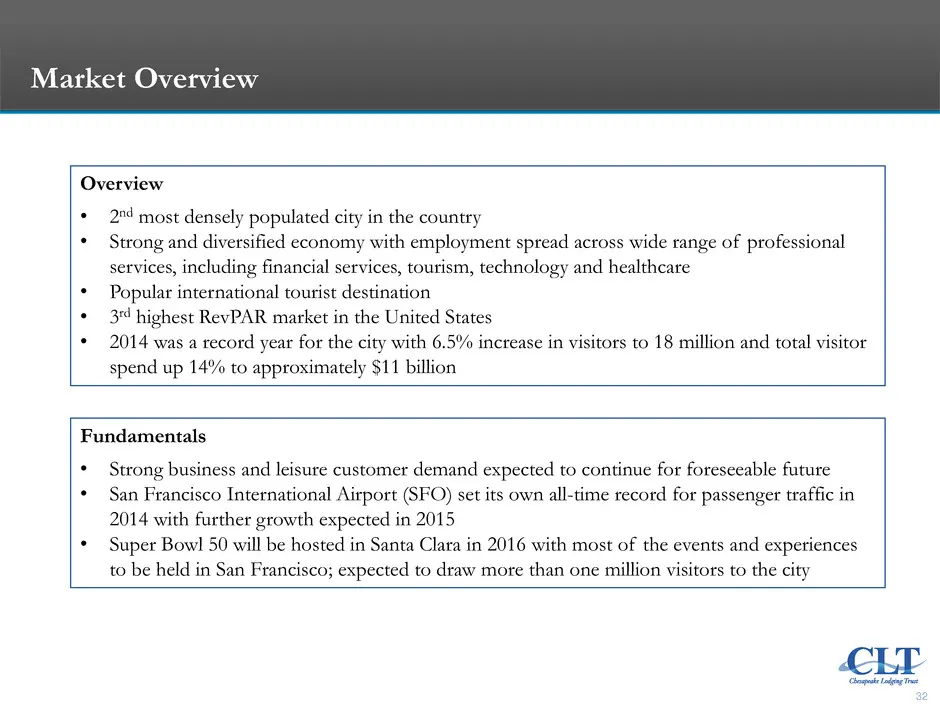
32 Market Overview Overview • 2nd most densely populated city in the country • Strong and diversified economy with employment spread across wide range of professional services, including financial services, tourism, technology and healthcare • Popular international tourist destination • 3rd highest
Slide 33: Moscone Center/Convention Calendar
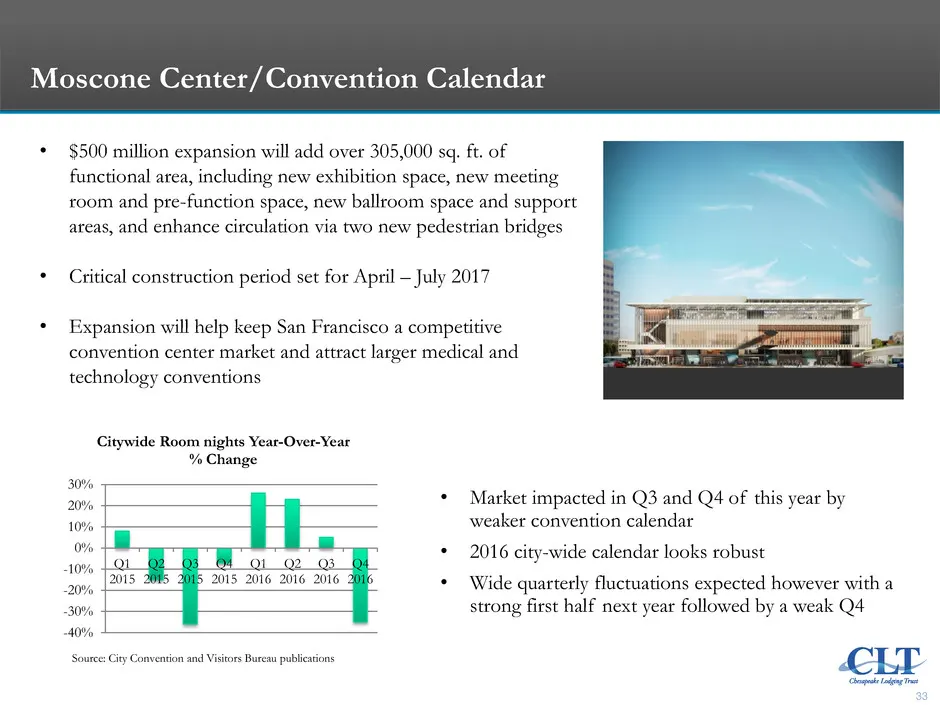
33 Moscone Center/Convention Calendar • $500 million expansion will add over 305,000 sq. ft. of functional area, including new exhibition space, new meeting room and pre-function space, new ballroom space and support areas, and enhance circulation via two new pedestrian bridges • Critical constructi
Slide 34: Le Meridien San Francisco Investment Highlights
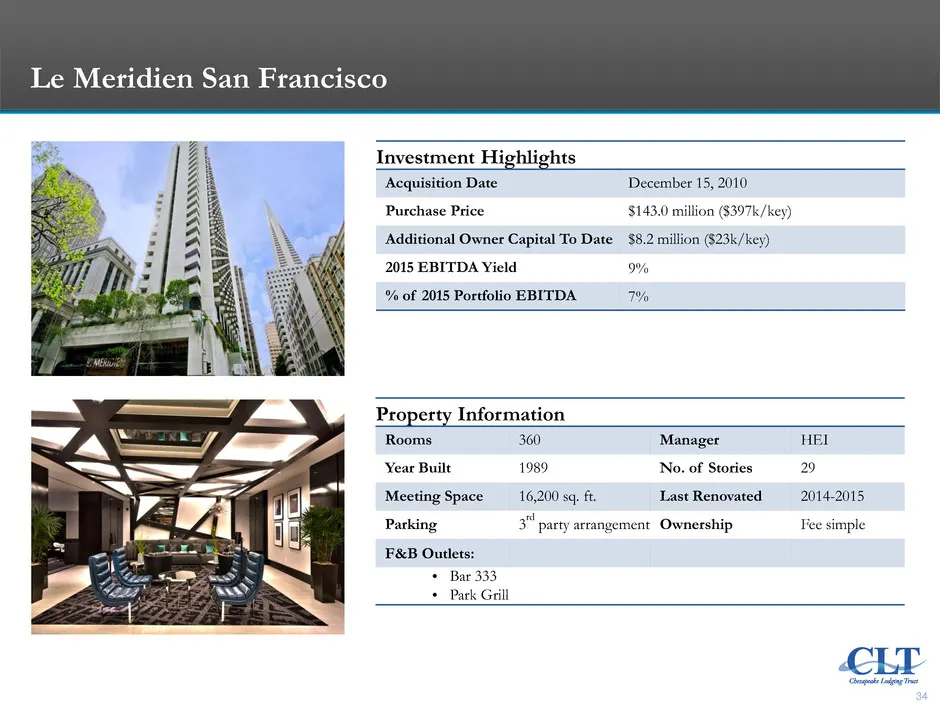
34 Le Meridien San Francisco Investment Highlights Acquisition Date December 15, 2010 Purchase Price $143.0 million ($397k/key) Additional Owner Capital To Date $8.2 million ($23k/key) 2015 EBITDA Yield 9% % of 2015 Portfolio EBITDA 7% Property Information Rooms 360 Manager HEI Year Built 1989 No. o
Slide 35: Le Meridien San Francisco (continued)
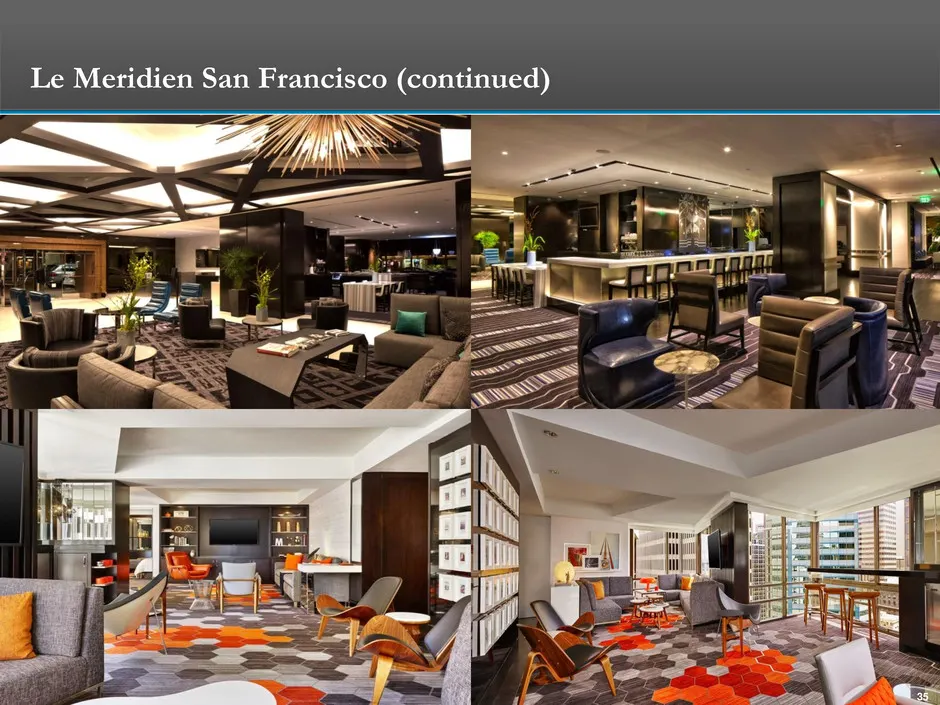
35 Le Meridien San Francisco (continued)
Slide 36: Le Meridien San Francisco (continued)
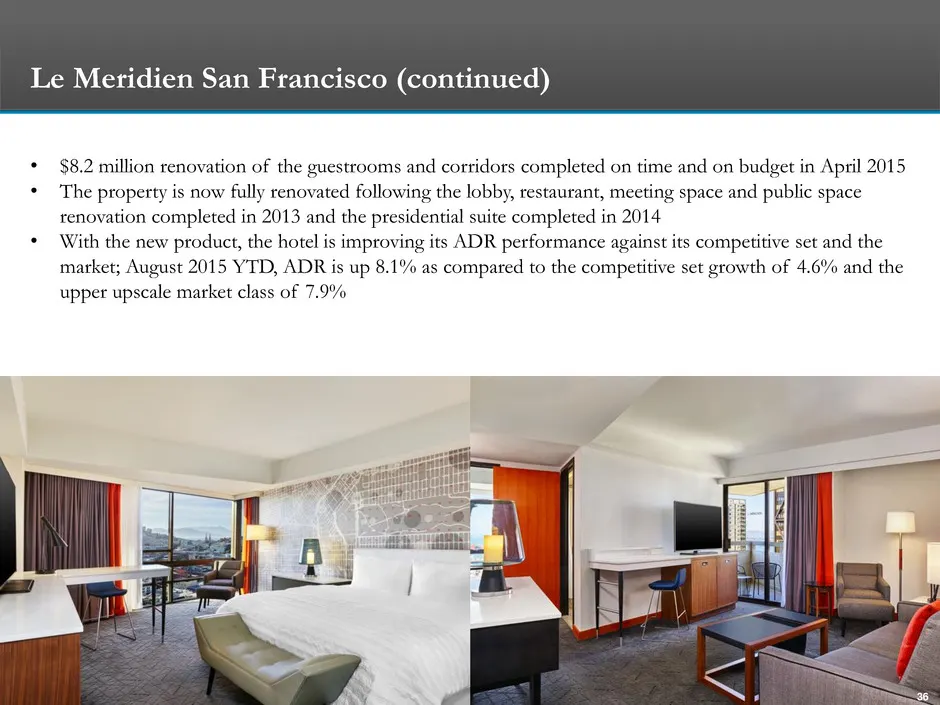
36 • $8.2 million renovation of the guestrooms and corridors completed on time and on budget in April 2015 • The property is now fully renovated following the lobby, restaurant, meeting space and public space renovation completed in 2013 and the presidential suite completed in 2014 • With the new pr
Slide 37: Hotel Adagio San Francisco Investment Highlights
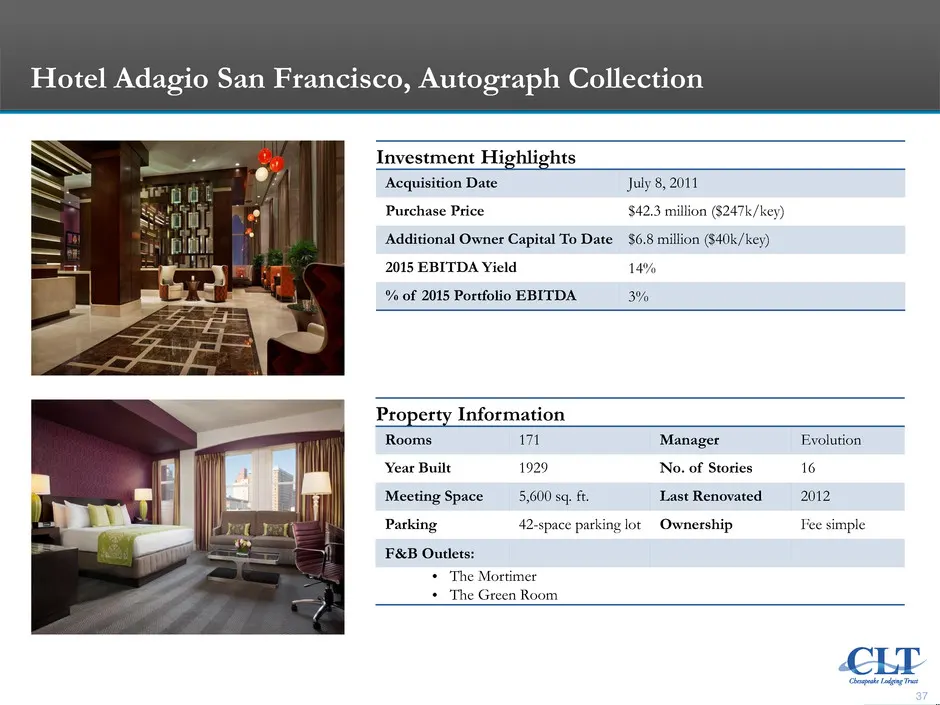
37 Hotel Adagio San Francisco, Autograph Collection Investment Highlights Acquisition Date July 8, 2011 Purchase Price $42.3 million ($247k/key) Additional Owner Capital To Date $6.8 million ($40k/key) 2015 EBITDA Yield 14% % of 2015 Portfolio EBITDA 3% Property Information Rooms 171 Manager Evoluti
Slide 38: Hyatt Fisherman's Wharf Investment Highlights
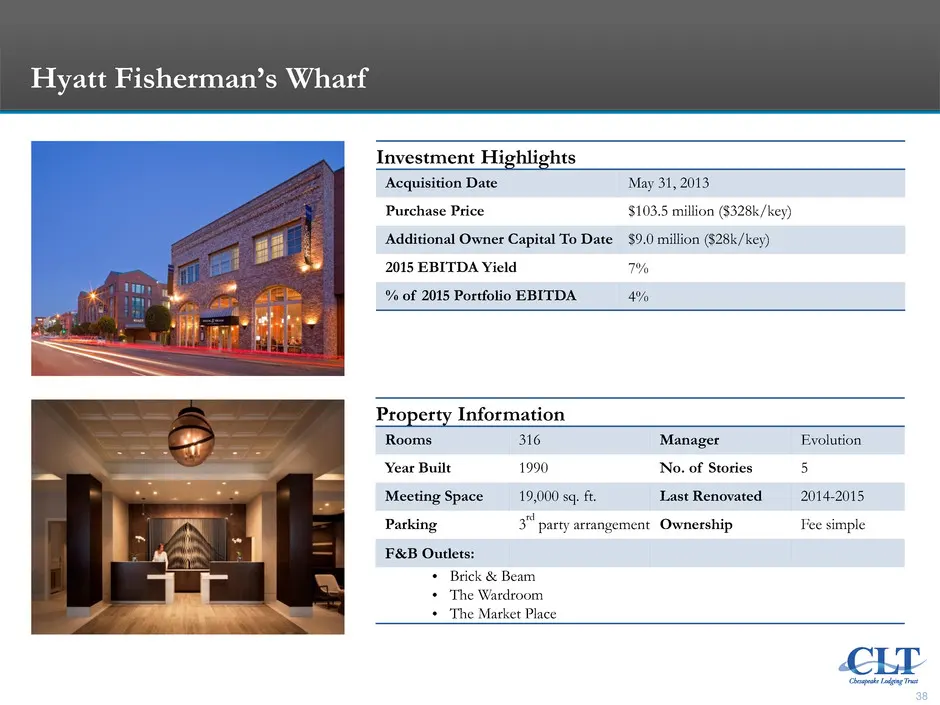
38 Hyatt Fisherman’s Wharf Investment Highlights Acquisition Date May 31, 2013 Purchase Price $103.5 million ($328k/key) Additional Owner Capital To Date $9.0 million ($28k/key) 2015 EBITDA Yield 7% % of 2015 Portfolio EBITDA 4% Property Information Rooms 316 Manager Evolution Year Built 1990 No. of
Slide 39: Hyatt Fisherman's Wharf (continued)
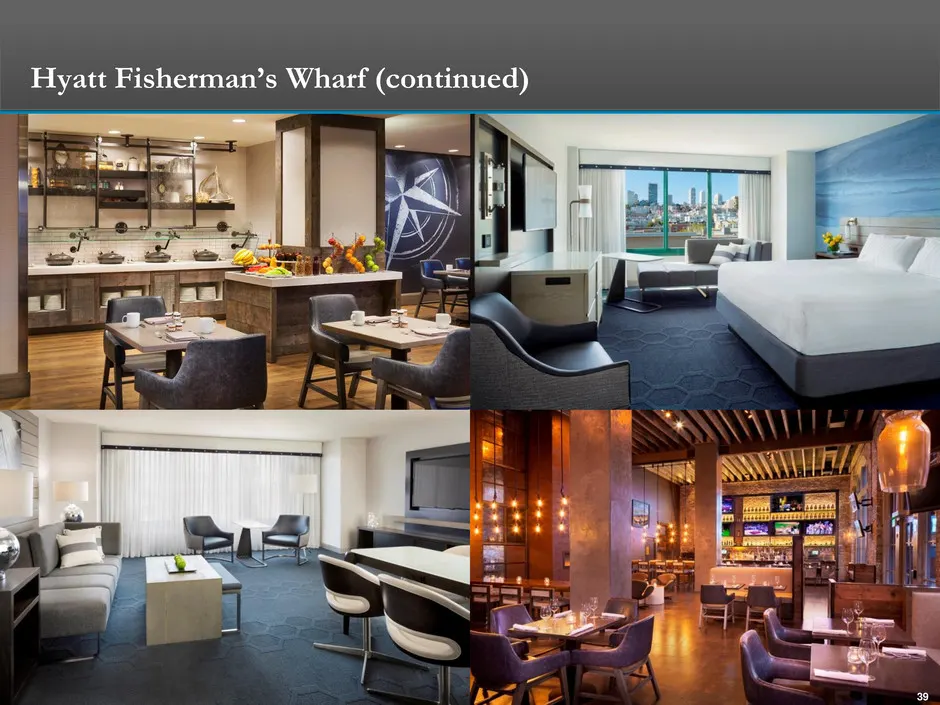
39 Hyatt Fisherman’s Wharf (continued)
Slide 40: Hyatt Fisherman's Wharf (continued)
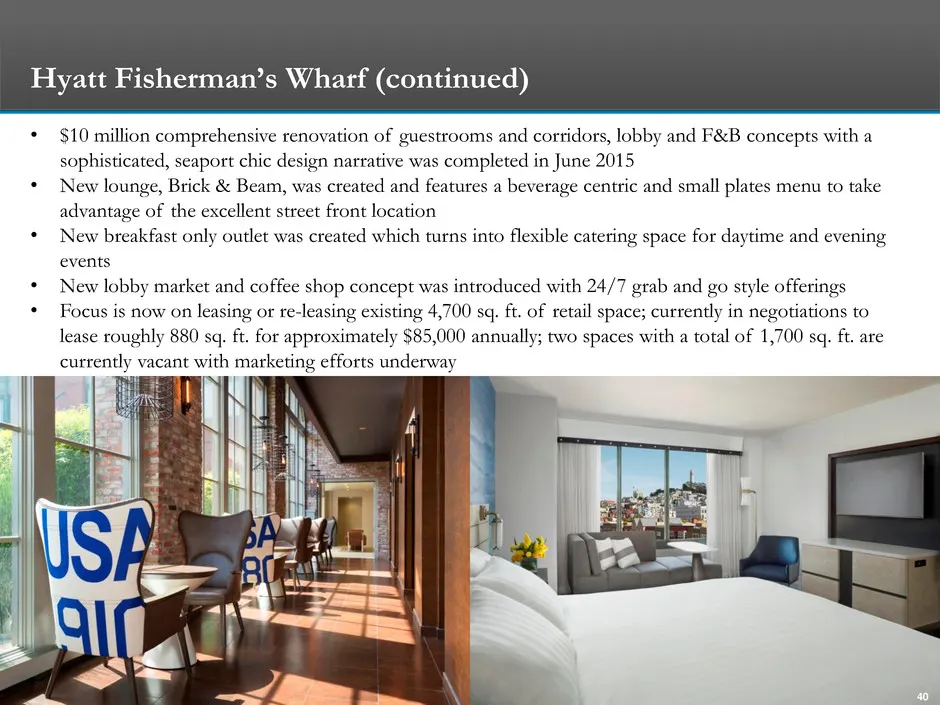
40 • $10 million comprehensive renovation of guestrooms and corridors, lobby and F&B concepts with a sophisticated, seaport chic design narrative was completed in June 2015 • New lounge, Brick & Beam, was created and features a beverage centric and small plates menu to take advantage of the excellen
Slide 41: JW Marriott San Francisco Union Square Investment Highlights
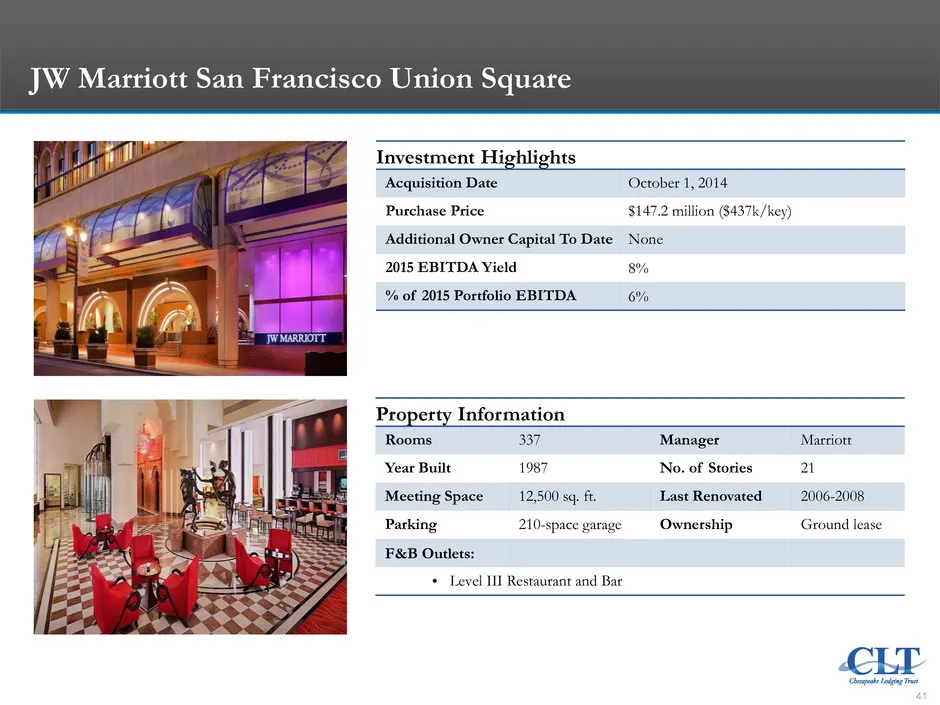
41 JW Marriott San Francisco Union Square Investment Highlights Acquisition Date October 1, 2014 Purchase Price $147.2 million ($437k/key) Additional Owner Capital To Date None 2015 EBITDA Yield 8% % of 2015 Portfolio EBITDA 6% Property Information Rooms 337 Manager Marriott Year Built 1987 No. of S
Slide 42: JW Marriott San Francisco Union Square (continued)
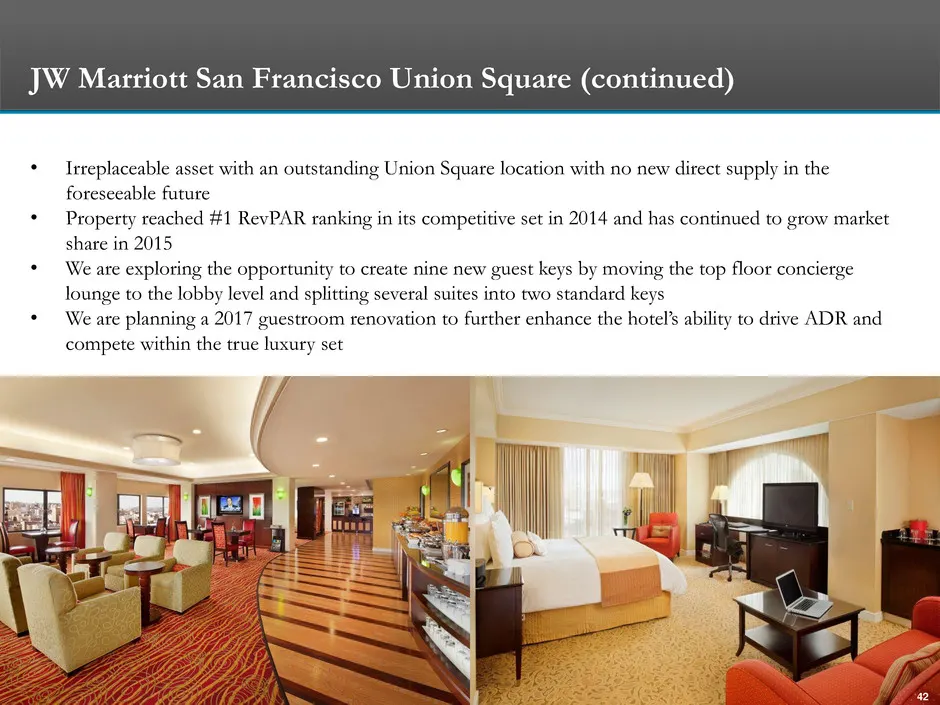
42 • Irreplaceable asset with an outstanding Union Square location with no new direct supply in the foreseeable future • Property reached #1 RevPAR ranking in its competitive set in 2014 and has continued to grow market share in 2015 • We are exploring the opportunity to create nine new guest keys b

Slide 43: Boston
43 Boston
Slide 44: Hyatt Regency Boston Investment Highlights
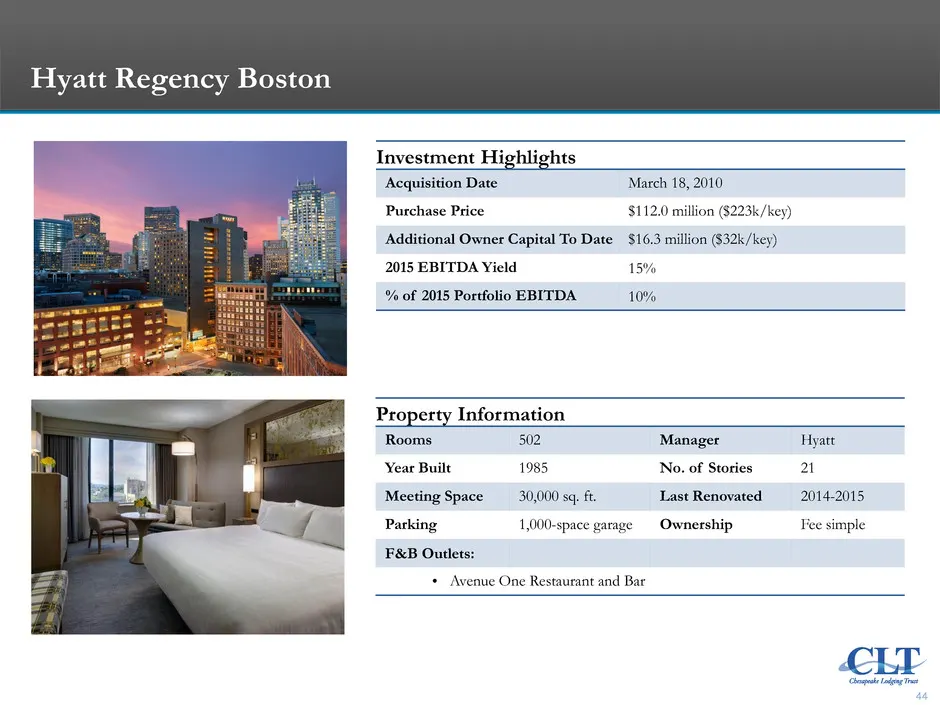
44 Hyatt Regency Boston Investment Highlights Acquisition Date March 18, 2010 Purchase Price $112.0 million ($223k/key) Additional Owner Capital To Date $16.3 million ($32k/key) 2015 EBITDA Yield 15% % of 2015 Portfolio EBITDA 10% Property Information Rooms 502 Manager Hyatt Year Built 1985 No. of S
Slide 45: Hyatt Regency Boston (continued)
45 Hyatt Regency Boston (continued)
Slide 46: Hyatt Regency Boston (continued)
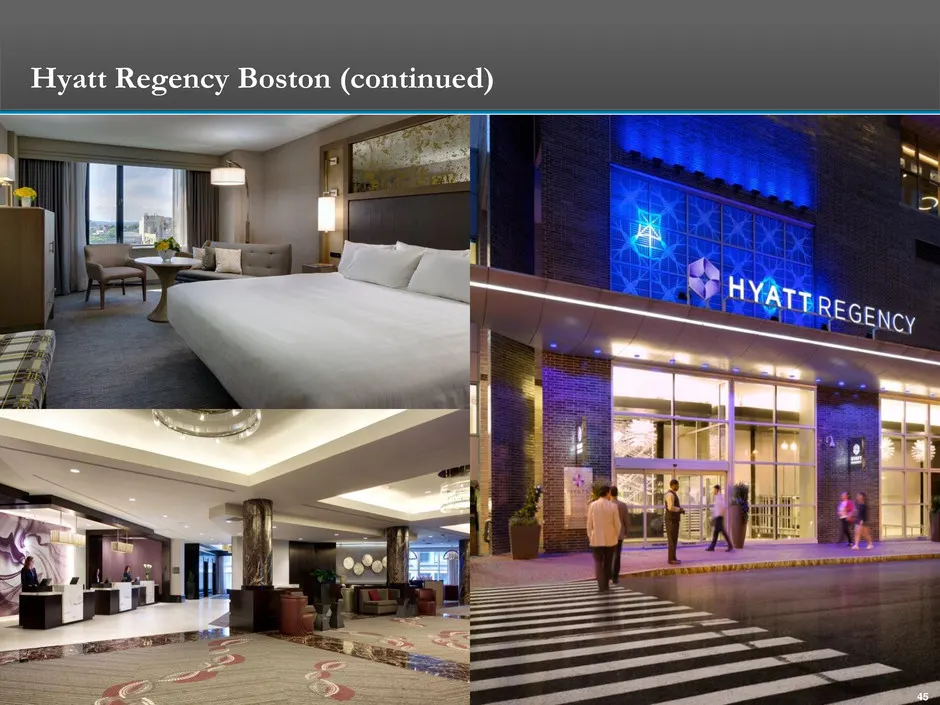
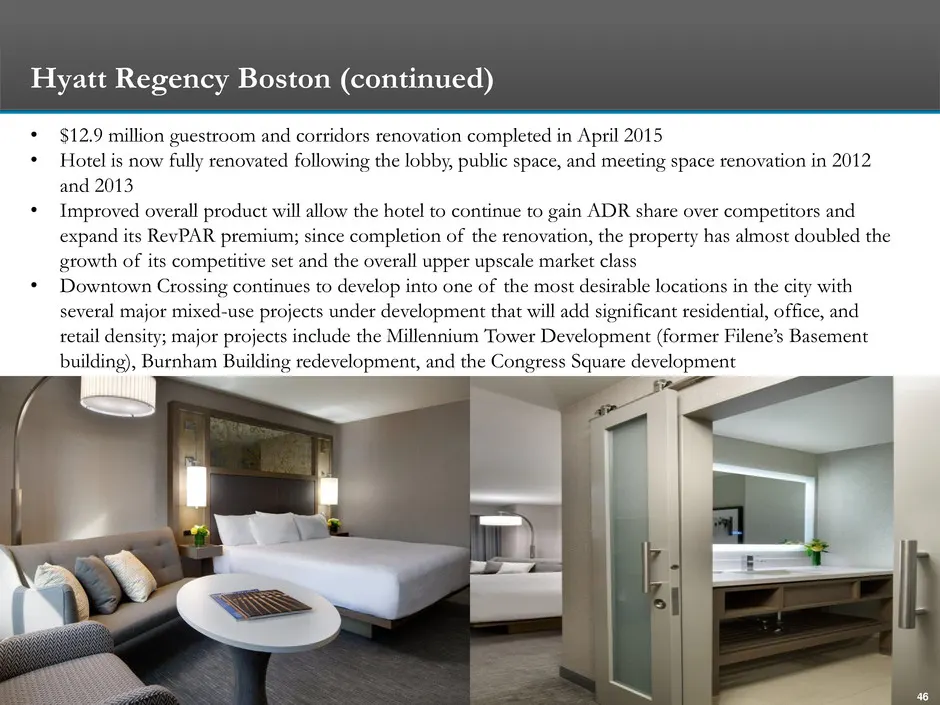
46 • $12.9 million guestroom and corridors renovation completed in April 2015 • Hotel is now fully renovated following the lobby, public space, and meeting space renovation in 2012 and 2013 • Improved overall product will allow the hotel to continue to gain ADR share over competitors and expand its
Slide 47: Boston Marriott Newton Investment Highlights
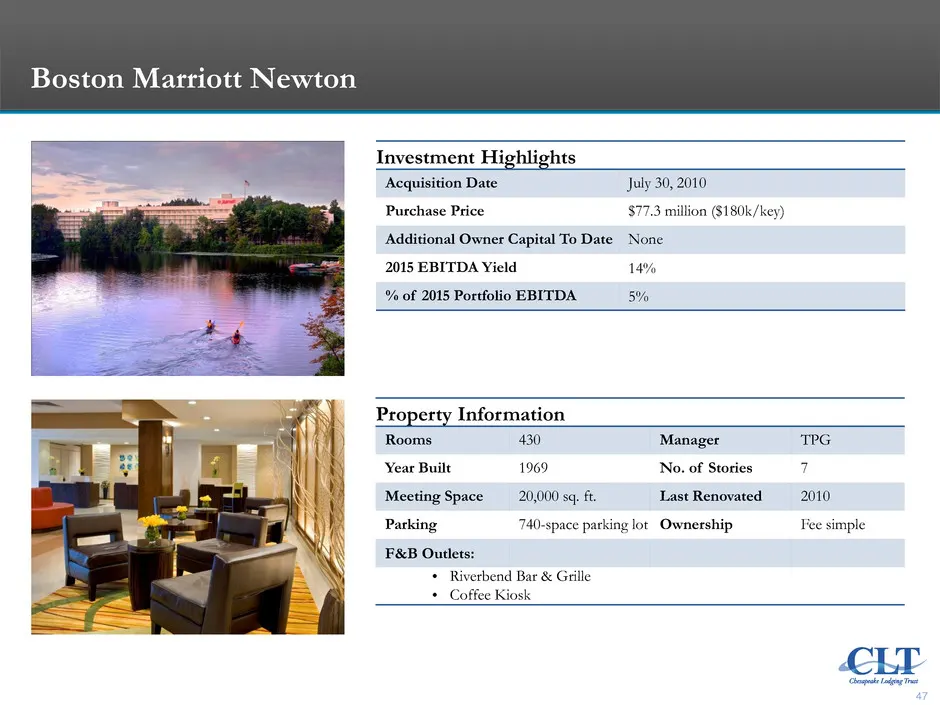
47 Boston Marriott Newton Investment Highlights Acquisition Date July 30, 2010 Purchase Price $77.3 million ($180k/key) Additional Owner Capital To Date None 2015 EBITDA Yield 14% % of 2015 Portfolio EBITDA 5% Property Information Rooms 430 Manager TPG Year Built 1969 No. of Stories 7 Meeting Space

Slide 48: Chicago
48 Chicago
Slide 49: W Chicago – City Center Investment Highlights
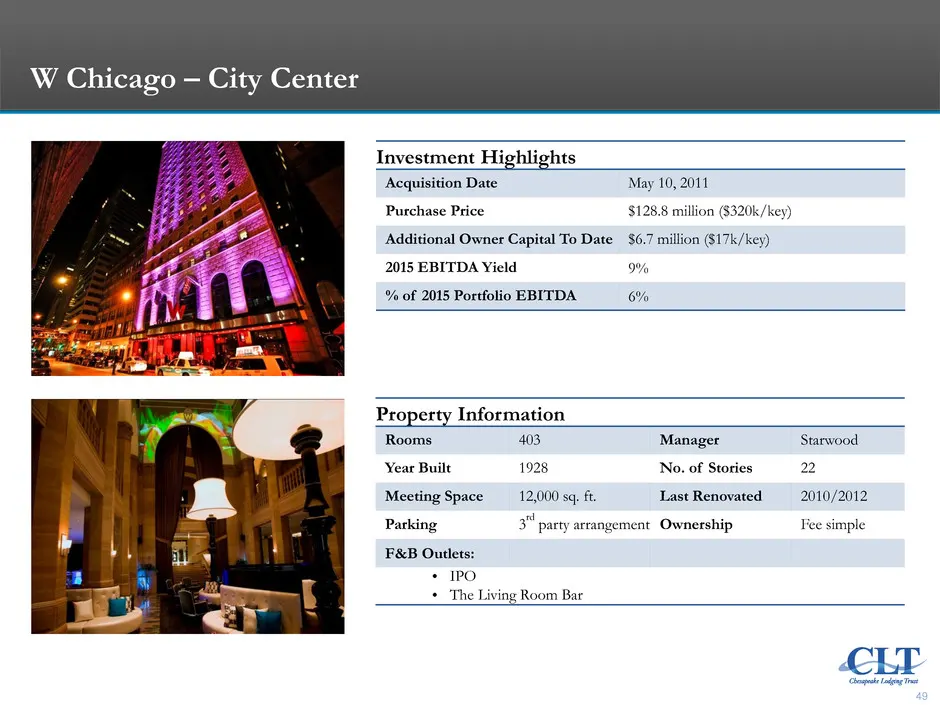
49 W Chicago – City Center Investment Highlights Acquisition Date May 10, 2011 Purchase Price $128.8 million ($320k/key) Additional Owner Capital To Date $6.7 million ($17k/key) 2015 EBITDA Yield 9% % of 2015 Portfolio EBITDA 6% Property Information Rooms 403 Manager Starwood Year Built 1928 No. of
Slide 50: W Chicago – Lakeshore Investment Highlights
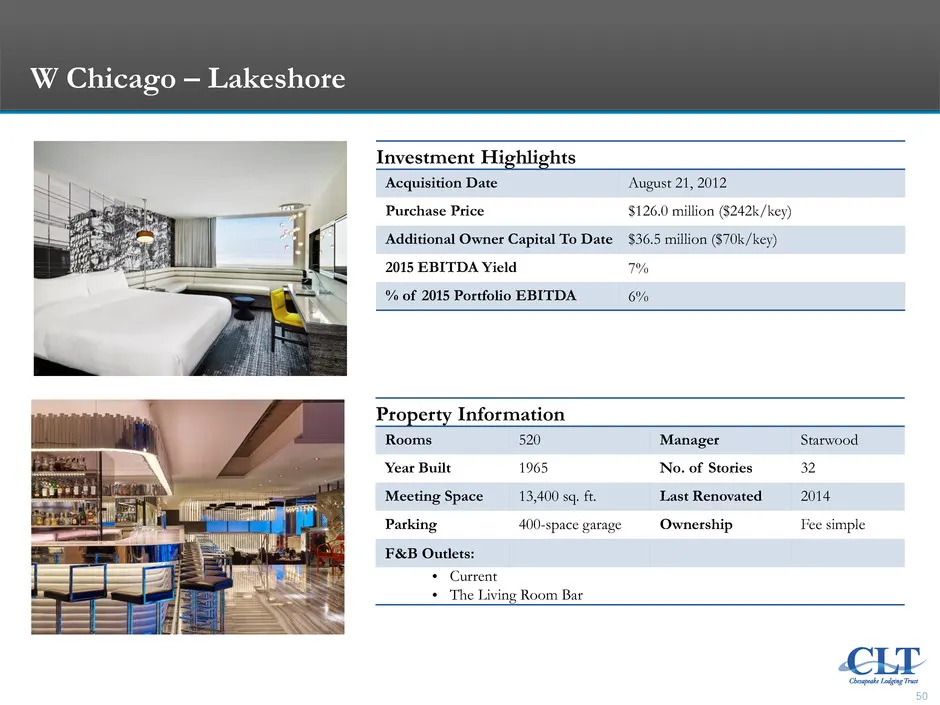
50 W Chicago – Lakeshore Investment Highlights Acquisition Date August 21, 2012 Purchase Price $126.0 million ($242k/key) Additional Owner Capital To Date $36.5 million ($70k/key) 2015 EBITDA Yield 7% % of 2015 Portfolio EBITDA 6% Property Information Rooms 520 Manager Starwood Year Built 1965 No. o
Slide 51: W Chicago – Lakeshore (continued)
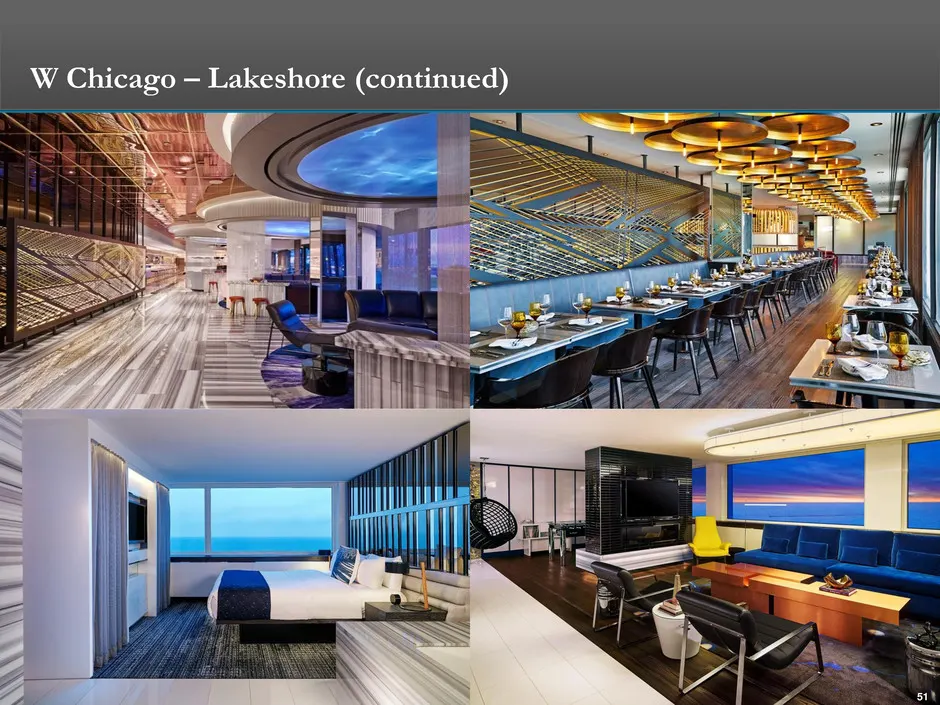
51 W Chicago – Lakeshore (continued)
Slide 52: W Chicago – Lakeshore (continued)
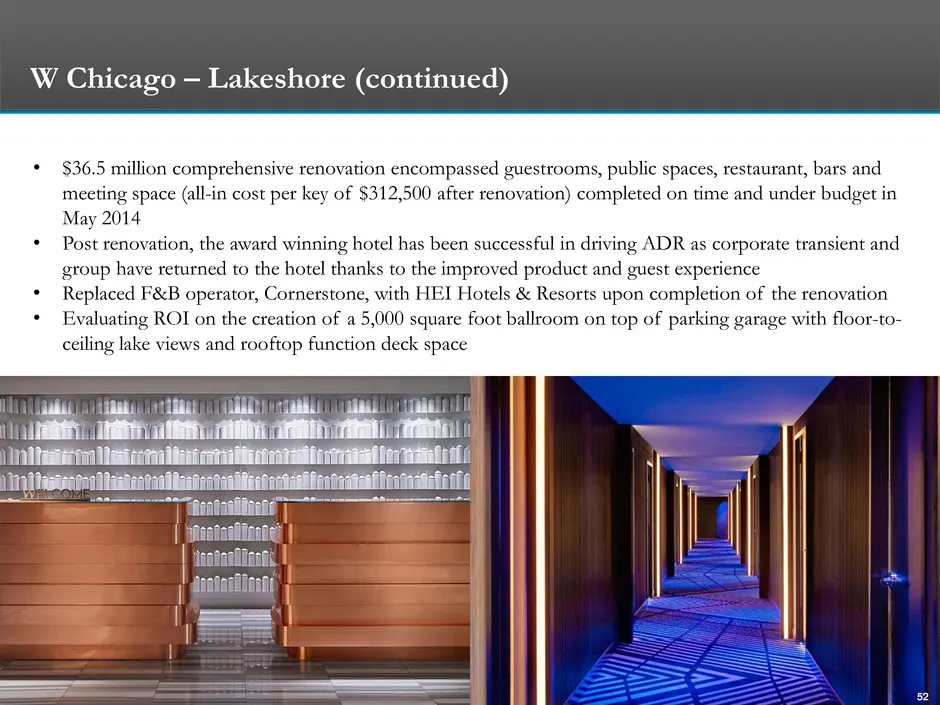
52 • $36.5 million comprehensive renovation encompassed guestrooms, public spaces, restaurant, bars and meeting space (all-in cost per key of $312,500 after renovation) completed on time and under budget in May 2014 • Post renovation, the award winning hotel has been successful in driving ADR as cor

Slide 53: Other Key Assets
53 Other Key Assets
Slide 54: Denver Marriott City Center Investment Highlights
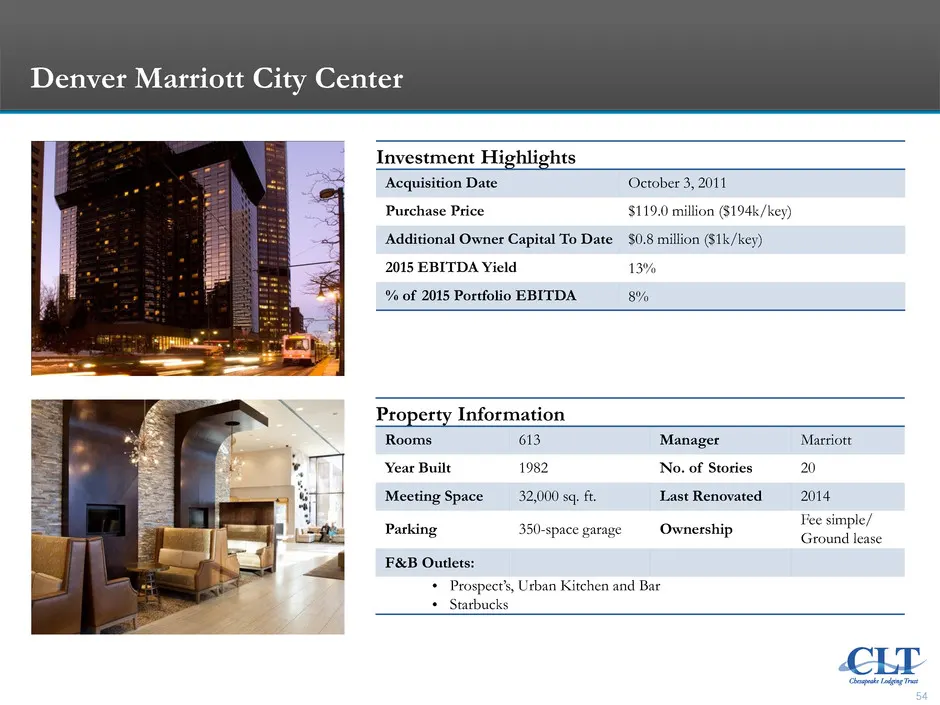
54 Denver Marriott City Center Investment Highlights Acquisition Date October 3, 2011 Purchase Price $119.0 million ($194k/key) Additional Owner Capital To Date $0.8 million ($1k/key) 2015 EBITDA Yield 13% % of 2015 Portfolio EBITDA 8% Property Information Rooms 613 Manager Marriott Year Built 1982
Slide 55: Le Meridien New Orleans Investment Highlights
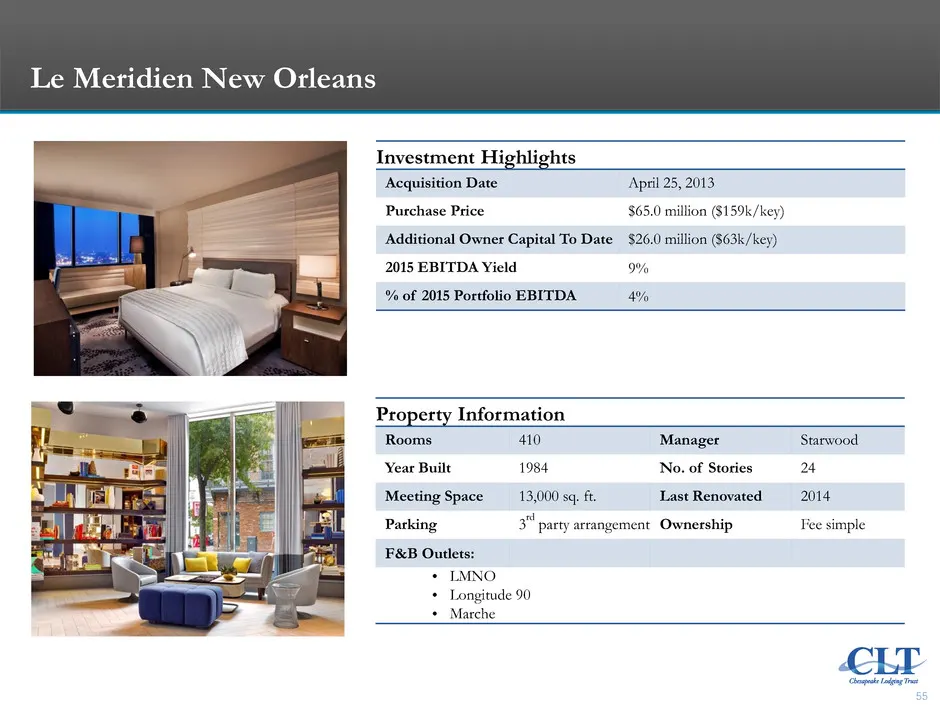
55 Le Meridien New Orleans Investment Highlights Acquisition Date April 25, 2013 Purchase Price $65.0 million ($159k/key) Additional Owner Capital To Date $26.0 million ($63k/key) 2015 EBITDA Yield 9% % of 2015 Portfolio EBITDA 4% Property Information Rooms 410 Manager Starwood Year Built 1984 No. o
Slide 56: Le Meridien New Orleans (continued)
56 Le Meridien New Orleans (continued)
Slide 57: Le Meridien New Orleans (continued)
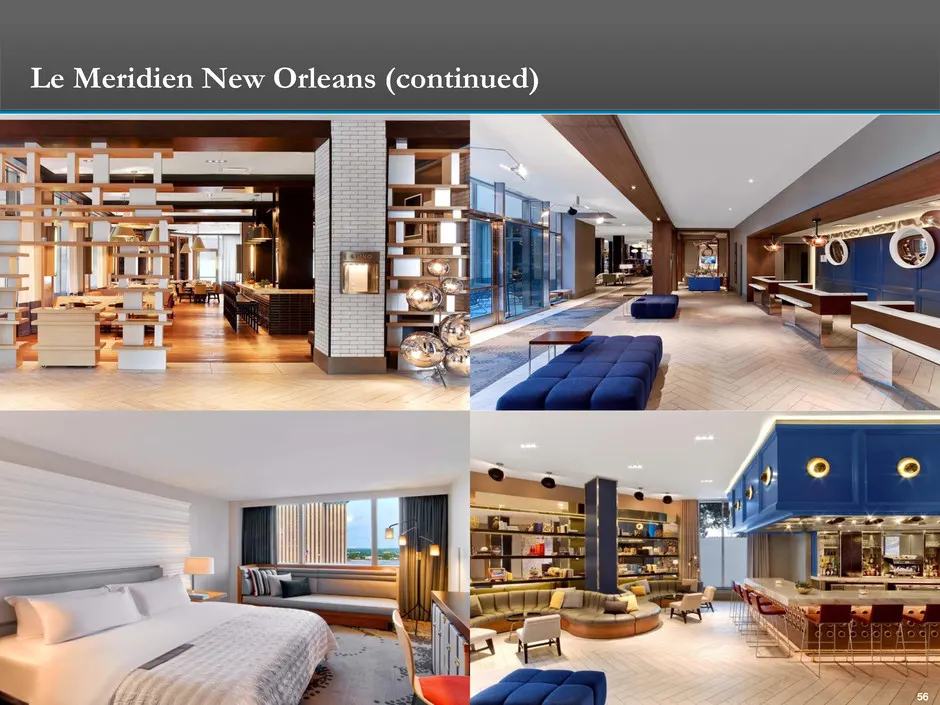
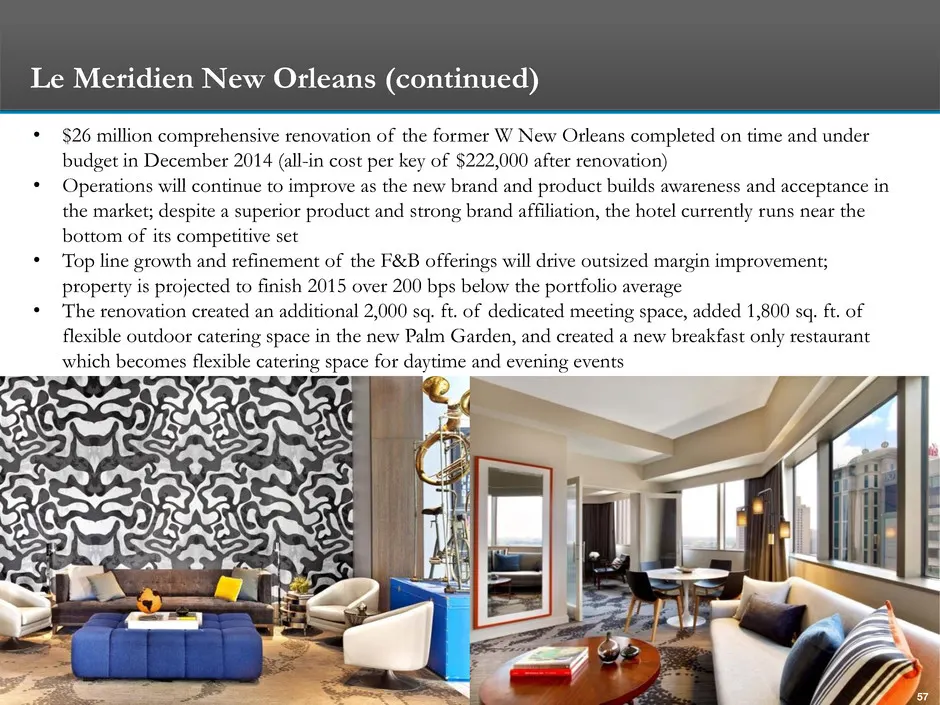
57 • $26 million comprehensive renovation of the former W New Orleans completed on time and under budget in December 2014 (all-in cost per key of $222,000 after renovation) • Operations will continue to improve as the new brand and product builds awareness and acceptance in the market; despite a sup
Slide 58: Le Meridien New Orleans (continued)
58 • The hotel has underperformed expectations following the renovation, however, initiatives have been implemented and are expected to drive performance corrections going forward: • Leadership and Personnel: several hotel executive team members have been replaced, including the General Manager and
Slide 59: Royal Palm South Beach Miami Investment Highlights
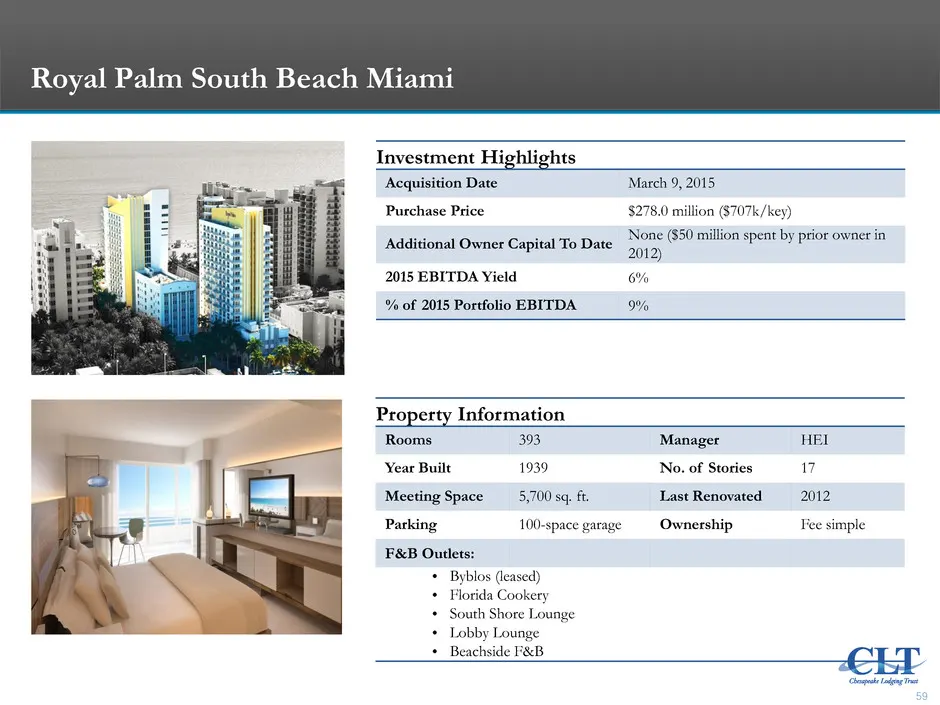
59 Royal Palm South Beach Miami Investment Highlights Acquisition Date March 9, 2015 Purchase Price $278.0 million ($707k/key) Additional Owner Capital To Date None ($50 million spent by prior owner in 2012) 2015 EBITDA Yield 6% % of 2015 Portfolio EBITDA 9% Property Information Rooms 393 Manager HE
Slide 60: Royal Palm South Beach Miami (continued)
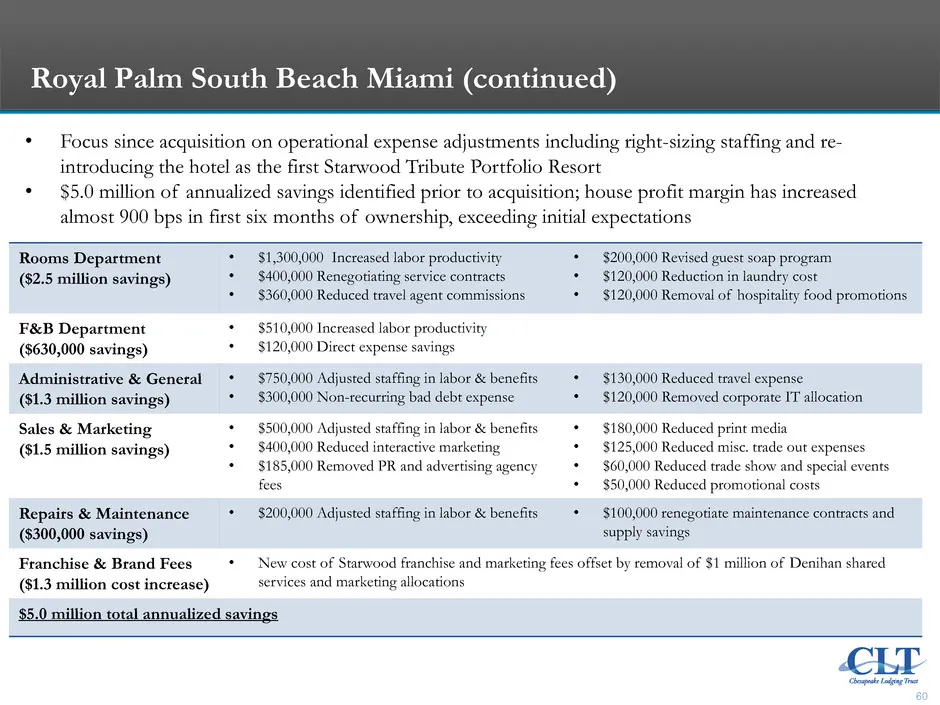
60 • Focus since acquisition on operational expense adjustments including right-sizing staffing and re- introducing the hotel as the first Starwood Tribute Portfolio Resort • $5.0 million of annualized savings identified prior to acquisition; house profit margin has increased almost 900 bps in first
Slide 61: Royal Palm South Beach Miami (continued)
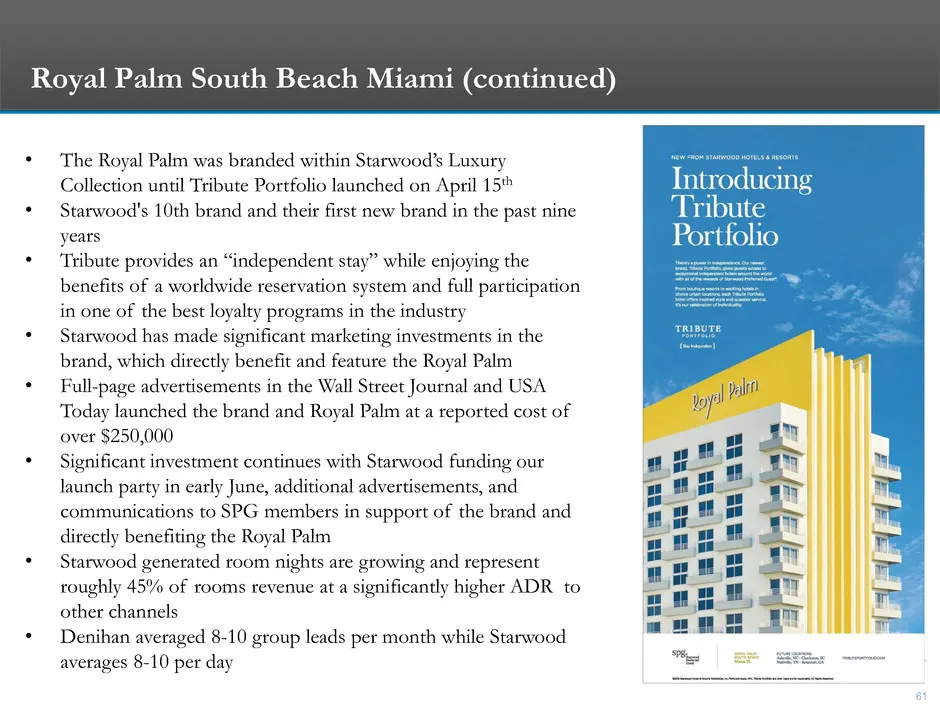
61 • The Royal Palm was branded within Starwood’s Luxury Collection until Tribute Portfolio launched on April 15th • Starwood's 10th brand and their first new brand in the past nine years • Tribute provides an “independent stay” while enjoying the benefits of a worldwide reservation system and full
Slide 62: Royal Palm South Beach Miami (continued)
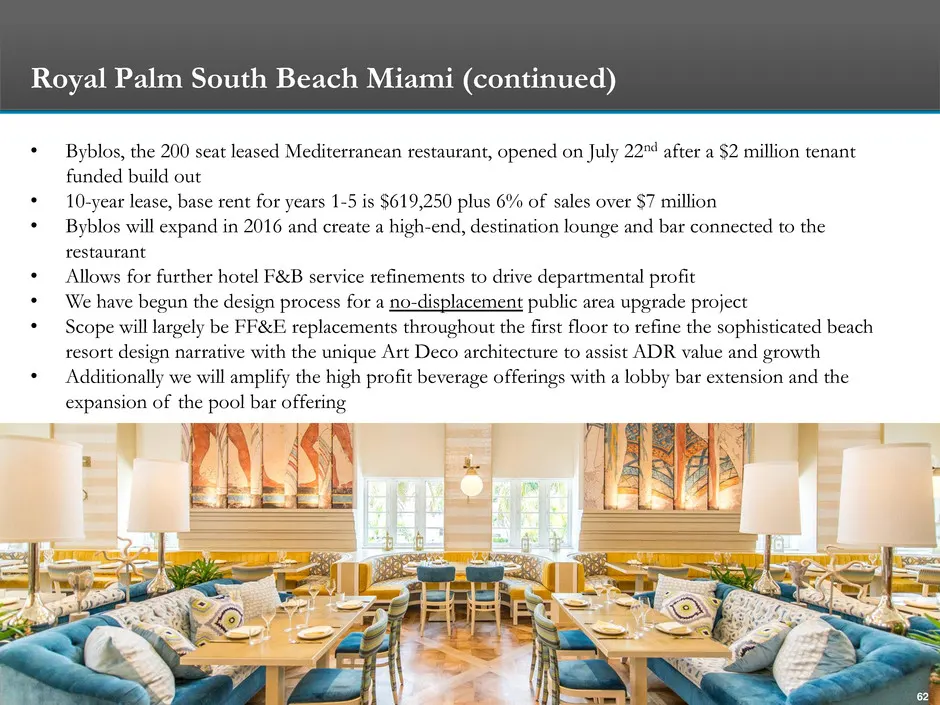
62 • Byblos, the 200 seat leased Mediterranean restaurant, opened on July 22nd after a $2 million tenant funded build out • 10-year lease, base rent for years 1-5 is $619,250 plus 6% of sales over $7 million • Byblos will expand in 2016 and create a high-end, destination lounge and bar connected to
Slide 63: Ace Hotel and Theater Downtown Los Angeles Investment Highlights
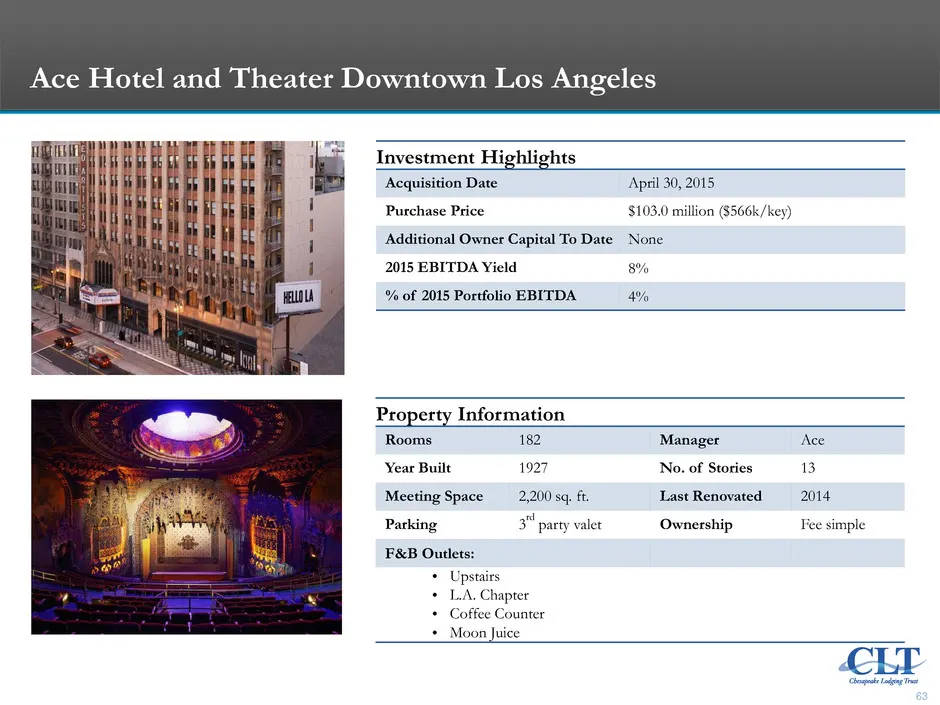
63 Ace Hotel and Theater Downtown Los Angeles Investment Highlights Acquisition Date April 30, 2015 Purchase Price $103.0 million ($566k/key) Additional Owner Capital To Date None 2015 EBITDA Yield 8% % of 2015 Portfolio EBITDA 4% Property Information Rooms 182 Manager Ace Year Built 1927 No. of Sto
Slide 64: Ace Hotel and Theater Downtown Los Angeles (continued)
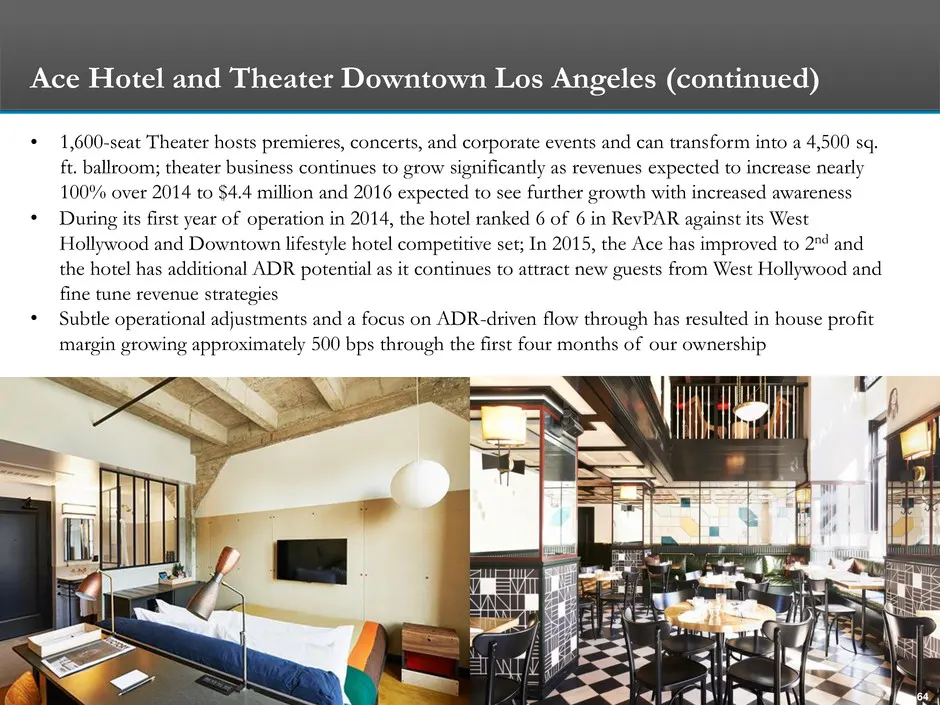
64 • 1,600-seat Theater hosts premieres, concerts, and corporate events and can transform into a 4,500 sq. ft. ballroom; theater business continues to grow significantly as revenues expected to increase nearly 100% over 2014 to $4.4 million and 2016 expected to see further growth with increased awar
Slide 65: Ace Hotel and Theater Downtown Los Angeles (continued)
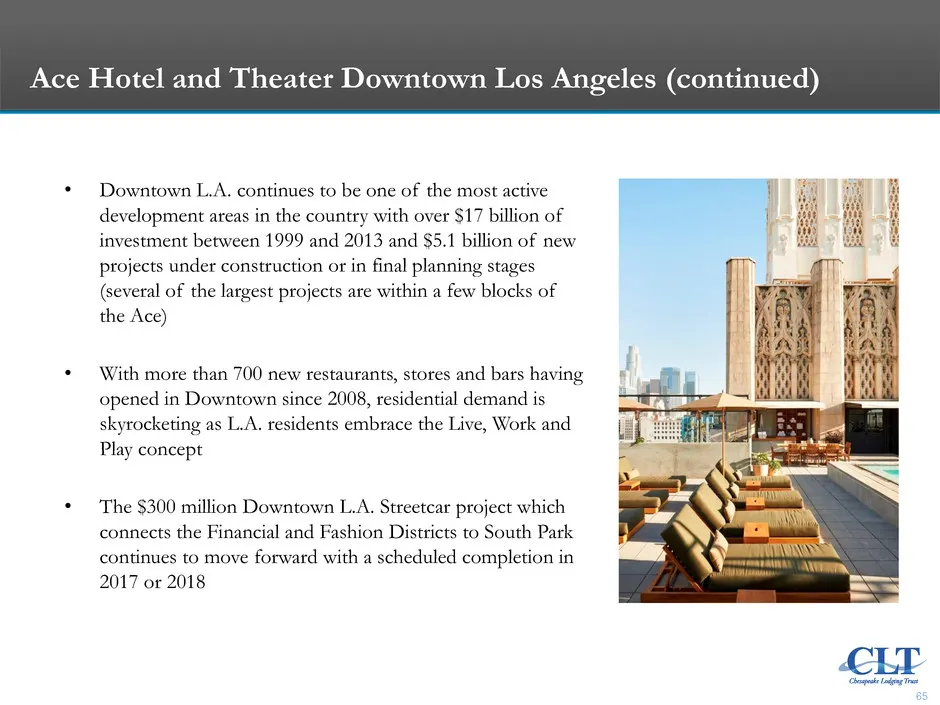
65 • Downtown L.A. continues to be one of the most active development areas in the country with over $17 billion of investment between 1999 and 2013 and $5.1 billion of new projects under construction or in final planning stages (several of the largest projects are within a few blocks of the Ace) •

Slide 66: Key Takeaways
66 Key Takeaways
Slide 67: 2016 Hypothetical Revenue Growth Scenarios
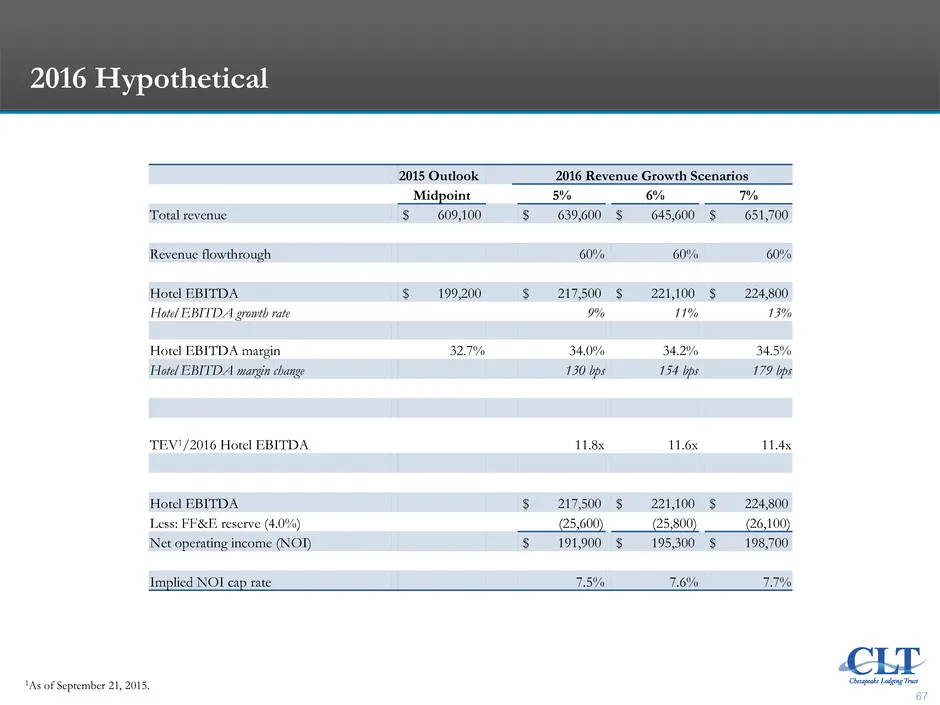
67 2016 Hypothetical 1As of September 21, 2015. 2015 Outlook 2016 Revenue Growth Scenarios Midpoint 5% 6% 7% Total revenue $ 609,100 $ 639,600 $ 645,600 $ 651,700 Revenue flowthrough 60% 60% 60% Hotel EBITDA $ 199,200 $ 217,500 $ 221,100 $ 224,800 Hotel EBITDA growth rate 9% 11% 13% Hotel EBITDA mar
Slide 68: Key Takeaways
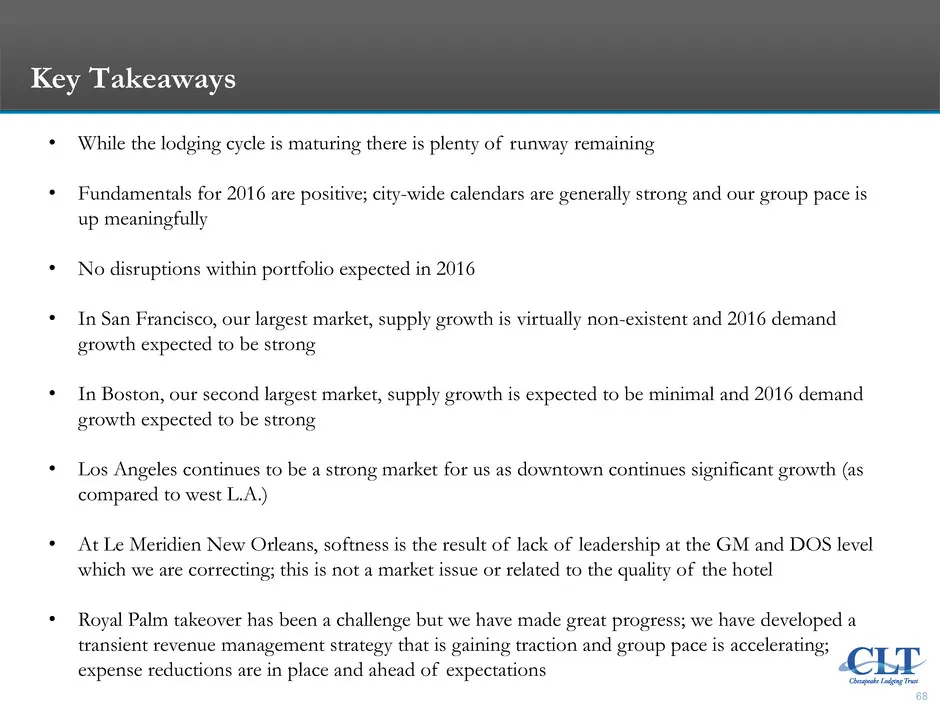
68 Key Takeaways • While the lodging cycle is maturing there is plenty of runway remaining • Fundamentals for 2016 are positive; city-wide calendars are generally strong and our group pace is up meaningfully • No disruptions within portfolio expected in 2016 • In San Francisco, our largest market, s
Source: SEC EDGAR · 8-K filed Sep 29, 2015