Comerica — Comerica Inc /New/ — Barclays Capital Global Financial Services Conference 2013
20 slides from Comerica's conference presentation, Sep 6, 2013
Slide 1: Comerica Incorporated, Barclays Capital Global Financial Services Conference
Comerica Incorporated Barclays Capital Global Financial Services ConferenceSeptember 9-11, 2013 Ralph W. Babb, Jr.Chairman and CEO Karen ParkhillVice Chairman and CFO Safe Harbor Statement Any statements in this presentation that are not historical facts are forward-looking statements as defined in
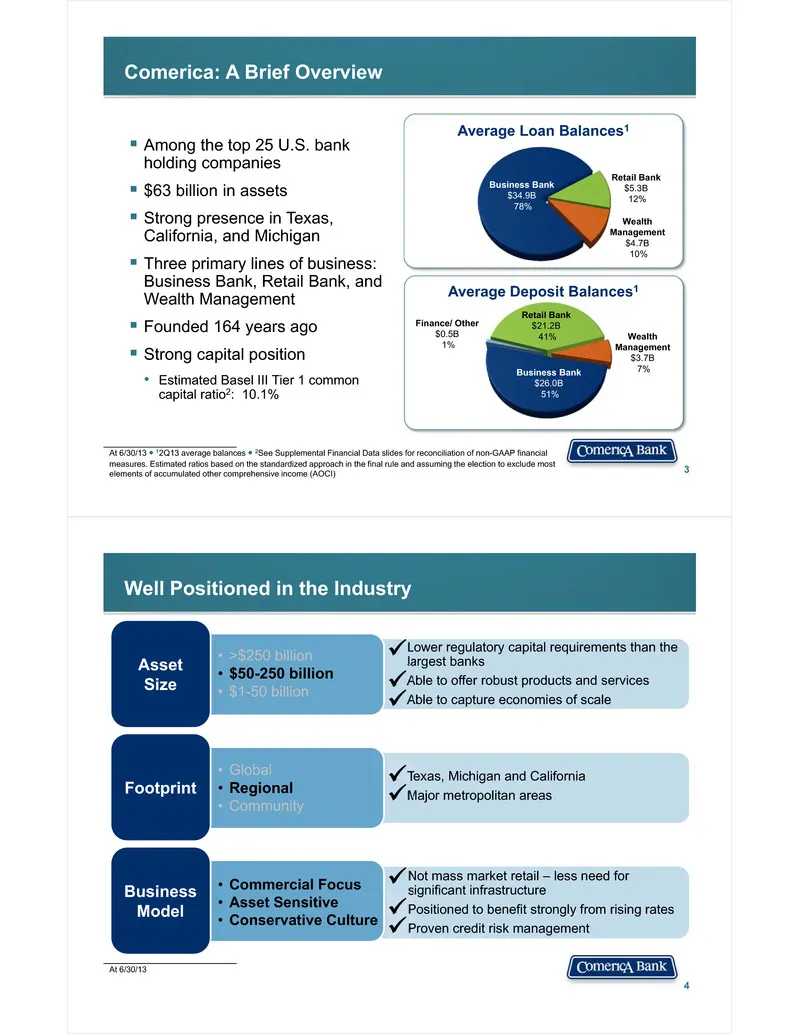
Slide 2: Comerica: A Brief Overview
Comerica: A Brief Overview Among the top 25 U.S. bank holding companies $63 billion in assets Strong presence in Texas, California, and Michigan Three primary lines of business: Business Bank, Retail Bank, and Wealth Management Founded 164 years ago Strong capital position• Estimated Bas
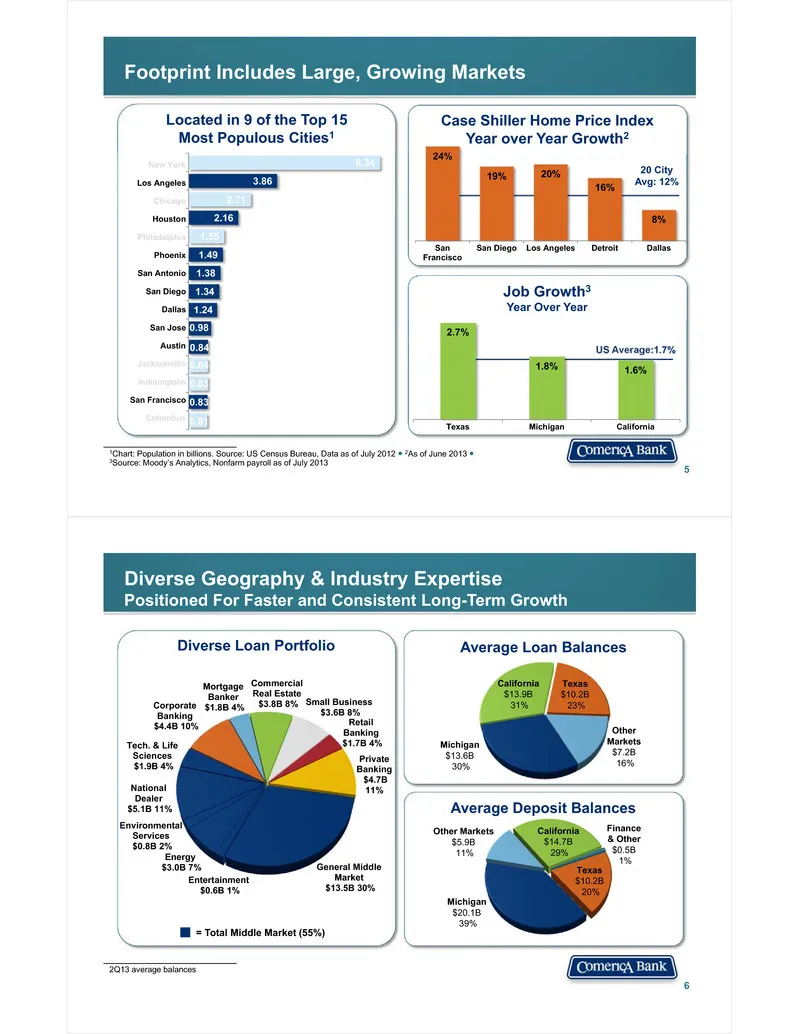
Slide 3: Footprint Includes Large, Growing Markets
24% 19% 20% 16% 8% SanFrancisco San Diego Los Angeles Detroit Dallas 5 Footprint Includes Large, Growing Markets Job Growth3Year Over Year Case Shiller Home Price IndexYear over Year Growth2 US Average:1.7% 20 City Avg: 12% 0.81 0.83 0.83 0.84 0.84 0.98 1.24 1.34 1.38 1.49 1.55 2.16 2.71 3.86 8.34 C
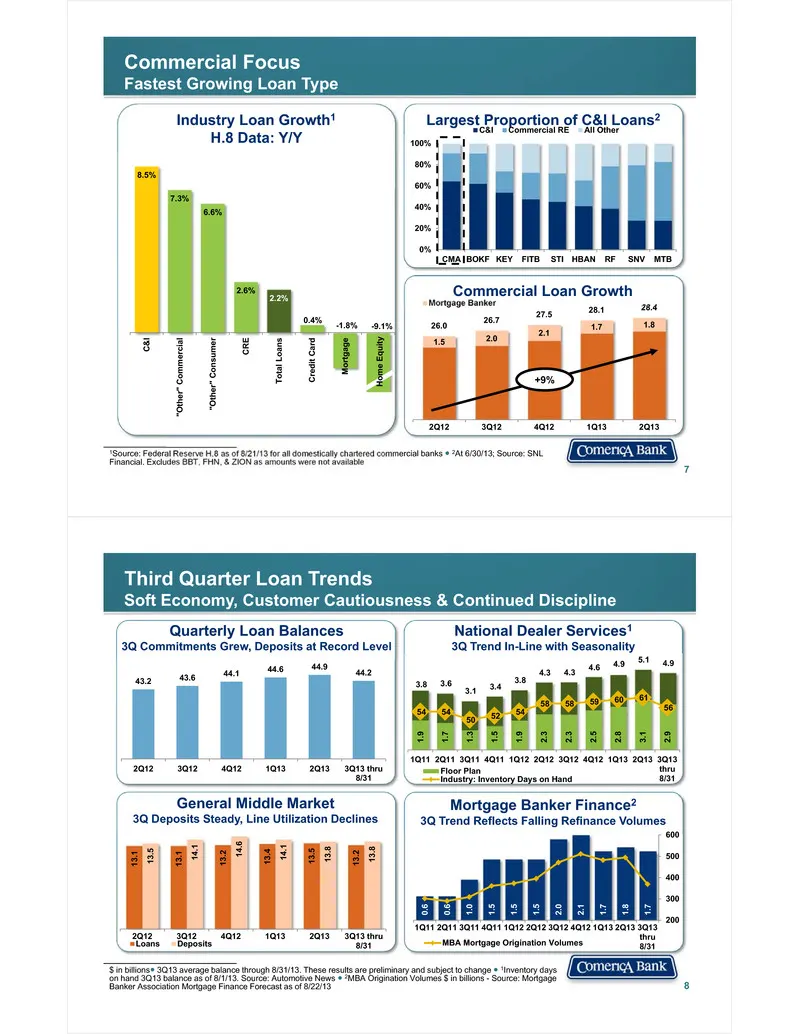
Slide 4: Commercial Focus
Commercial FocusFastest Growing Loan Type 7 Largest Proportion of C&I Loans2 0% 20% 40% 60% 80% 100% CMA BOKF KEY FITB STI HBAN RF SNV MTB C&I Commercial RE All Other 1Source: Federal Reserve H.8 as of 8/21/13 for all domestically chartered commercial banks ● 2At 6/30/13; Source: SNL Financial. Excl
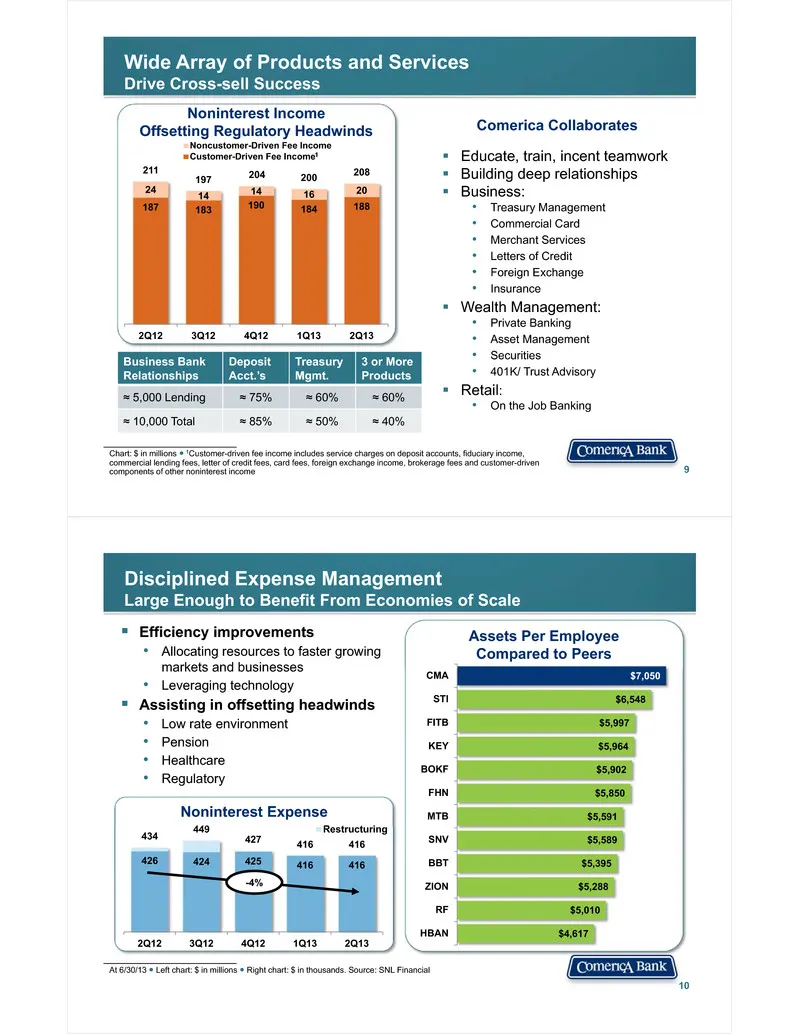
Slide 5: Wide Array of Products and Services Drive Cross-sell Success
Wide Array of Products and ServicesDrive Cross-sell Success 9 Noninterest Income Offsetting Regulatory Headwinds Chart: $ in millions ● 1Customer-driven fee income includes service charges on deposit accounts, fiduciary income, commercial lending fees, letter of credit fees, card fees, foreign excha
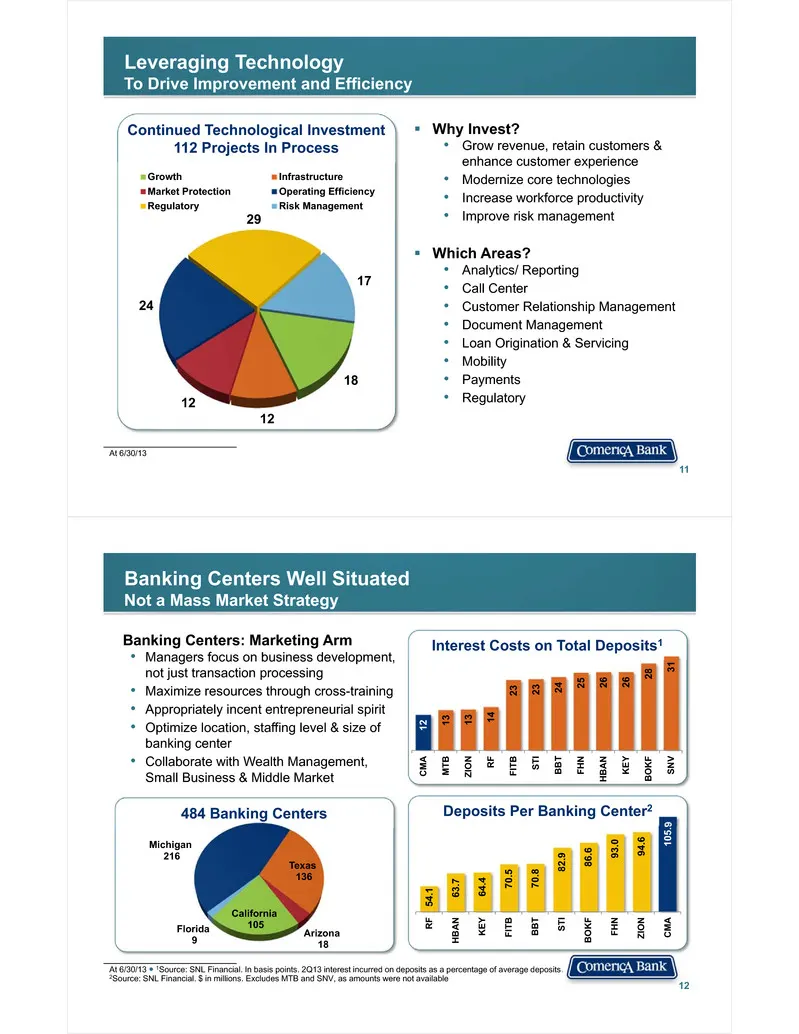
Slide 6: Leveraging Technology to Drive Improvement and Efficiency
Leveraging TechnologyTo Drive Improvement and Efficiency 11 Continued Technological Investment112 Projects In Process 18 12 12 24 29 17 Growth InfrastructureMarket Protection Operating EfficiencyRegulatory Risk Management Why Invest?• Grow revenue, retain customers & enhance customer experience• M
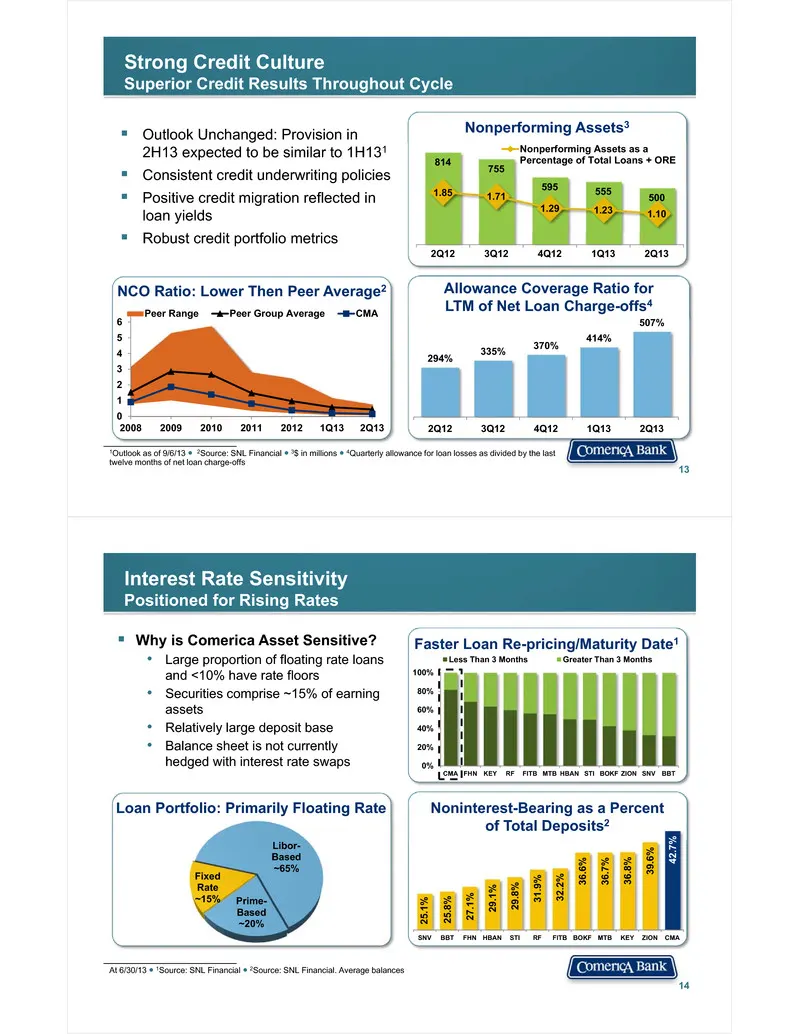
Slide 7: Strong Credit Culture: Superior Credit Results Throughout Cycle
1Outlook as of 9/6/13 ● 2Source: SNL Financial ● 3$ in millions ● 4Quarterly allowance for loan losses as divided by the last twelve months of net loan charge-offs 13 Strong Credit CultureSuperior Credit Results Throughout Cycle 814 755 595 555 5001.85 1.71 1.29 1.23 1.10 2Q12 3Q12 4Q12 1Q13 2Q13 No
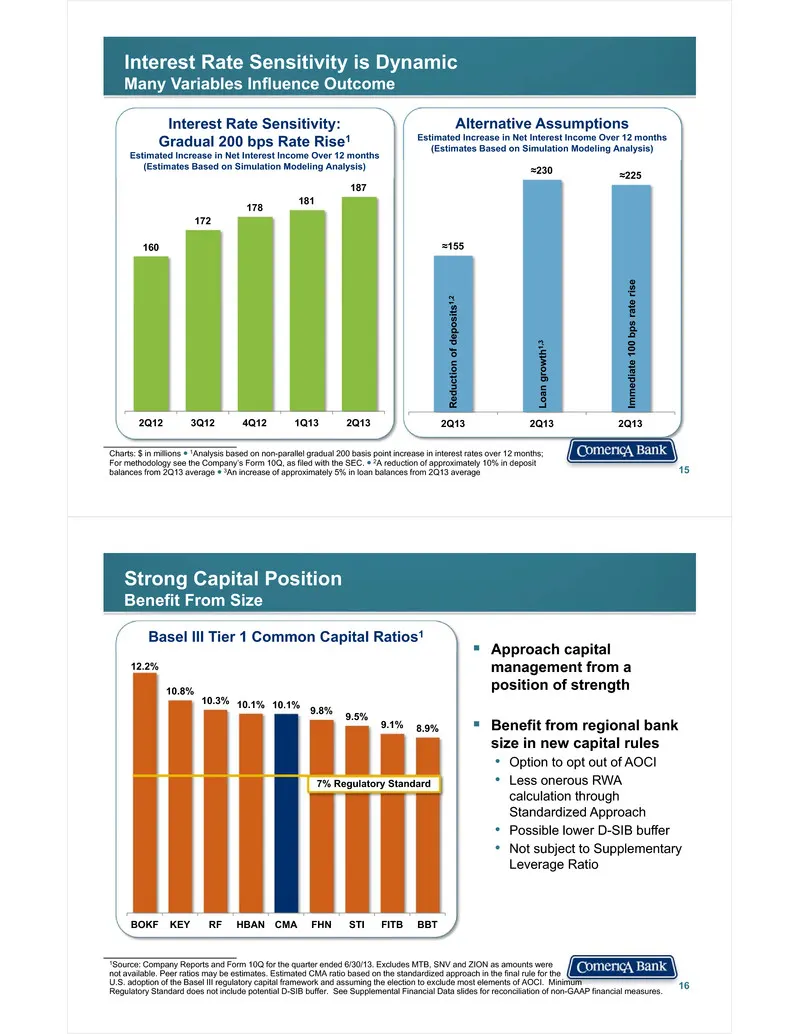
Slide 8: Interest Rate Sensitivity is Dynamic
≈155 ≈230 ≈225 2Q13 2Q13 2Q13 Interest Rate Sensitivity is DynamicMany Variables Influence Outcome 160 172 178 181 187 2Q12 3Q12 4Q12 1Q13 2Q13 Interest Rate Sensitivity: Gradual 200 bps Rate Rise1Estimated Increase in Net Interest Income Over 12 months(Estimates Based on Simulation Modeling Analysi
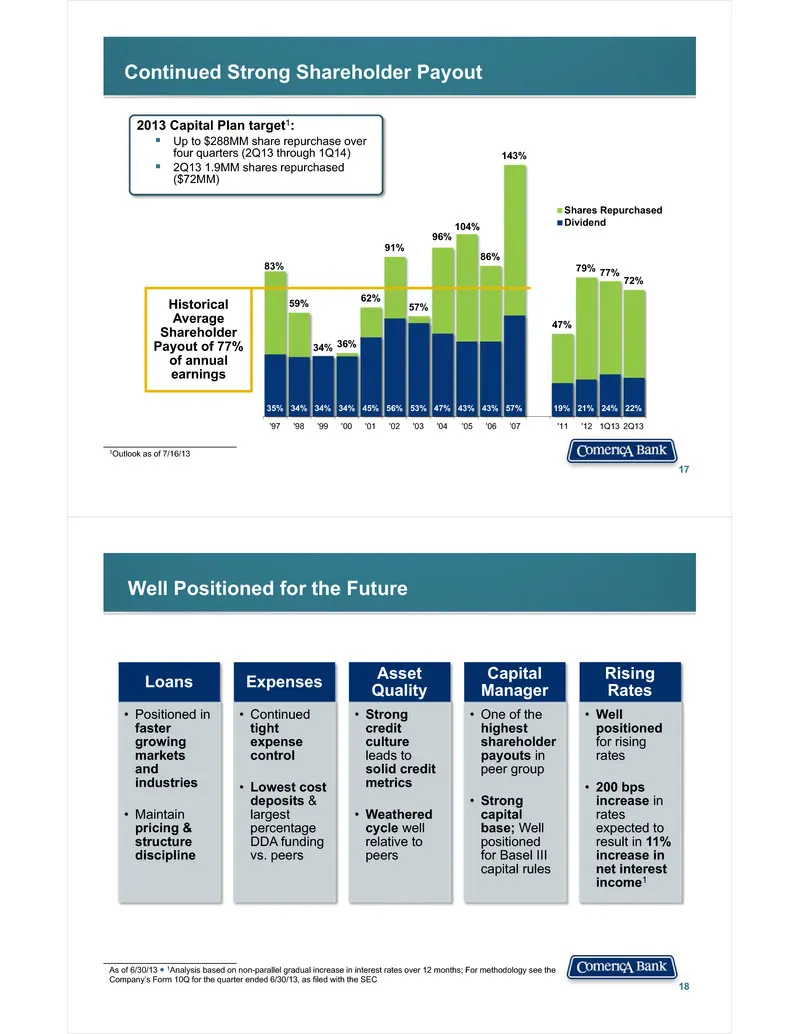
Slide 9: Continued Strong Shareholder Payout
83% 59% 34% 36% 62% 91% 57% 96% 104% 86% 143% 47% 79% 77% 72% 35% 34% 34% 34% 45% 56% 53% 47% 43% 43% 57% 19% 21% 24% 22% '97 '98 '99 '00 '01 '02 '03 '04 '05 '06 '07 '11 '12 1Q13 2Q13 Shares RepurchasedDividend Historical Average Shareholder Payout of 77% of annual earnings 17 Continued Strong Share
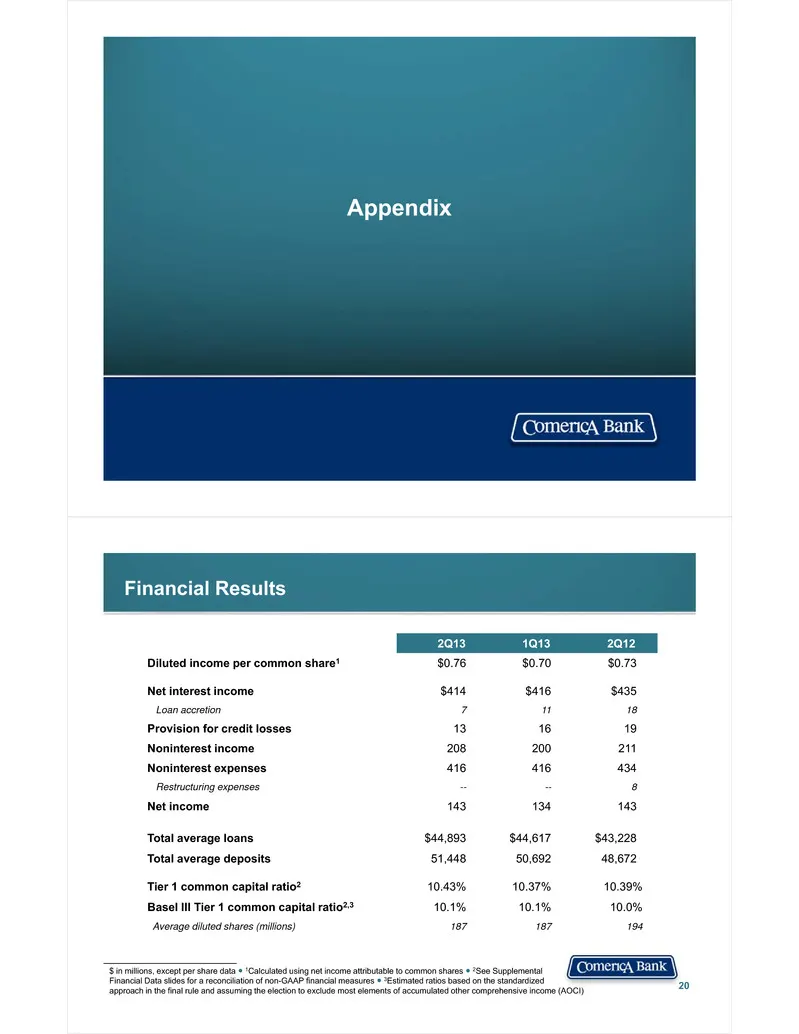
Slide 10: Appendix: Financial Results
Appendix Financial Results 20 2Q13 1Q13 2Q12 Diluted income per common share1 $0.76 $0.70 $0.73 Net interest income $414 $416 $435 Loan accretion 7 11 18 Provision for credit losses 13 16 19 Noninterest income 208 200 211 Noninterest expenses 416 416 434 Restructuring expenses -- -- 8 Net income 143
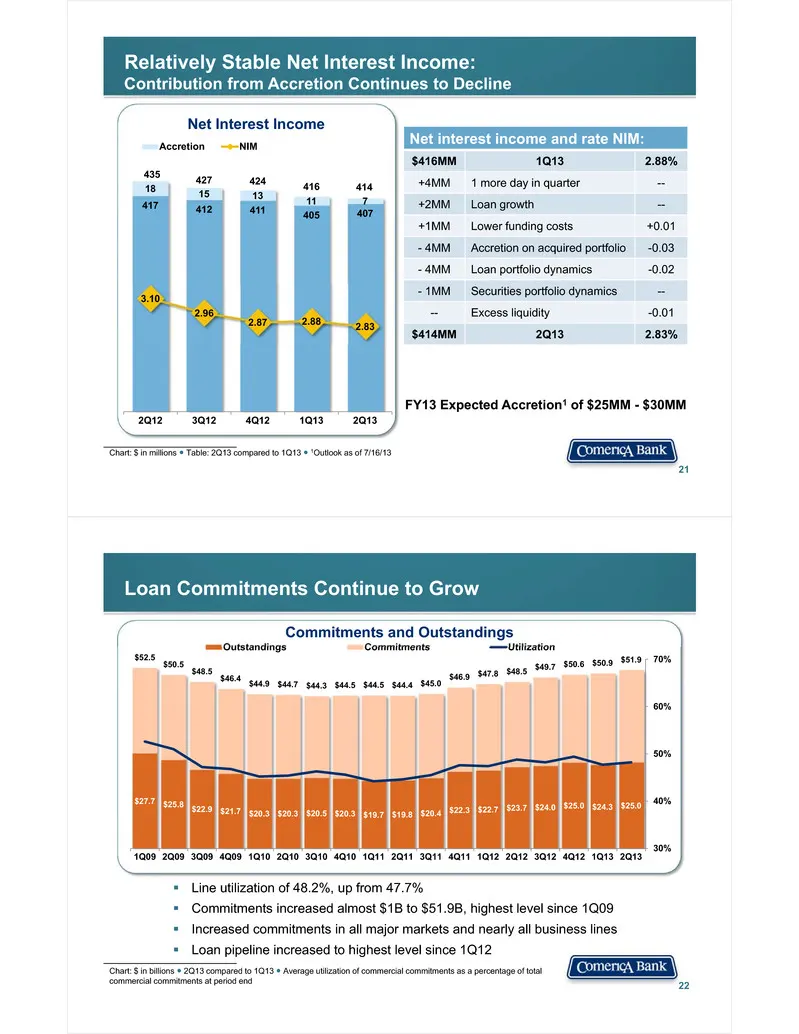
Slide 11: Relatively Stable Net Interest Income
Relatively Stable Net Interest Income:Contribution from Accretion Continues to Decline 21 Chart: $ in millions ● Table: 2Q13 compared to 1Q13 ● 1Outlook as of 7/16/13 Net Interest Income Net interest income and rate NIM: $416MM 1Q13 2.88% +4MM 1 more day in quarter -- +2MM Loan growth -- +1MM Lower
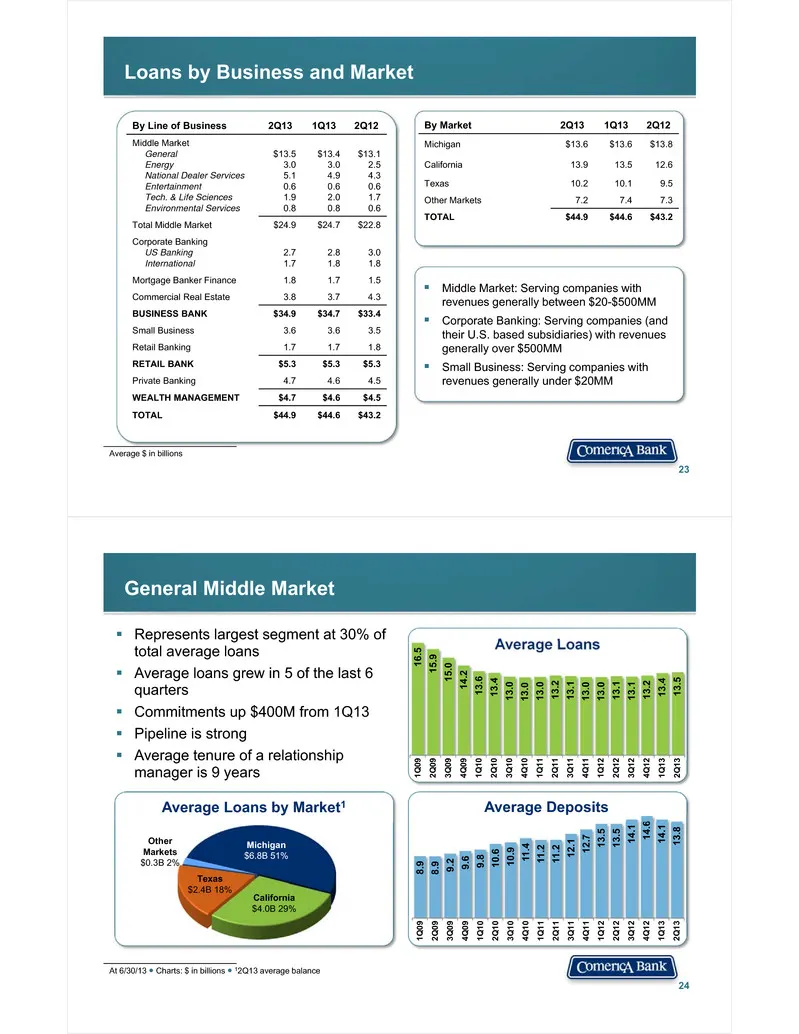
Slide 12: Loans by Business and Market
Loans by Business and Market 23 Middle Market: Serving companies with revenues generally between $20-$500MM Corporate Banking: Serving companies (and their U.S. based subsidiaries) with revenues generally over $500MM Small Business: Serving companies with revenues generally under $20MM Average
Slide 13: Mortgage Banker Finance and National Dealer Services
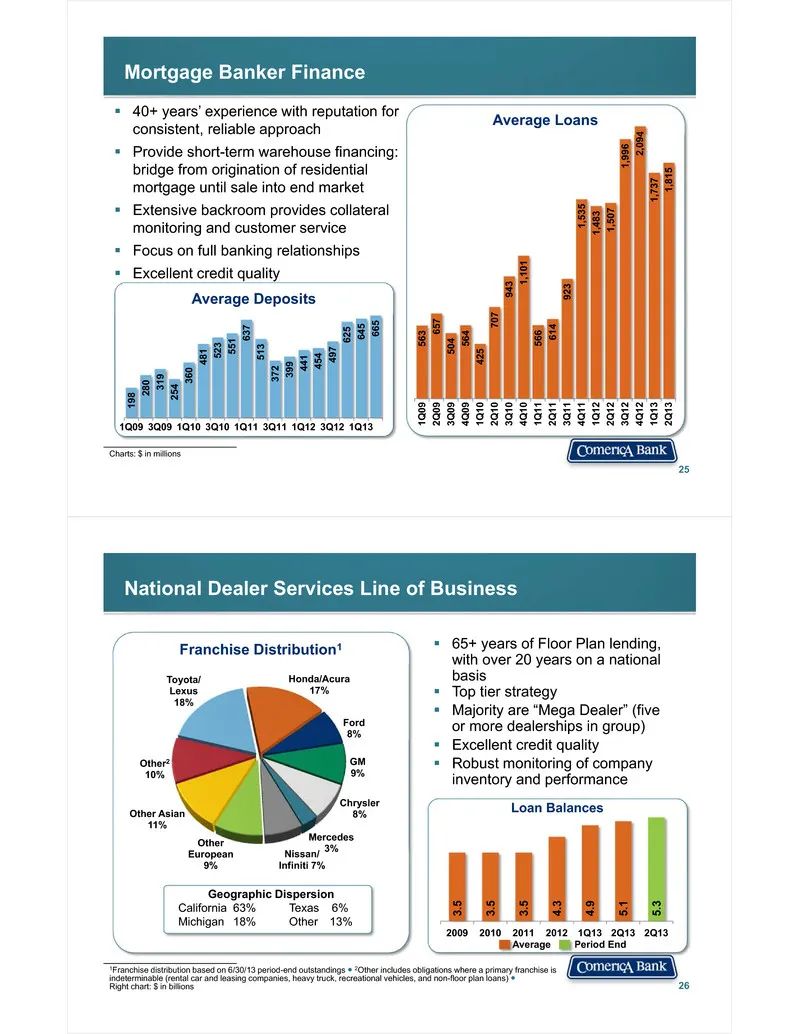
Mortgage Banker Finance 40+ years’ experience with reputation for consistent, reliable approach Provide short-term warehouse financing: bridge from origination of residential mortgage until sale into end market Extensive backroom provides collateral monitoring and customer service Focus on f
Slide 14: Energy and Technology and Life Sciences
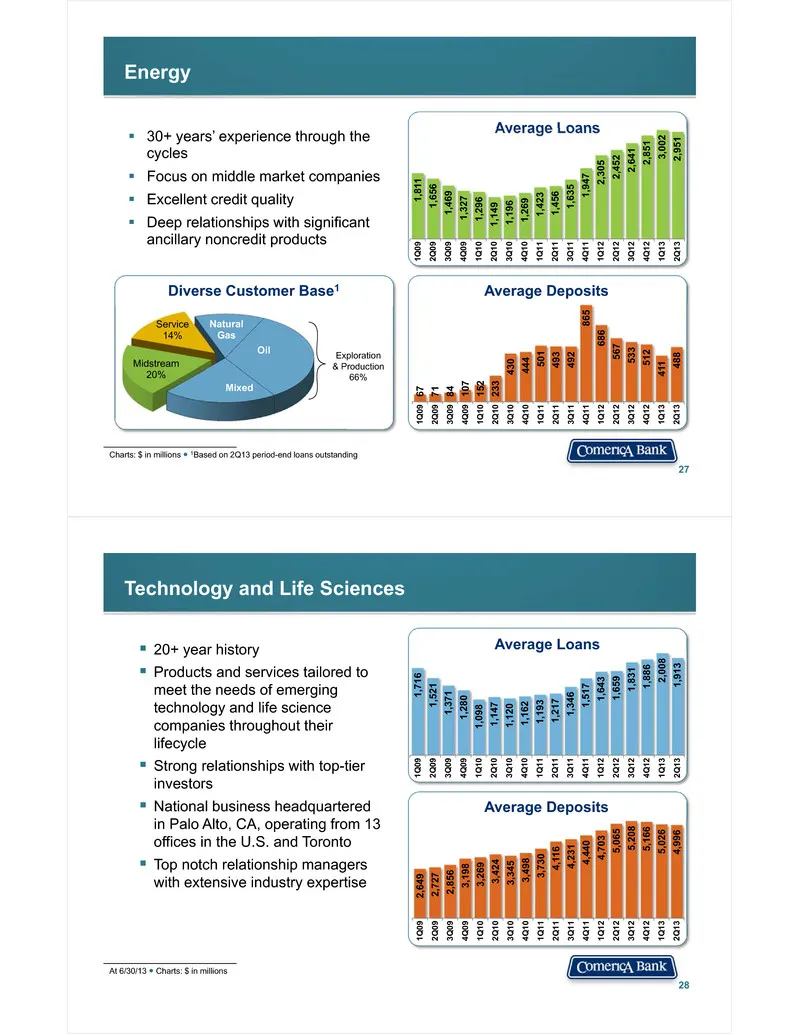
Energy 27 Average Loans Average Deposits 30+ years’ experience through the cycles Focus on middle market companies Excellent credit quality Deep relationships with significant ancillary noncredit products Natural Gas Oil Mixed Midstream 20% Service 14% Exploration & Production 66% Charts: $
Slide 15: Commercial Real Estate Line of Business
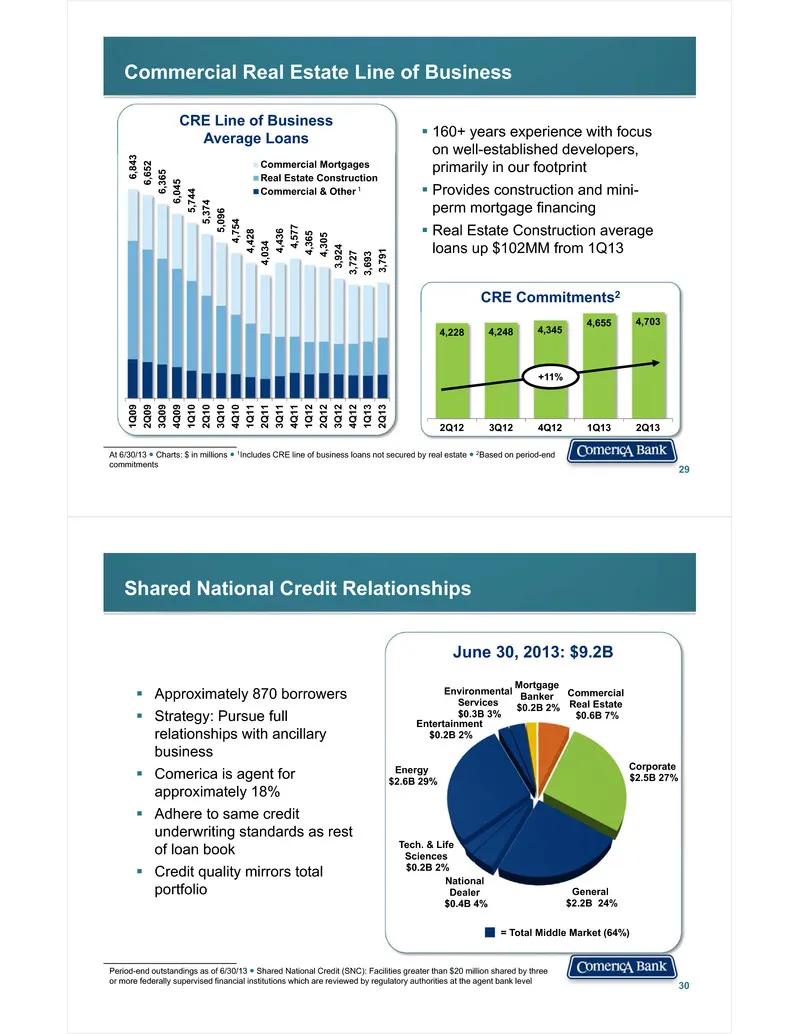
29 6,84 3 6,65 2 6,36 5 6,04 5 5,74 4 5,37 4 5,09 6 4,75 4 4,42 8 4,03 4 4,43 6 4,57 7 4,36 5 4,30 5 3,92 4 3,72 7 3,69 3 3,79 1 1Q0 9 2Q0 9 3Q0 9 4Q0 9 1Q1 0 2Q1 0 3Q1 0 4Q1 0 1Q1 1 2Q1 1 3Q1 1 4Q1 1 1Q1 2 2Q1 2 3Q1 2 4Q1 2 1Q1 3 2Q1 3 Commercial MortgagesReal Estate ConstructionCommercial & Other
Slide 16: Highly Liquid, Highly Rated Securities Portfolio
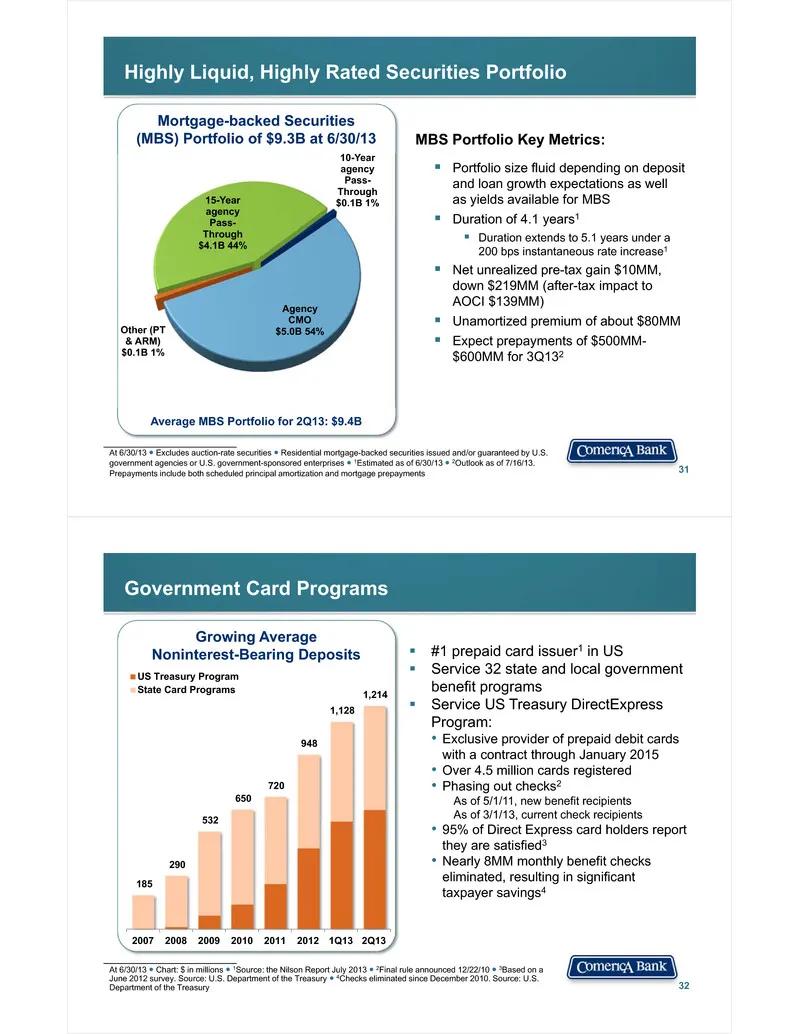
Highly Liquid, Highly Rated Securities Portfolio 31 At 6/30/13 ● Excludes auction-rate securities ● Residential mortgage-backed securities issued and/or guaranteed by U.S. government agencies or U.S. government-sponsored enterprises ● 1Estimated as of 6/30/13 ● 2Outlook as of 7/16/13. Prepayments in
Slide 17: Deposits by Business and Market
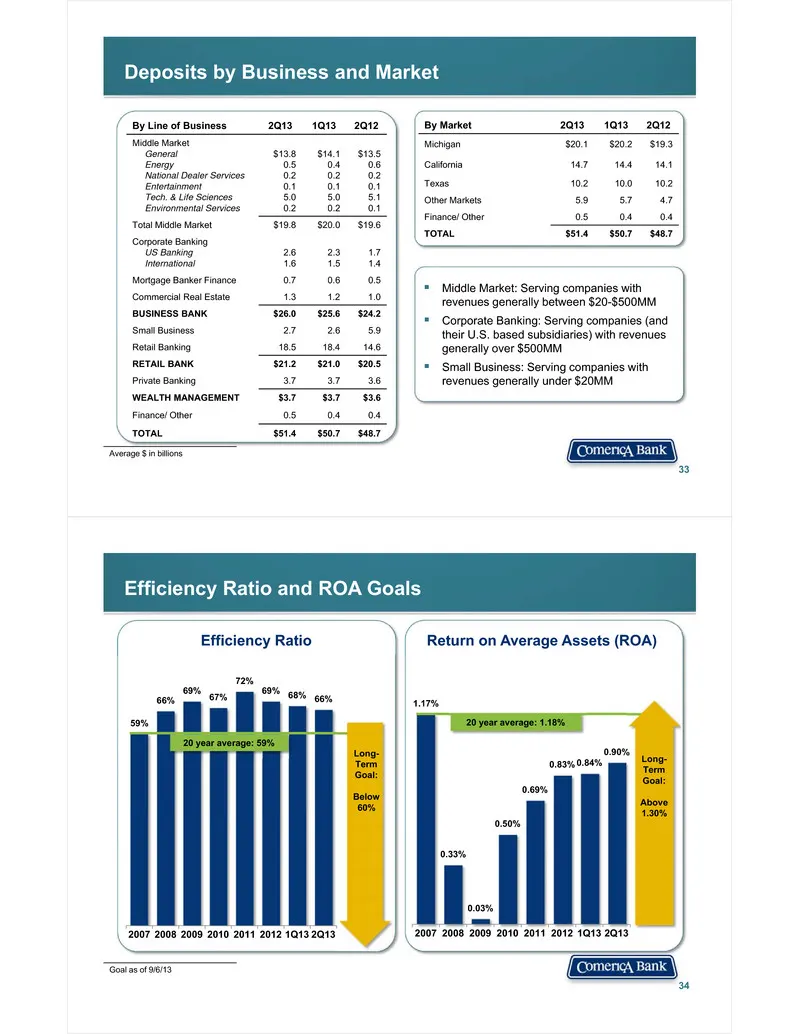
Deposits by Business and Market 33 Middle Market: Serving companies with revenues generally between $20-$500MM Corporate Banking: Serving companies (and their U.S. based subsidiaries) with revenues generally over $500MM Small Business: Serving companies with revenues generally under $20MM Aver
Slide 18: Long-Term Efficiency Ratio Goal and Credit Ratings
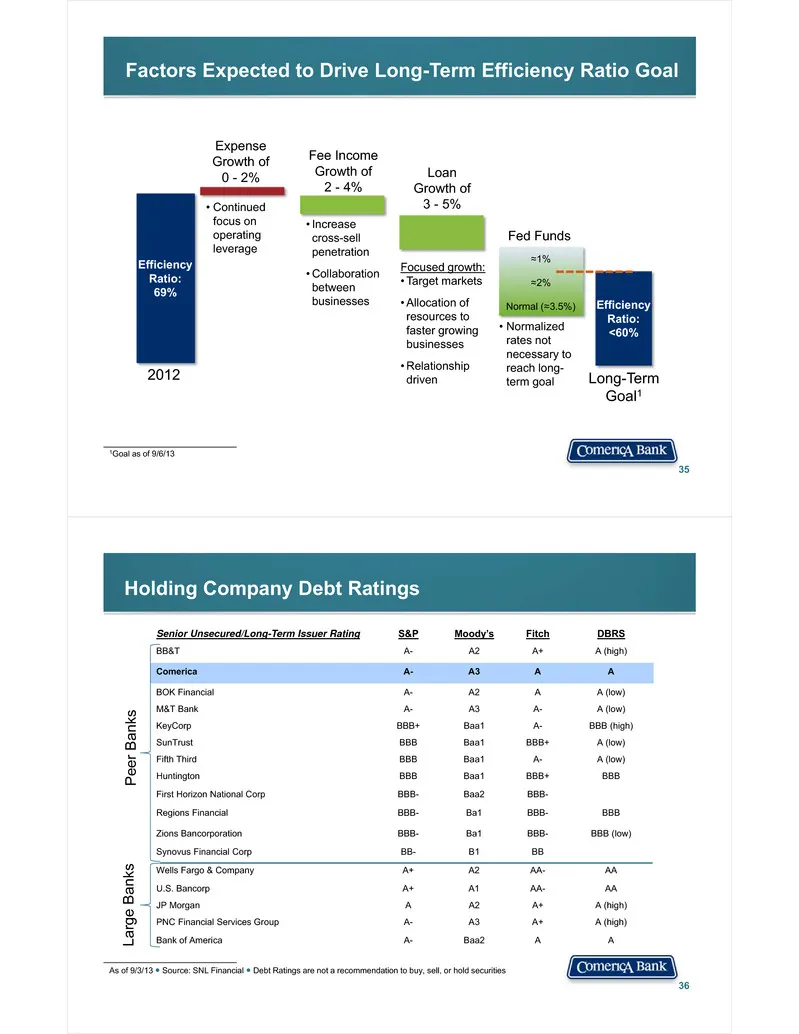
35 2012 Long-Term Goal1 Efficiency Ratio:69% Efficiency Ratio:<60% Expense Growth of 0 - 2% Fee Income Growth of 2 - 4% Loan Growth of 3 - 5% • Increase cross-sell penetration • Collaboration between businesses Focused growth:• Target markets • Allocation of resources to faster growing businesses •
Slide 19: Supplemental Financial Data
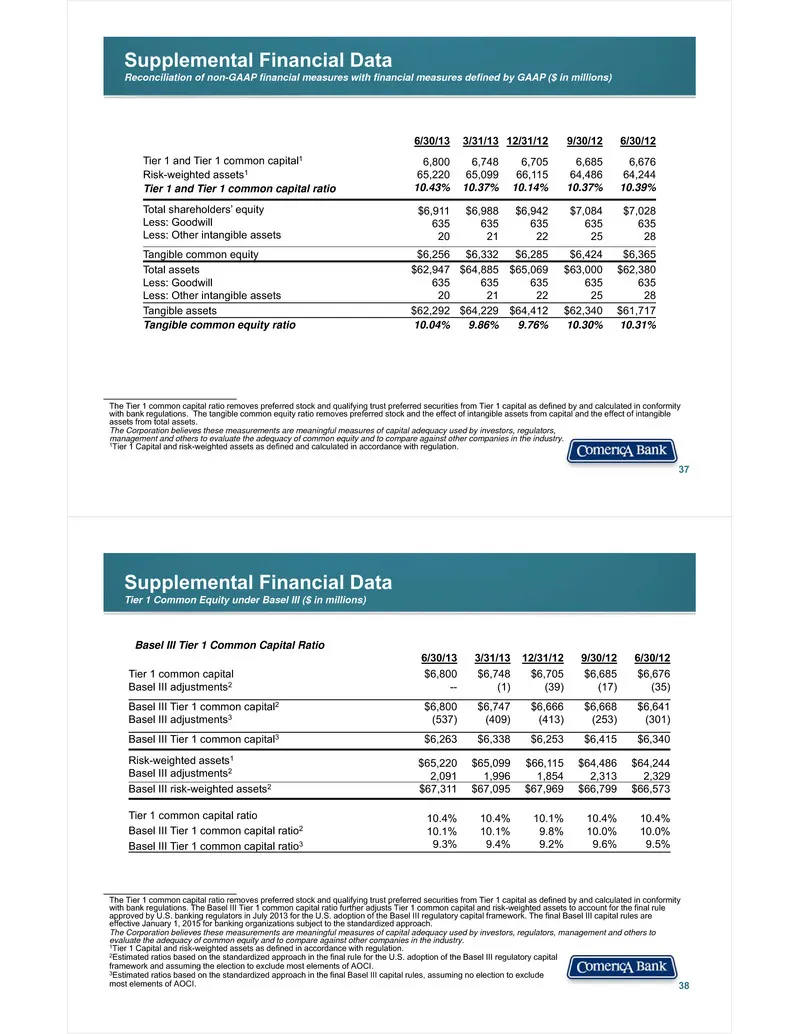
Supplemental Financial DataReconciliation of non-GAAP financial measures with financial measures defined by GAAP ($ in millions) 37 6/30/13 3/31/13 12/31/12 9/30/12 6/30/12 Tier 1 and Tier 1 common capital1Risk-weighted assets1Tier 1 and Tier 1 common capital ratio 6,80065,22010.43% 6,74865,09910.37

Slide 20
Source: SEC EDGAR · 8-K filed Sep 6, 2013
More decks from Comerica Incorporated
 Goldman Sachs Financial Services Conference 202520 slides · Dec 11, 2025
 Merger or Acquisition (October 2025)18 slides · Oct 6, 2025
 Barclays Global Financial Services Conference 202524 slides · Sep 8, 2025
 Q2 2025 Earnings Presentation24 slides · Jul 18, 2025
 Q1 2025 Earnings Presentation21 slides · Apr 21, 2025
 Q4 2024 Earnings Presentation24 slides · Jan 22, 2025