Univar — Credit Suisse Small & Mid Cap Conference (September 2015)
19 slides from Univar's conference presentation, Sep 17, 2015
Slide 1: Credit Suisse Small & Mid Cap Conference
Exhibit 99.1 Credit Suisse Small & Mid Cap Conference Carl Lukach, EVP and Chief Financial Officer September 17, 2015
Slide 2: Forward-Looking Statements; Regulation G: Non GAAP Measures
Forward-Looking Statements This presentation includes “forward-looking information,” relating to Univar. Forward-looking statements are subject to known and unknown risks and uncertainties, many of which may be beyond our control. We caution you that the forward-looking information presented in this
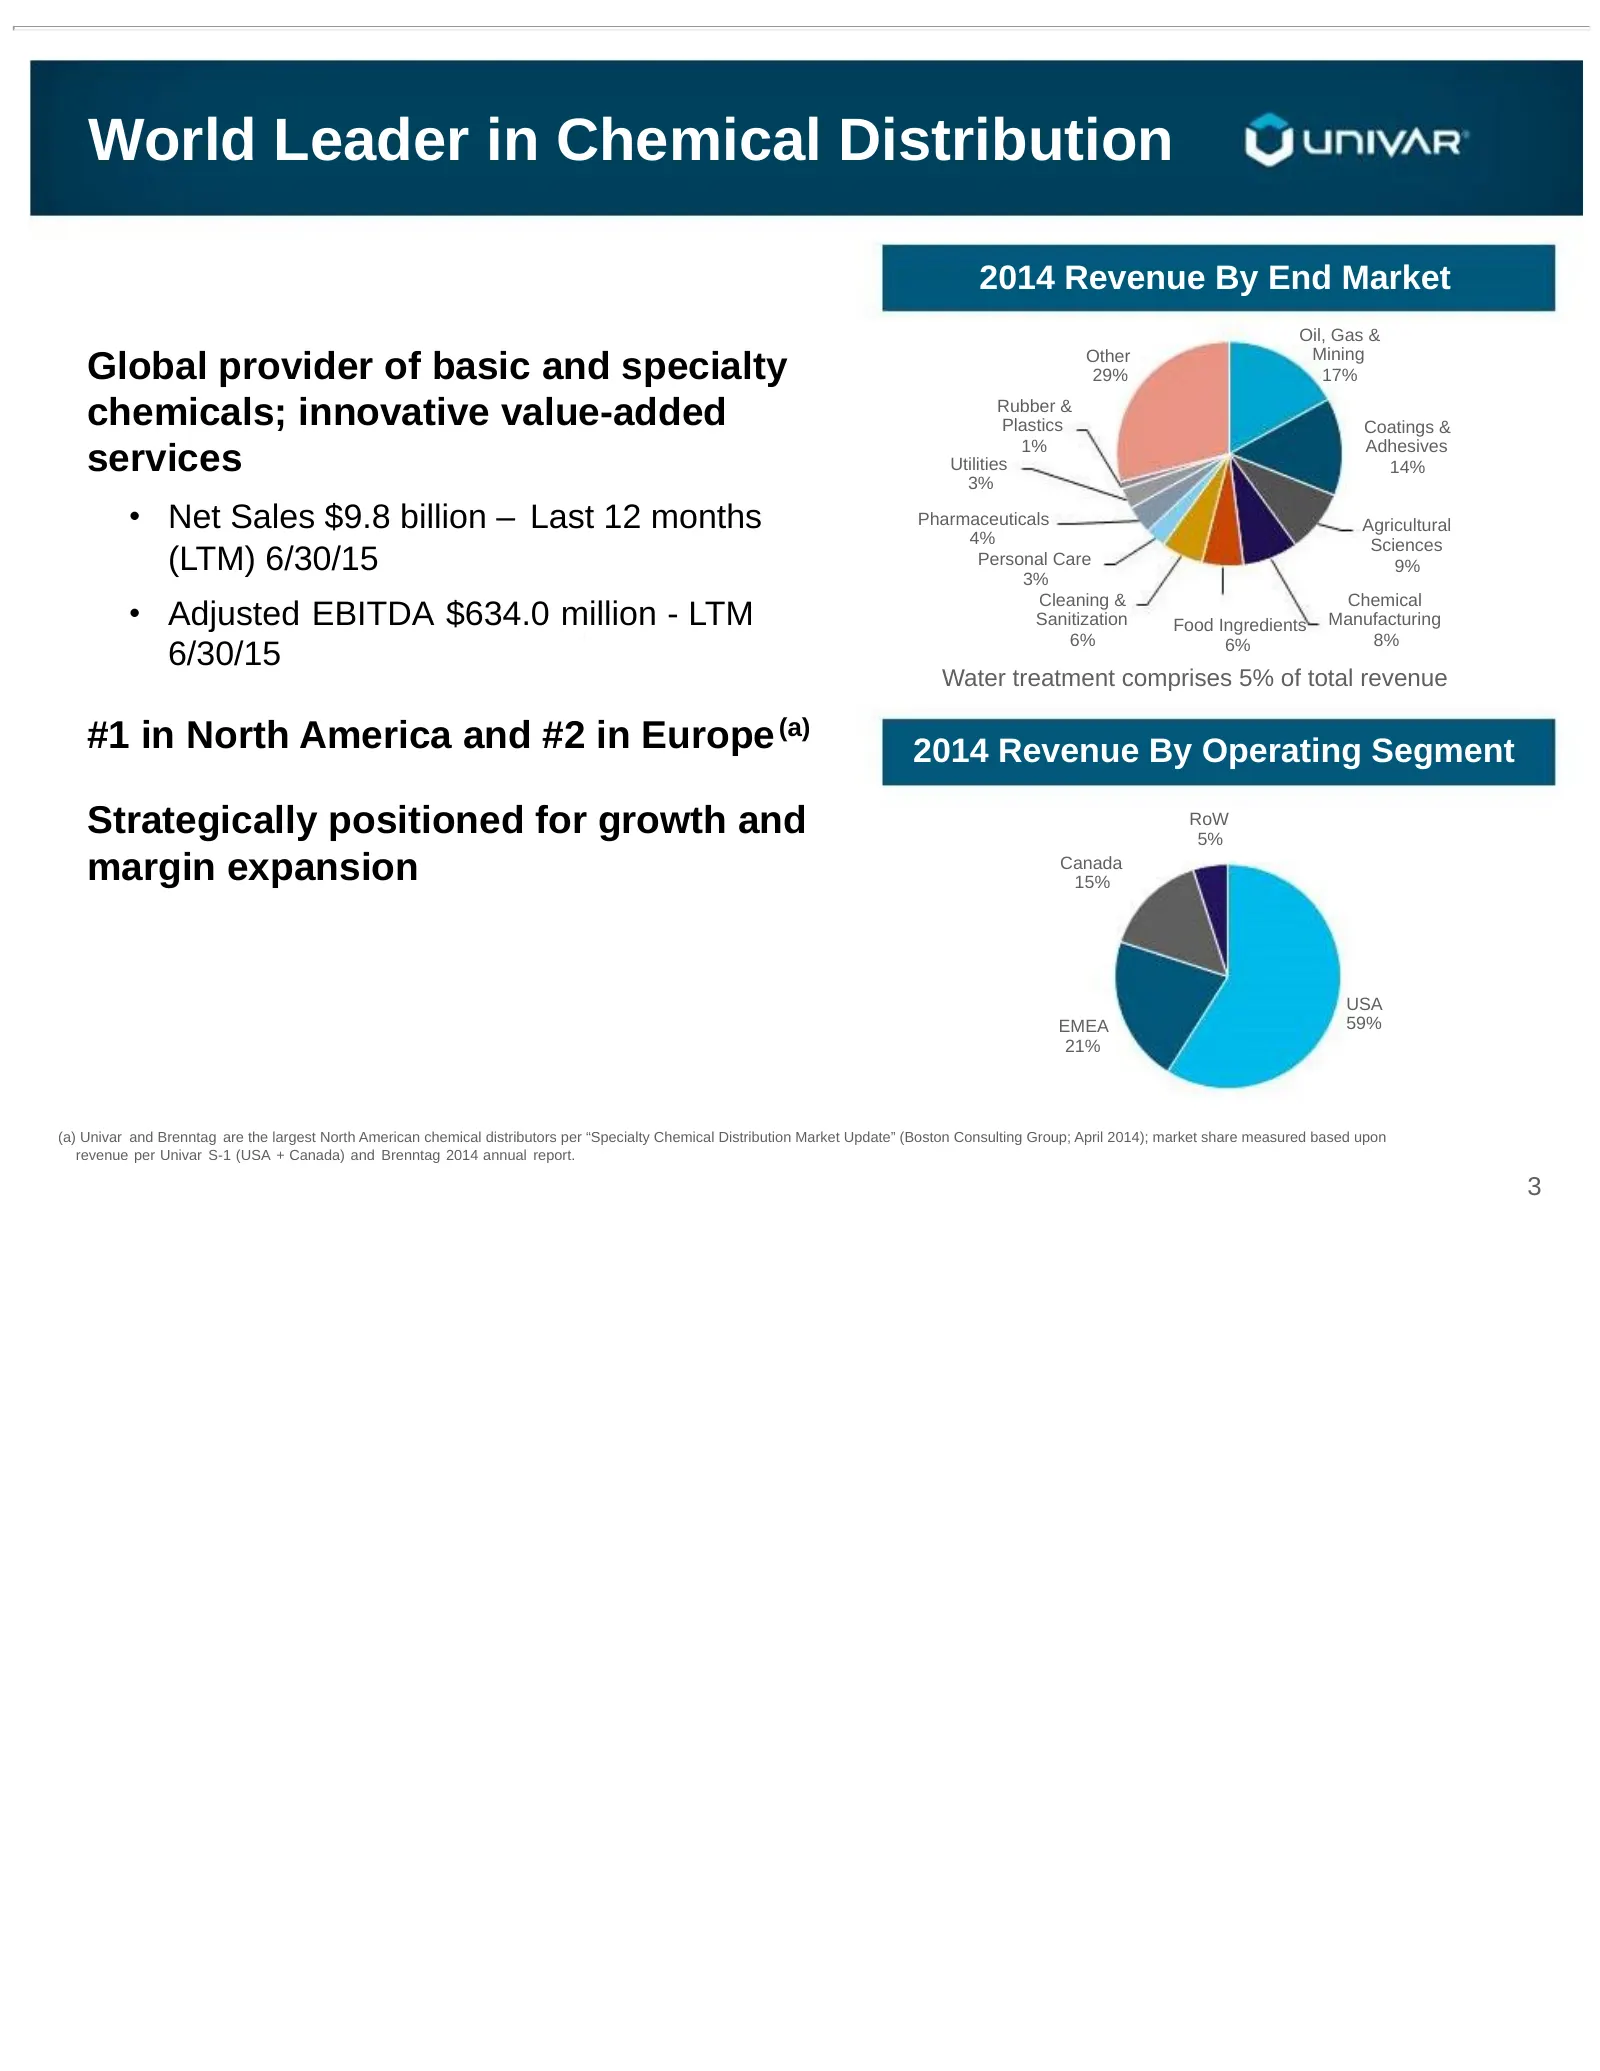
Slide 3: World Leader in Chemical Distribution
World Leader in Chemical Distribution 2014 Revenue By End Market Oil, Gas & Mining Global provider of basic and specialty Other 29% 17% chemicals; innovative value-added Rubber & Plastics Coatings & 1% Adhesives services Utilities 3% 14% • Net Sales $9.8 billion – Last 12 months Pharmaceuticals Agri
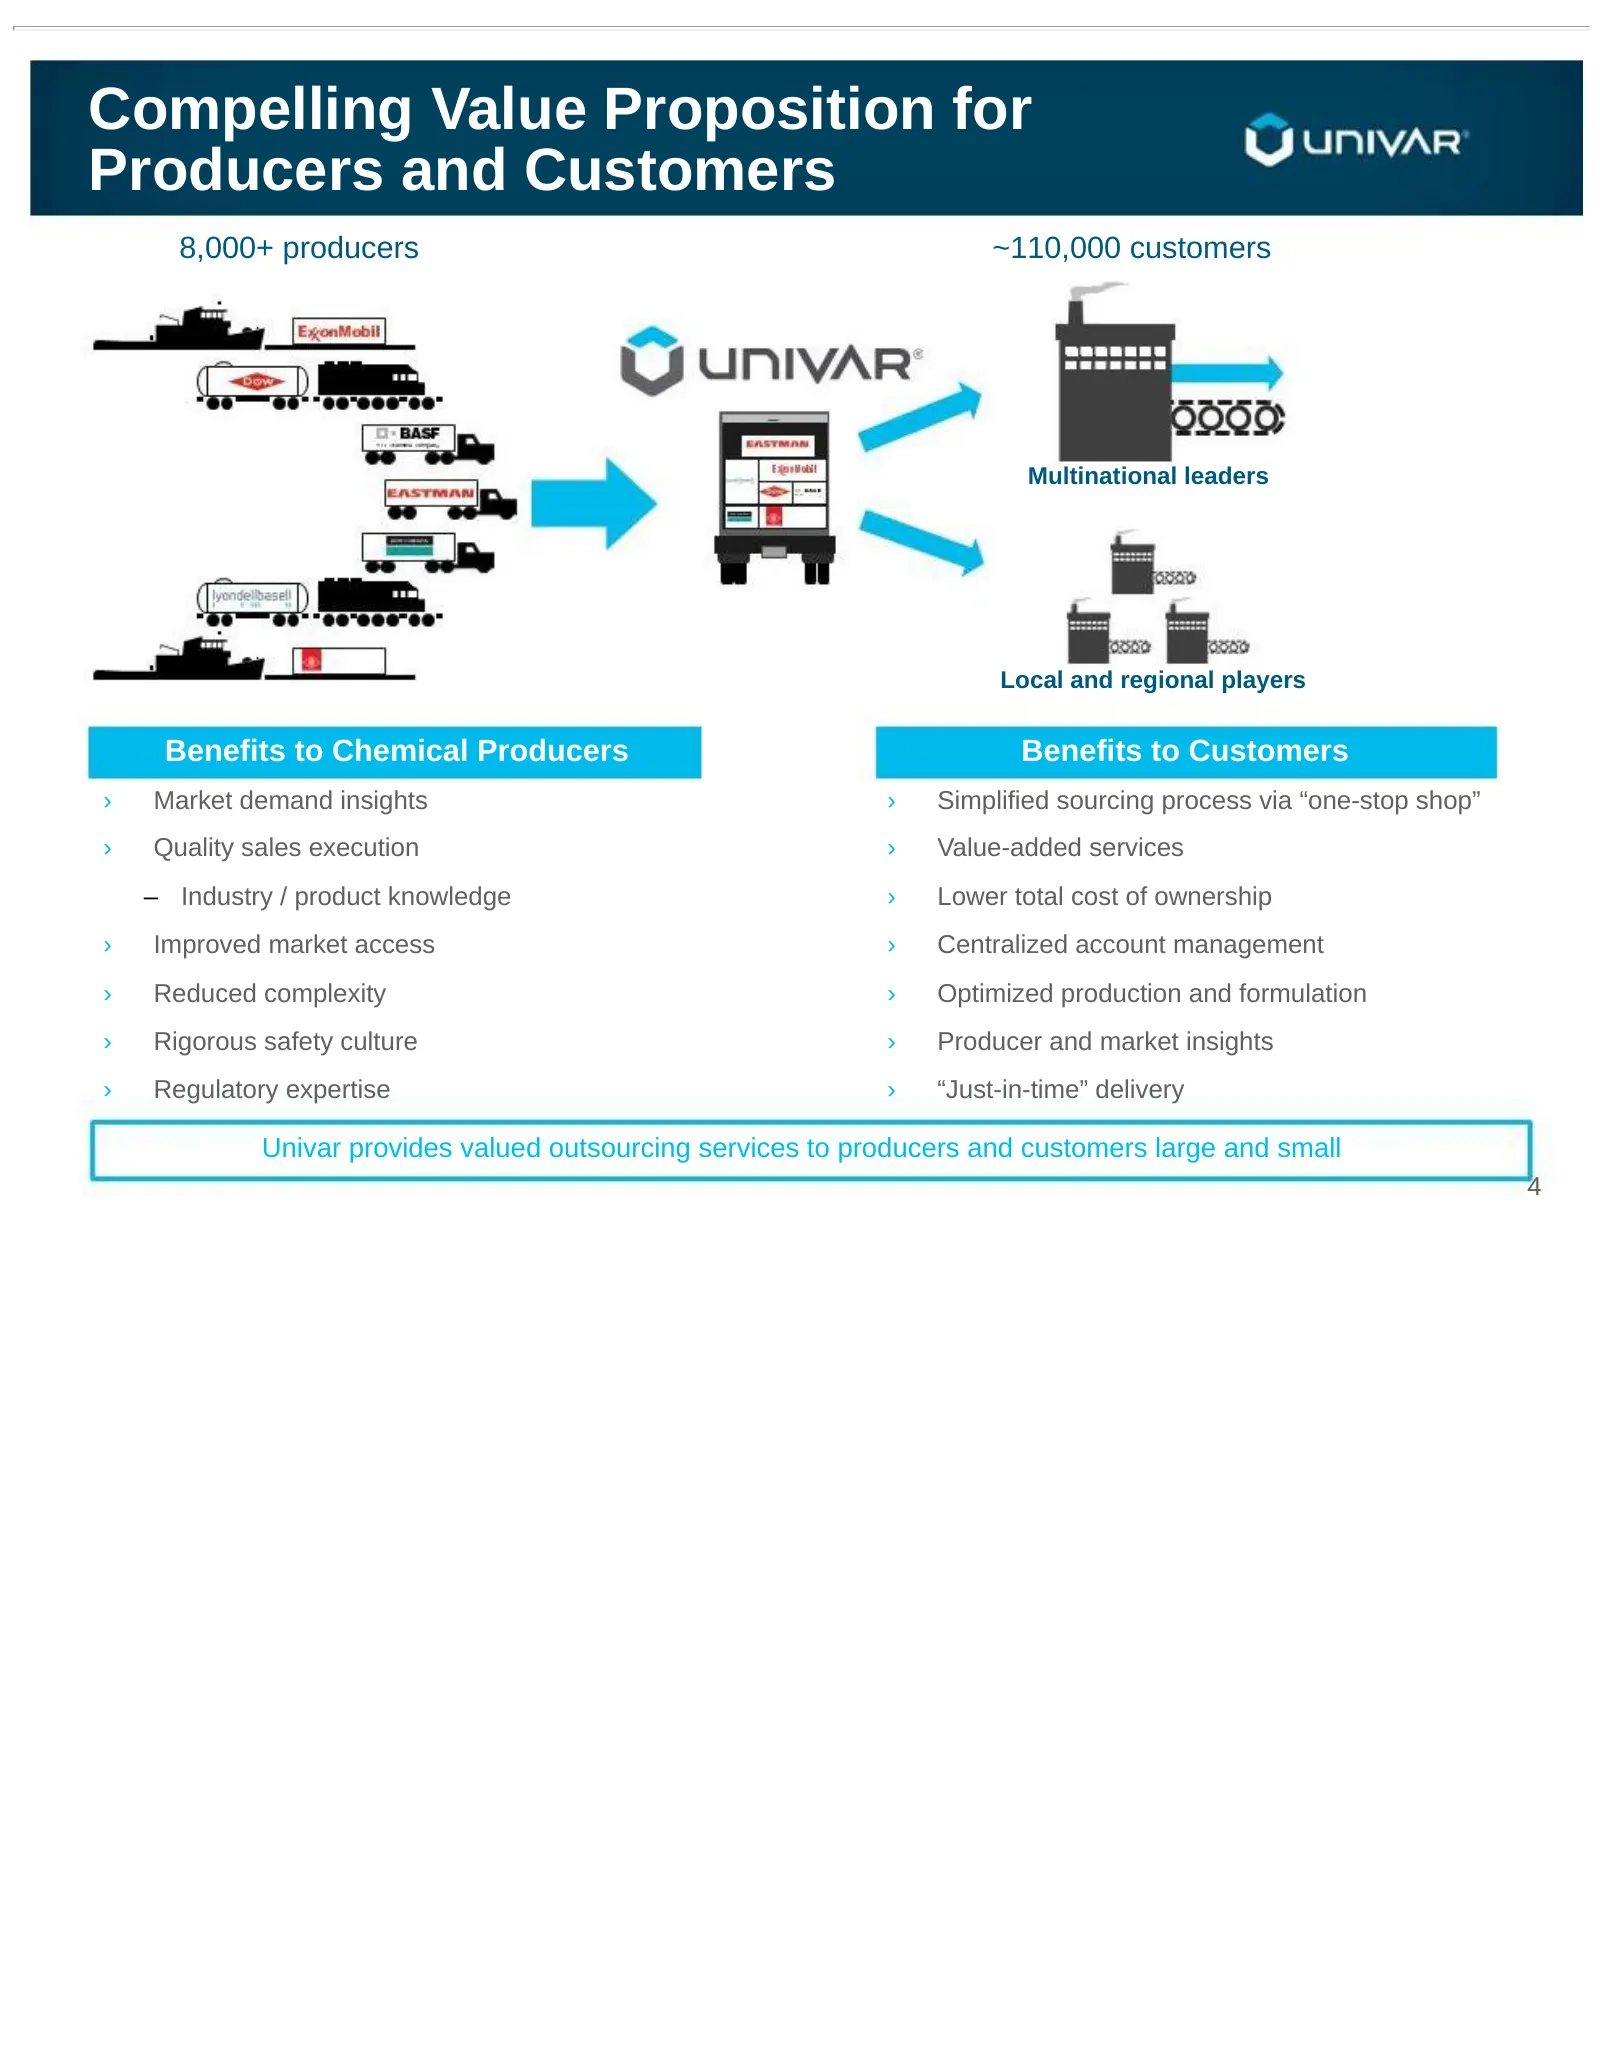
Slide 4: Compelling Value Proposition for Producers and Customers
Compelling Value Proposition for Producers and Customers 8,000+ producers ~110,000 customers Multinational leaders Local and regional players Benefits to Chemical Producers Benefits to Customers › Market demand insights › Simplified sourcing process via “one-stop shop” › Quality sales execution › Va
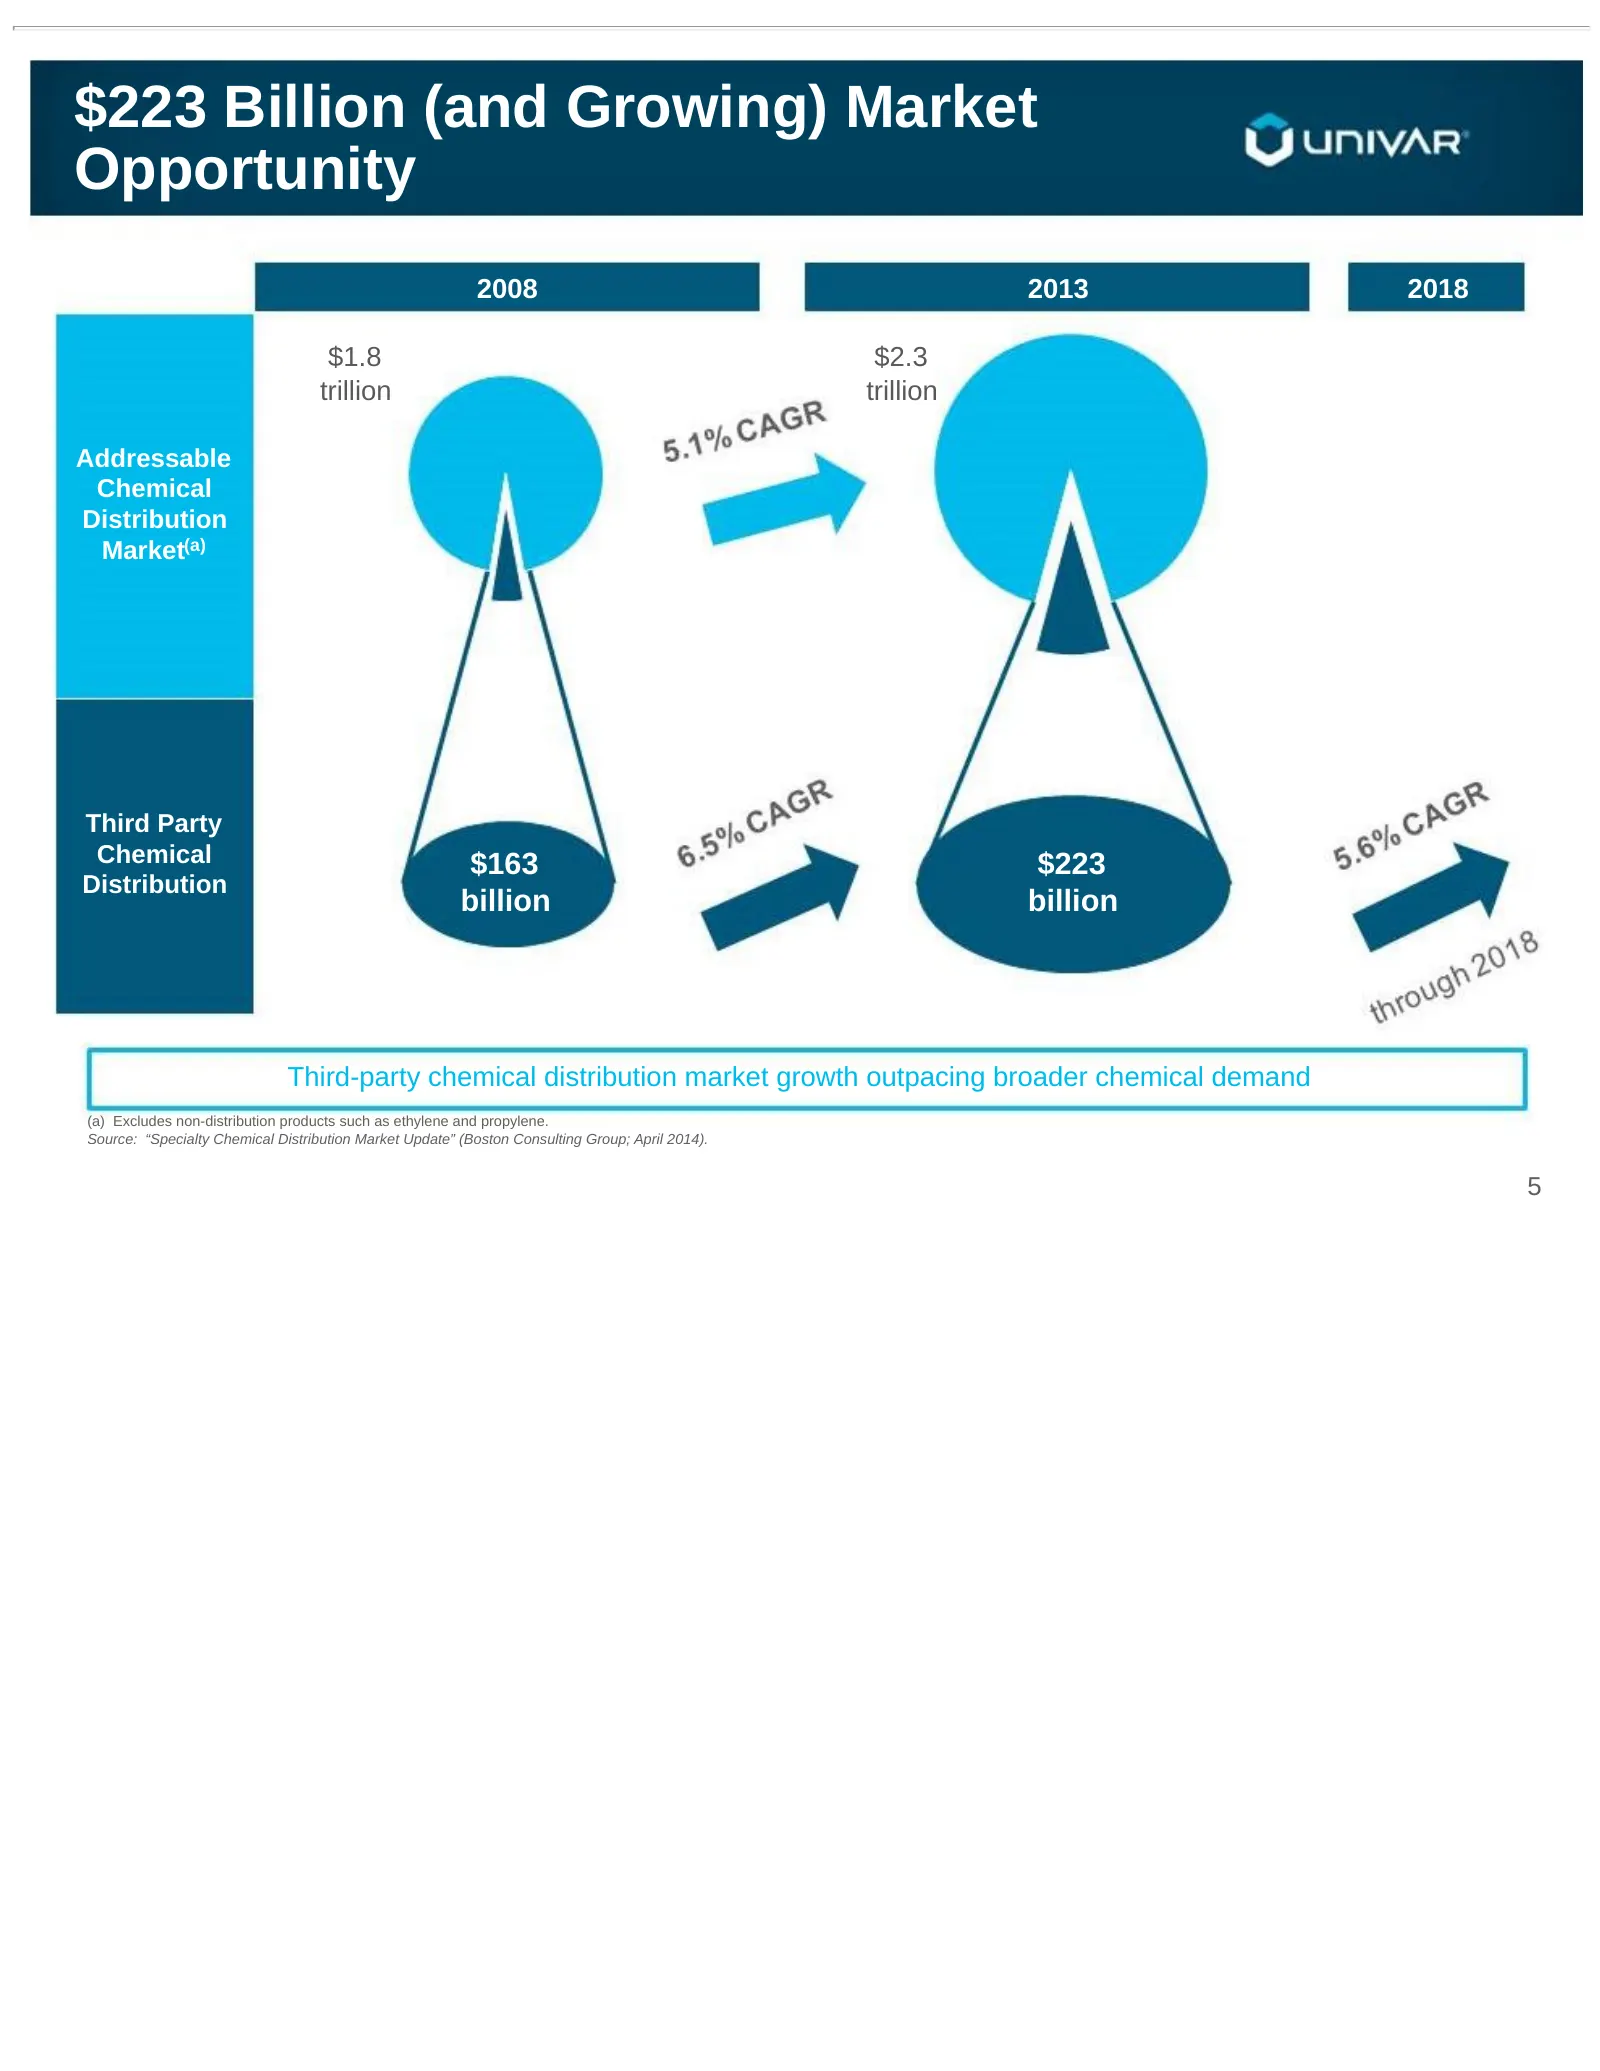
Slide 5: $223 Billion (and Growing) Market Opportunity
$223 Billion (and Growing) Market Opportunity 2008 2013 2018 $1.8 $2.3 trillion trillion Addressable Chemical Distribution Market(a) Third Party Chemical $163 $223 Distribution billion billion Third-party chemical distribution market growth outpacing broader chemical demand (a) Excludes non-distribu
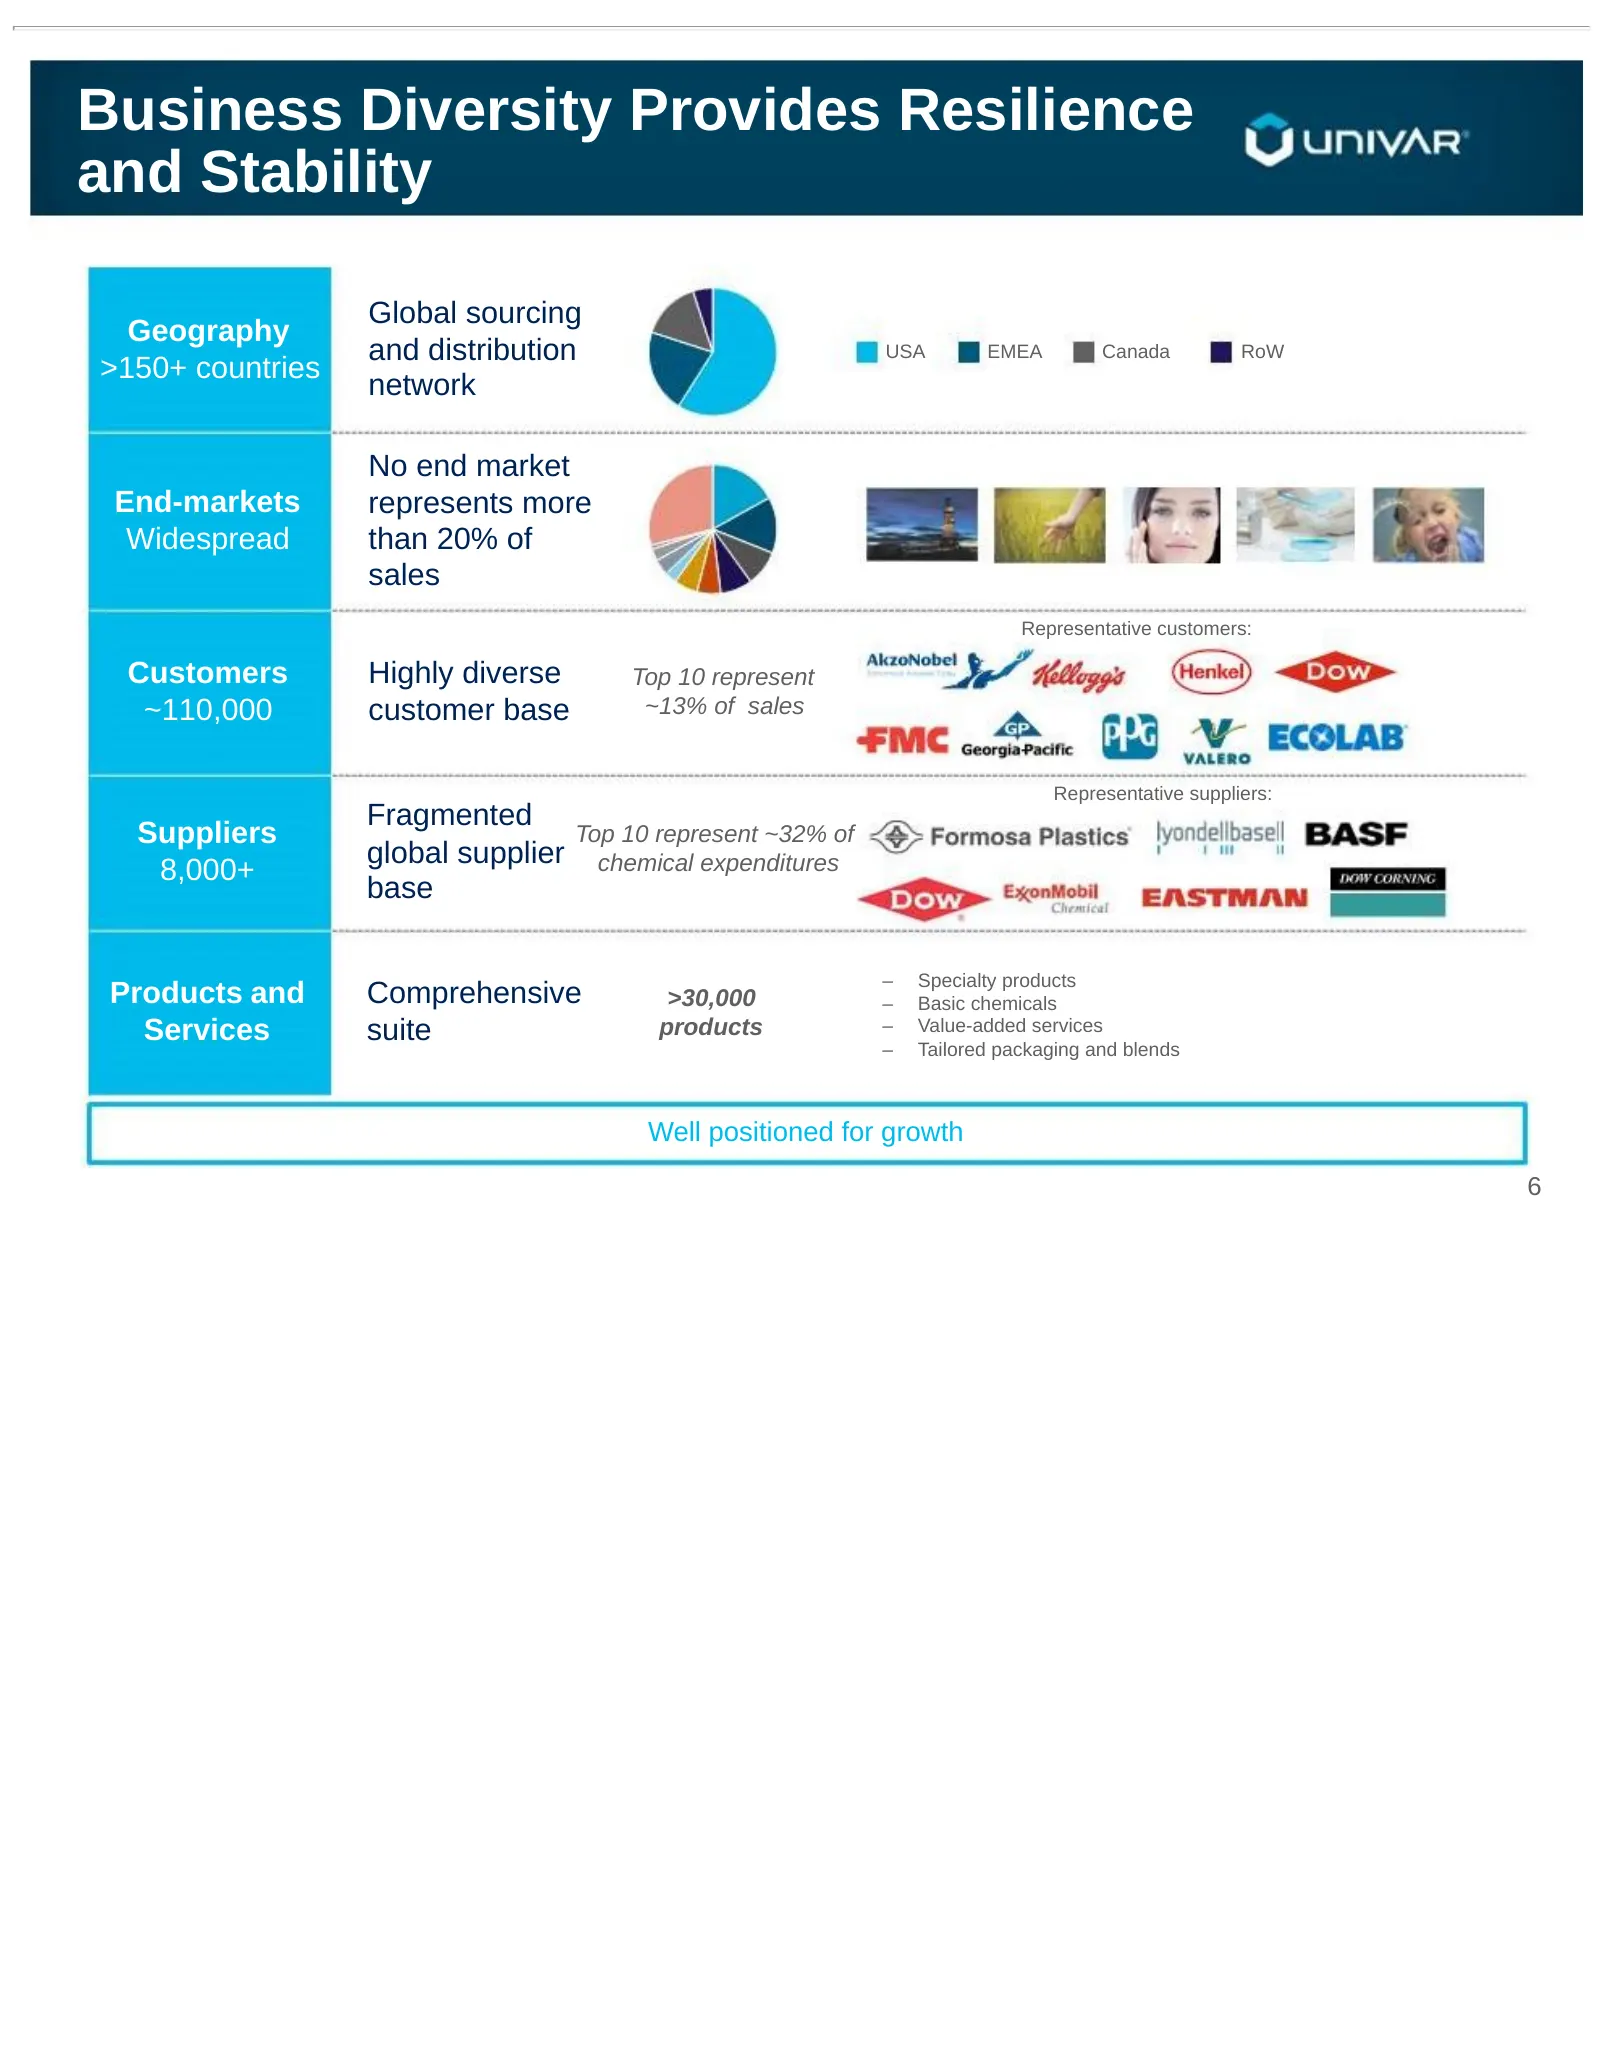
Slide 6: Business Diversity Provides Resilience and Stability
Business Diversity Provides Resilience and Stability Global sourcing Geography and distribution USA EMEA Canada RoW >150+ countries network No end market End-markets represents more Widespread than 20% of sales Representative customers: Customers Highly diverse Top 10 represent ~110,000 customer bas
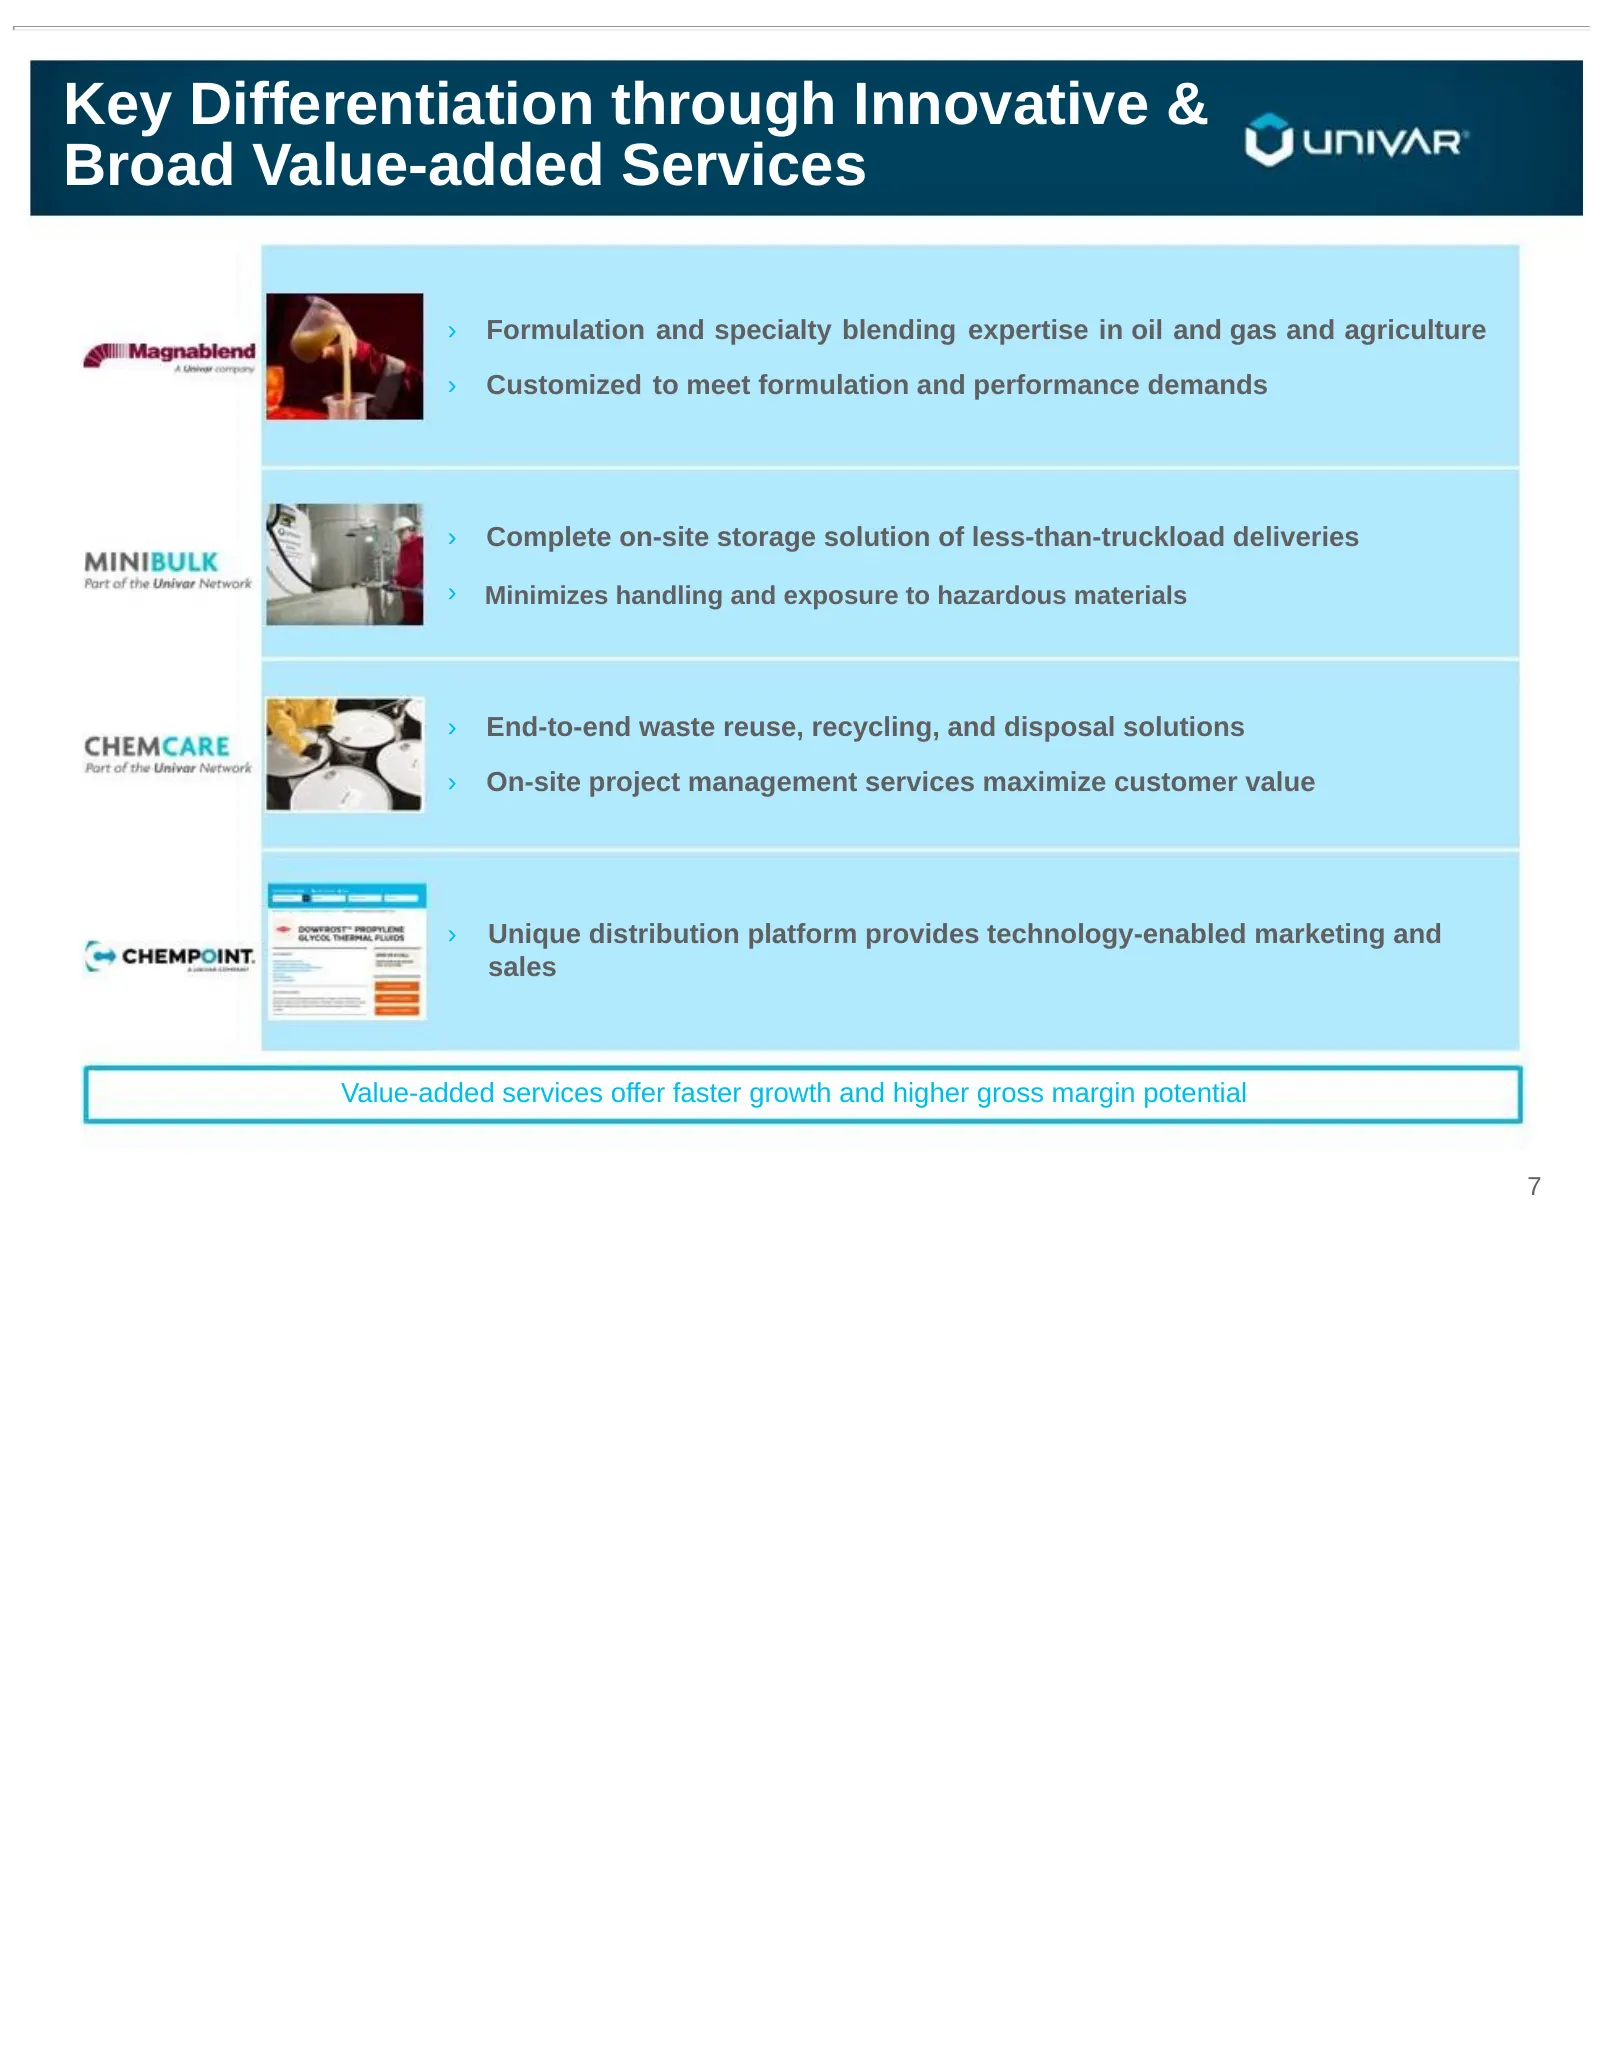
Slide 7: Key Differentiation through Innovative & Broad Value-added Services
Key Differentiation through Innovative & Broad Value-added Services › Formulation and specialty blending expertise in oil and gas and agriculture › Customized to meet formulation and performance demands › Complete on-site storage solution of less-than-truckload deliveries › Minimizes handling and ex
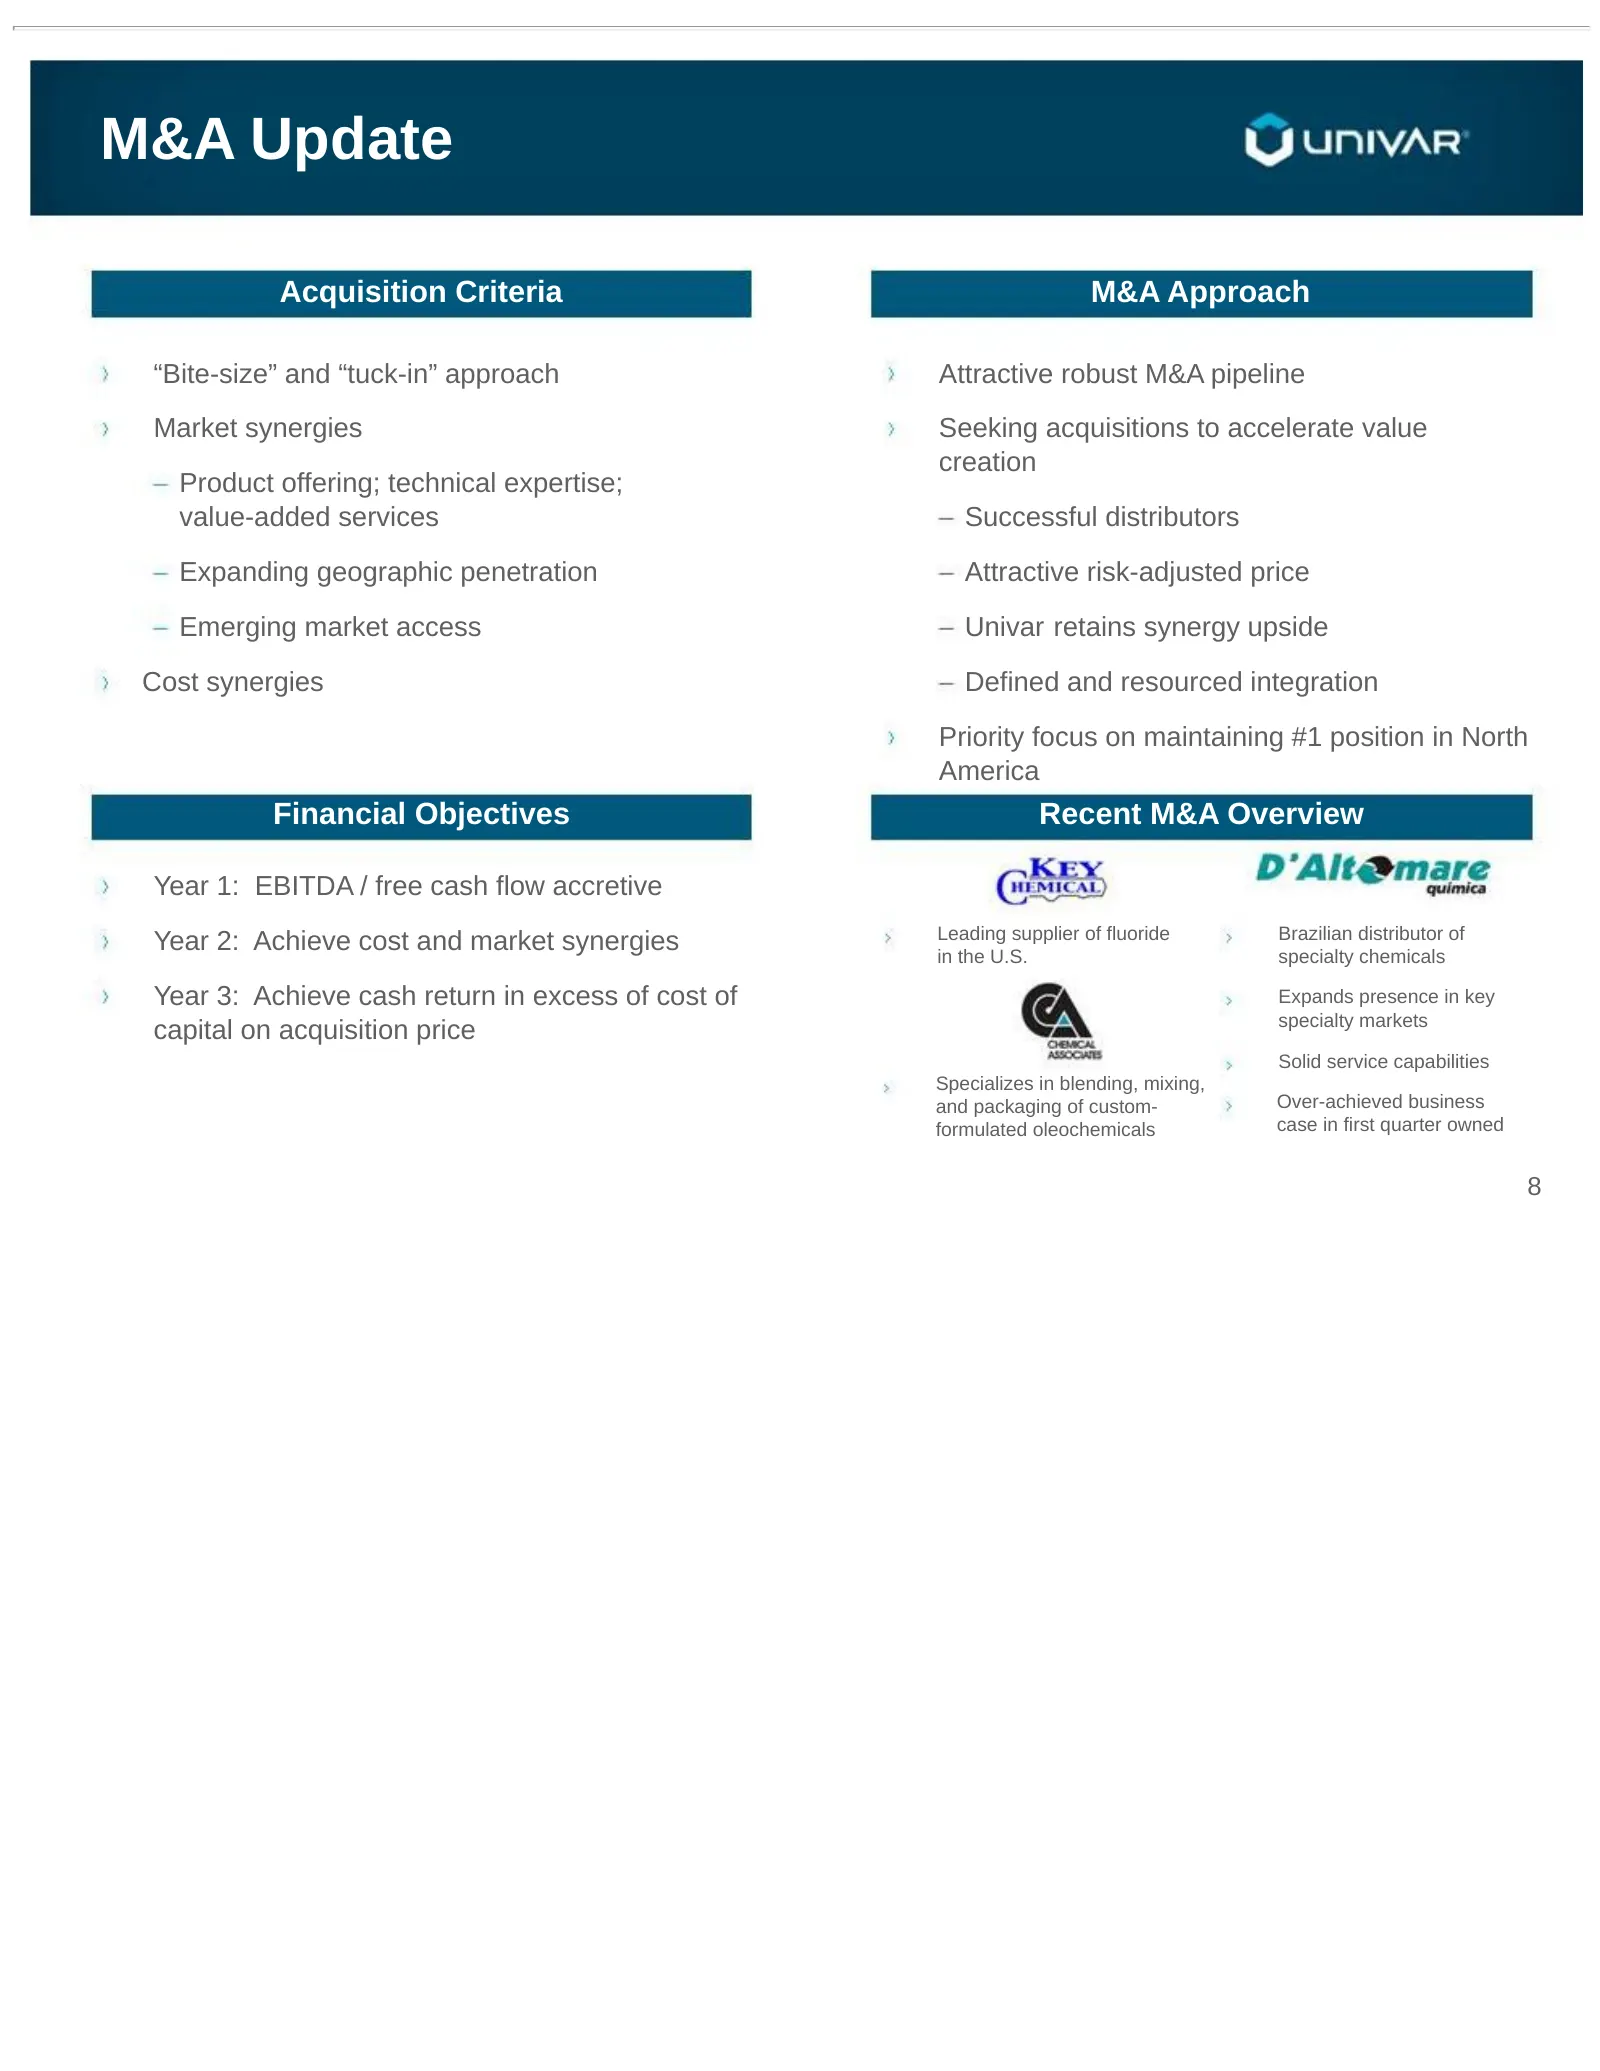
Slide 8: M&A Update
M&A Update Acquisition Criteria M&A Approach “Bite-size” and “tuck-in” approach Attractive robust M&A pipeline Market synergies Seeking acquisitions to accelerate value creation Product offering; technical expertise; value-added services Successful distributors Expanding geographic penetration Attra
Slide 9: Strong Cash Generation and Focus on Return on Capital
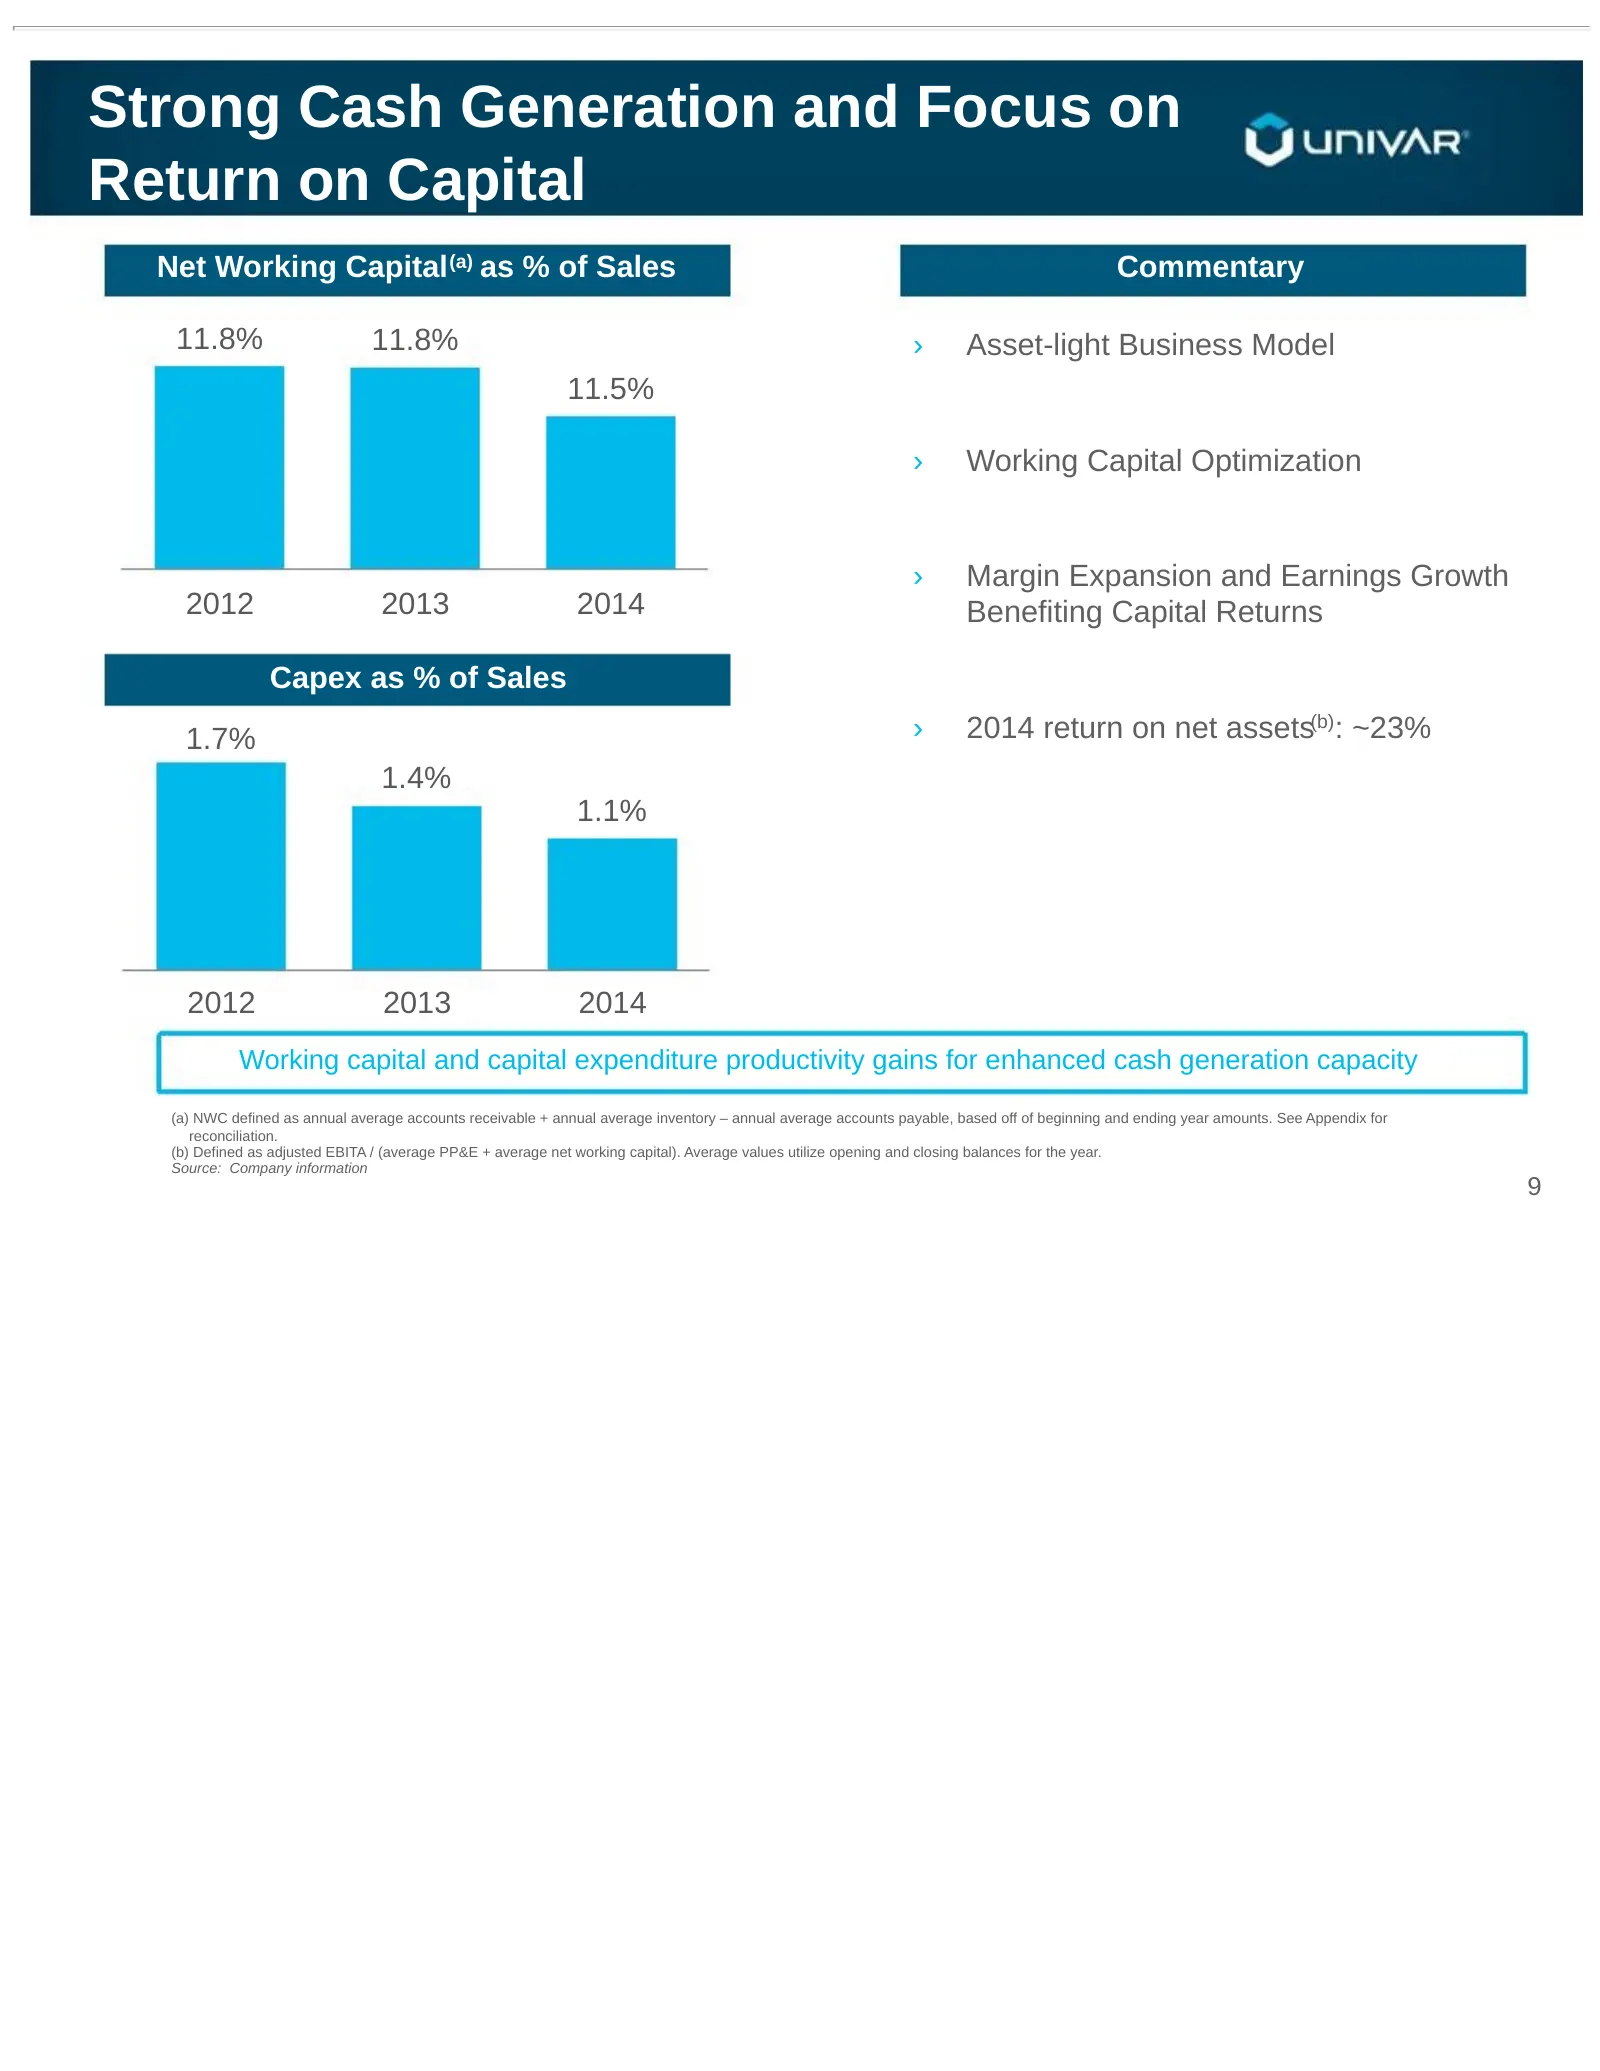
Strong Cash Generation and Focus on Return on Capital Net Working Capital (a) as % of Sales Commentary 11.8% 11.8% › Asset-light Business Model 11.5% › Working Capital Optimization › Margin Expansion and Earnings Growth 2012 2013 2014 Benefiting Capital Returns Capex as % of Sales 1.7% › 2014 return
Slide 10: Strategic Priorities
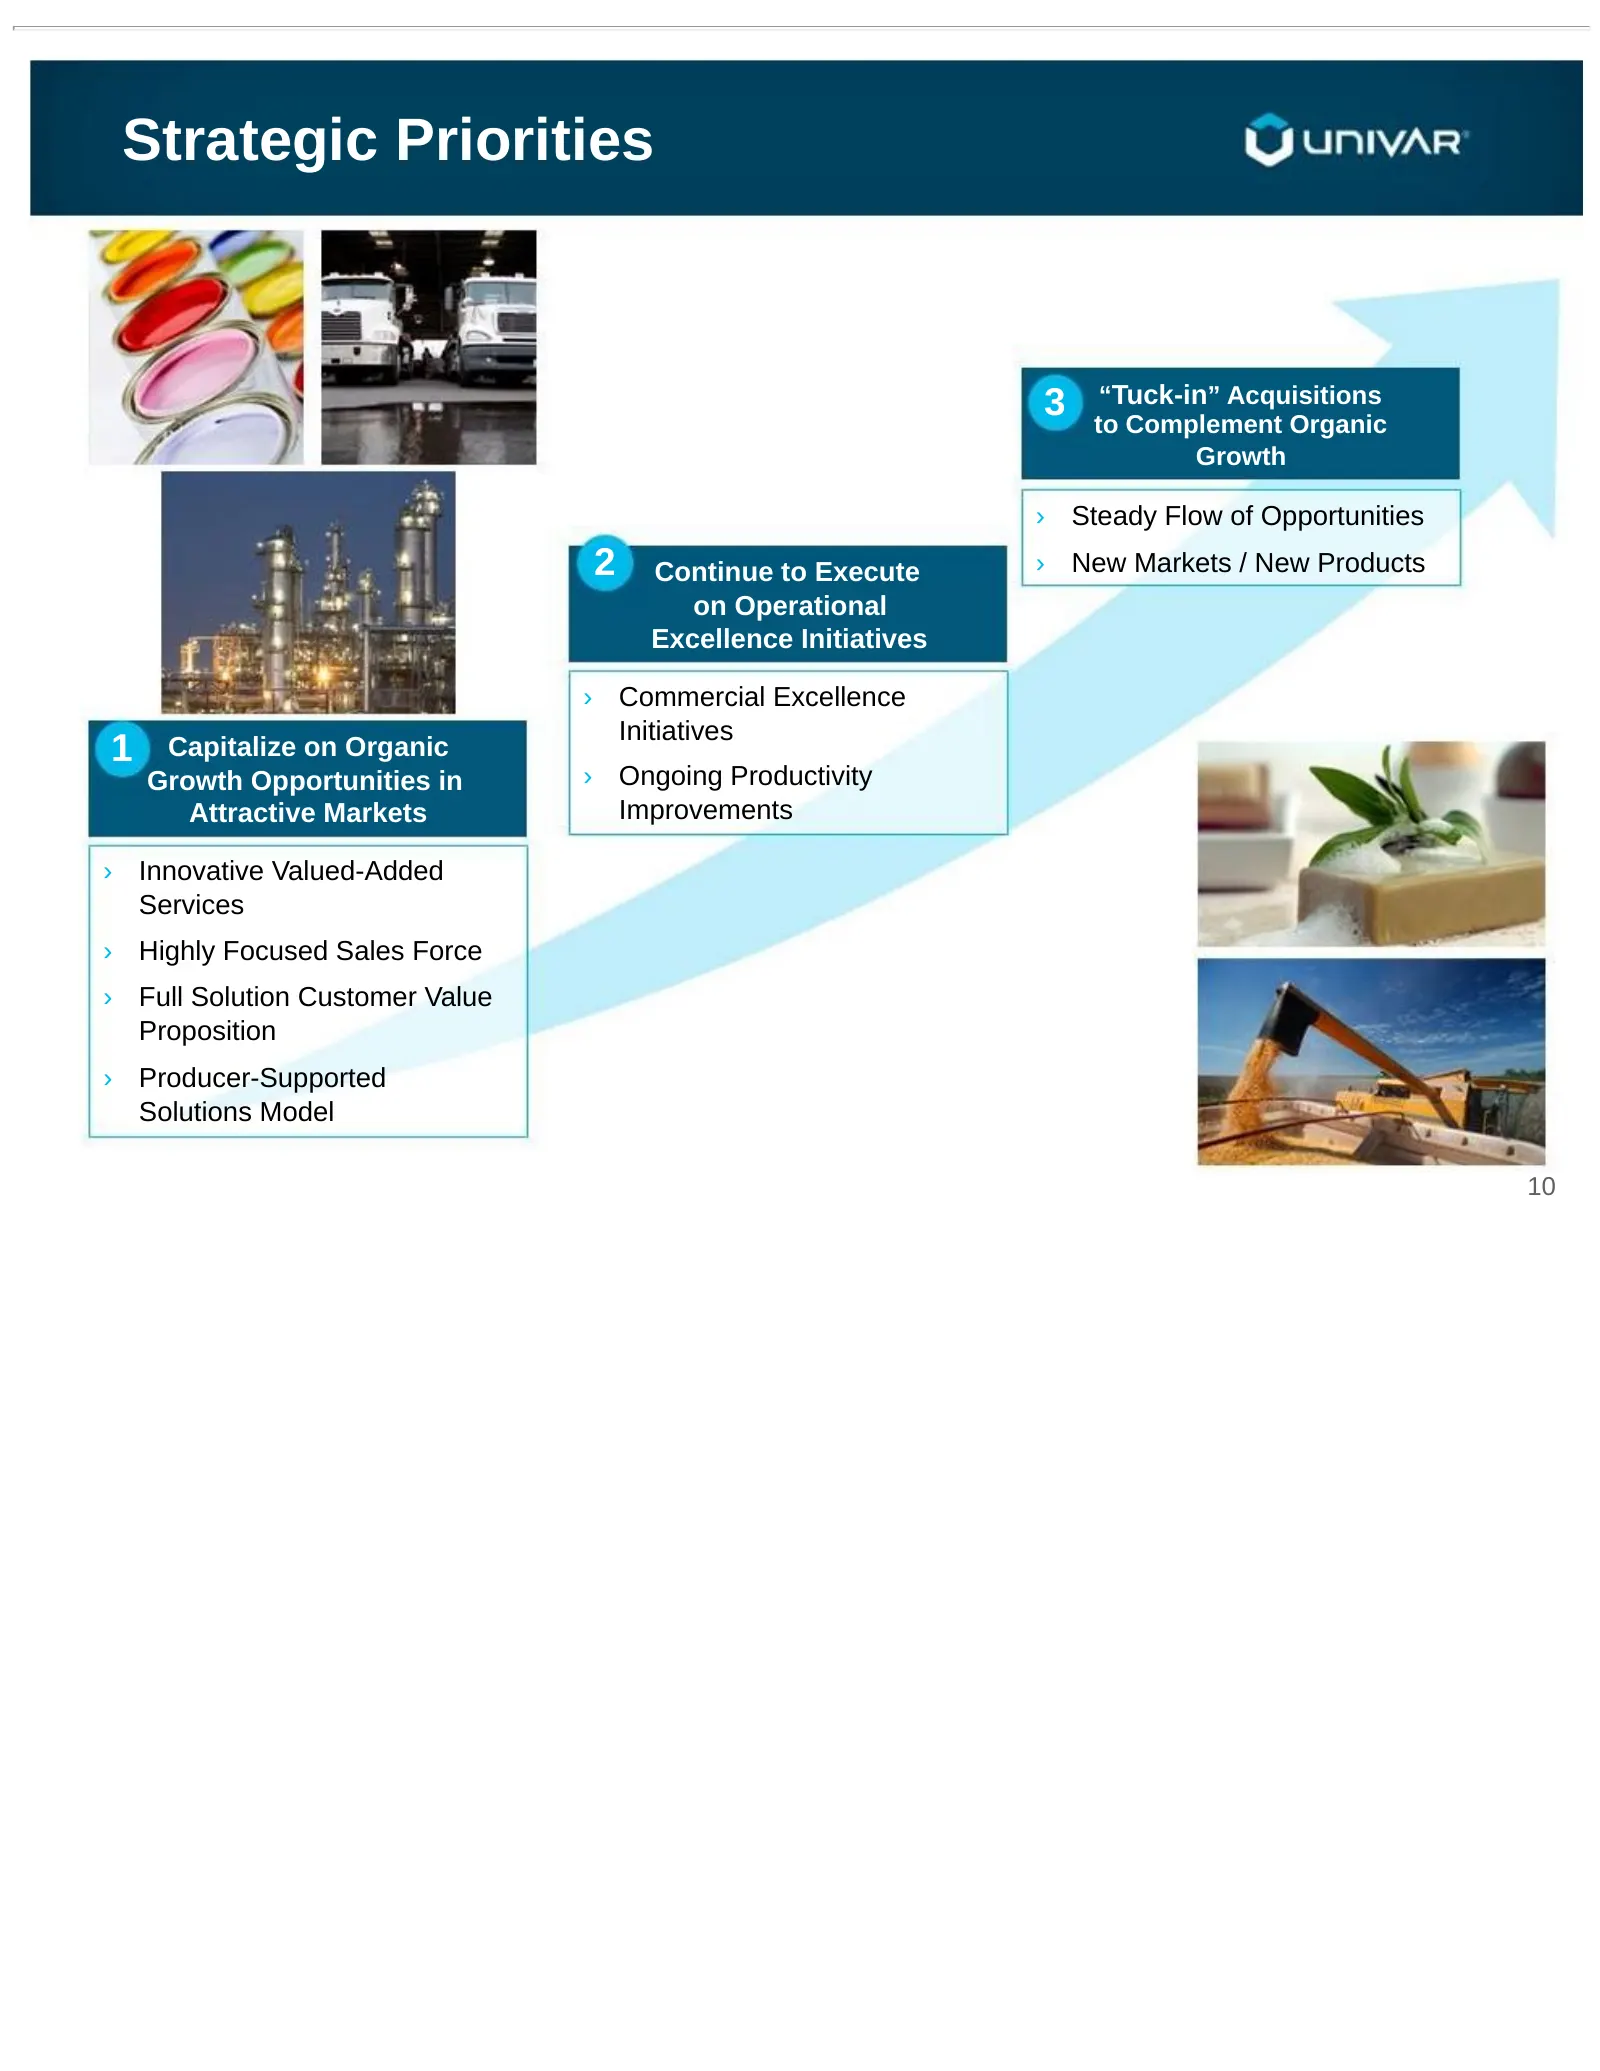
Strategic Priorities 3 “Tuck-in” Acquisitions to Complement Organic Growth › Steady Flow of Opportunities 2 Continue to Execute › New Markets / New Products on Operational Excellence Initiatives › Commercial Excellence Initiatives 1 Capitalize on Organic Growth Opportunities in › Ongoing Productivit
Slide 11: Proven Track Record
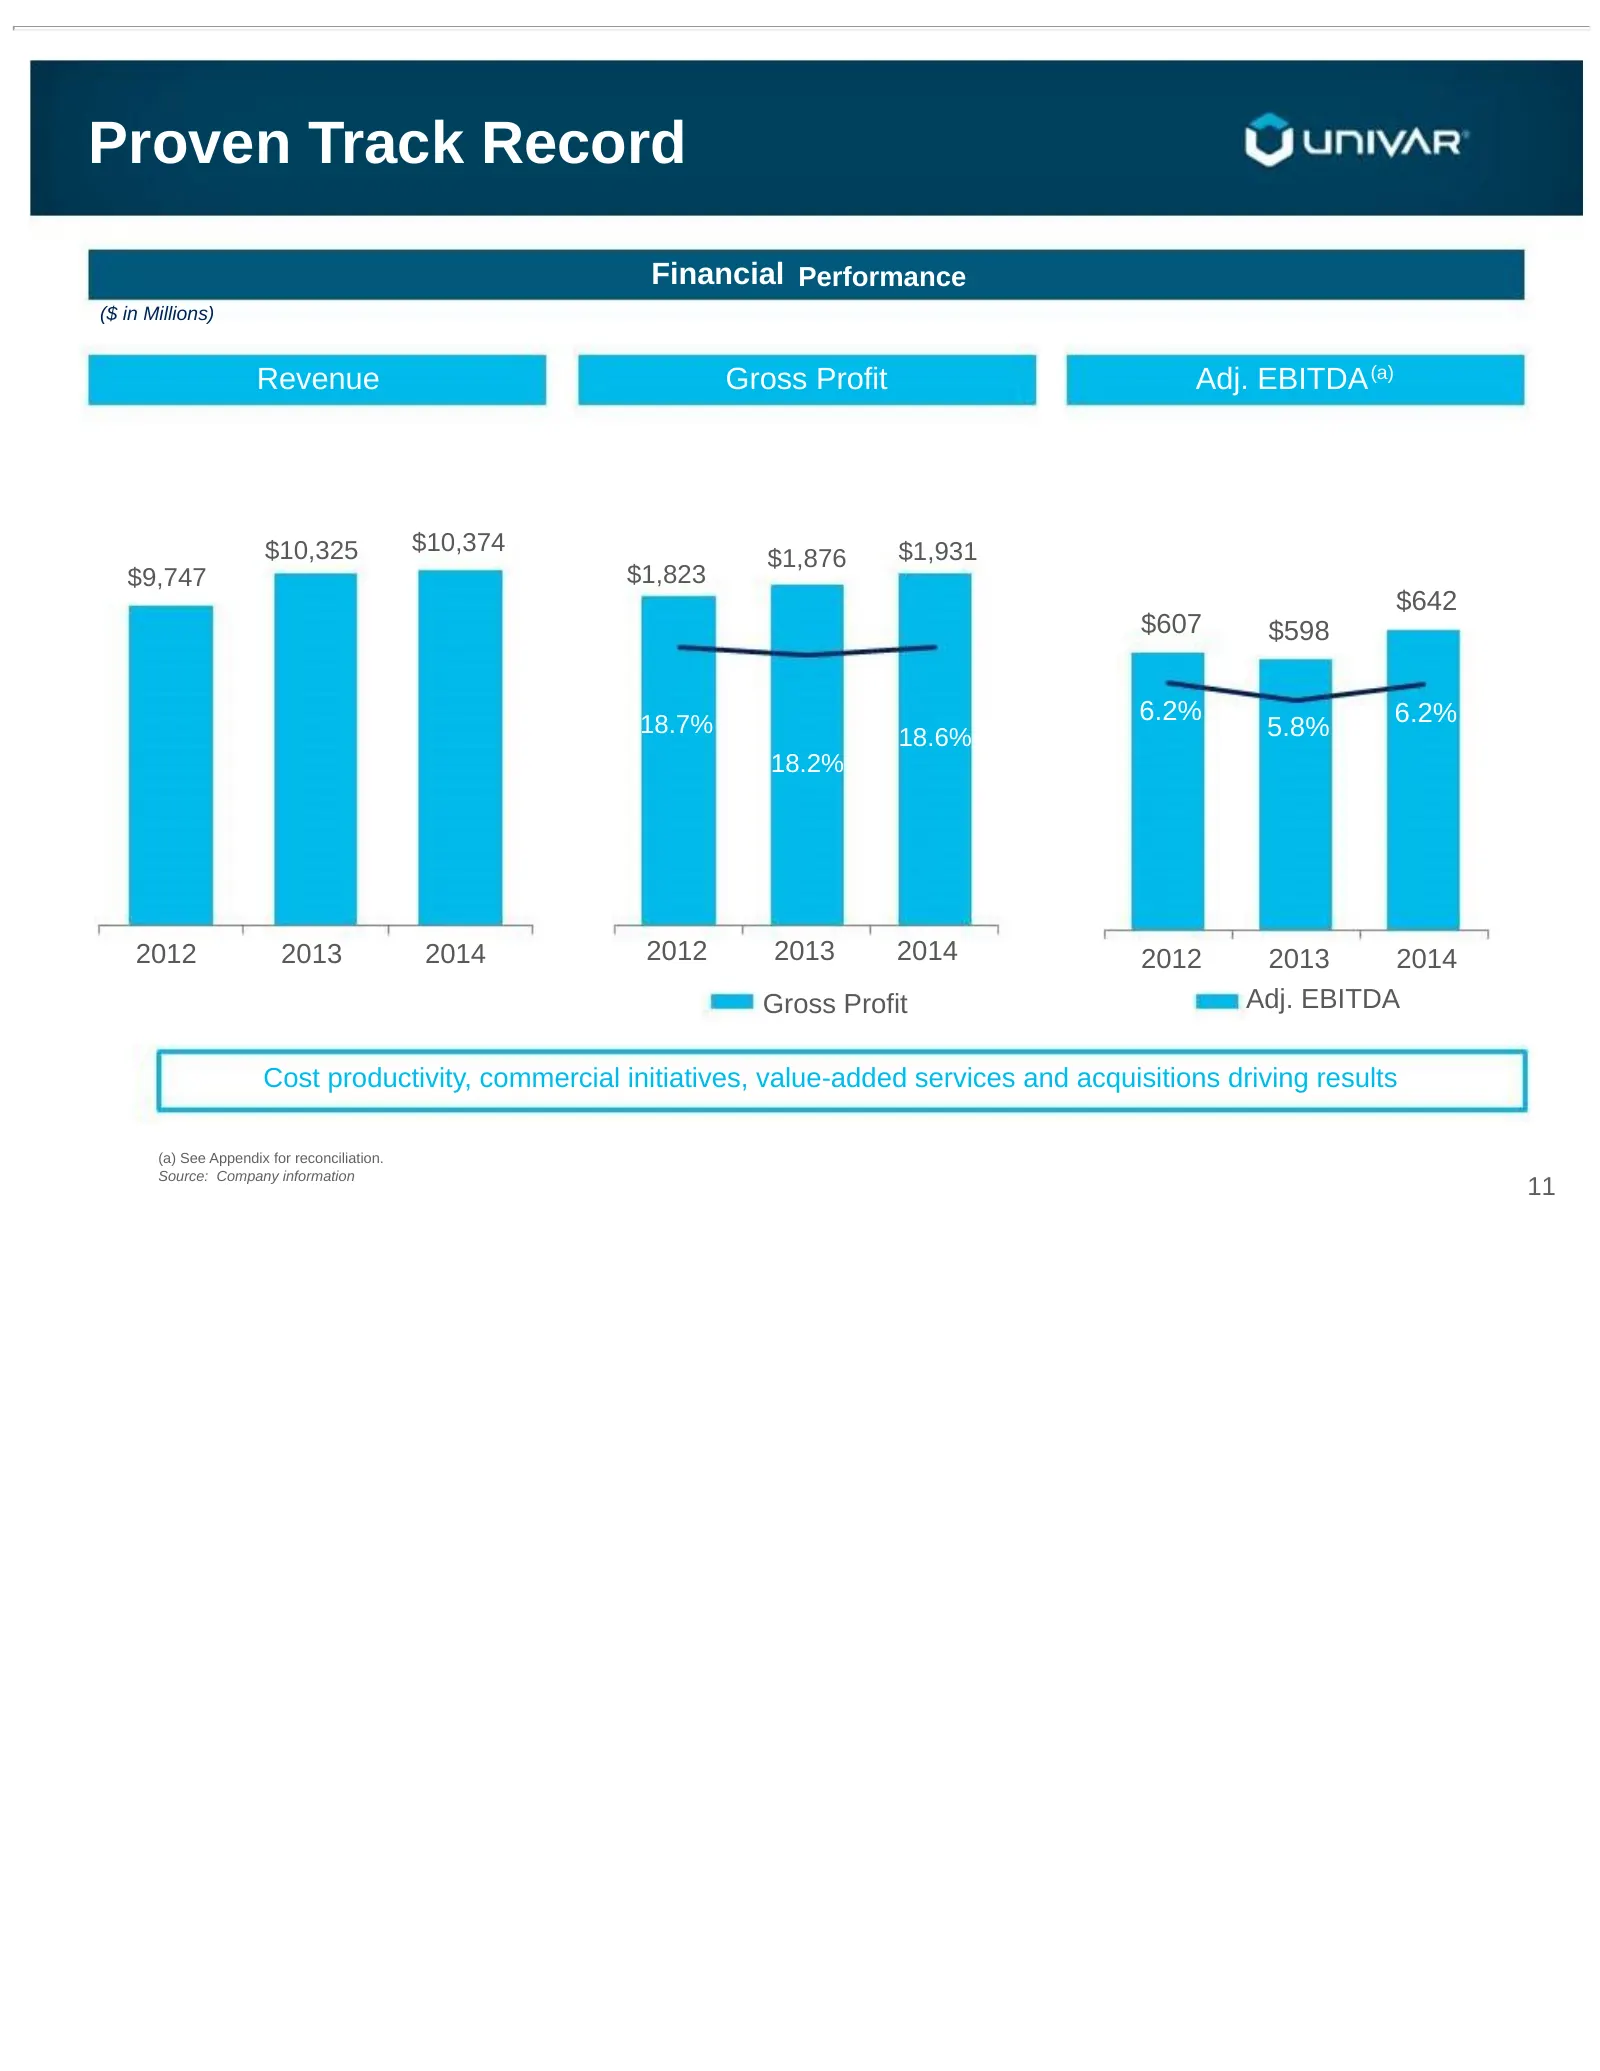
Proven Track Record Financial Performance ($ in Millions) Revenue Gross Profit Adj. EBITDA (a) $10,325 $10,374 $1,931 $1,876 $9,747 $1,823 $642 $607 $598 18.7% 6.2% 6.2% 18.6% 5.8% 18.2% 2012 2013 2014 2012 2013 2014 2012 2013 2014 Gross Profit Adj. EBITDA Cost productivity, commercial initiatives,
Slide 12: Consolidated Highlights – Q2 2015
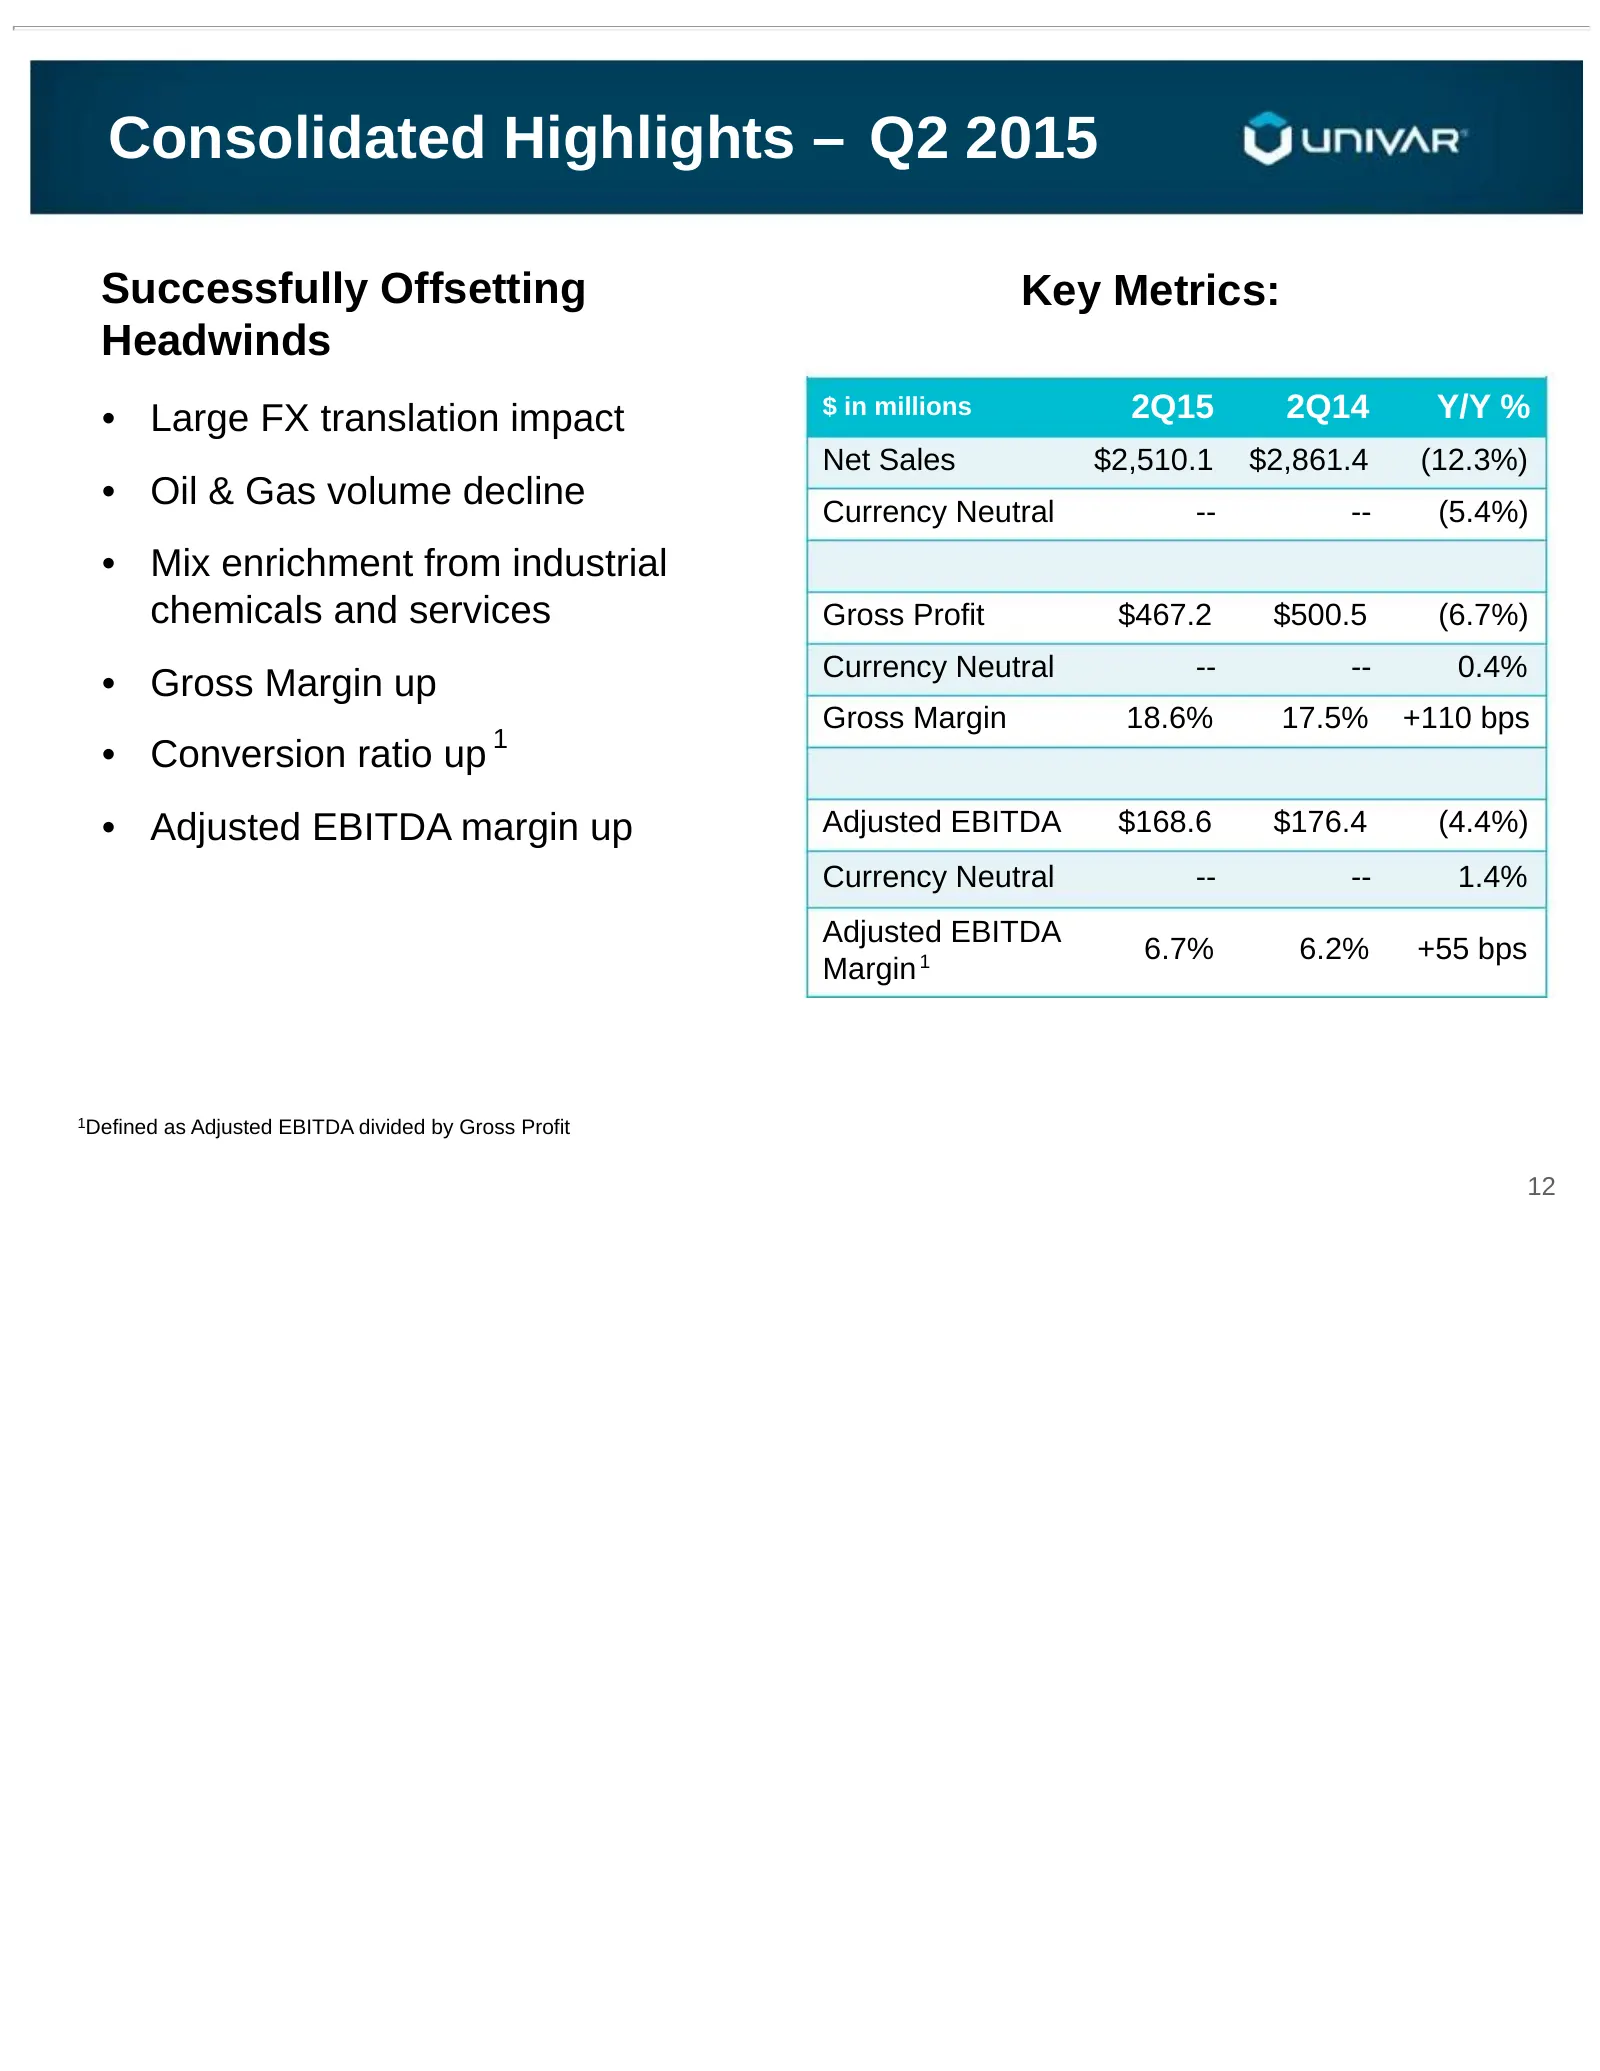
Consolidated Highlights – Q2 2015 Successfully Offsetting Key Metrics: Headwinds • Large FX translation impact $ in millions 2Q15 2Q14 Y/Y % Net Sales $2,510.1 $2,861.4 (12.3%) • Oil & Gas volume decline Currency Neutral -- -- (5.4%) • Mix enrichment from industrial chemicals and services Gross Prof
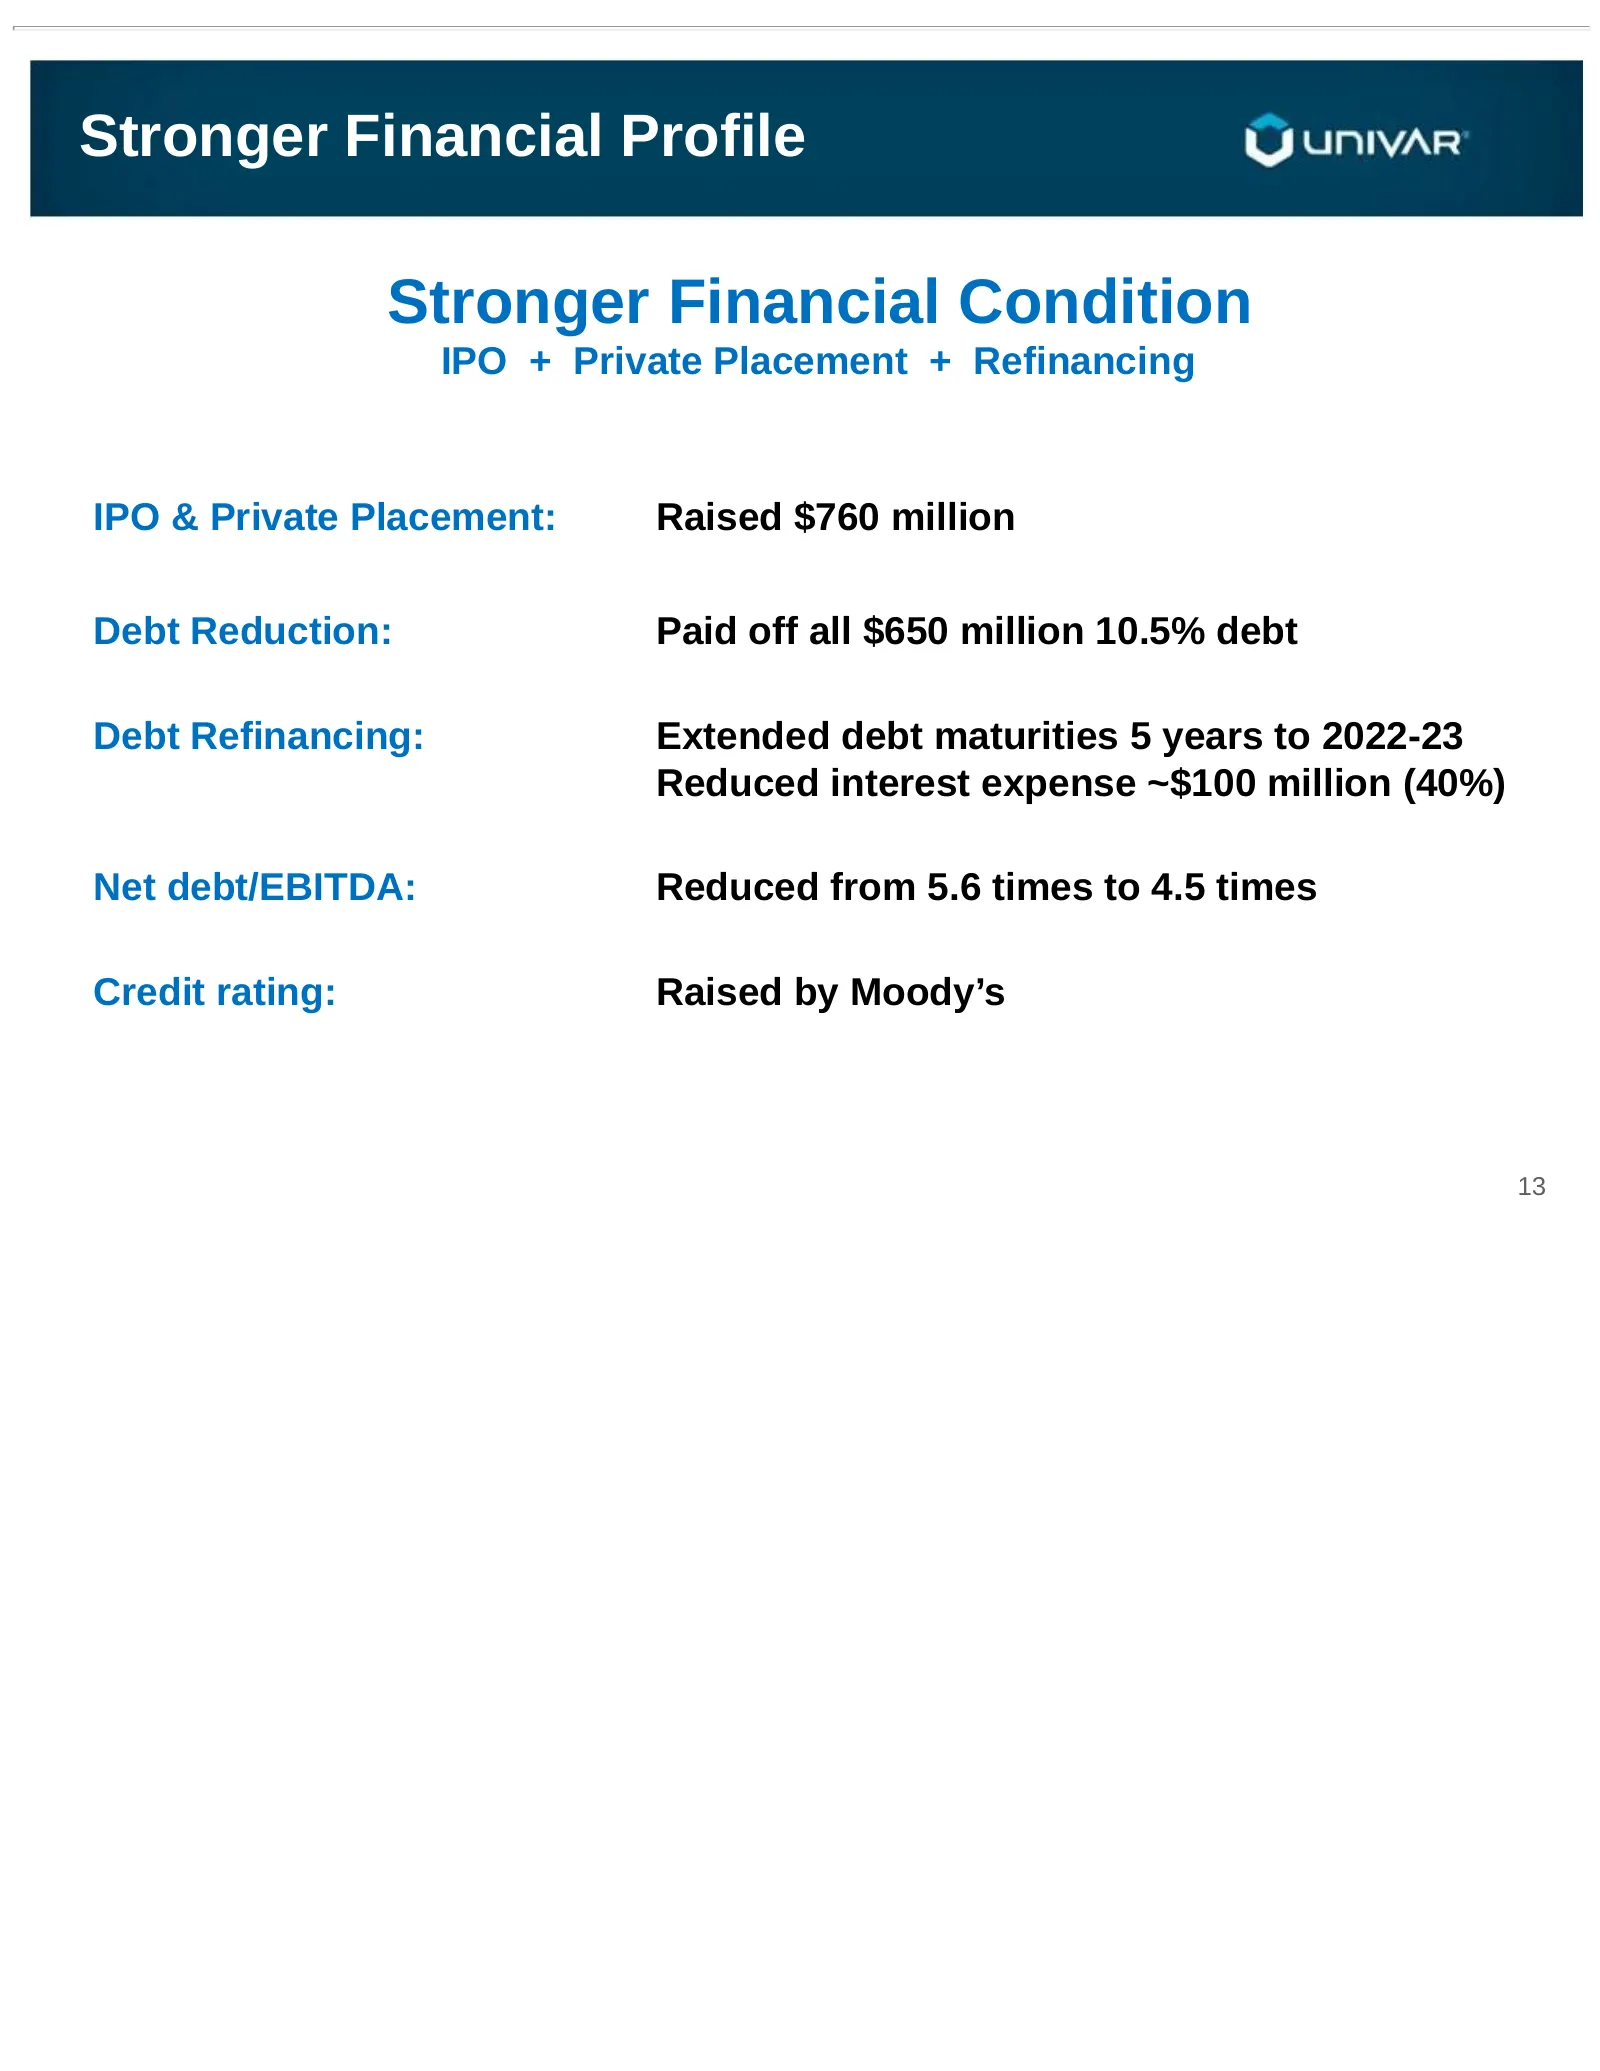
Slide 13: Stronger Financial Profile, Stronger Financial Condition
Stronger Financial Profile Stronger Financial Condition IPO + Private Placement + Refinancing IPO & Private Placement: Raised $760 million Debt Reduction: Paid off all $650 million 10.5% debt Debt Refinancing: Extended debt maturities 5 years to 2022-23 Reduced interest expense ~$100 million (40%) N
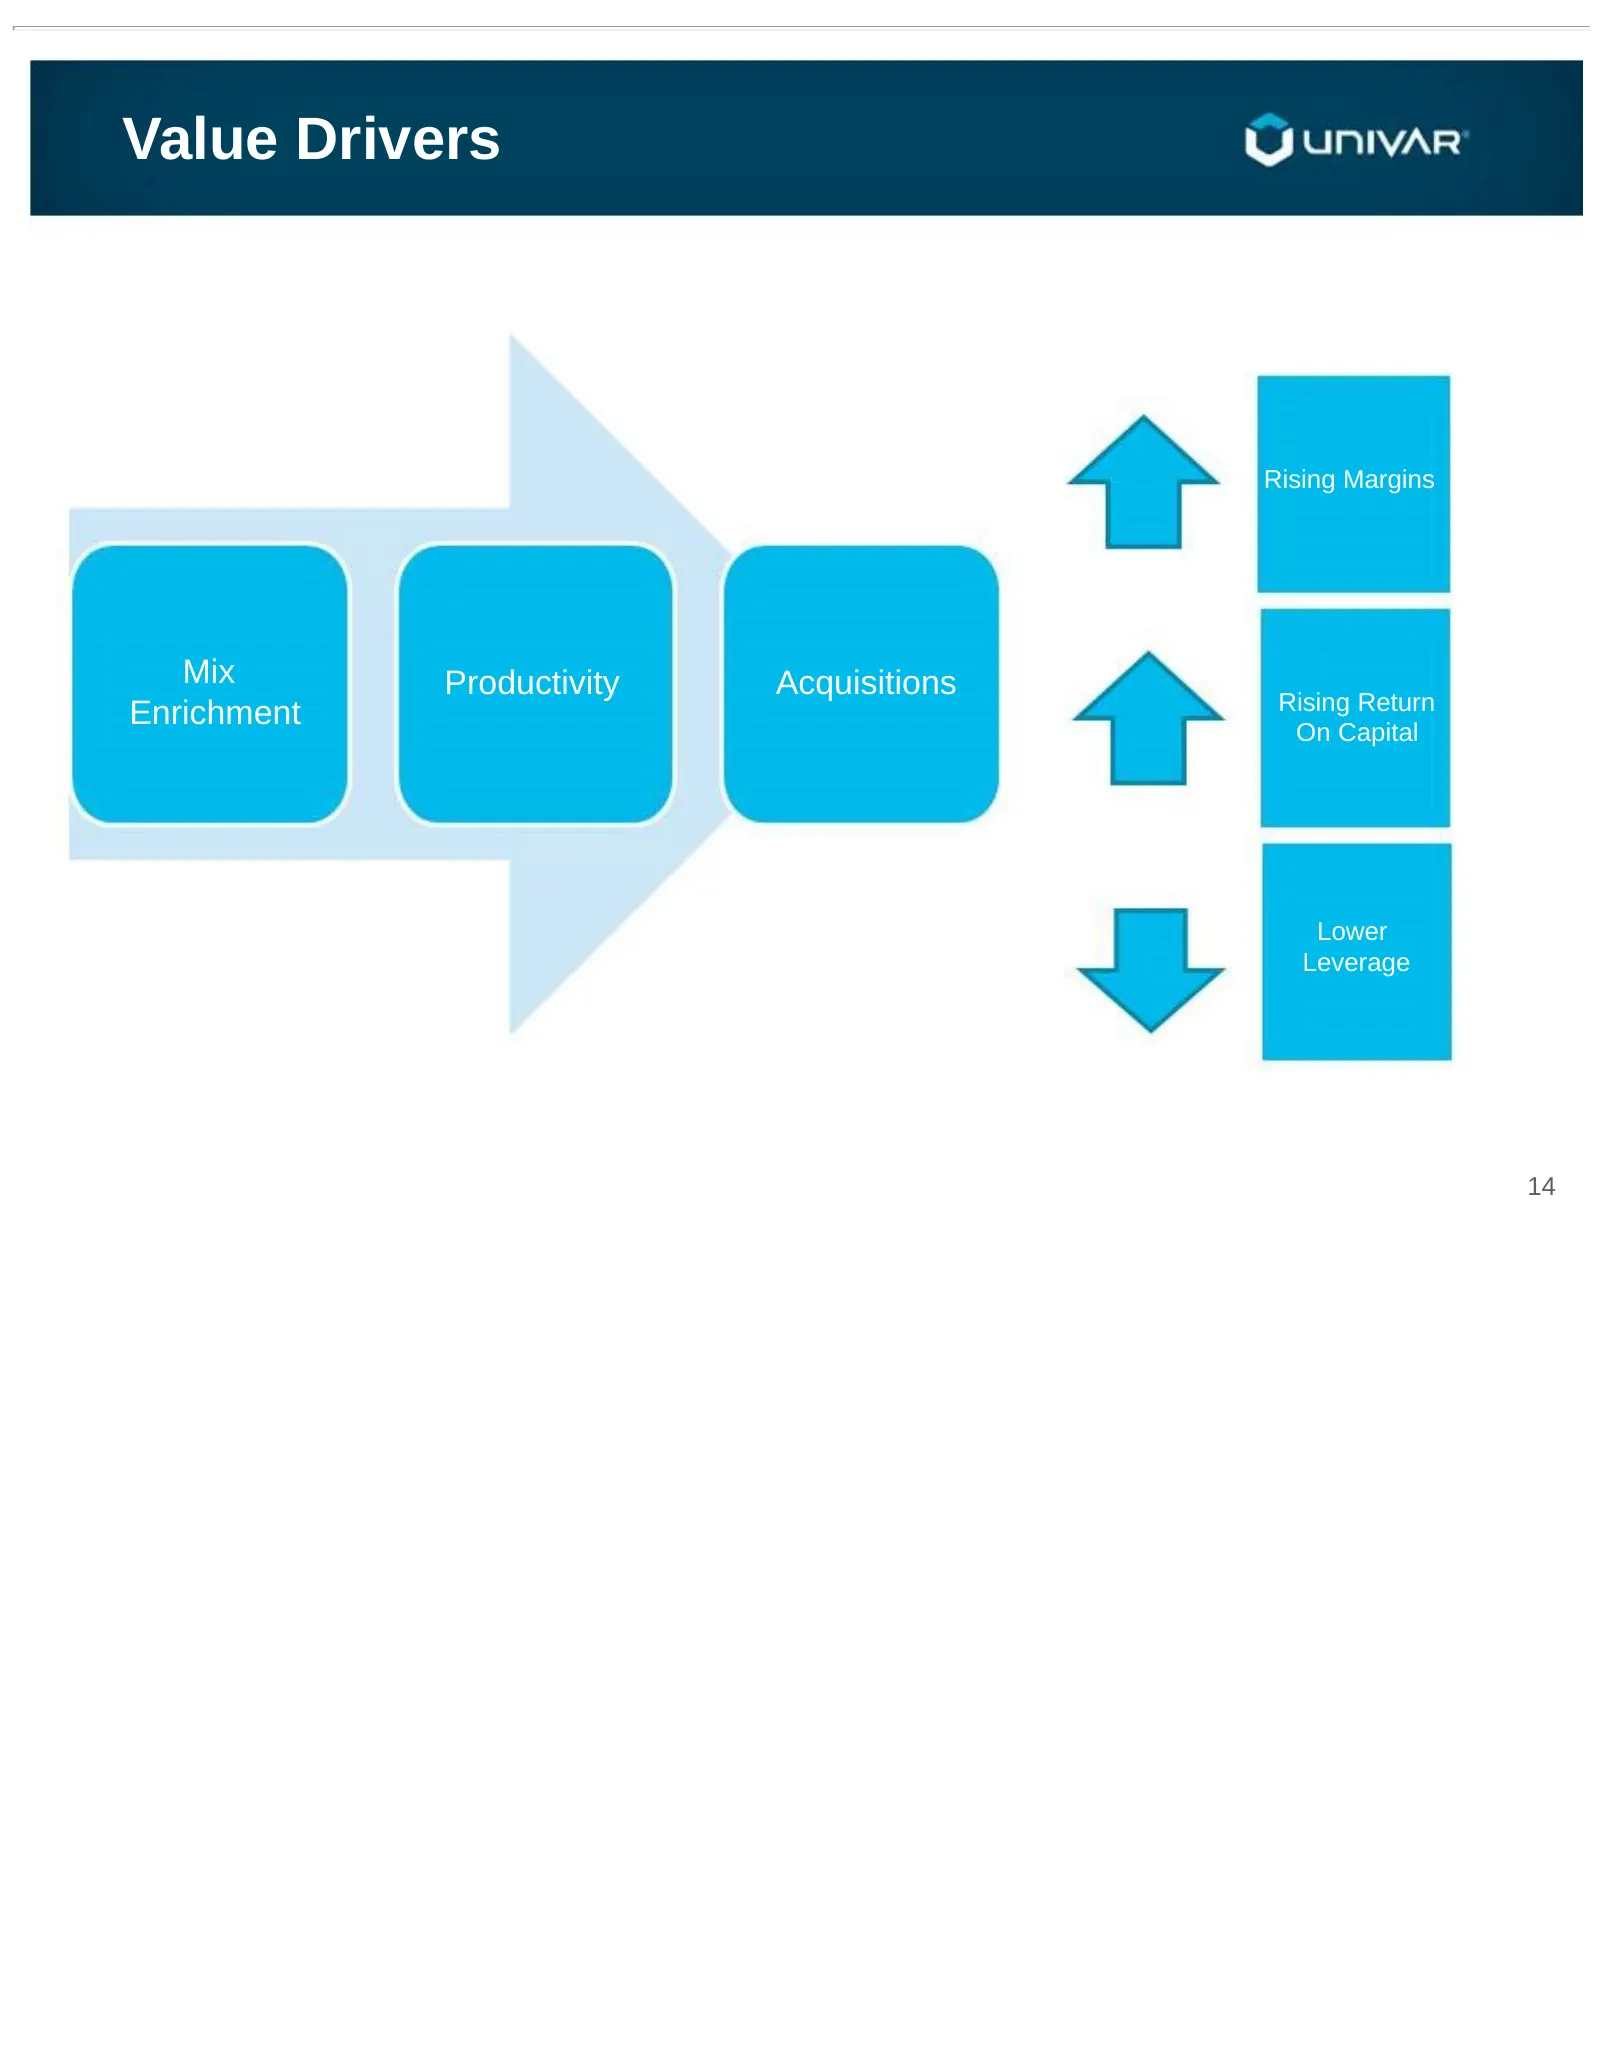
Slide 14: Value Drivers
Value Drivers Rising Margins Mix Productivity Acquisitions Rising Return Enrichment On Capital Lower Leverage 14
Slide 15: Appendix
Appendix
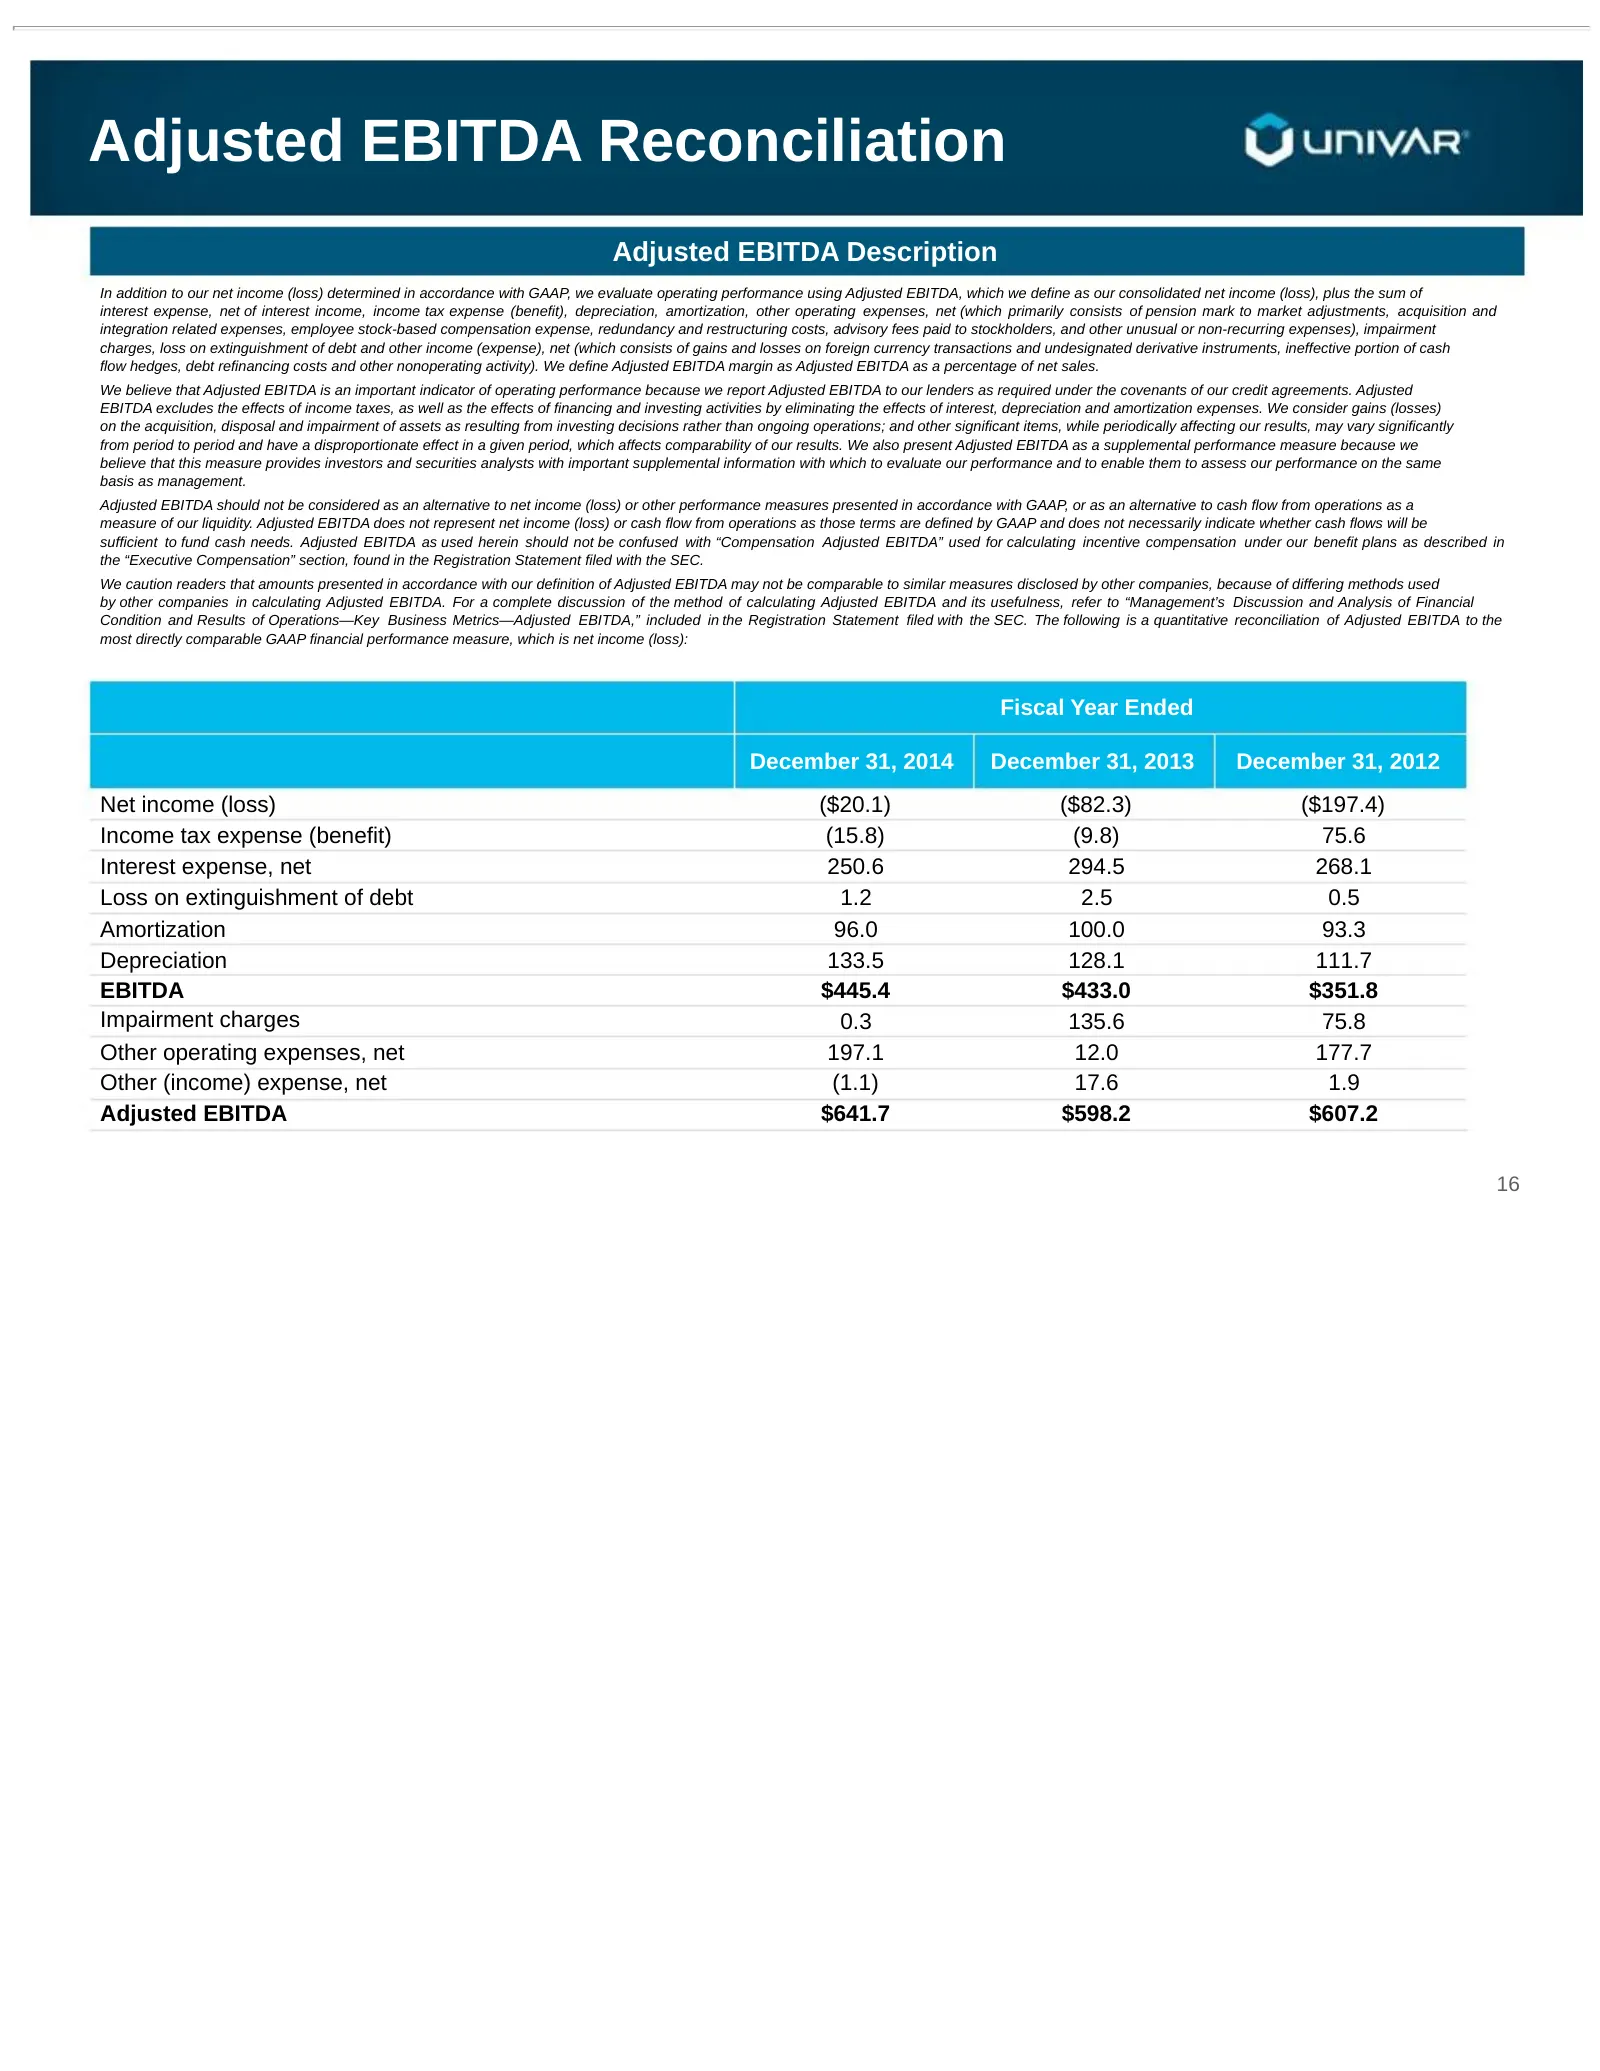
Slide 16: Adjusted EBITDA Reconciliation
Adjusted EBITDA Reconciliation Adjusted EBITDA Description In addition to our net income (loss) determined in accordance with GAAP, we evaluate operating performance using Adjusted EBITDA, which we define as our consolidated net income (loss), plus the sum of interest expense, net of interest income
Slide 17: Adjusted EBITDA Reconciliation
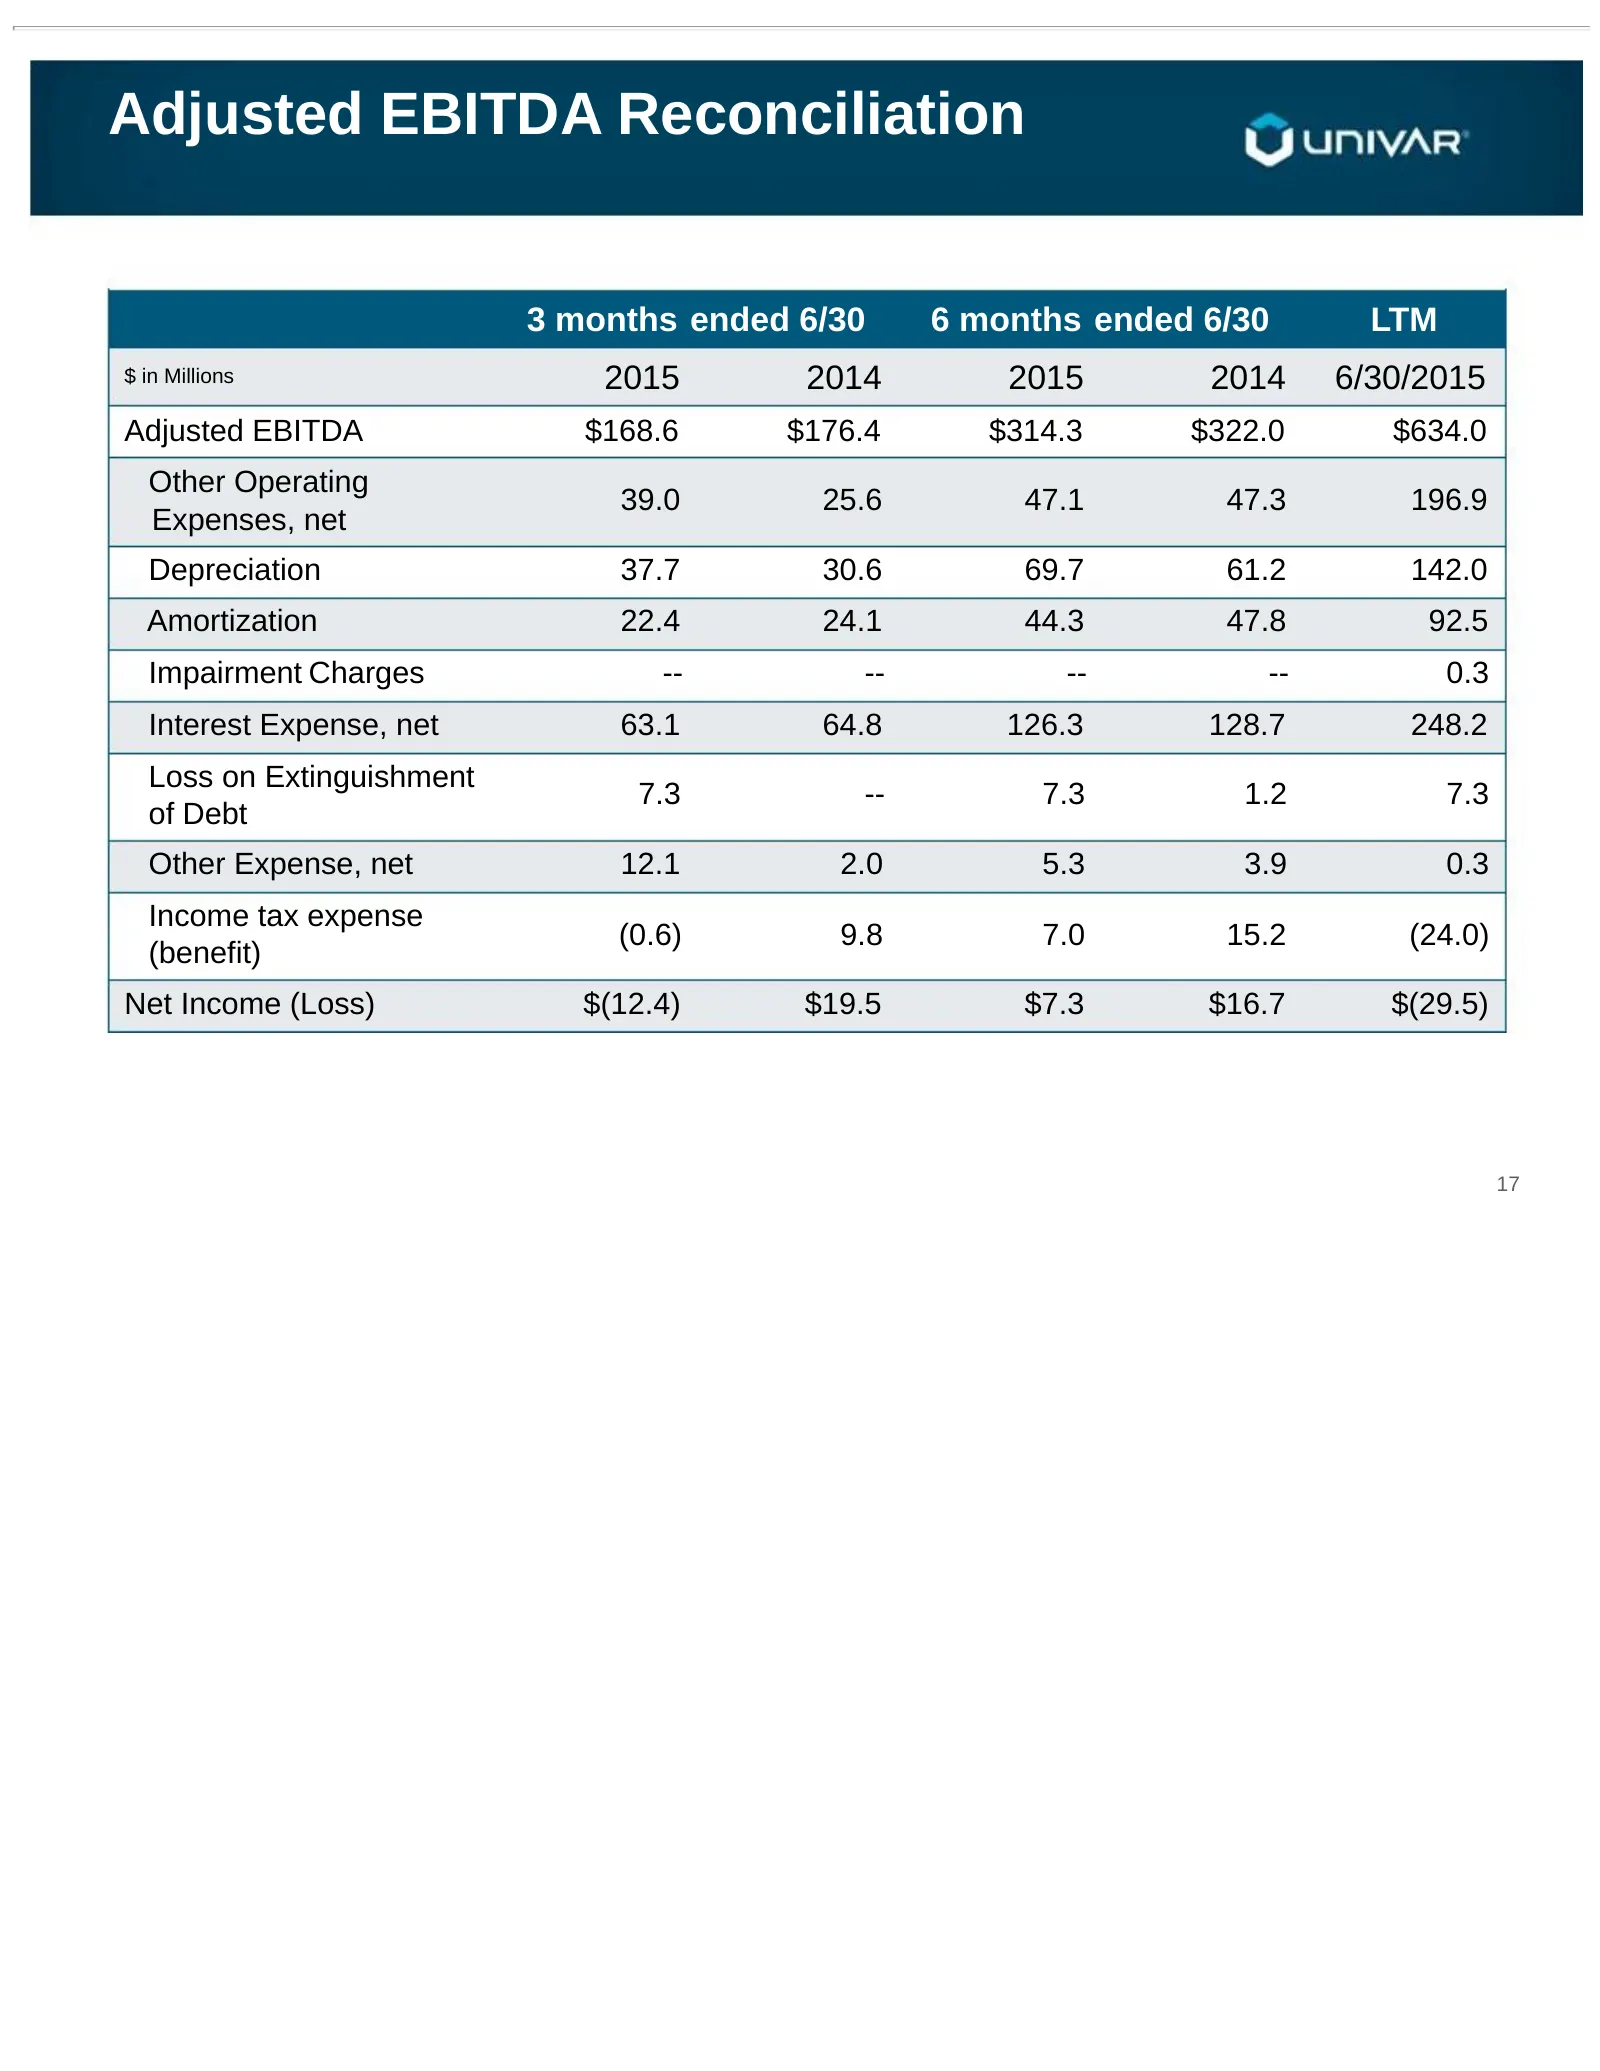
Adjusted EBITDA Reconciliation 3 months ended 6/30 6 months ended 6/30 LTM $ in Millions 2015 2014 2015 2014 6/30/2015 Adjusted EBITDA $168.6 $176.4 $314.3 $322.0 $634.0 Other Operating 39.0 25.6 47.1 47.3 196.9 Expenses, net Depreciation 37.7 30.6 69.7 61.2 142.0 Amortization 22.4 24.1 44.3 47.8 92
Slide 18: NWC Reconciliation
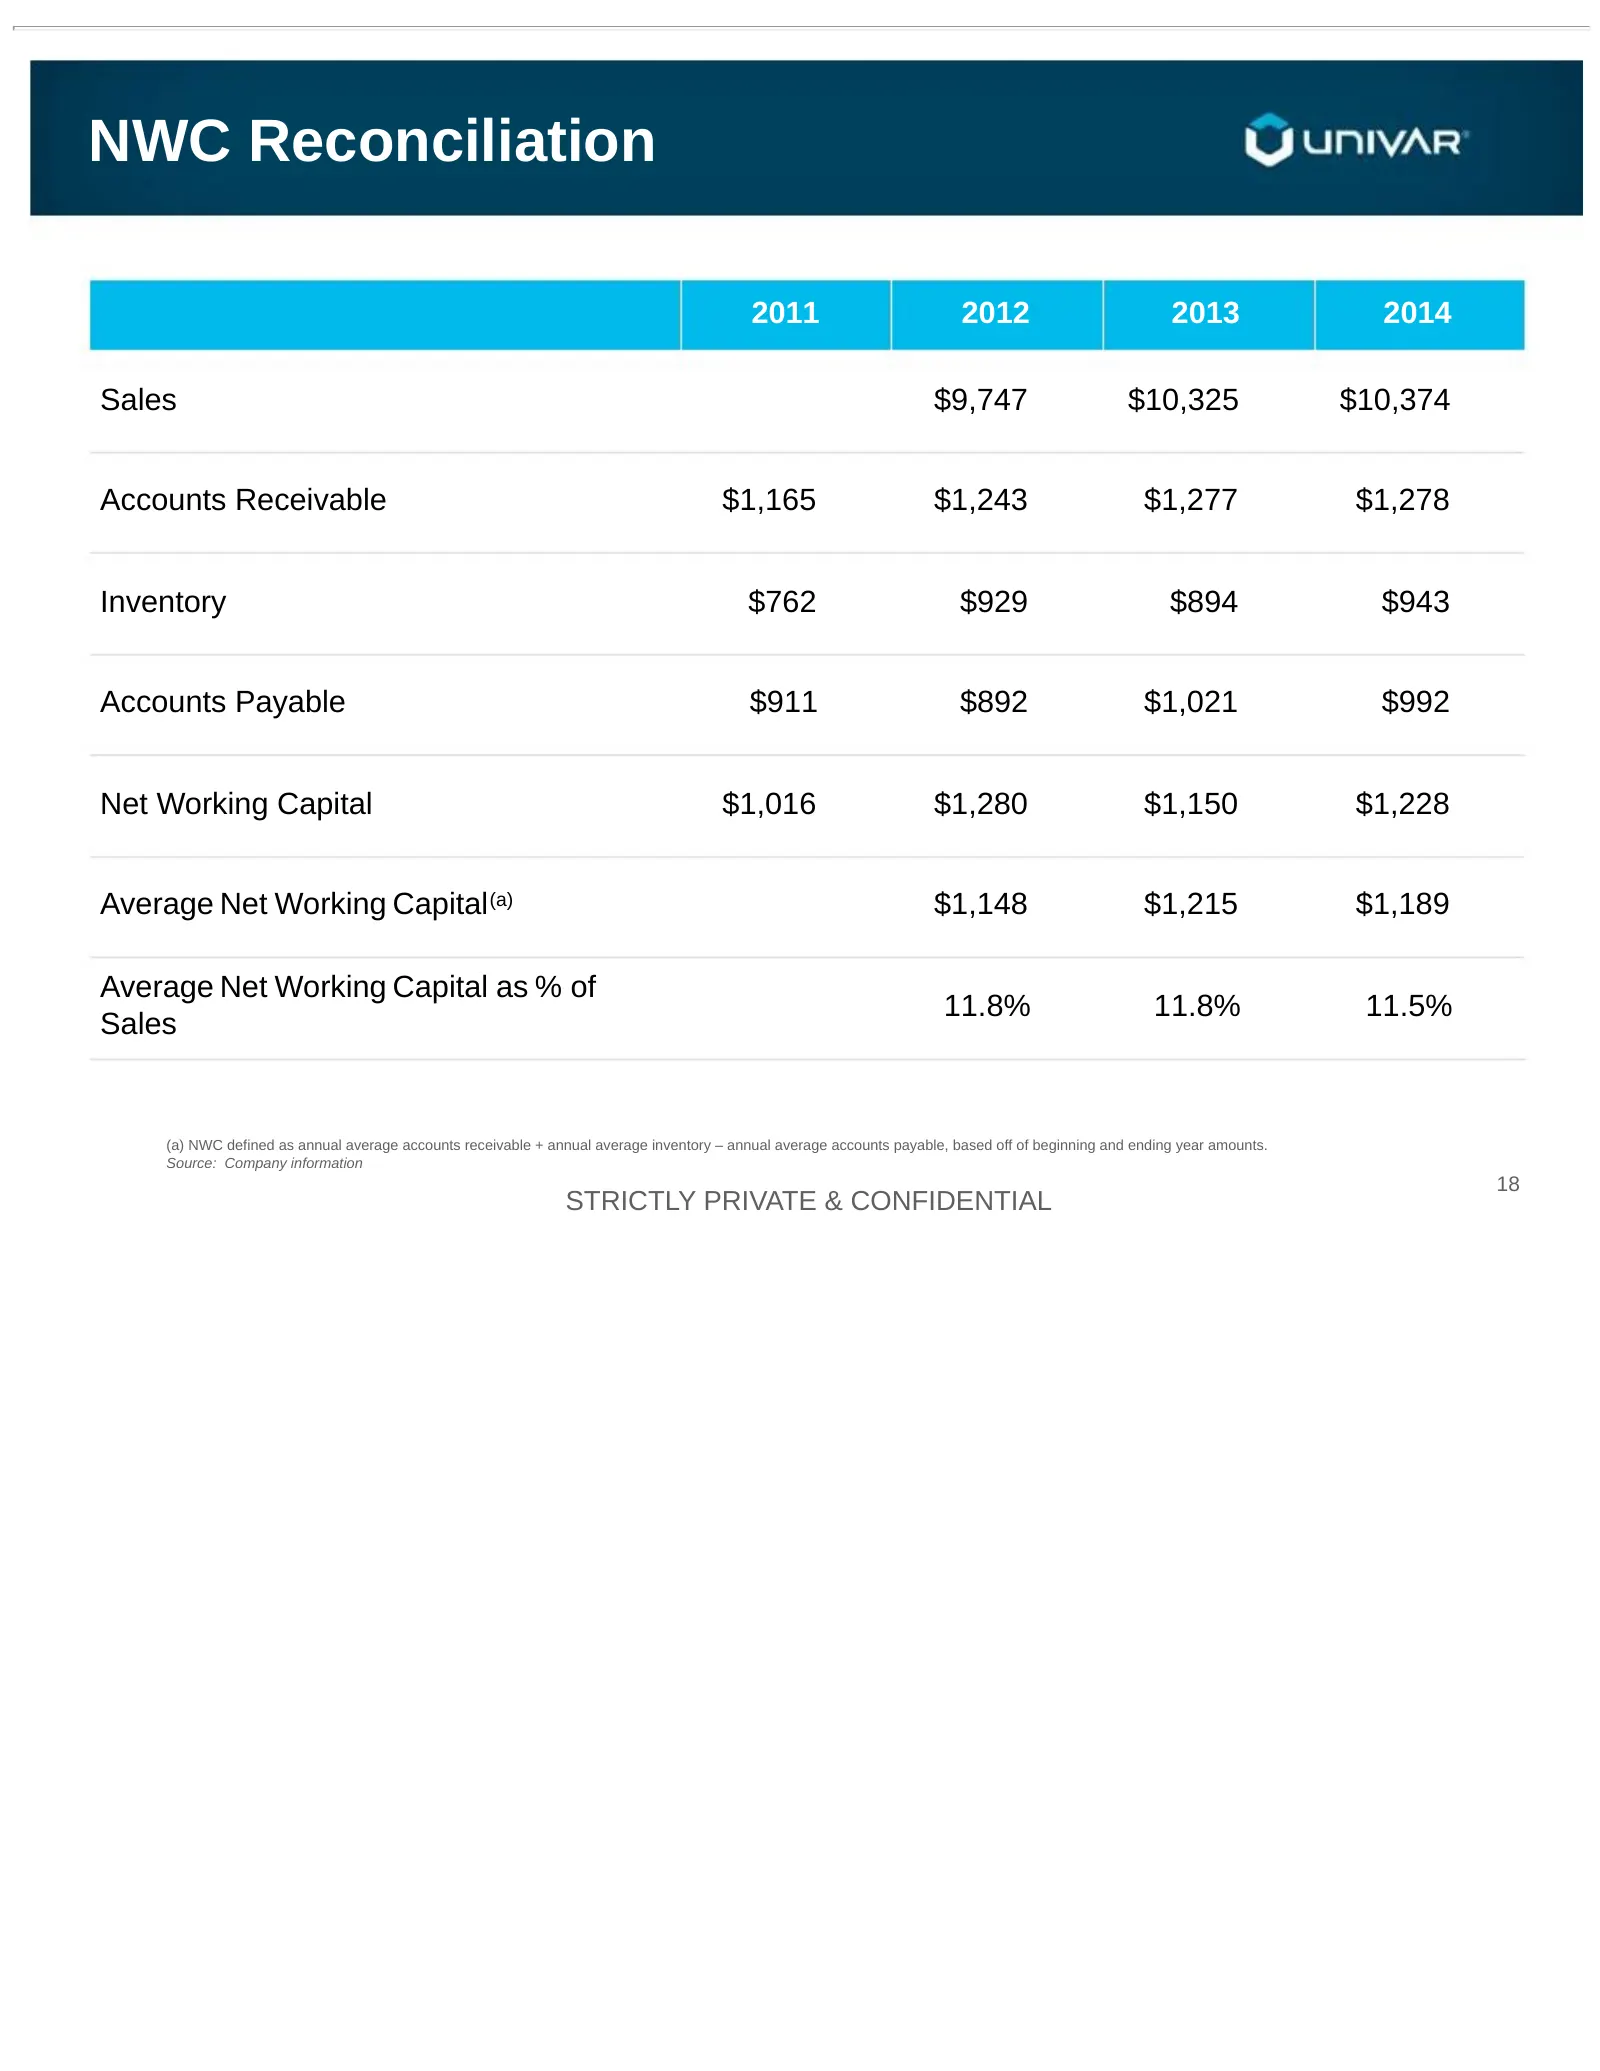
NWC Reconciliation 2011 2012 2013 2014 Sales $9,747 $10,325 $10,374 Accounts Receivable $1,165 $1,243 $1,277 $1,278 Inventory $762 $929 $894 $943 Accounts Payable $911 $892 $1,021 $992 Net Working Capital $1,016 $1,280 $1,150 $1,228 Average Net Working Capital (a) $1,148 $1,215 $1,189 Average Net Wo
Slide 19: Chemistry Delivered
CHEMISTRY DELIVERED
Source: SEC EDGAR · 8-K filed Sep 17, 2015
More decks from Univar Inc
 Q4 2019 Earnings Presentation24 slides · Feb 28, 2020
 Baird Global Industrial Conference 201924 slides · Nov 7, 2019
 Investor Presentation (August 2019)31 slides · Aug 7, 2019
 Q2 2019 Earnings Presentation20 slides · Aug 5, 2019
 Q1 2019 Earnings Presentation17 slides · May 9, 2019
 FY2018 Earnings Presentation16 slides · Mar 4, 2019