Continental Resources — The Oil & Gas Conference 2008
19 slides from Continental Resources's conference presentation, Aug 8, 2008
Slide 1: The Oil & Gas Conference
Exhibit 99.1 The Oil & Gas Conference August 11, 2008
Slide 2: Forward Looking Statements
Forward Looking Statements This presentation includes forward-looking information that is subject to a number of risks and uncertainties, many of which are beyond the Company’s control. All information, other than historical facts included in this presentation, regarding strategy, future operations,
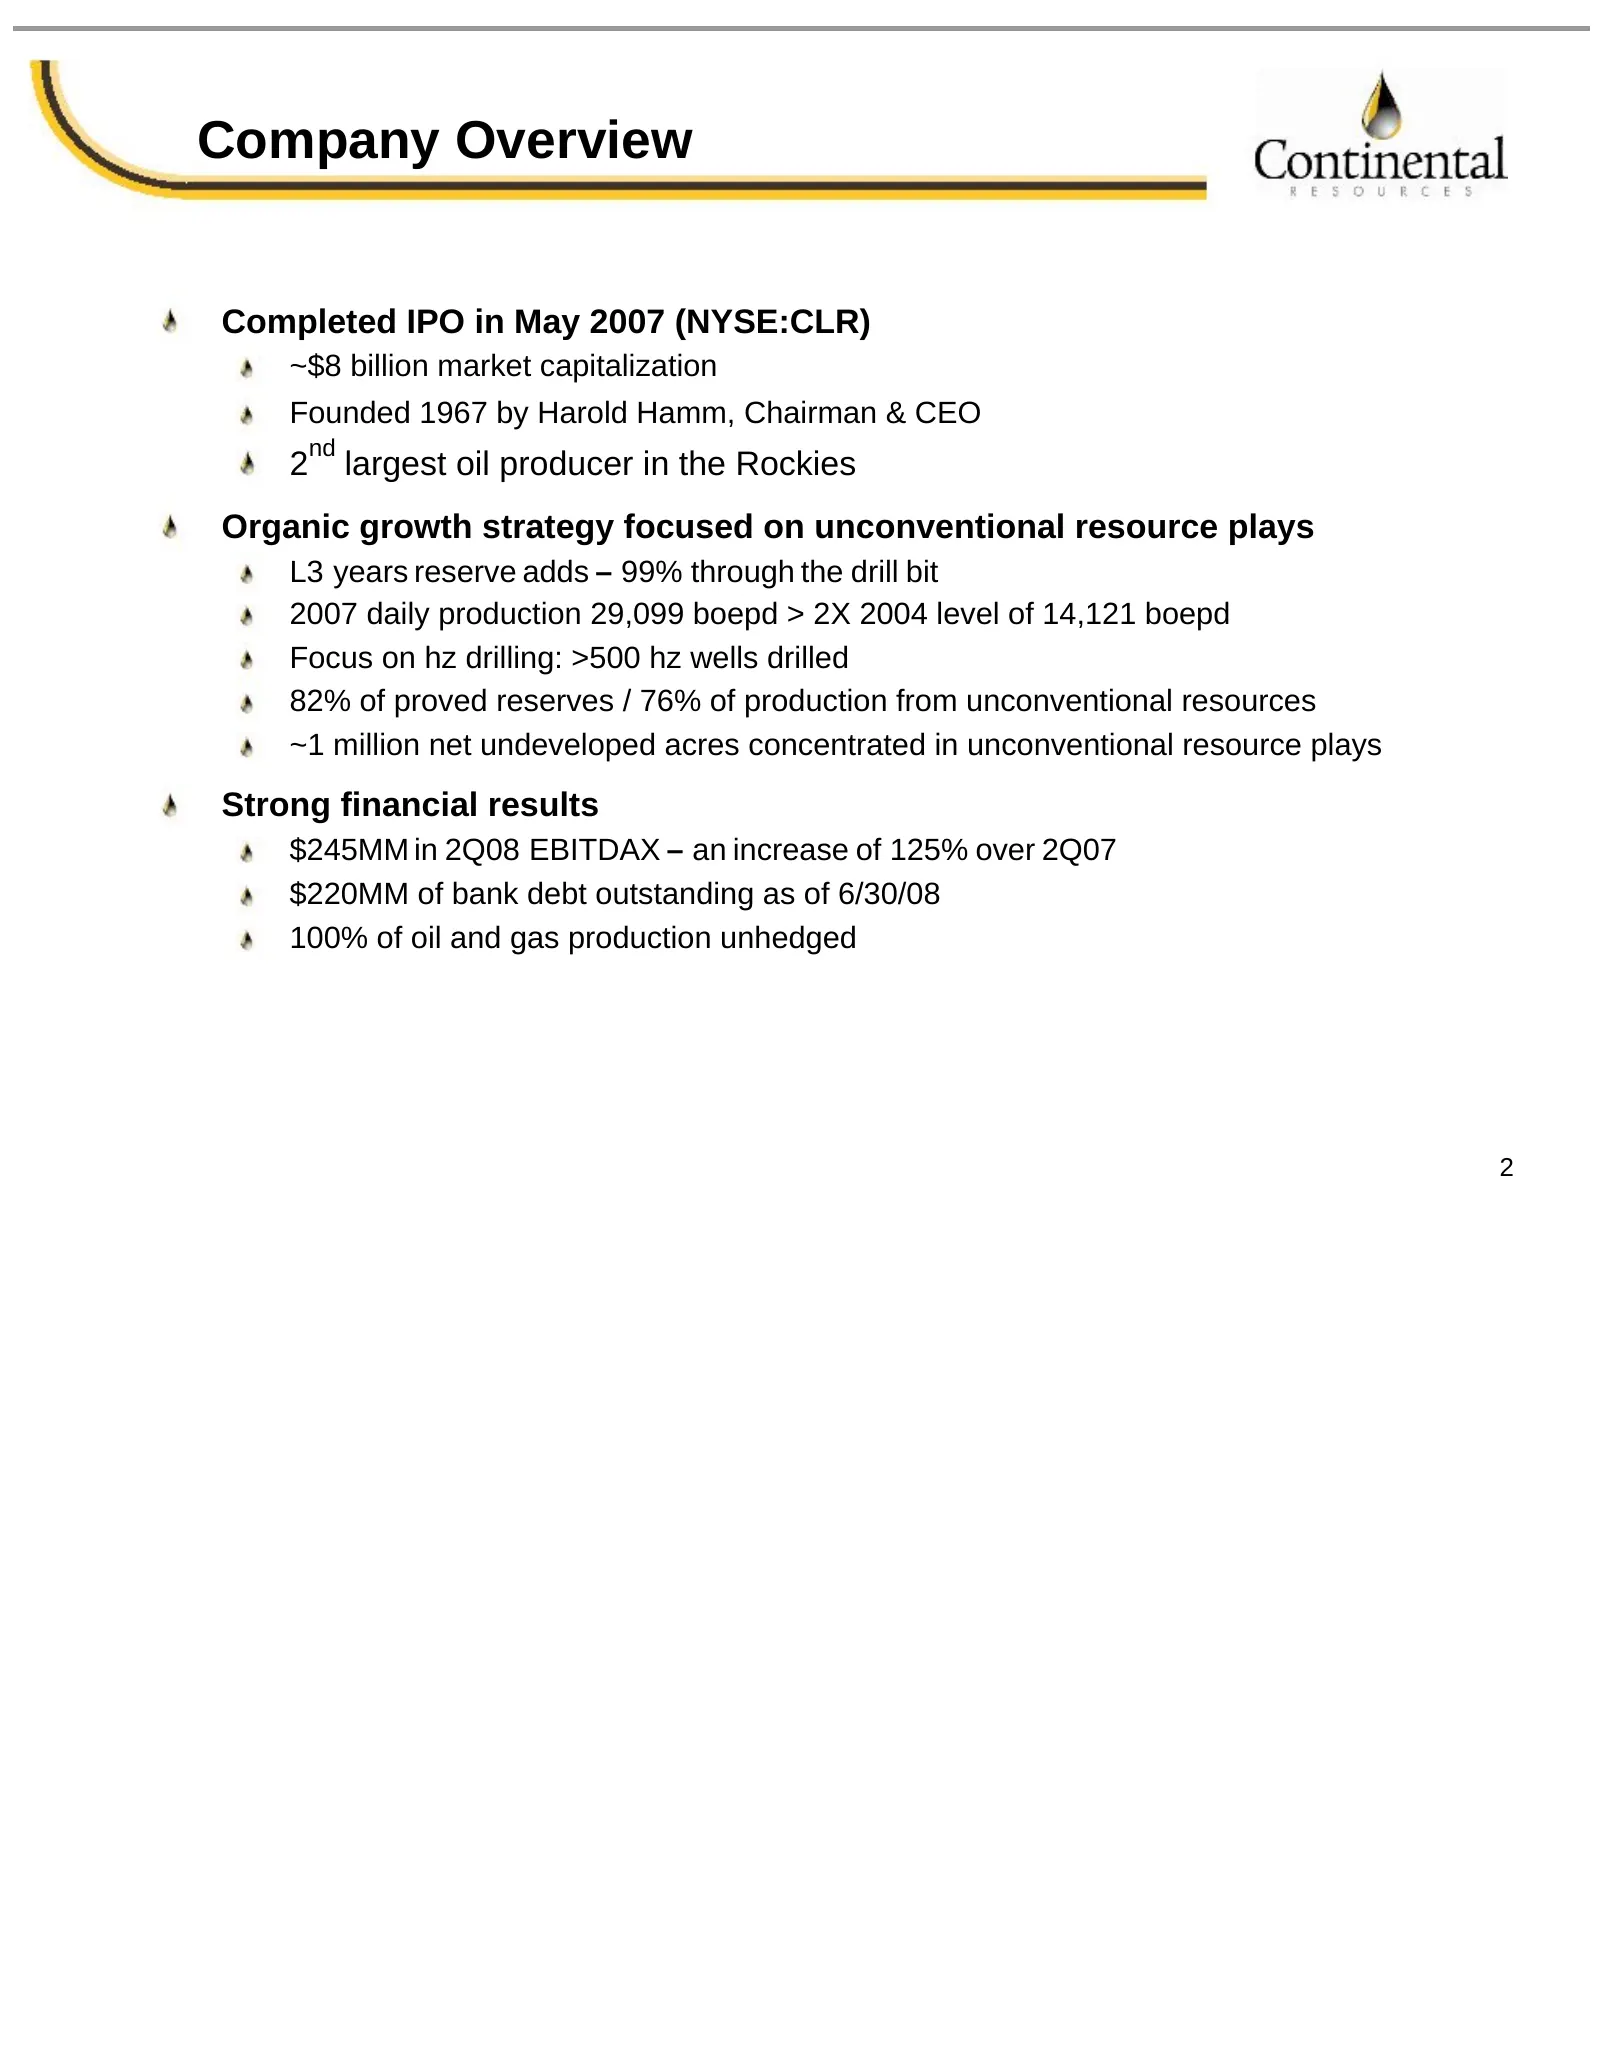
Slide 3: Company Overview
Company Overview Completed IPO in May 2007 (NYSE:CLR) ~$8 billion market capitalization Founded 1967 by Harold Hamm, Chairman & CEO nd 2 largest oil producer in the Rockies Organic growth strategy focused on unconventional resource plays L3 years reserve adds – 99% through the drill bit 2007 daily p
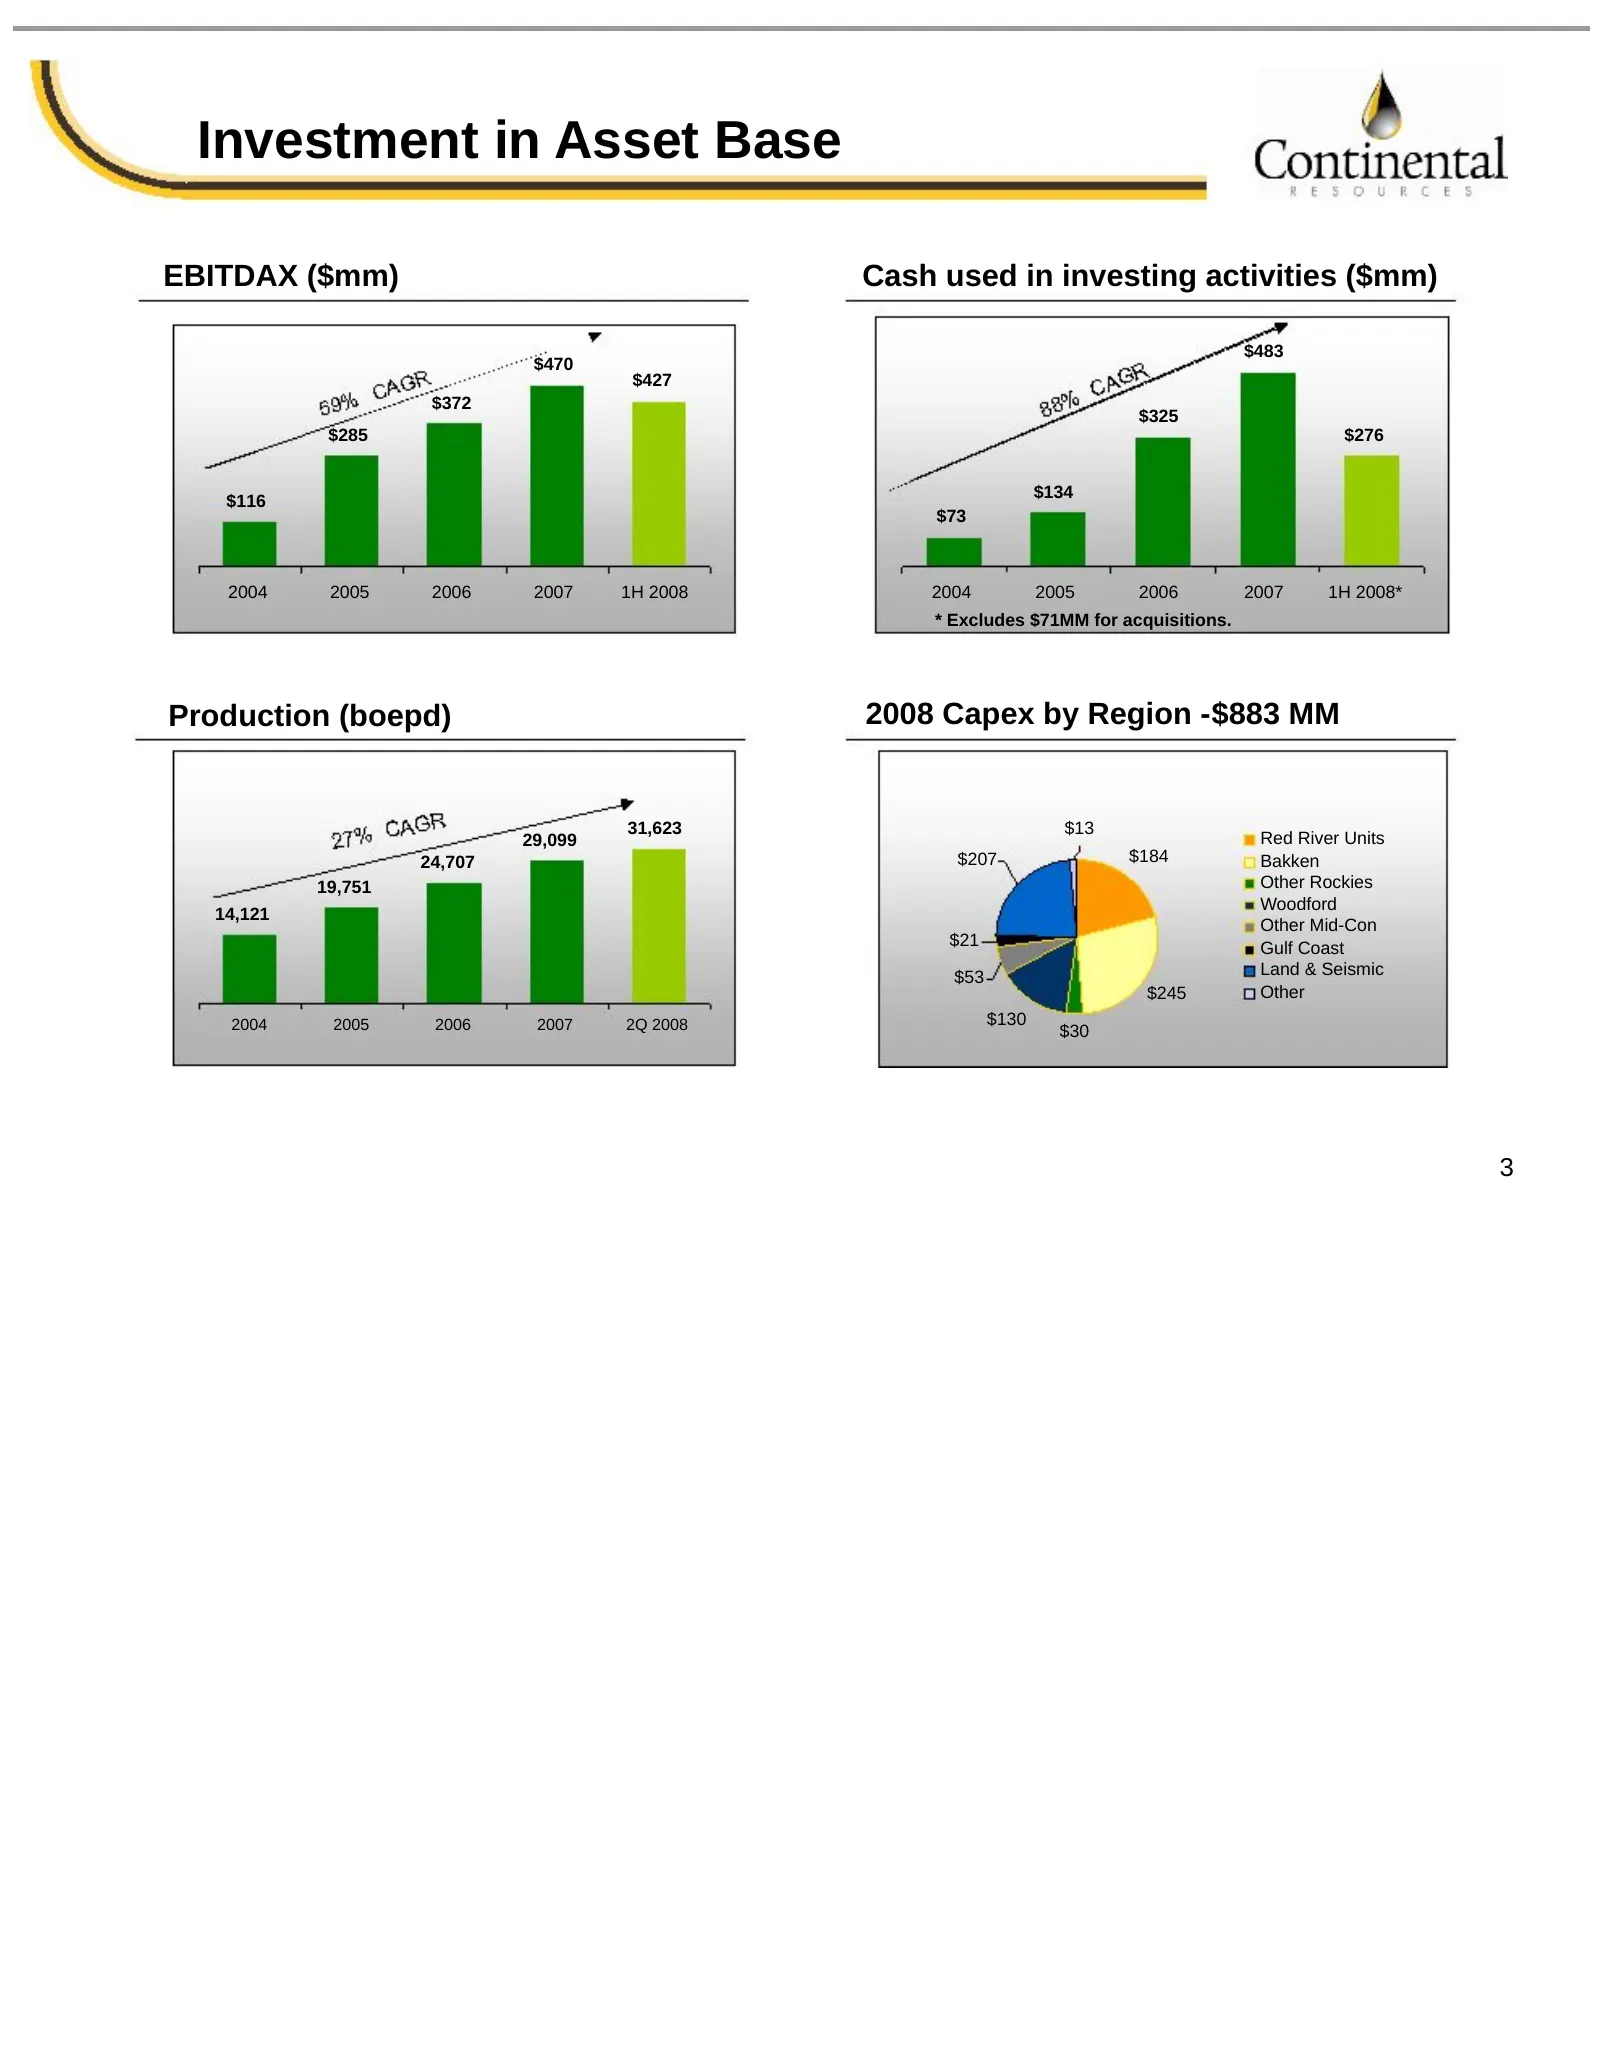
Slide 4: Investment in Asset Base
Investment in Asset Base EBITDAX ($mm) Cash used in investing activities ($mm) $483 $470 $427 $372 $325 $285 $276 $134 $116 $73 2004 2005 2006 2007 1H 2008 2004 2005 2006 2007 1H 2008* * Excludes $71MM for acquisitions. Production (boepd) 2008 Capex by Region -$883 MM 31,623 $13 29,099 Red River Uni
Slide 5: Financial and Operating Summary
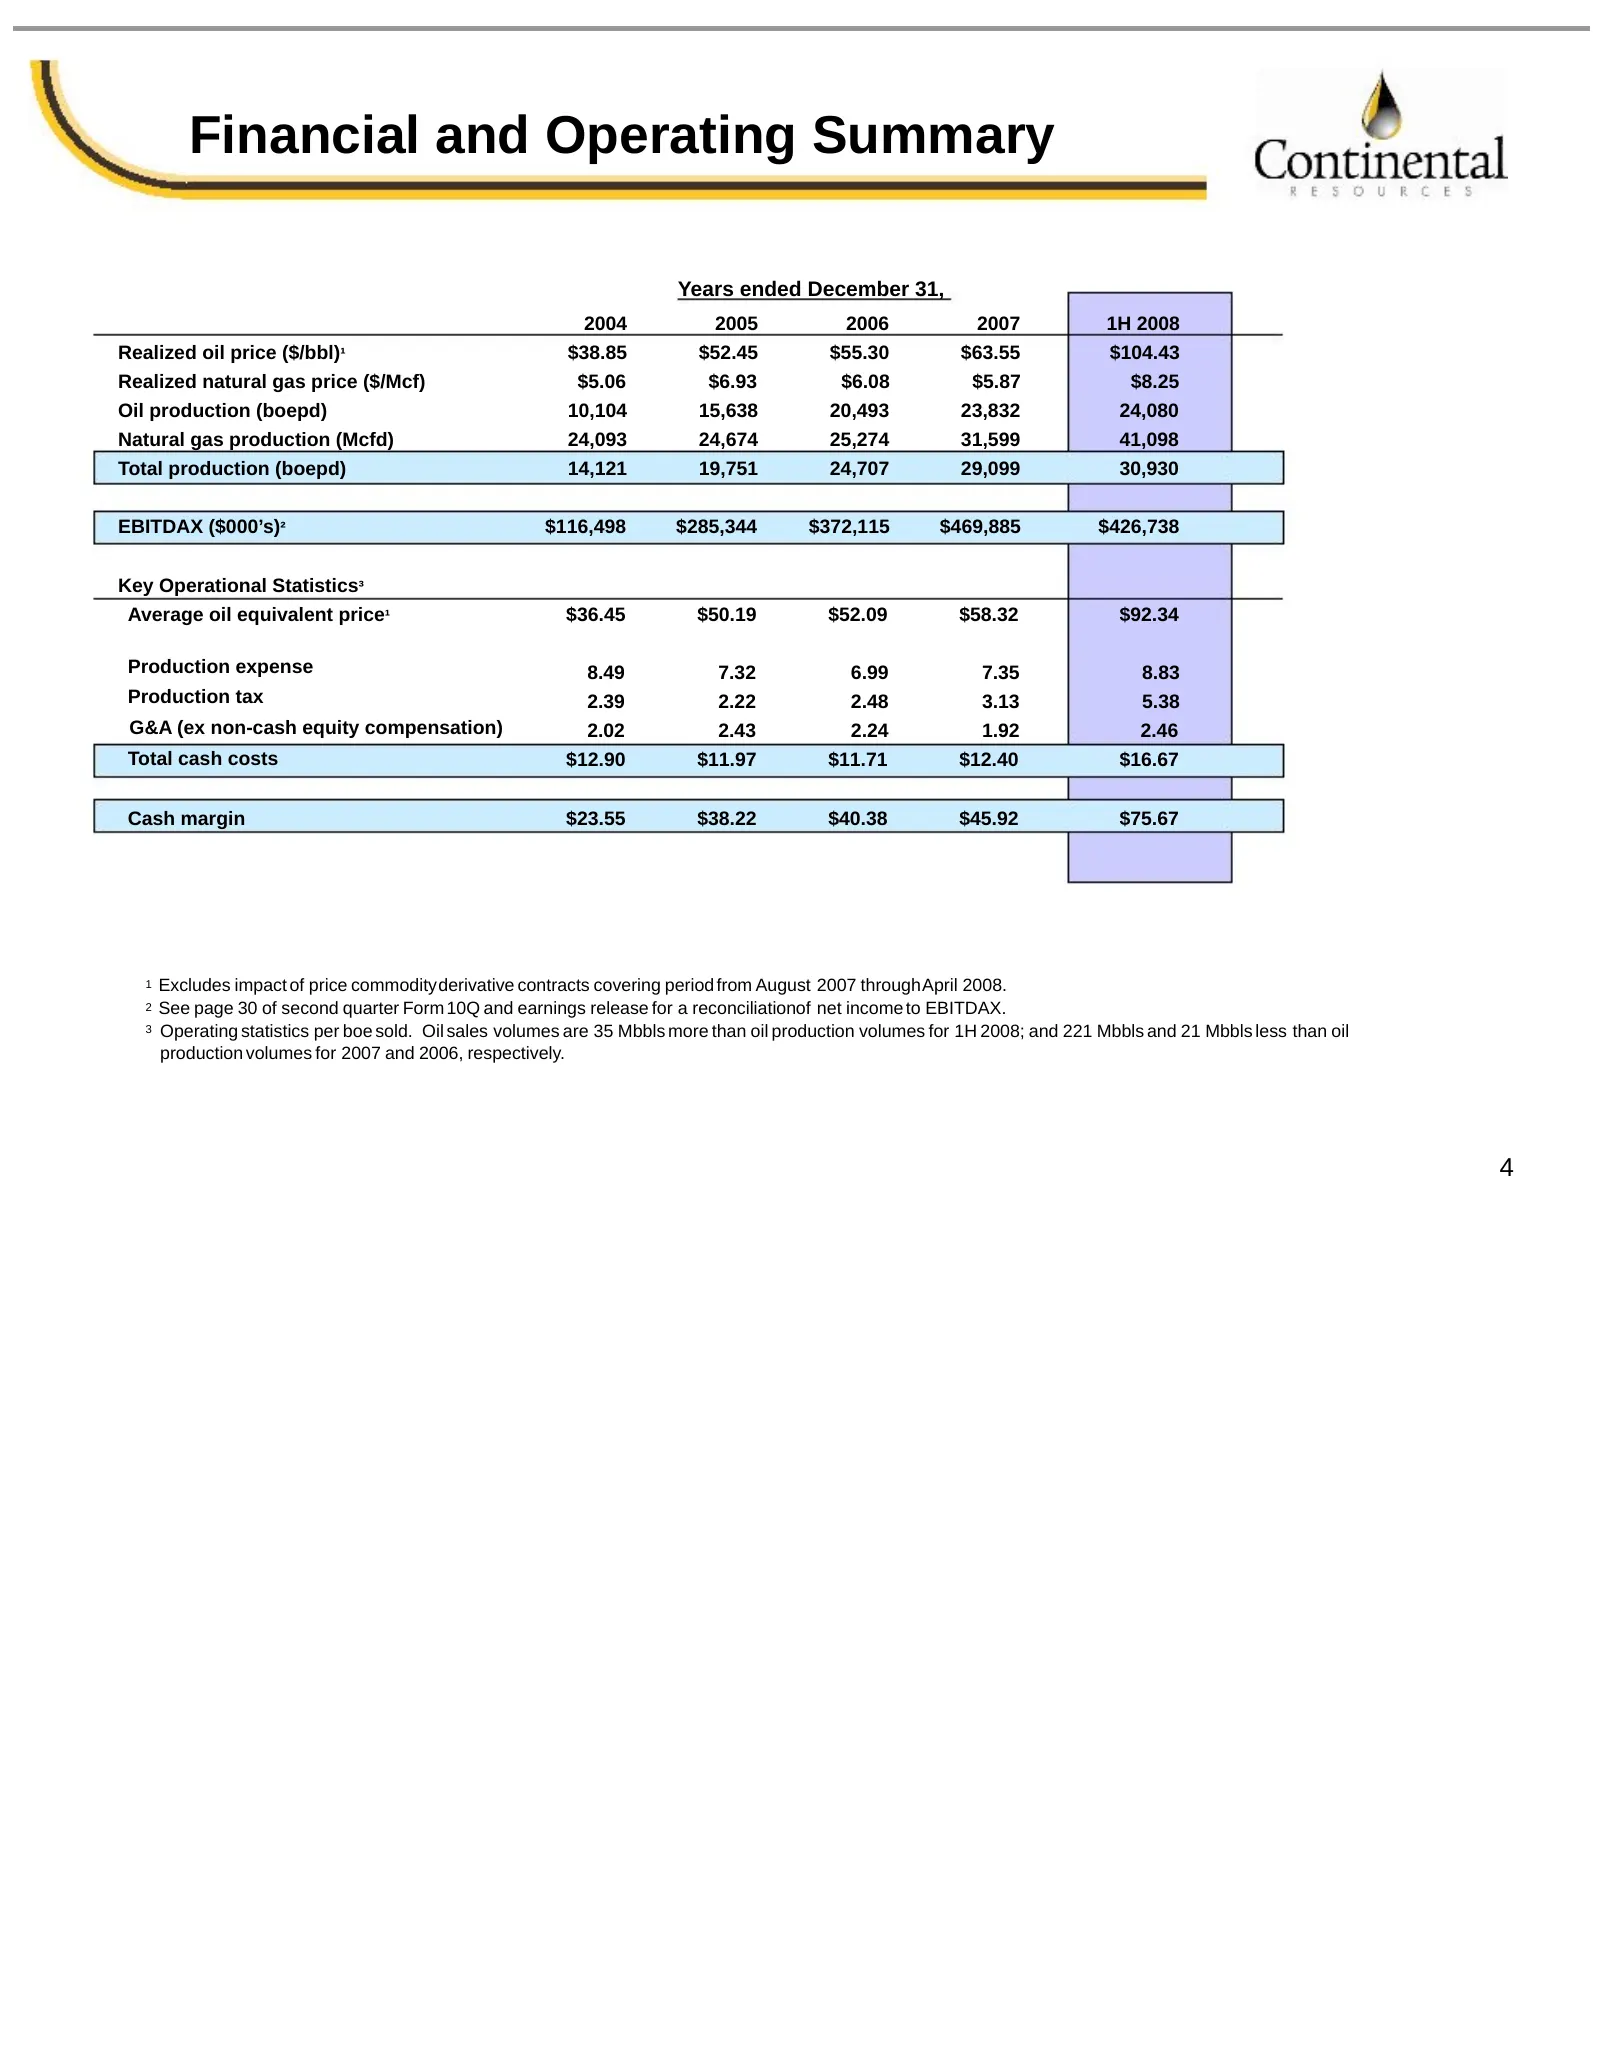
Financial and Operating Summary Years ended December 31, 2004 2005 2006 2007 1H 2008 Realized oil price ($/bbl)¹ $38.85 $52.45 $55.30 $63.55 $104.43 Realized natural gas price ($/Mcf) $5.06 $6.93 $6.08 $5.87 $8.25 Oil production (boepd) 10,104 15,638 20,493 23,832 24,080 Natural gas production (Mcfd
Slide 6: Operational Overview
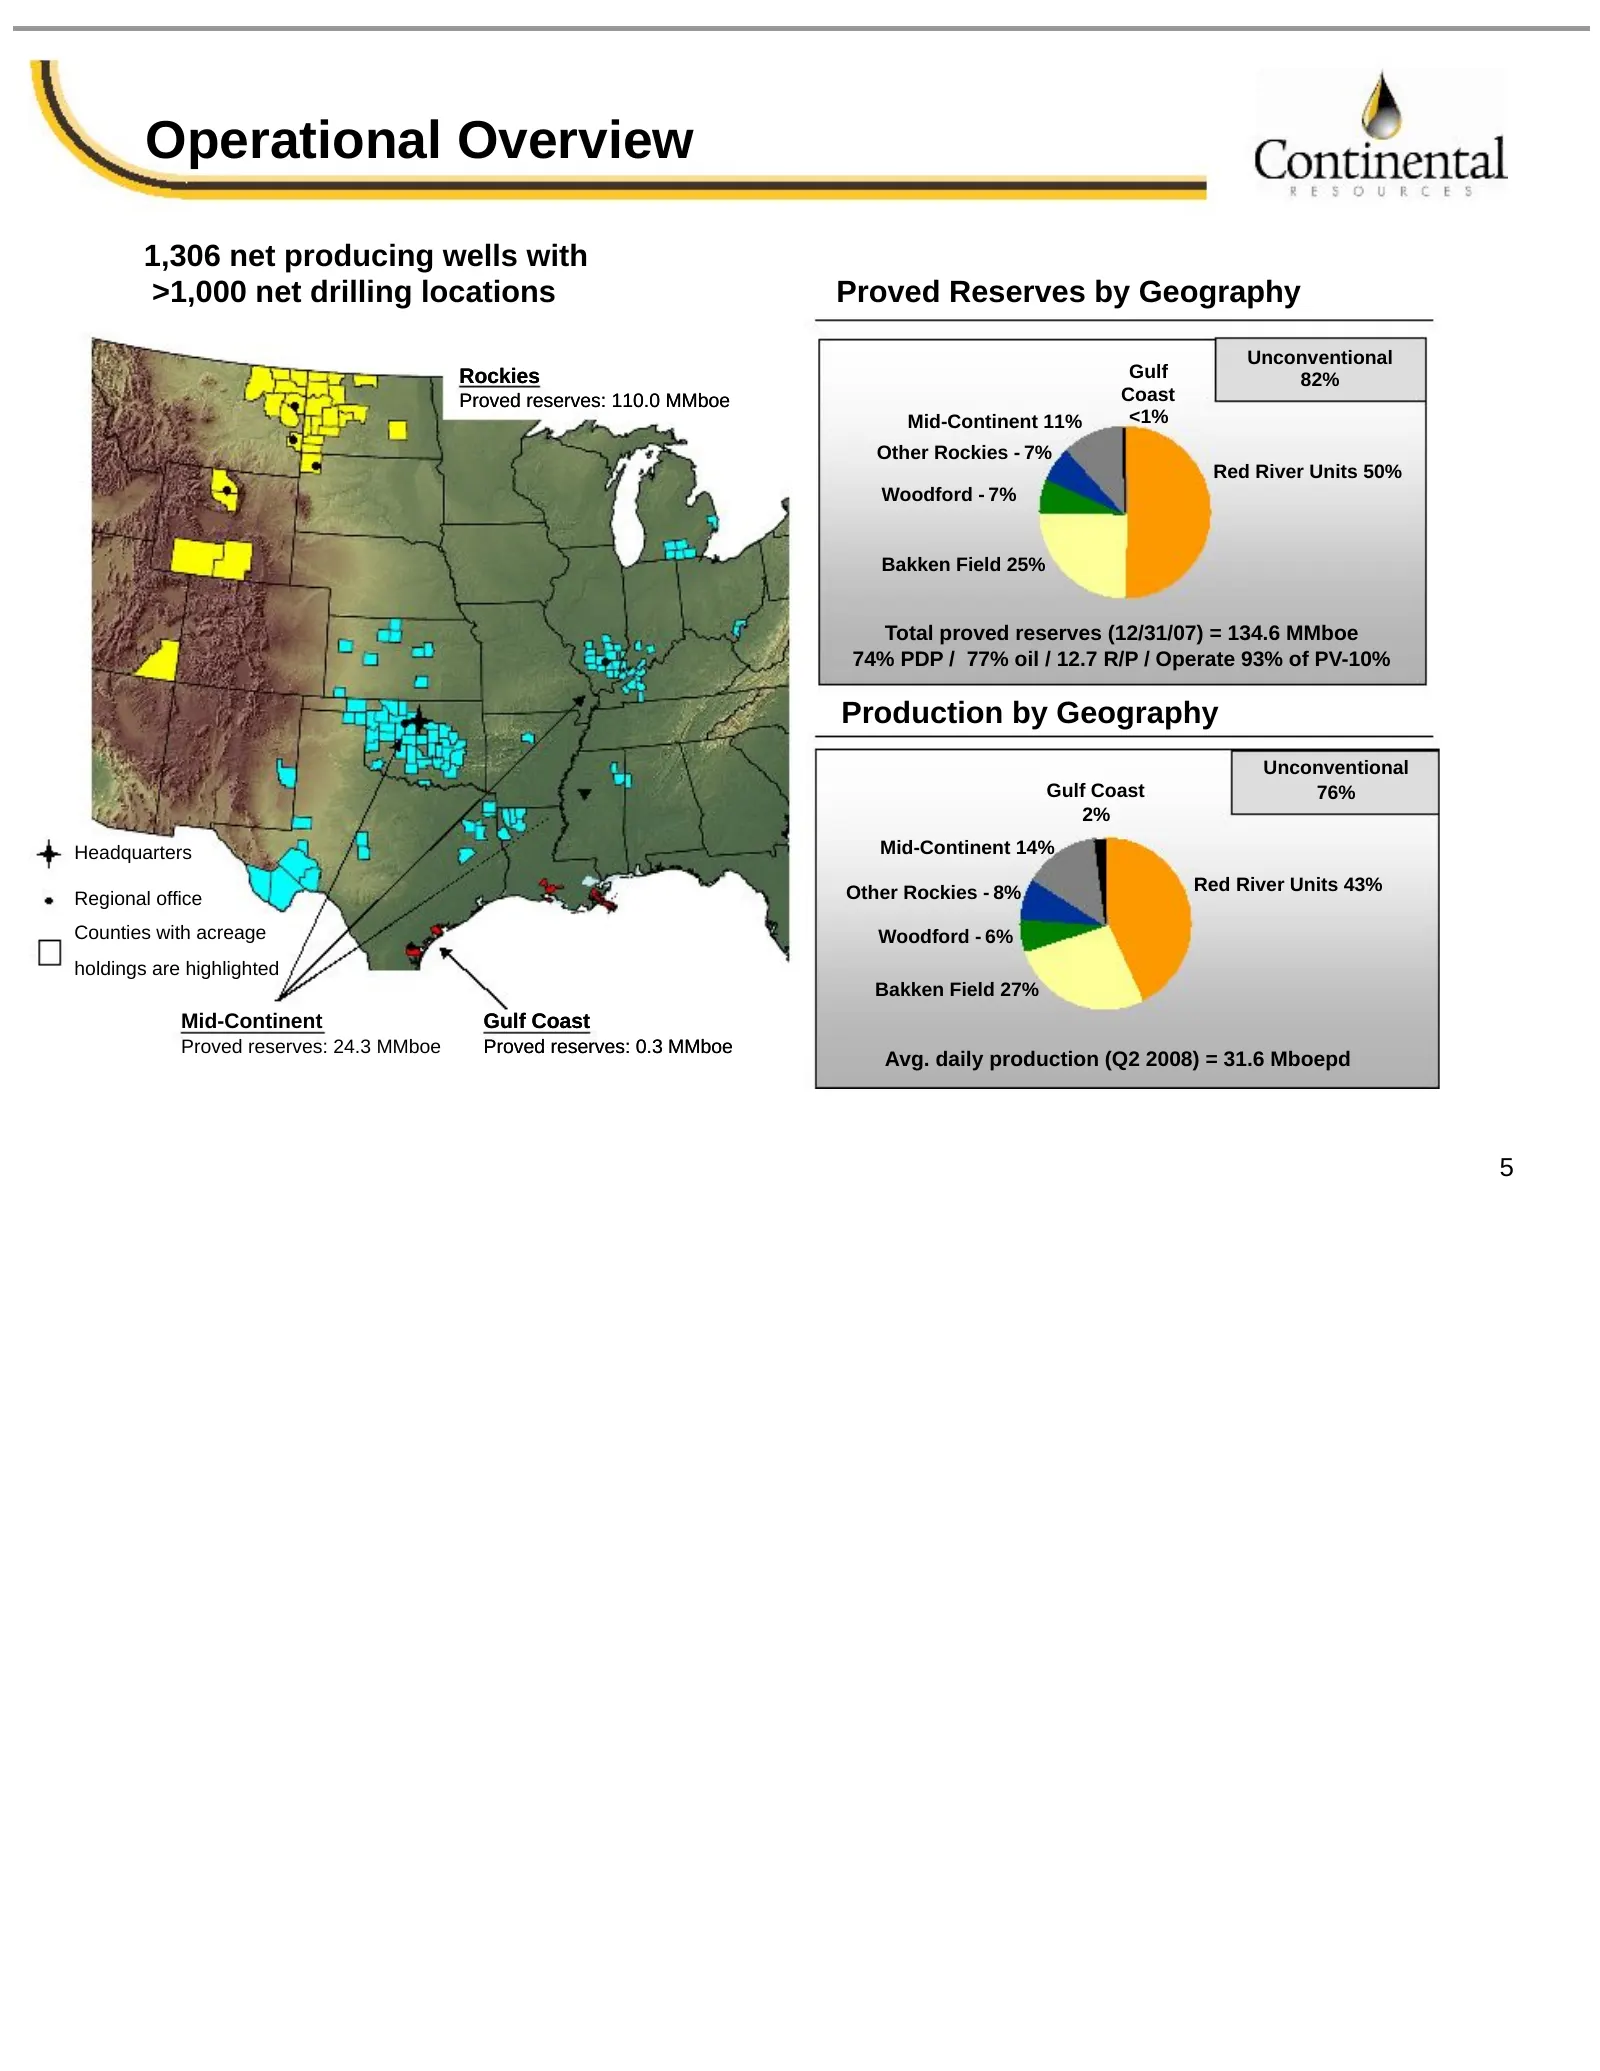
Operational Overview 1,306 net producing wells with >1,000 net drilling locations Proved Reserves by Geography Unconventional Rockies Gulf 82% Proved reserves: 110.0 MMboe Coast Mid-Continent 11% <1% Other Rockies - 7% Red River Units 50% Woodford - 7% Bakken Field 25% Total proved reserves (12/31/0
Slide 7: Key Drilling Projects
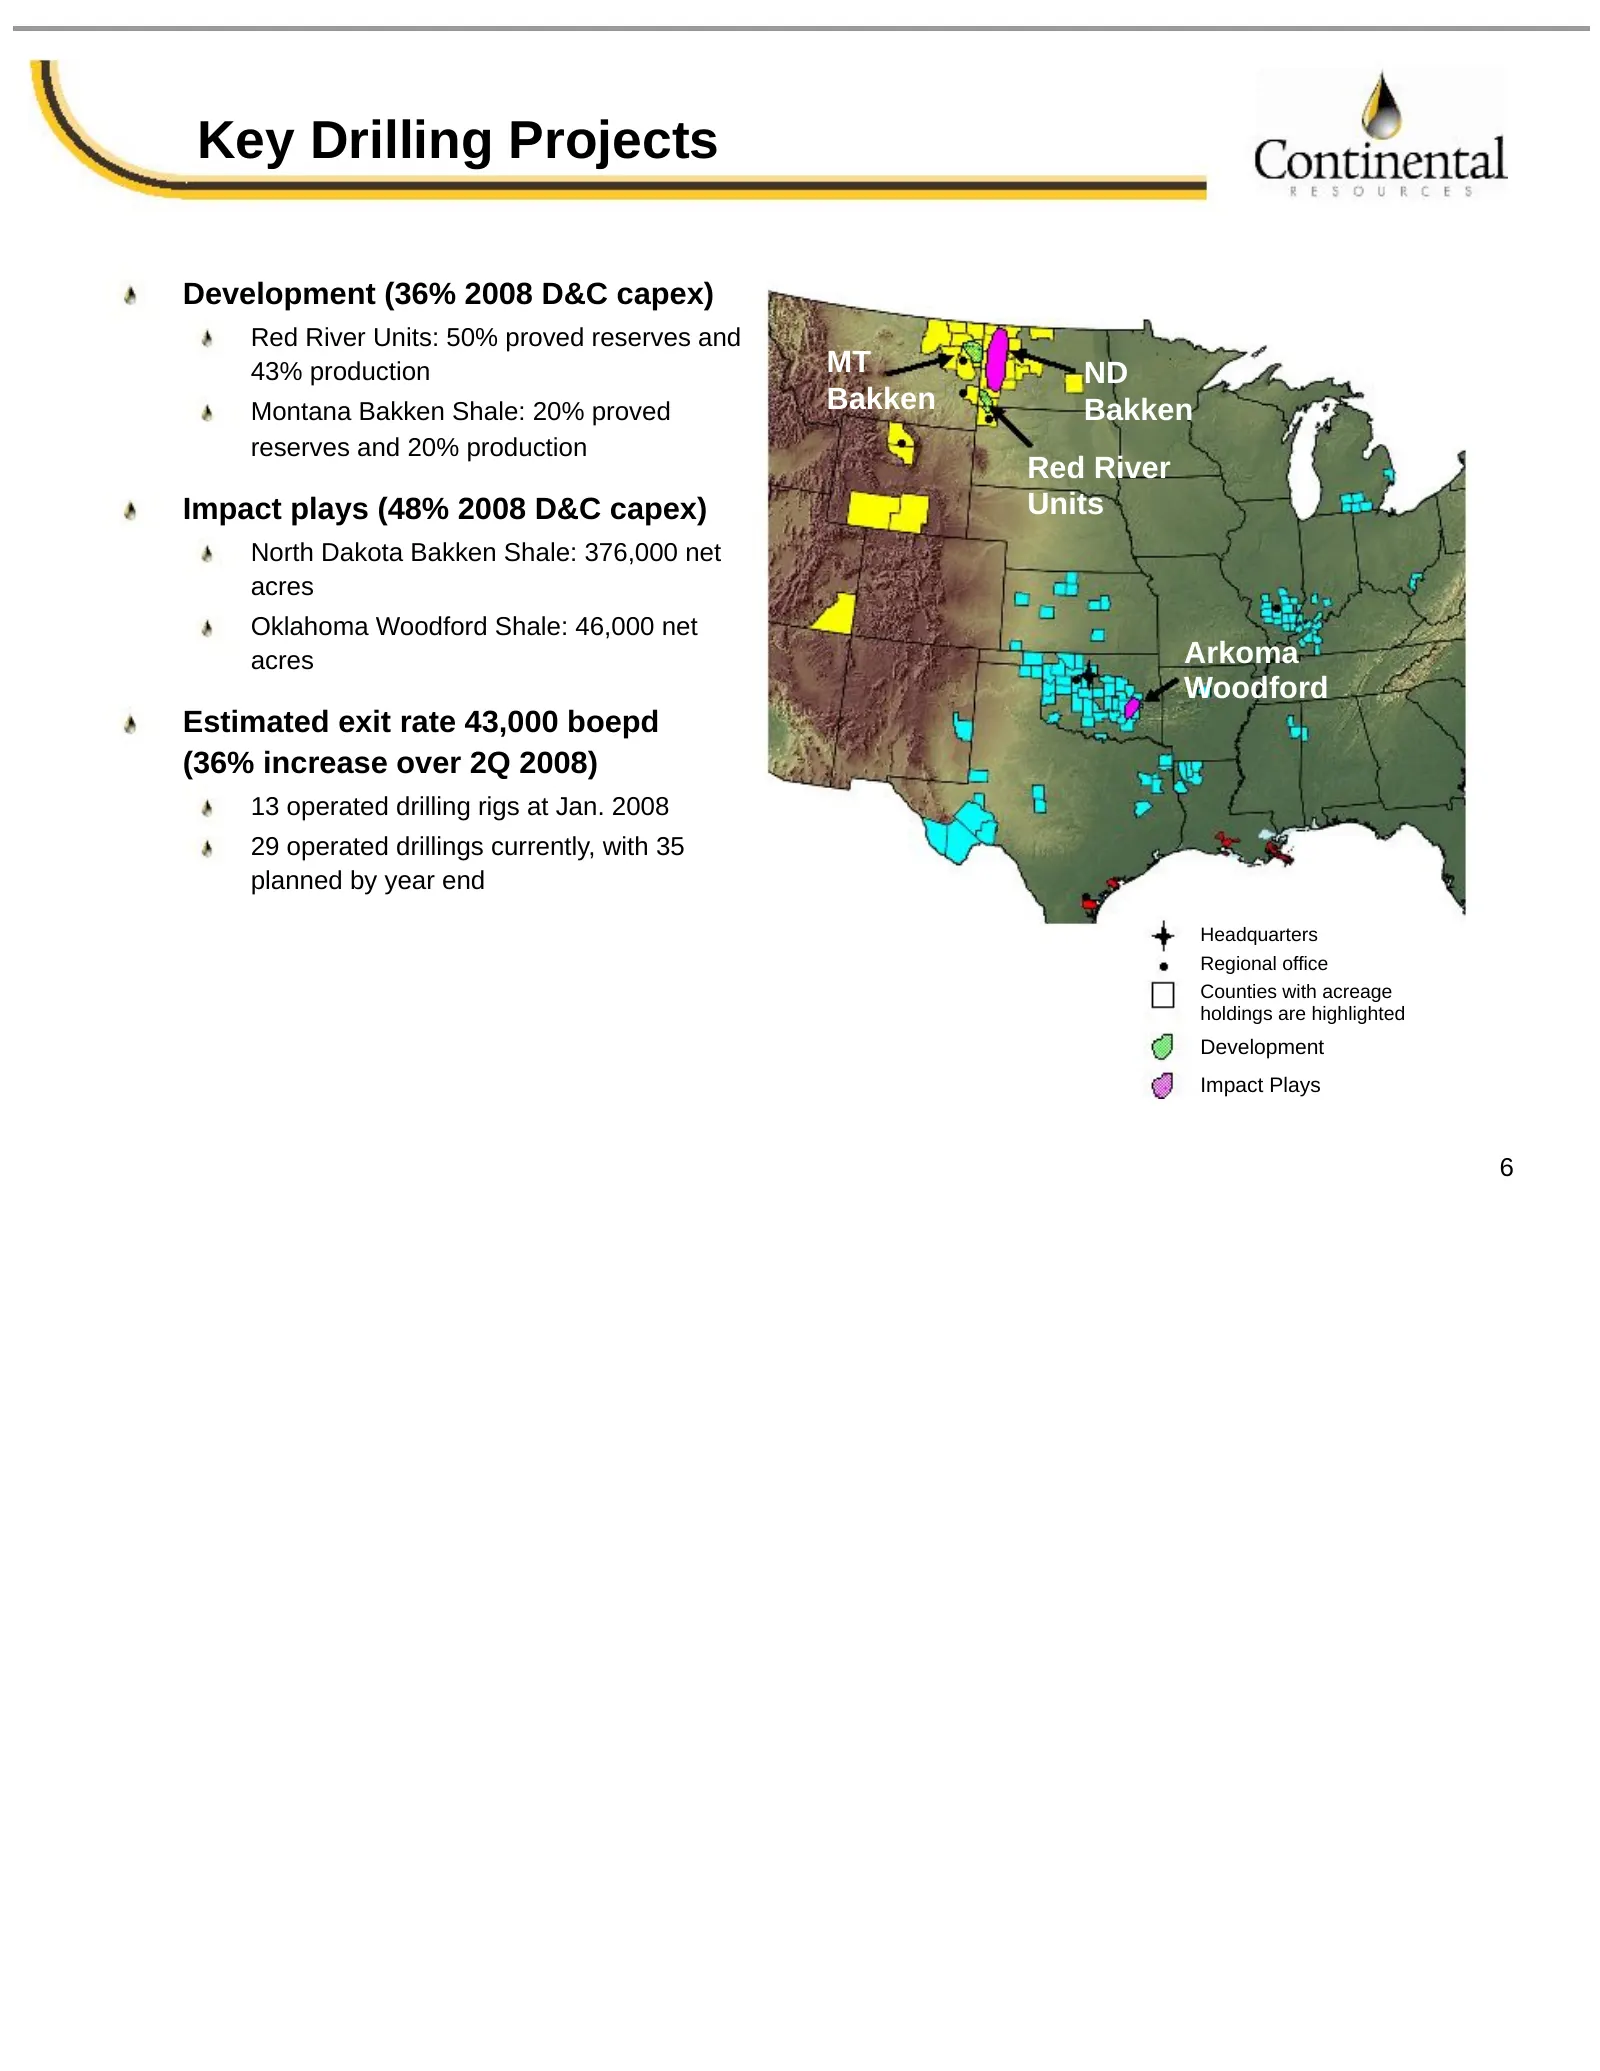
Key Drilling Projects Development (36% 2008 D&C capex) Red River Units: 50% proved reserves and 43% production MT ND Montana Bakken Shale: 20% proved Bakken Bakken reserves and 20% production Red River Impact plays (48% 2008 D&C capex) Units North Dakota Bakken Shale: 376,000 net acres Oklahoma Wood
Slide 8: CLR Unconventional Resource Plays
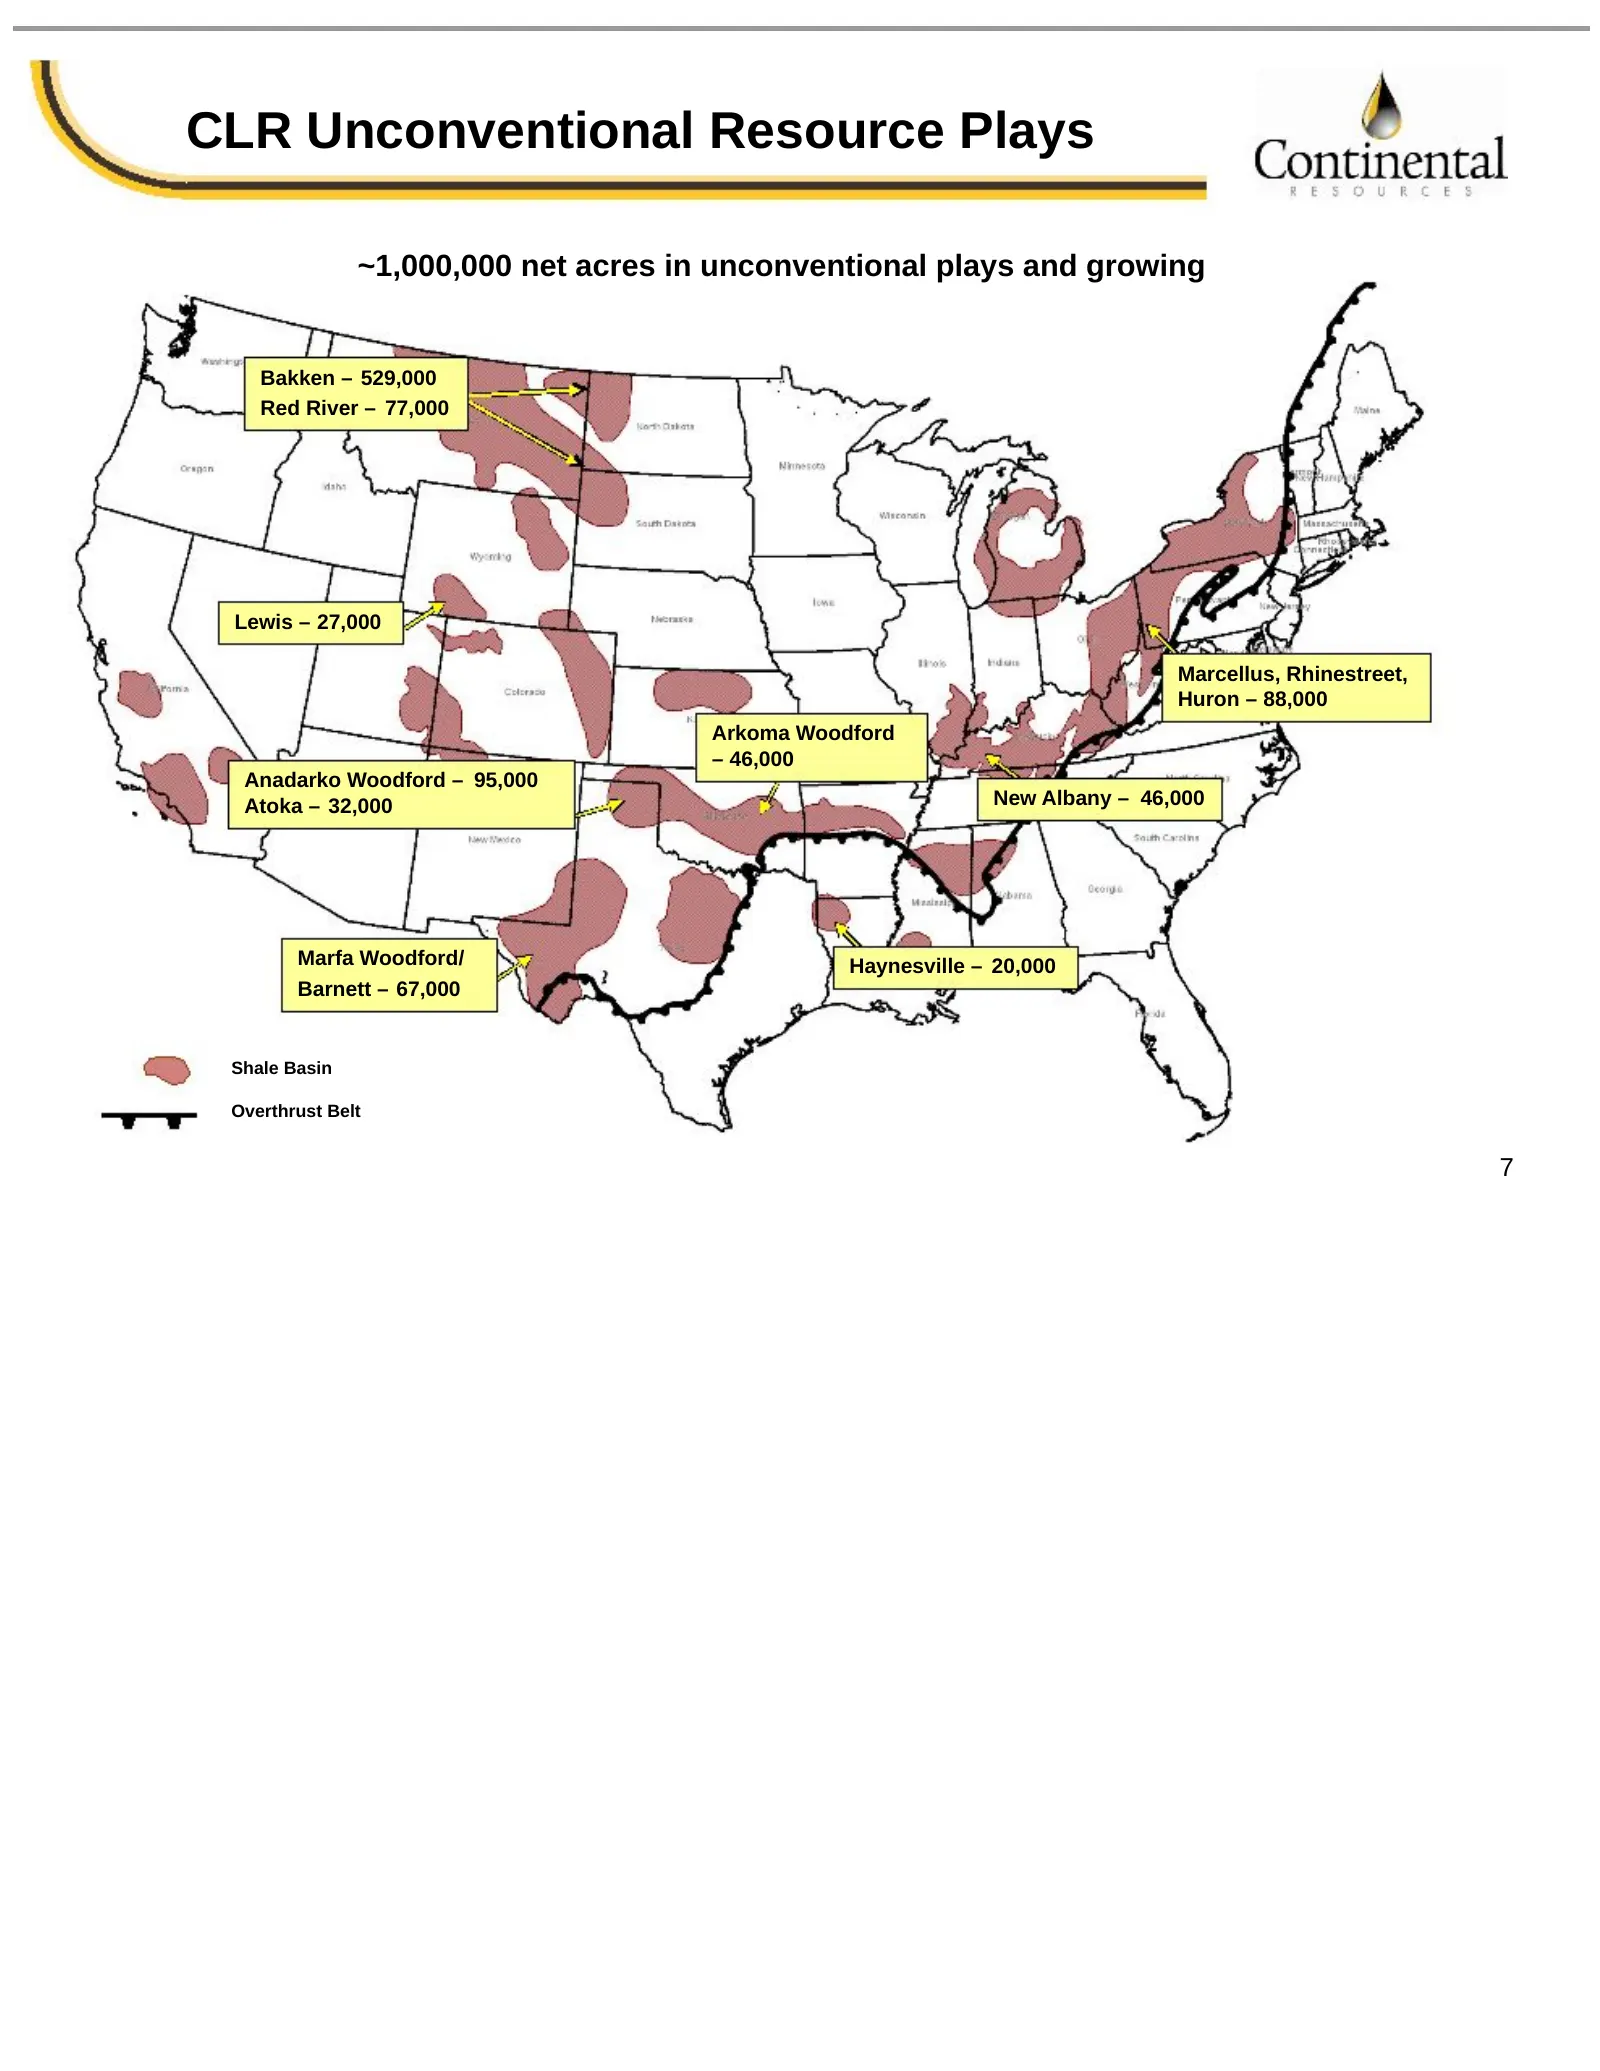
CLR Unconventional Resource Plays ~1,000,000 net acres in unconventional plays and growing Bakken – 529,000 Red River – 77,000 Lewis – 27,000 Marcellus, Rhinestreet, Huron – 88,000 Arkoma Woodford – 46,000 Anadarko Woodford – 95,000 Atoka – 32,000 New Albany – 46,000 Marfa Woodford/ Haynesville – 20
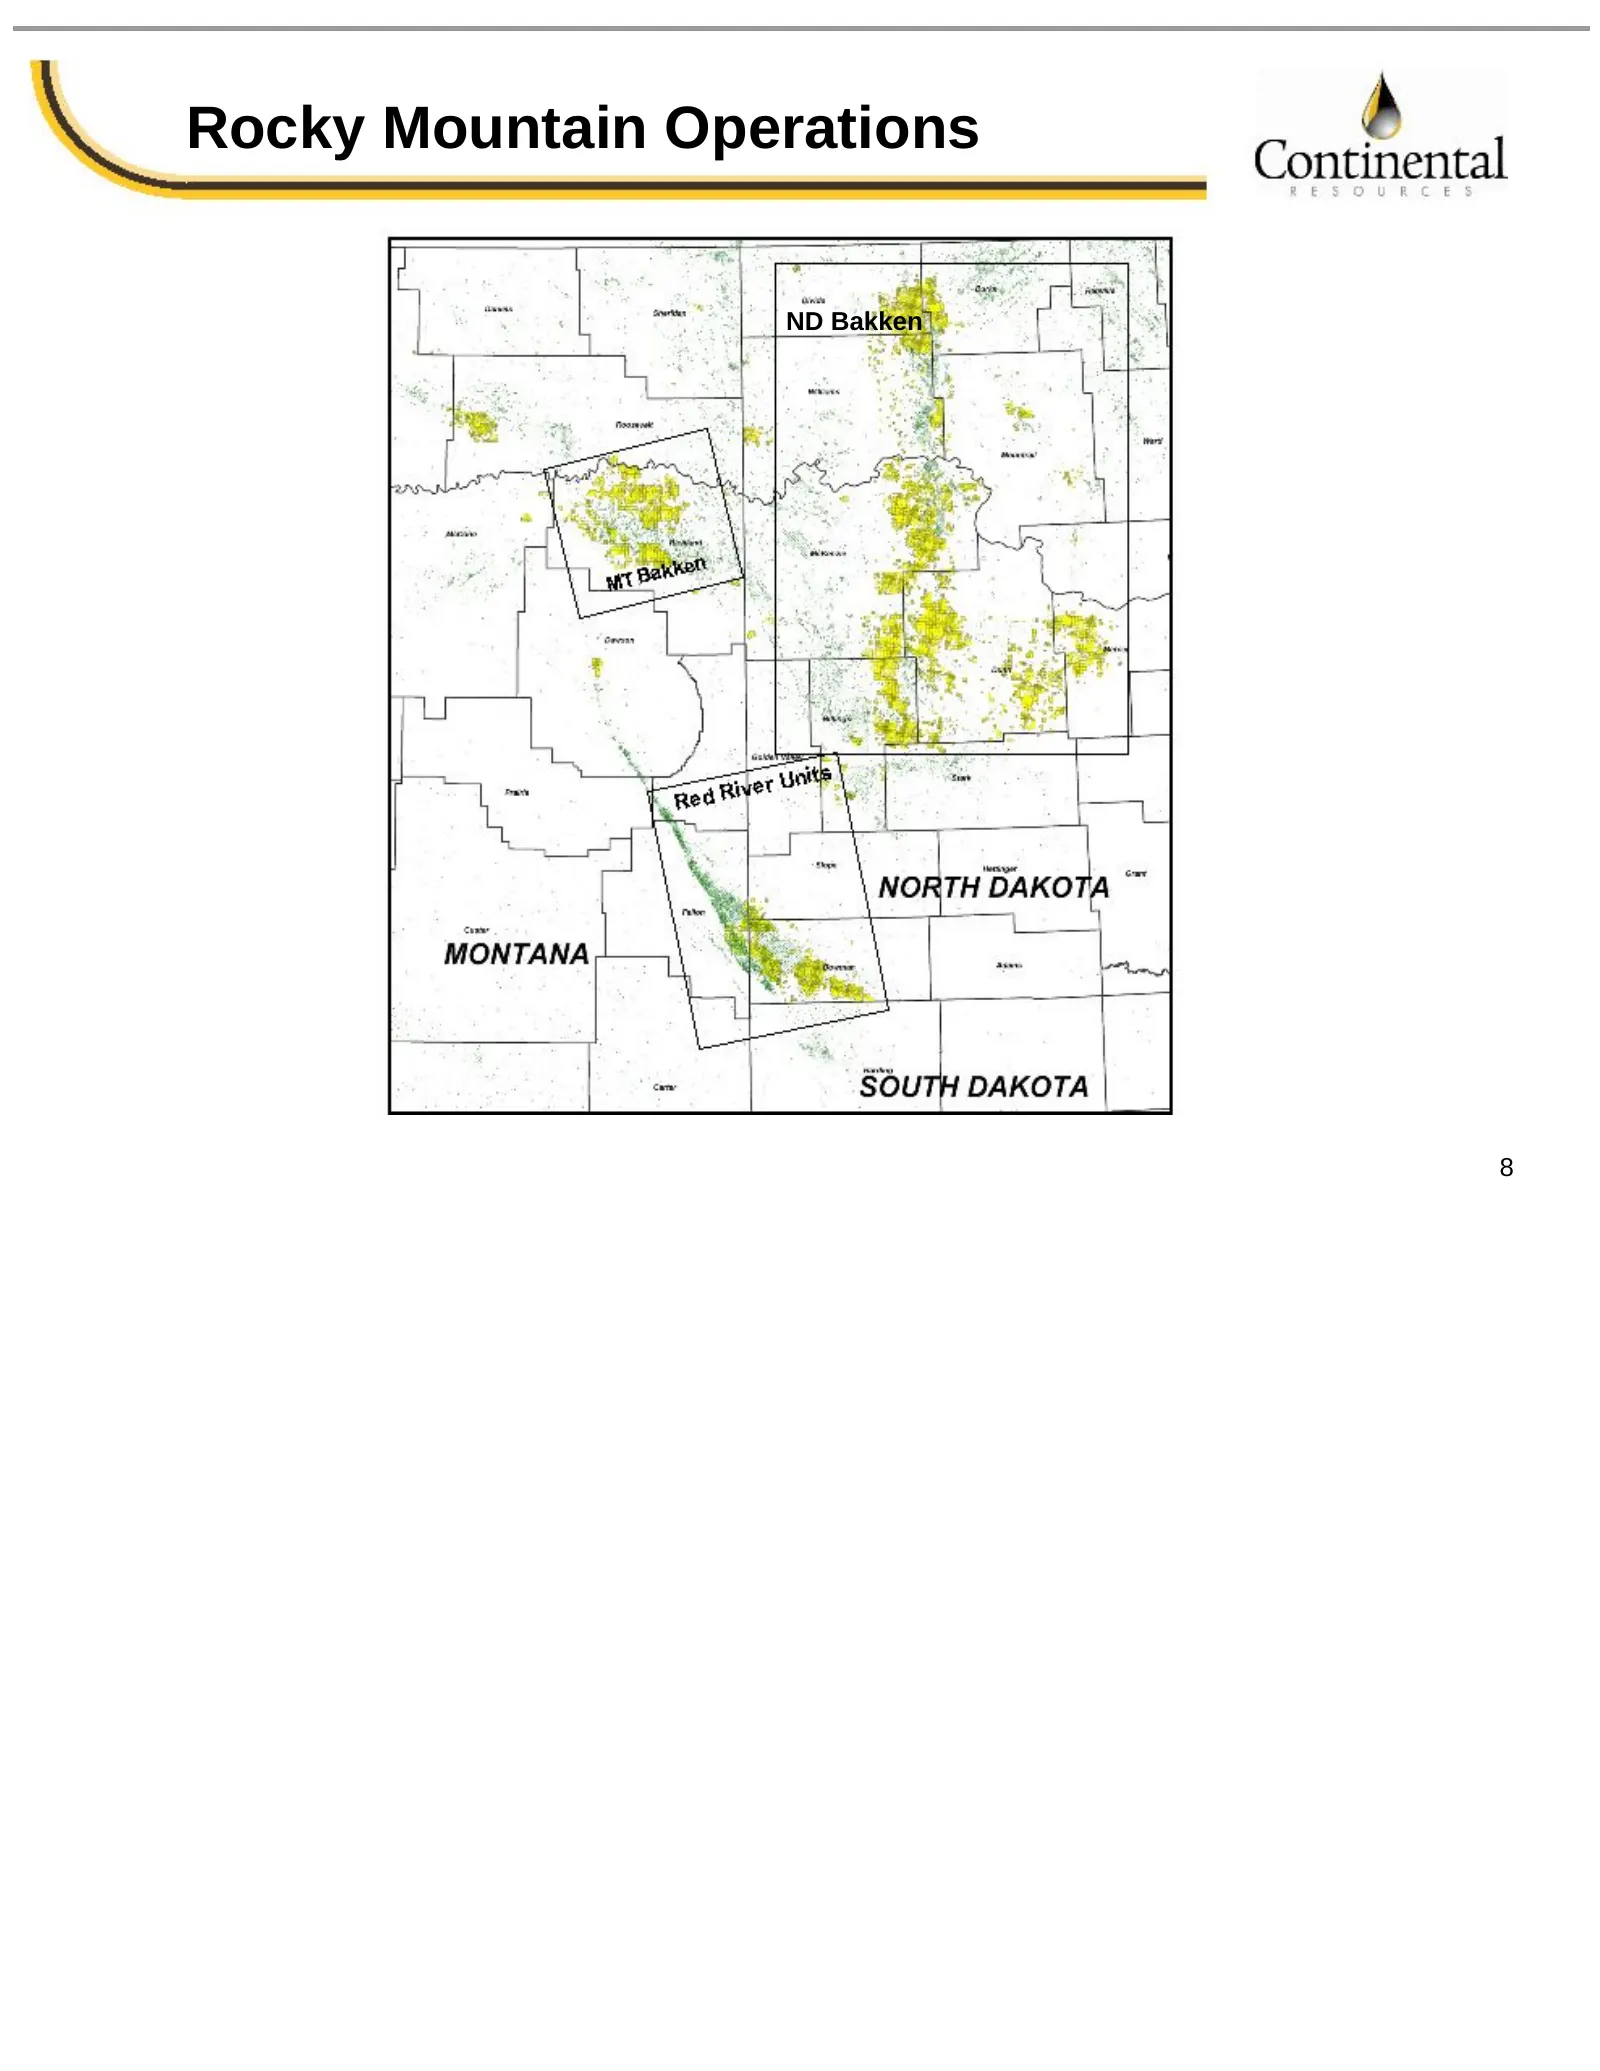
Slide 9: Rocky Mountain Operations
Rocky Mountain Operations ND Bakken 8
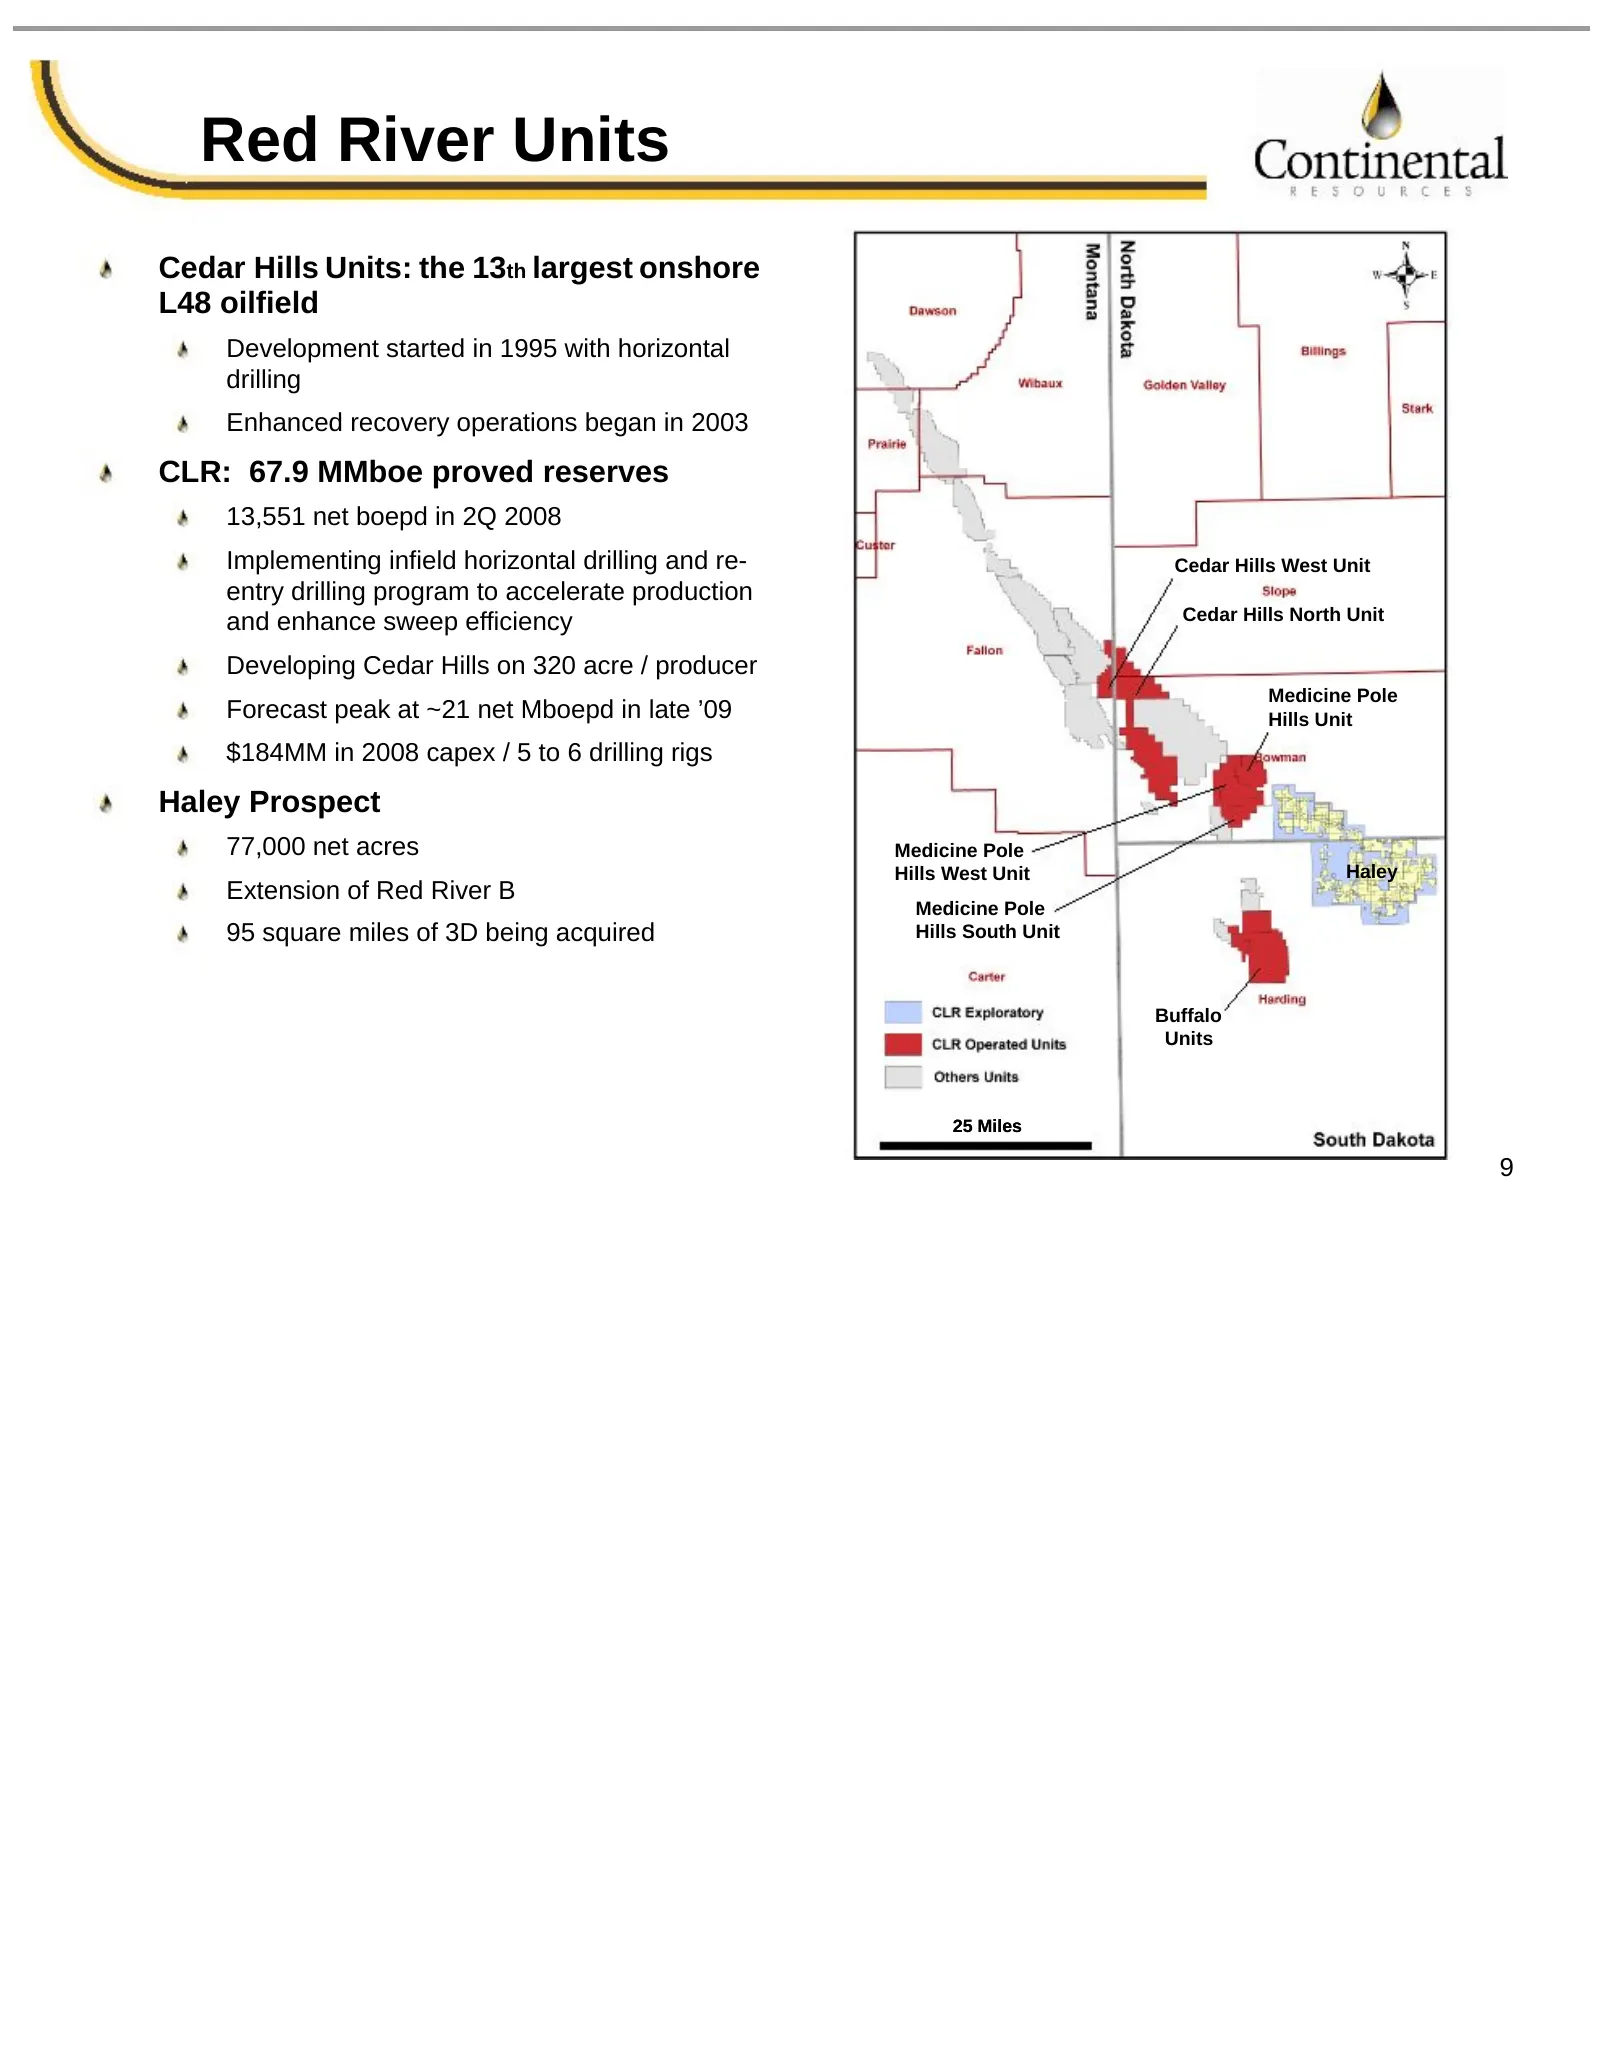
Slide 10: Red River Units
Red River Units Cedar Hills Units: the 13th largest onshore L48 oilfield Development started in 1995 with horizontal drilling Enhanced recovery operations began in 2003 CLR: 67.9 MMboe proved reserves 13,551 net boepd in 2Q 2008 Implementing infield horizontal drilling and re- Cedar Hills West Unit
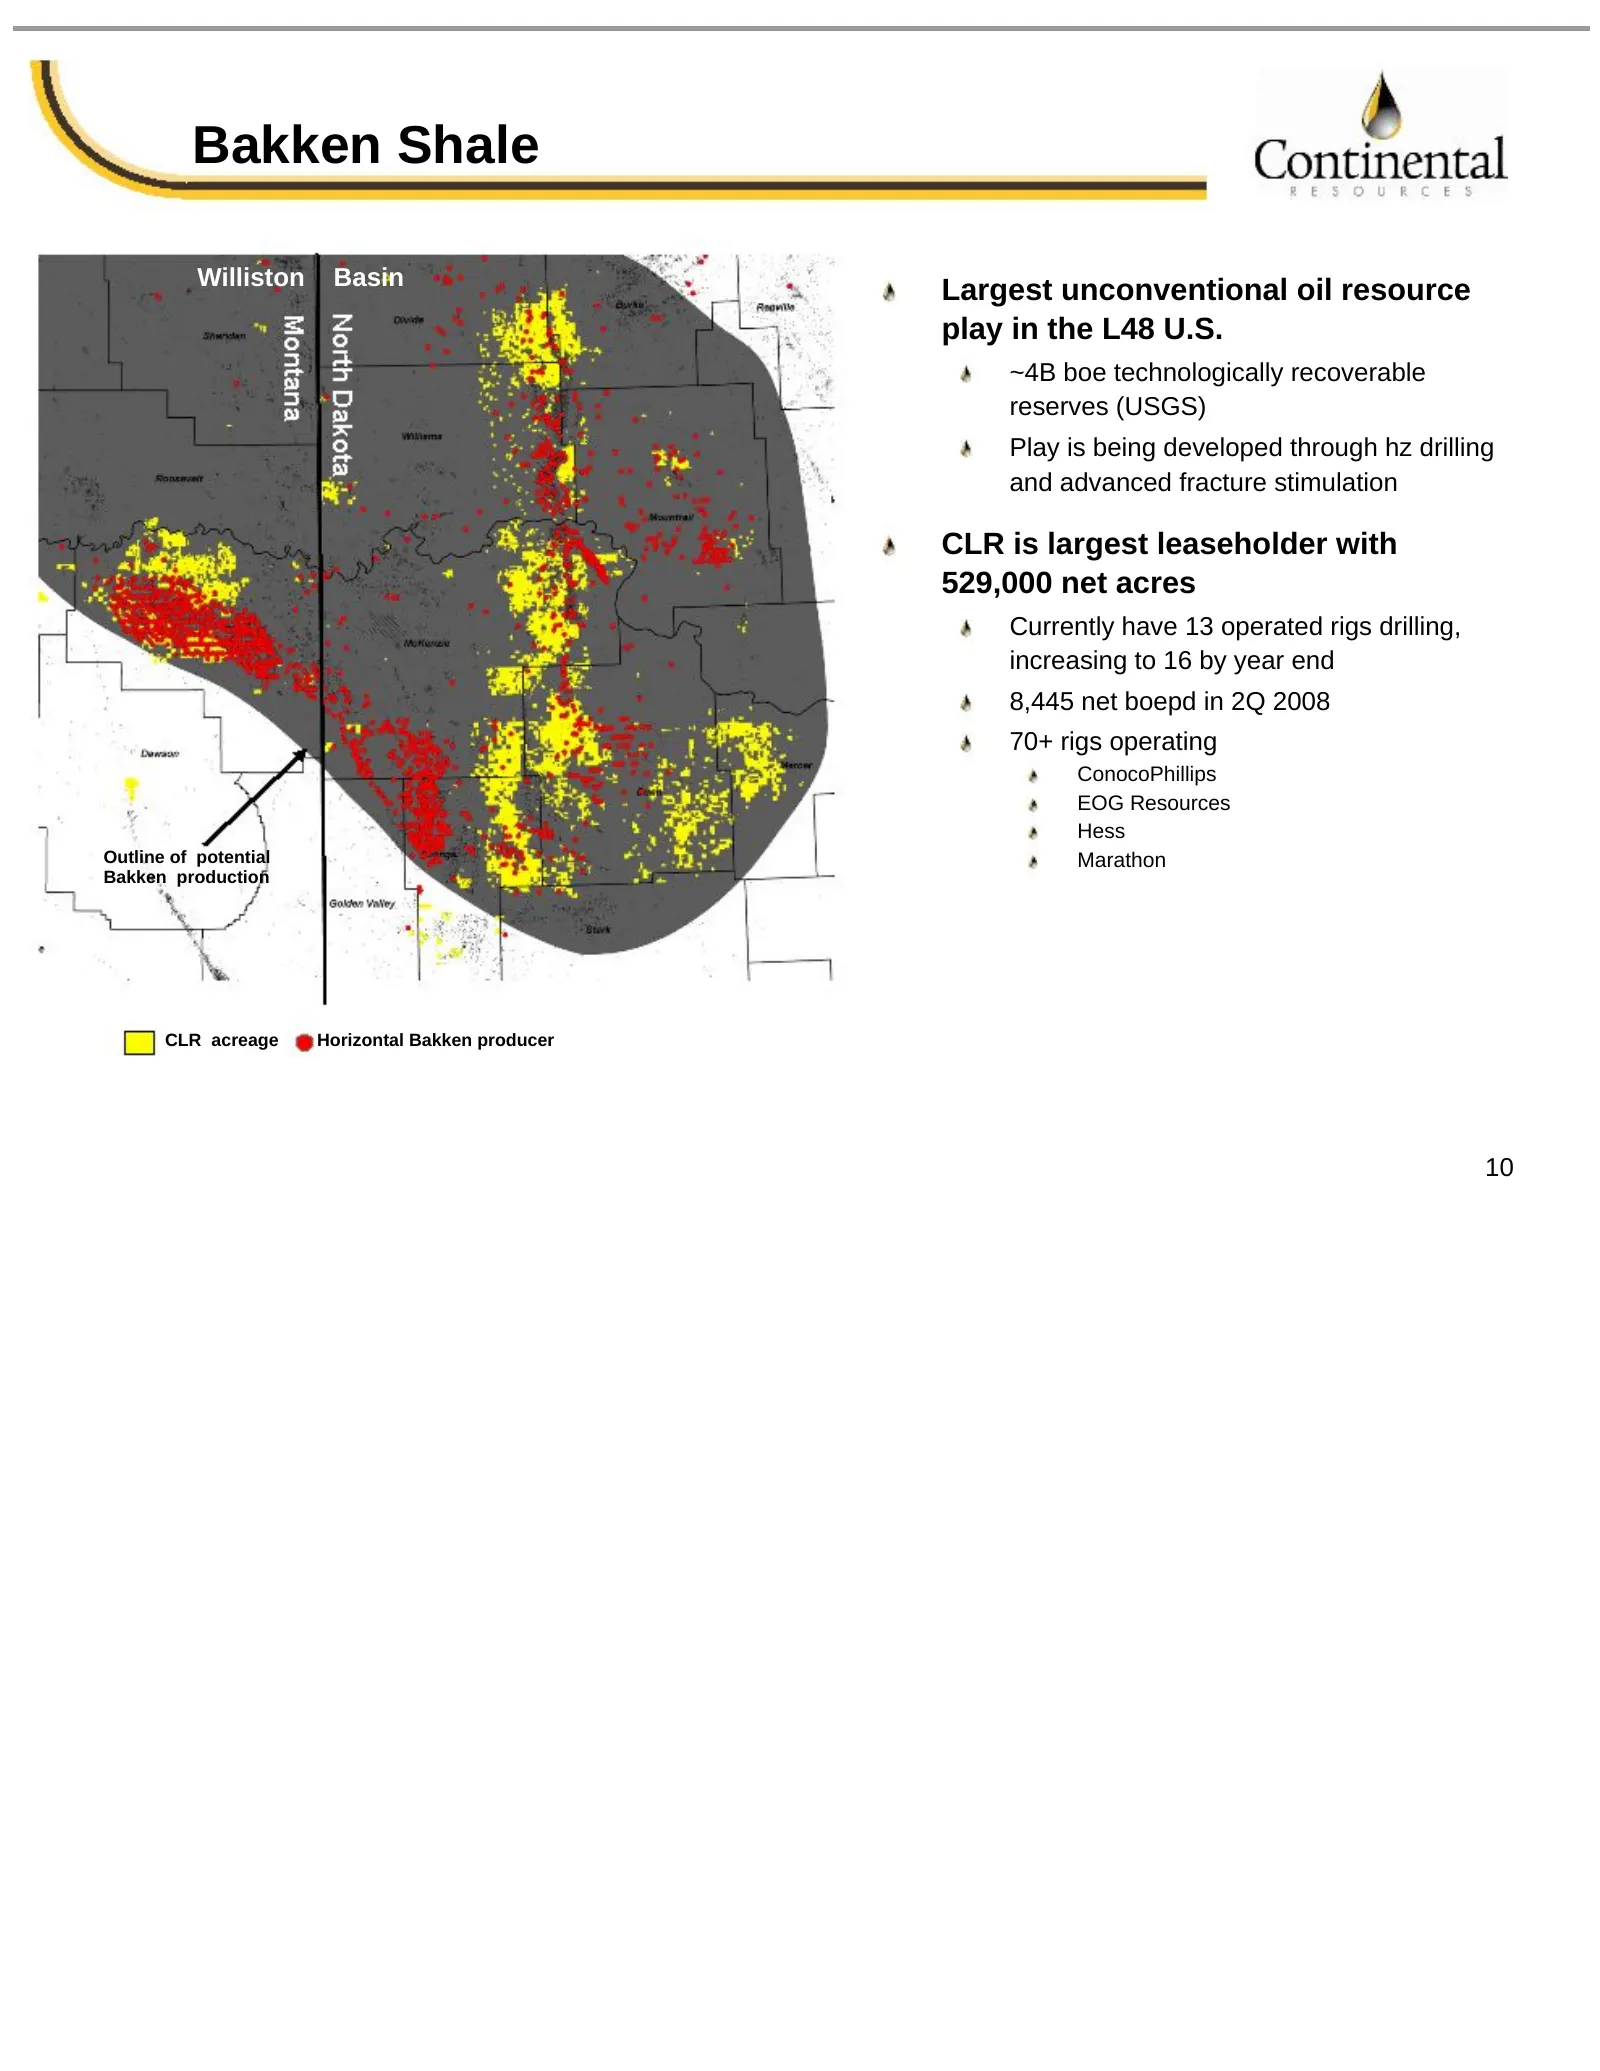
Slide 11: Bakken Shale
Bakken Shale Williston Basin Largest unconventional oil resource play in the L48 U.S. ~4B boe technologically recoverable reserves (USGS) Play is being developed through hz drilling and advanced fracture stimulation CLR is largest leaseholder with 529,000 net acres Currently have 13 operated rigs dr
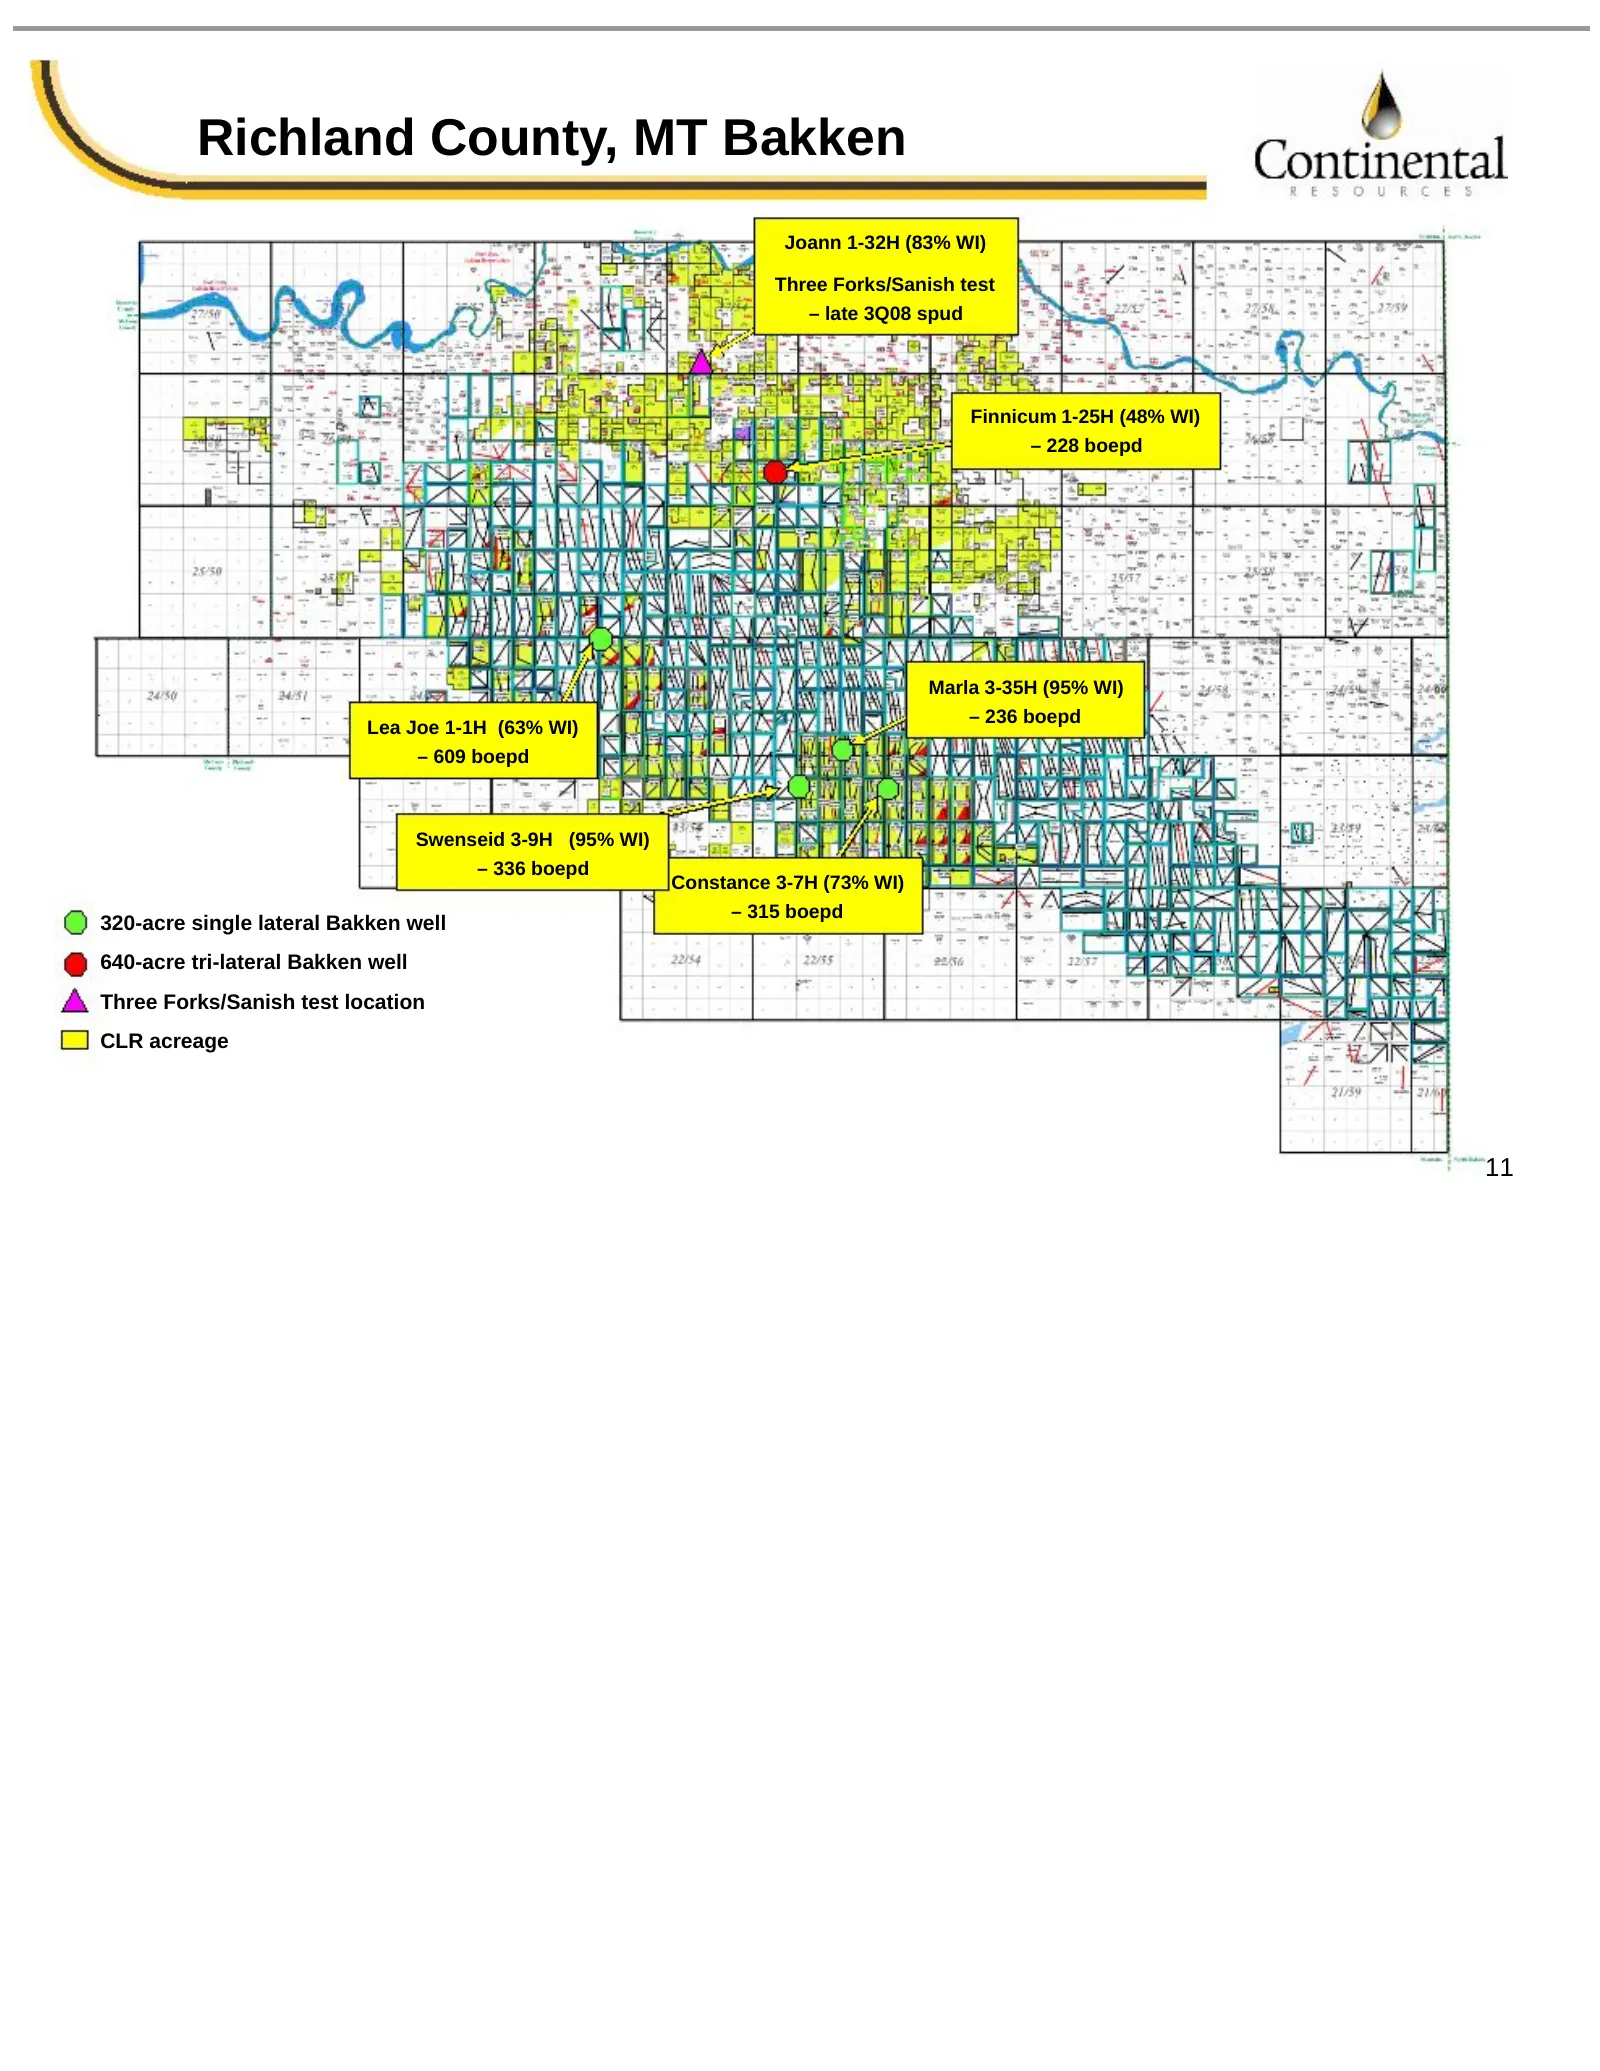
Slide 12: Richland County, MT Bakken
Richland County, MT Bakken Joann 1-32H (83% WI) Three Forks/Sanish test – late 3Q08 spud Finnicum 1-25H (48% WI) – 228 boepd Marla 3-35H (95% WI) – 236 boepd Lea Joe 1-1H (63% WI) – 609 boepd Swenseid 3-9H (95% WI) – 336 boepd Constance 3-7H (73% WI) – 315 boepd 320-acre single lateral Bakken well 6
Slide 13: Bakken Shale Geologic Cross-Section
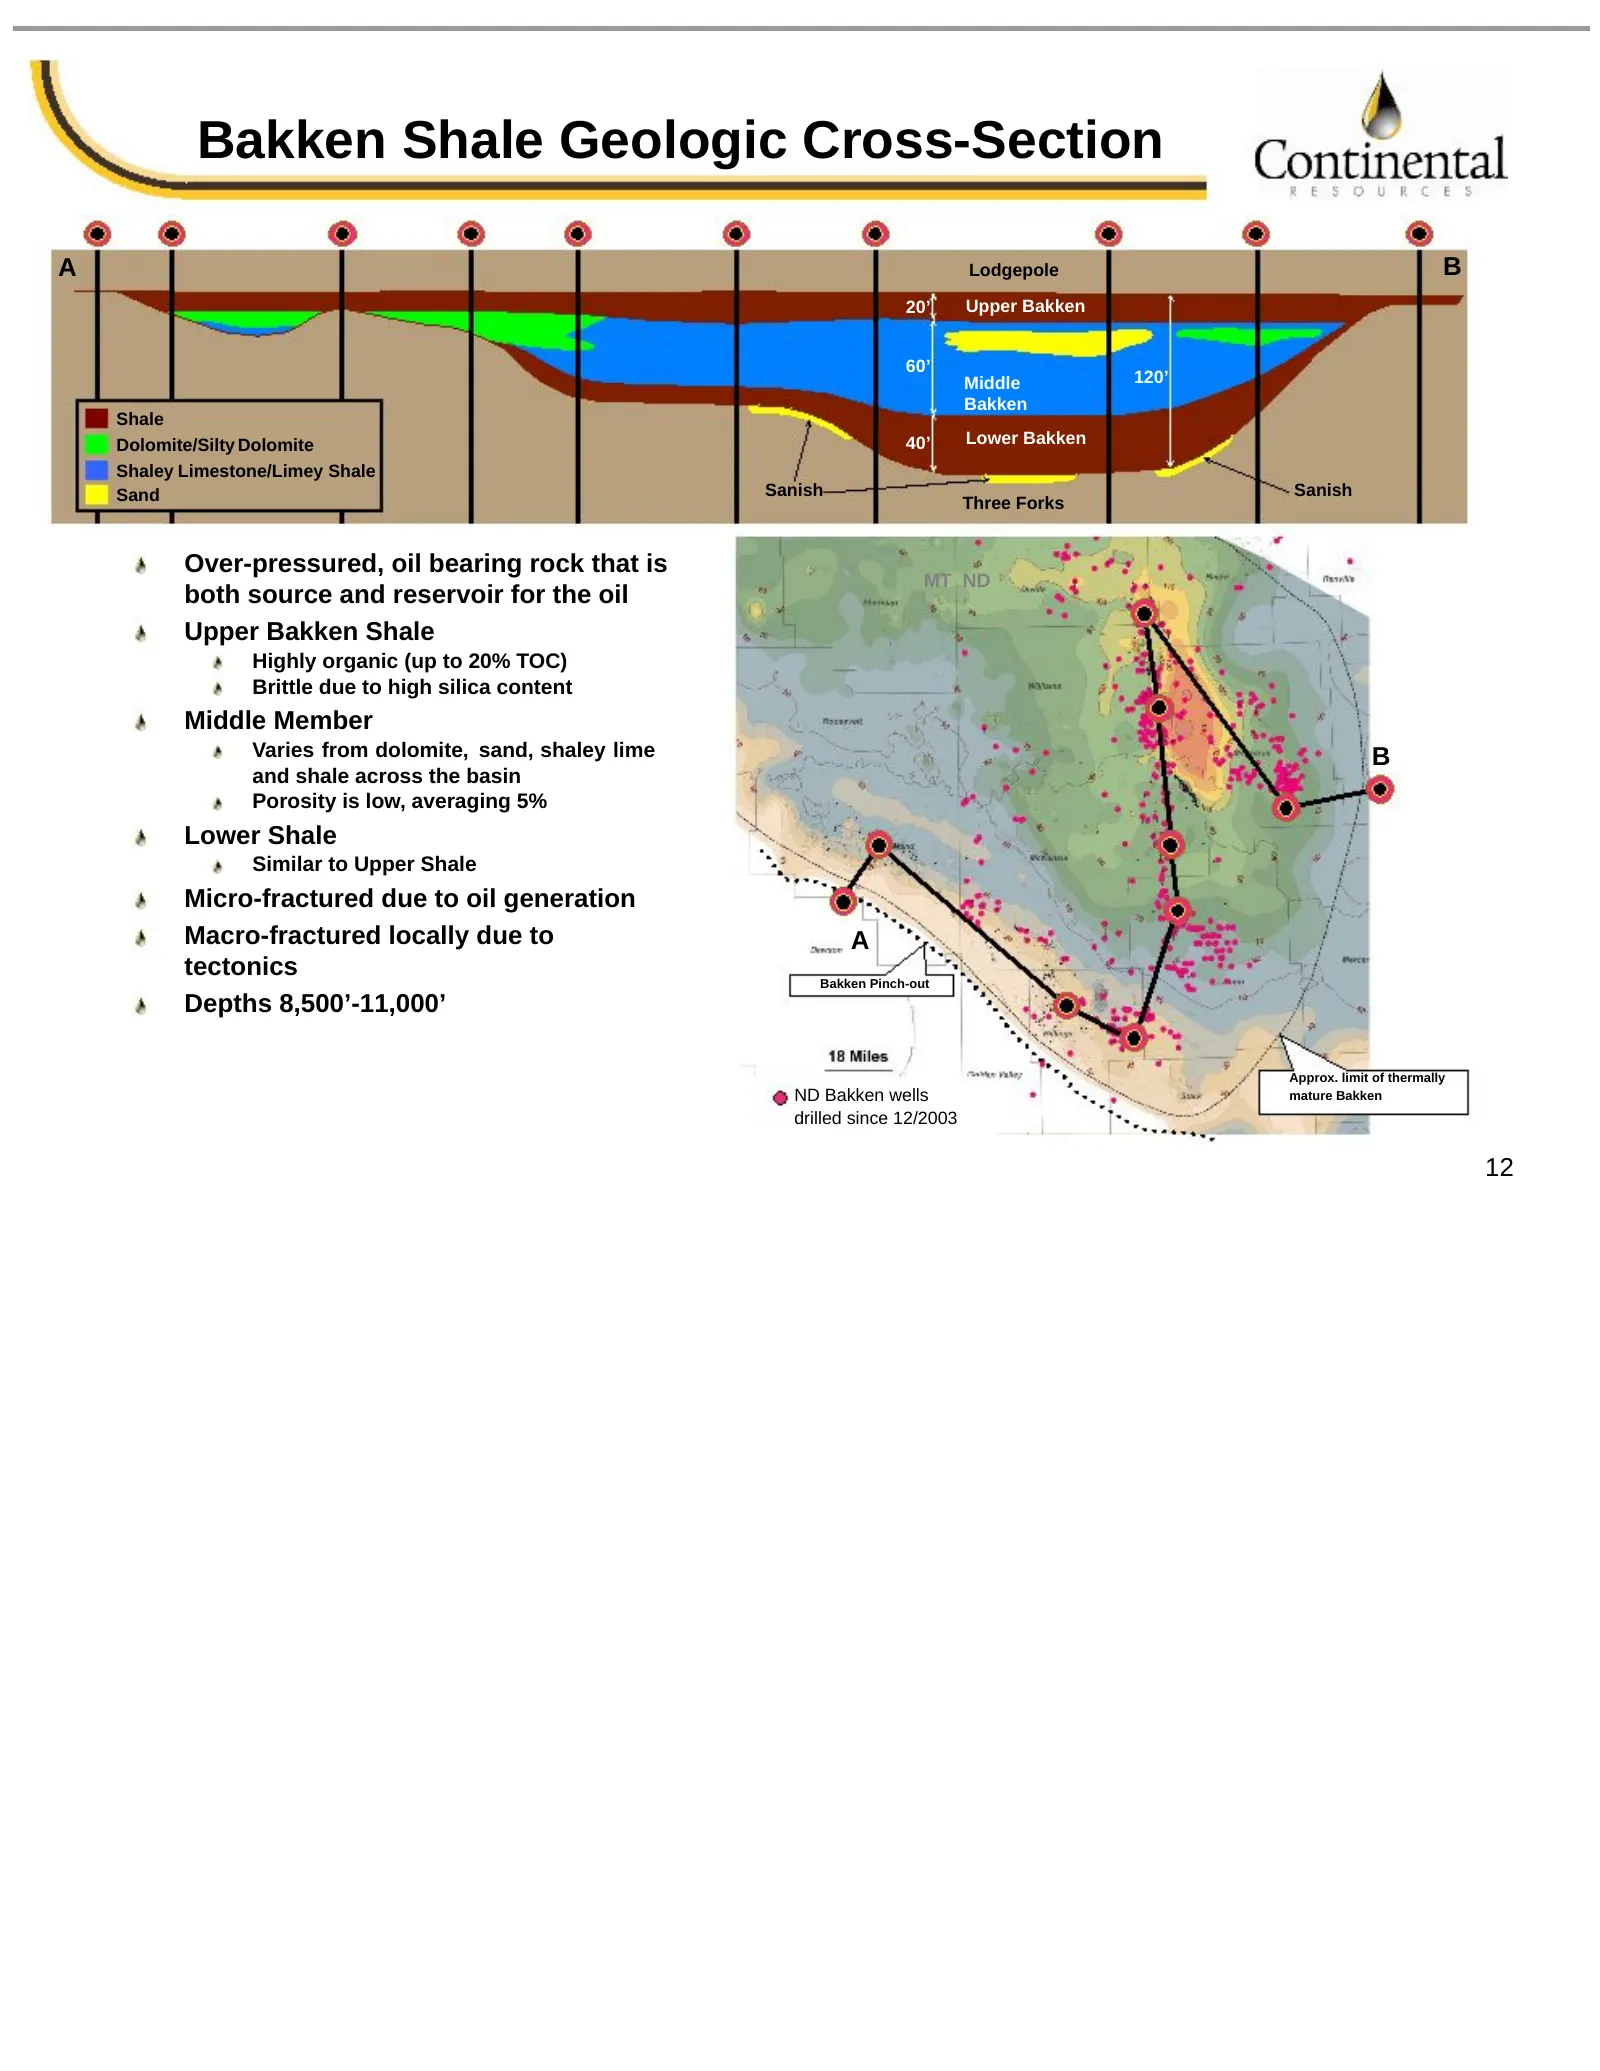
Bakken Shale Geologic Cross-Section A Lodgepole B 20’ Upper Bakken 60’ Middle 120’ Bakken Shale Dolomite/Silty Dolomite 40’ Lower Bakken Shaley Limestone/Limey Shale Sand Sanish Sanish Three Forks Over-pressured, oil bearing rock that is MT ND both source and reservoir for the oil Upper Bakken Shale
Slide 14: ND Bakken – Recent Activity
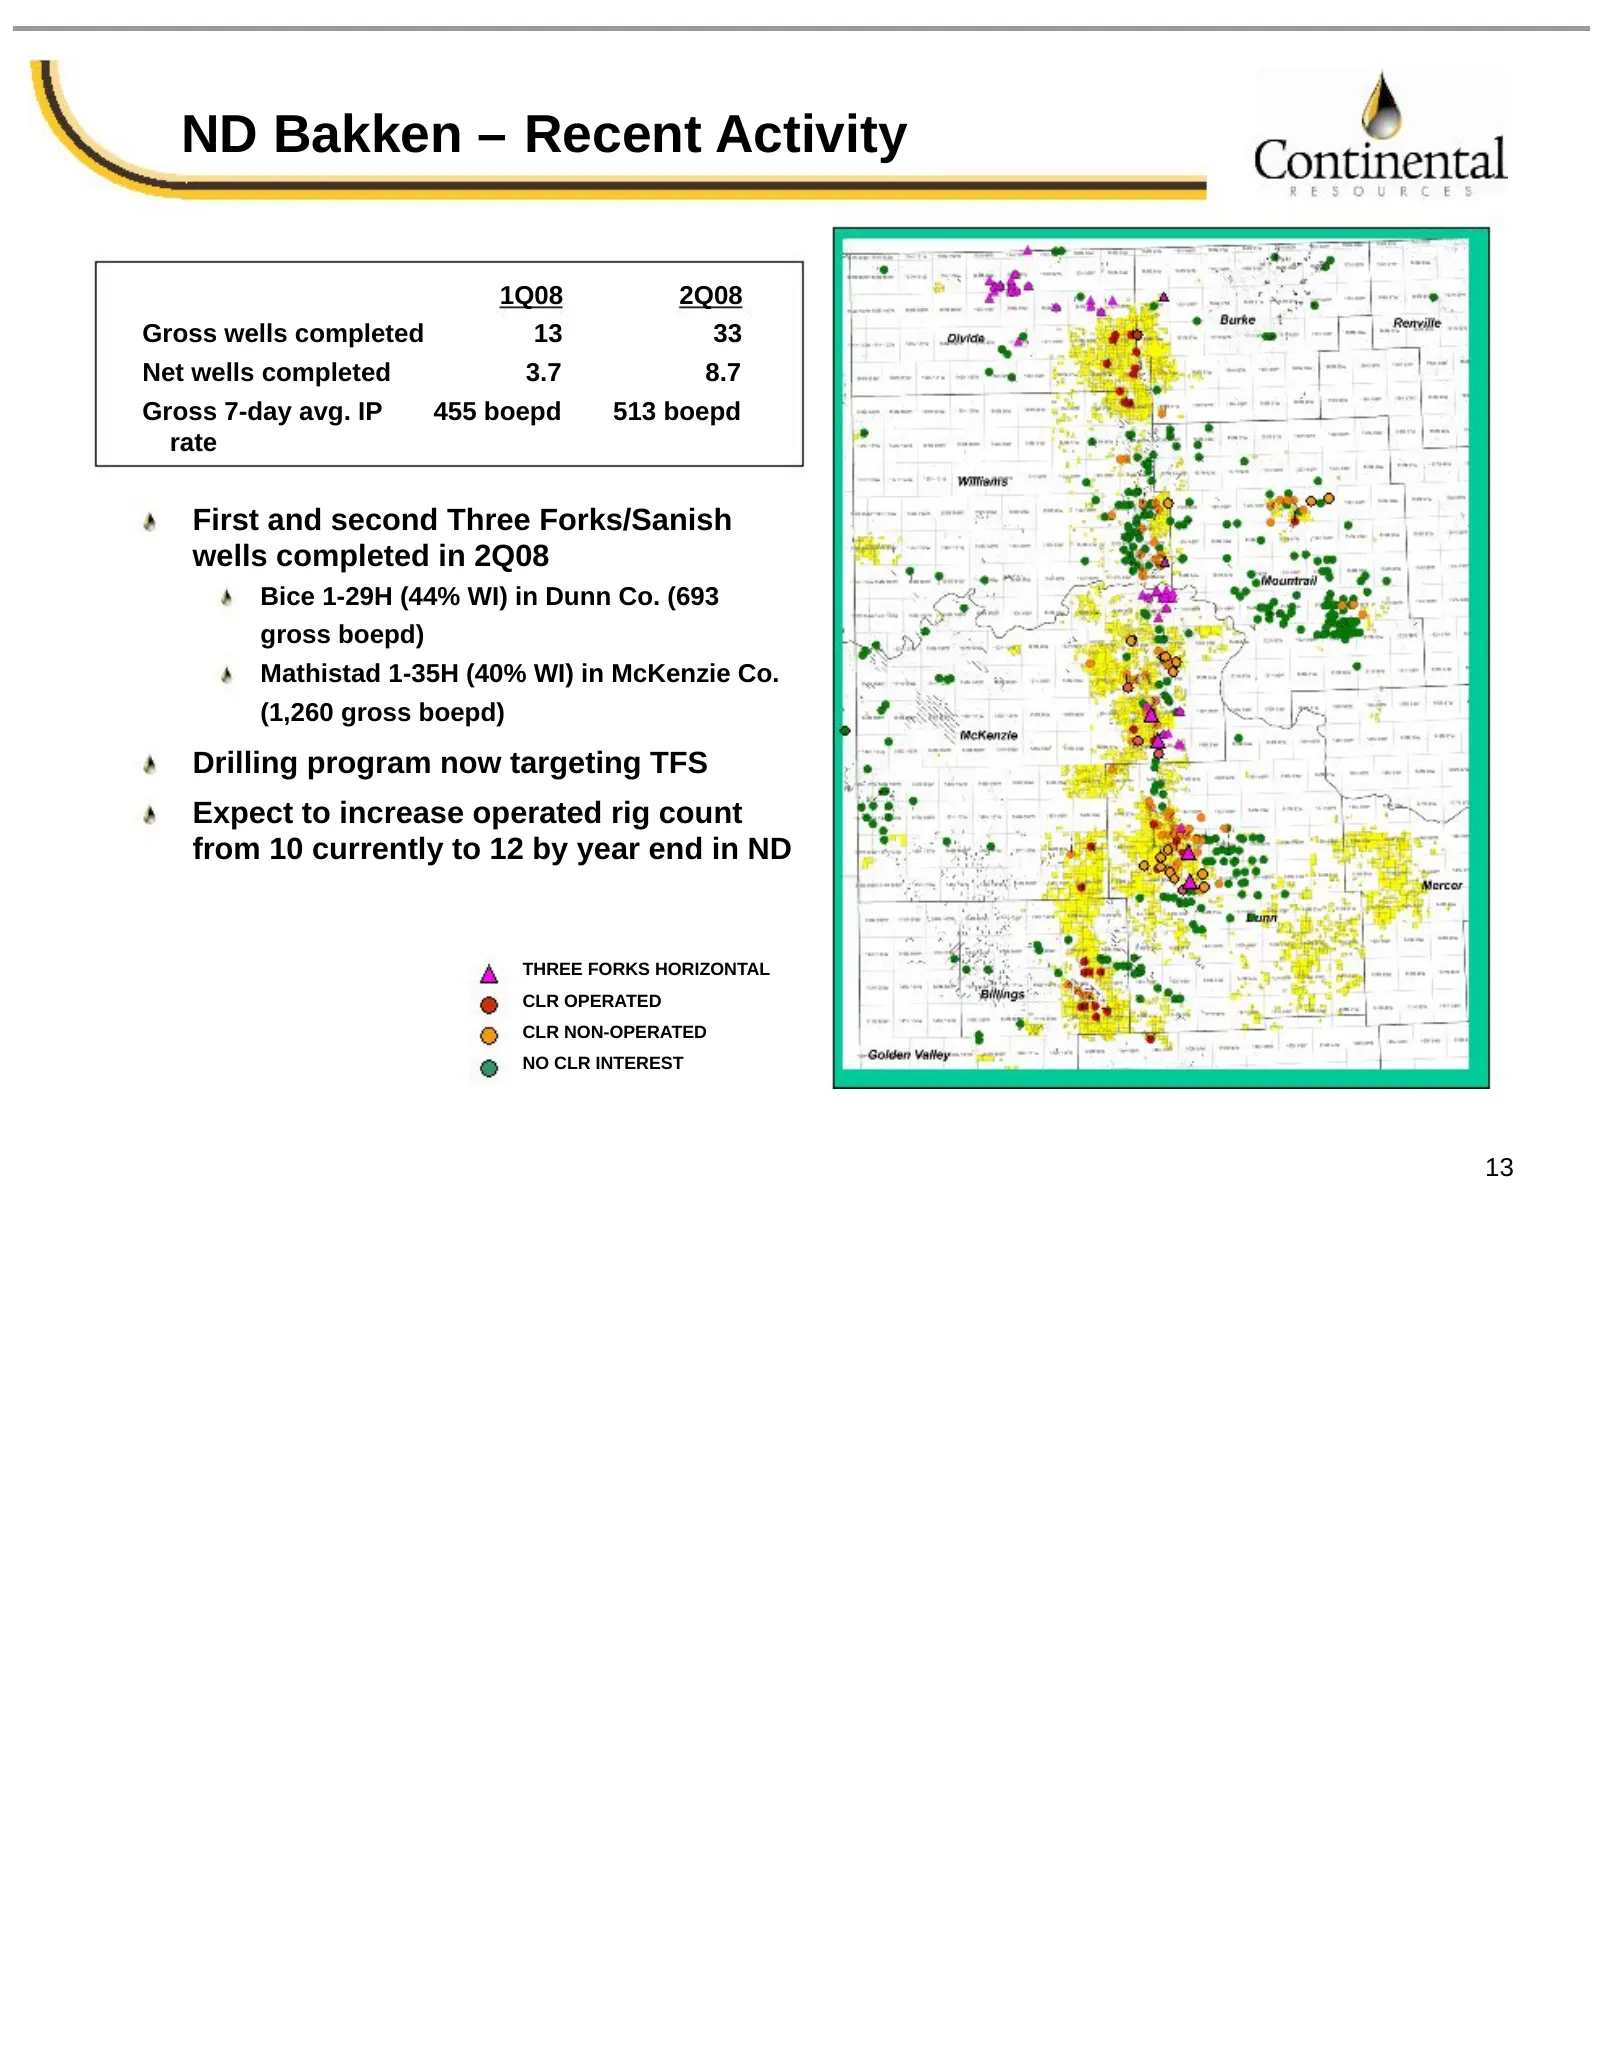
ND Bakken – Recent Activity 1Q08 2Q08 Gross wells completed 13 33 Net wells completed 3.7 8.7 Gross 7-day avg. IP 455 boepd 513 boepd rate First and second Three Forks/Sanish wells completed in 2Q08 Bice 1-29H (44% WI) in Dunn Co. (693 gross boepd) Mathistad 1-35H (40% WI) in McKenzie Co. (1,260 gro
Slide 15: Interval -- Three Forks/Sanish to Top of Middle Bakken
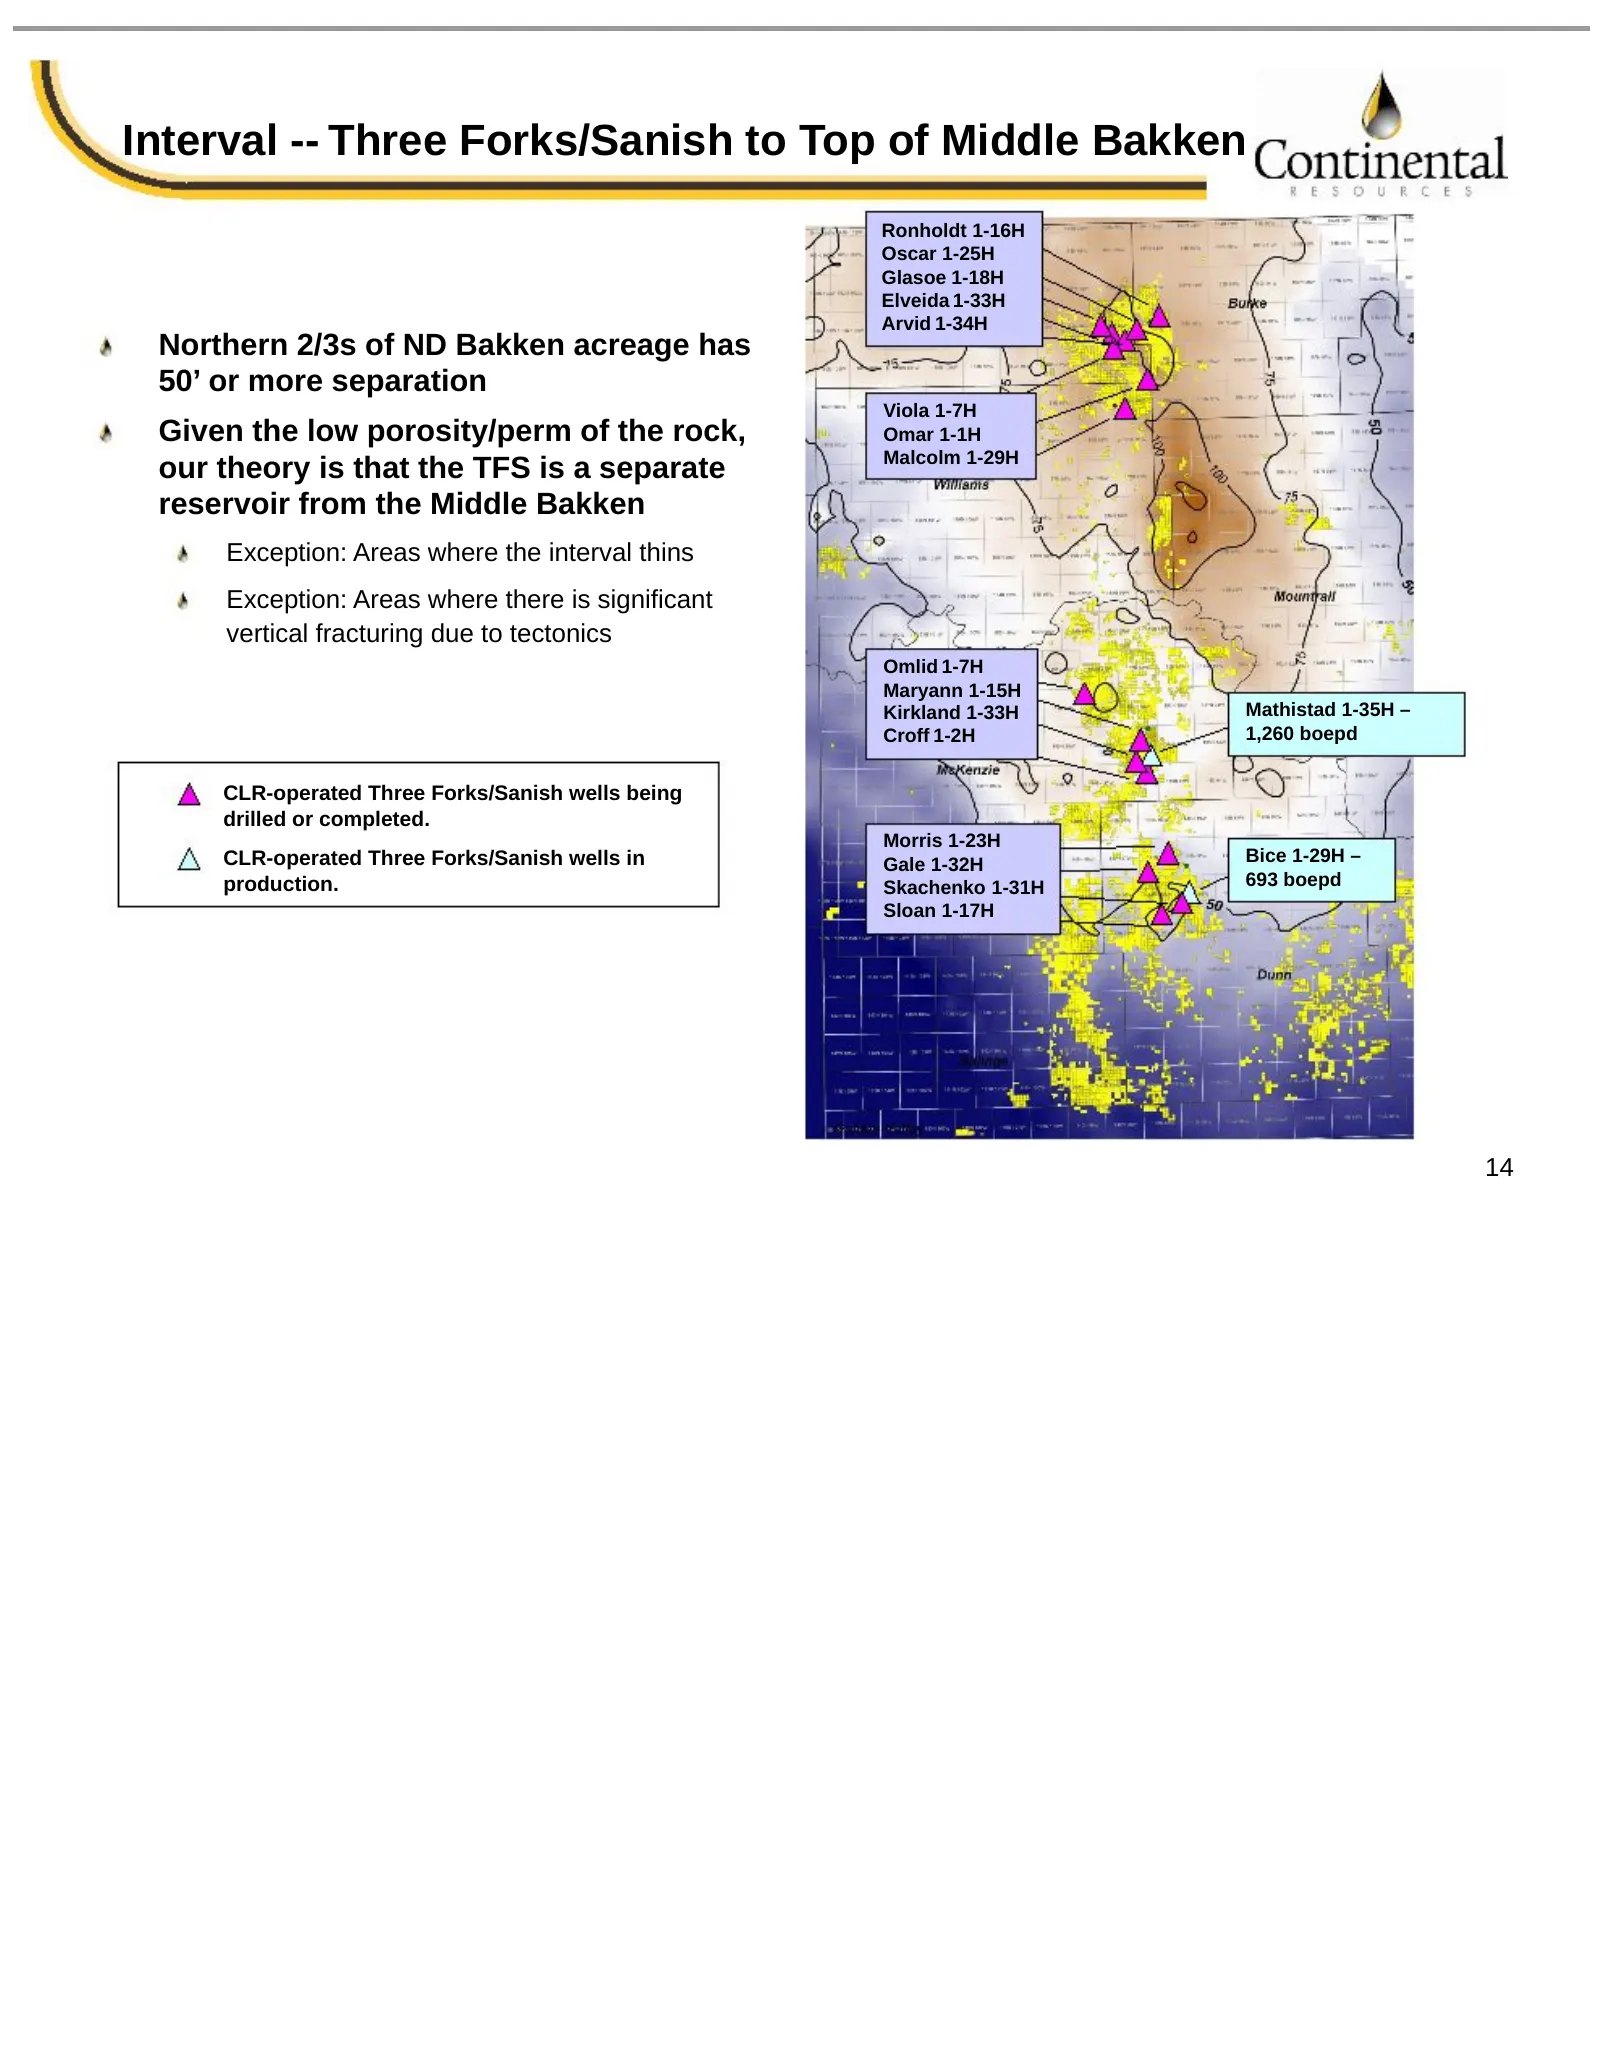
Interval -- Three Forks/Sanish to Top of Middle Bakken Ronholdt 1-16H Oscar 1-25H Glasoe 1-18H Elveida 1-33H Arvid 1-34H Northern 2/3s of ND Bakken acreage has 50’ or more separation Viola 1-7H Given the low porosity/perm of the rock, Omar 1-1H Malcolm 1-29H our theory is that the TFS is a separate
Slide 16: Arkoma Woodford Shale
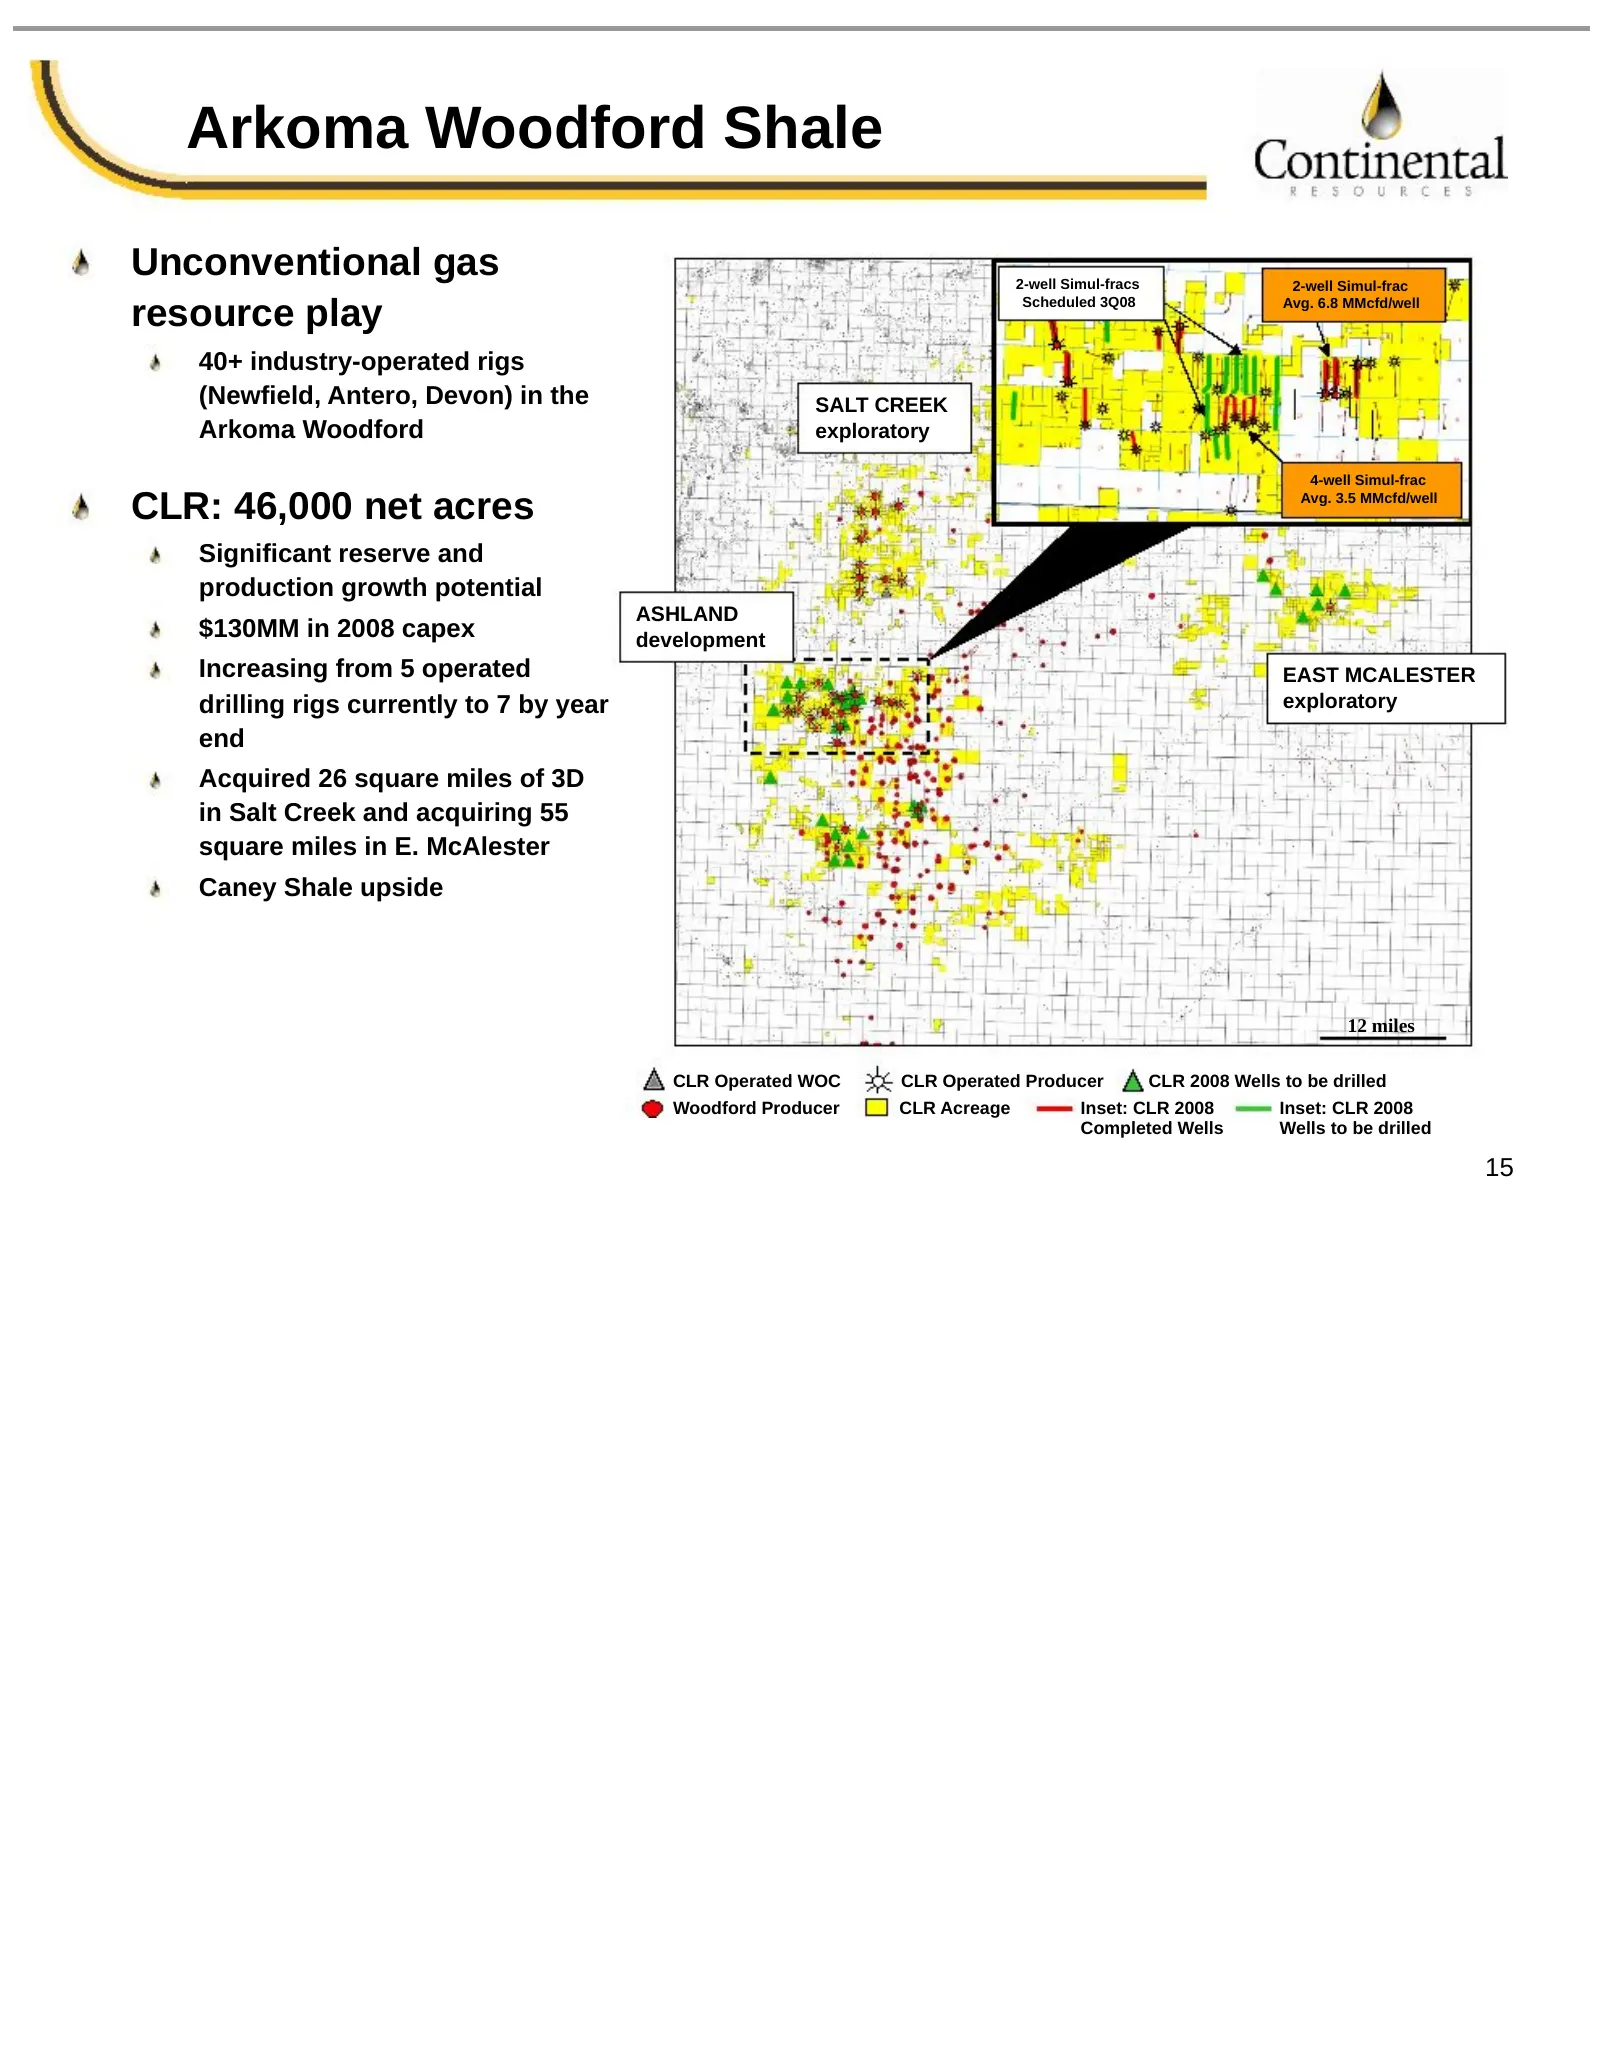
Arkoma Woodford Shale Unconventional gas 2-well Simul-fracs 2-well Simul-frac resource play Scheduled 3Q08 Avg. 6.8 MMcfd/well 40+ industry-operated rigs (Newfield, Antero, Devon) in the SALT CREEK Arkoma Woodford exploratory 4-well Simul-frac CLR: 46,000 net acres Avg. 3.5 MMcfd/well Significant re
Slide 17: ND Bakken & Arkoma Woodford
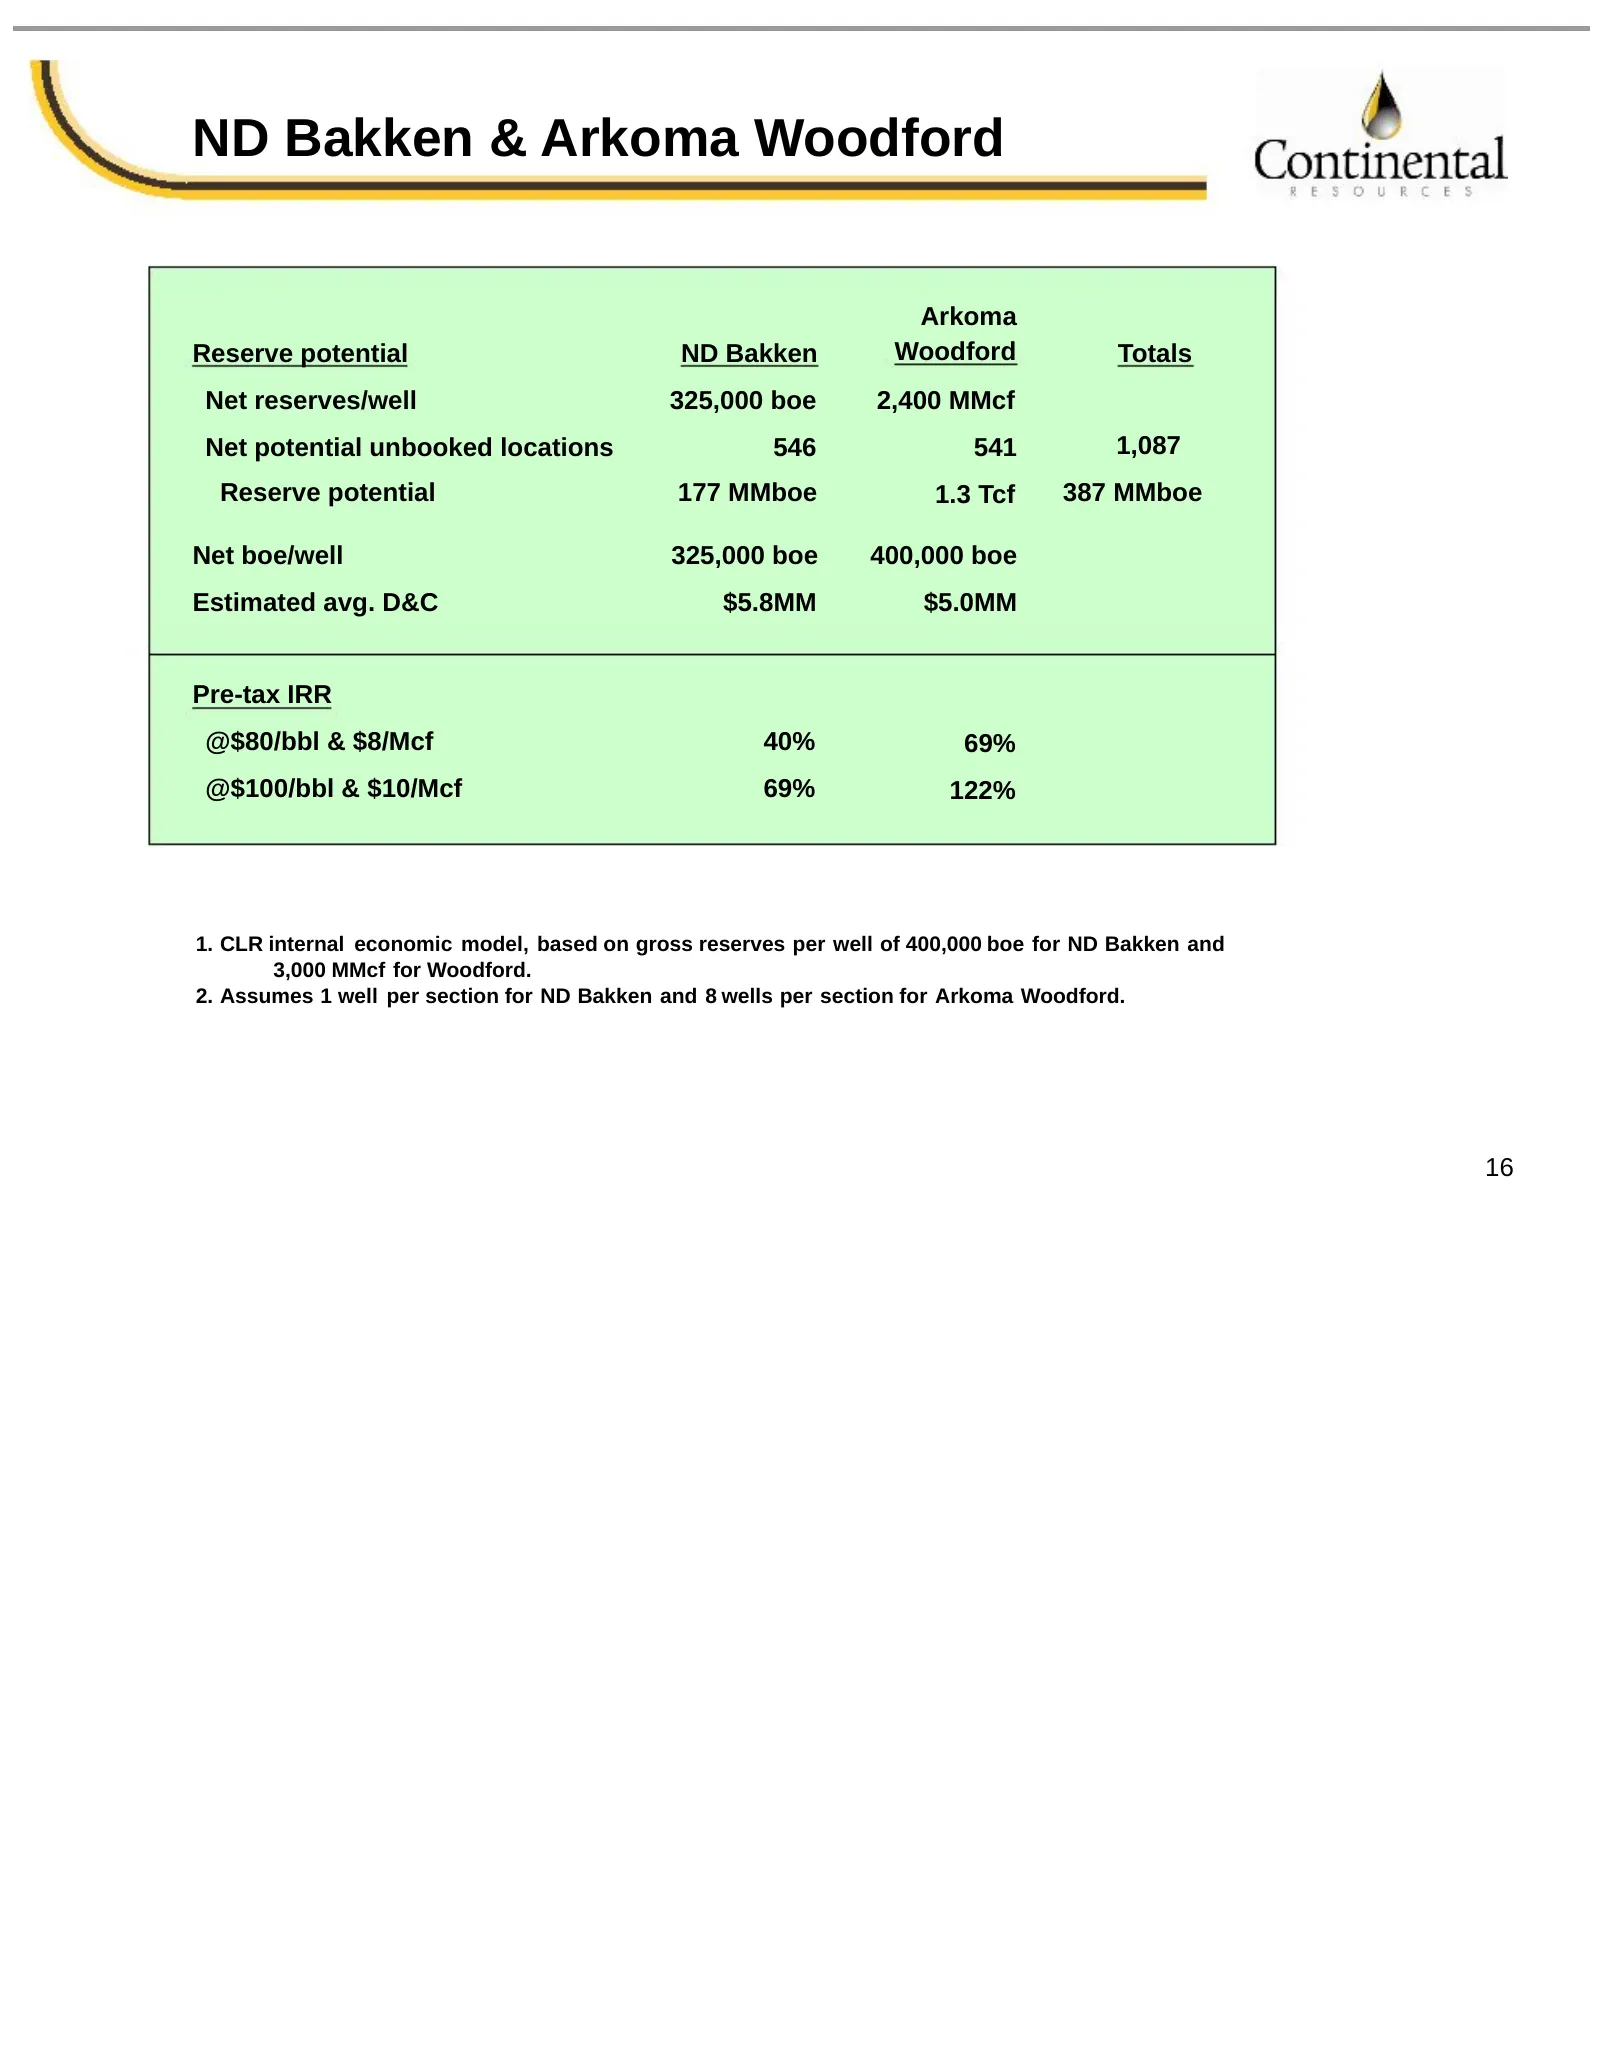
ND Bakken & Arkoma Woodford Arkoma Reserve potential ND Bakken Woodford Totals Net reserves/well 325,000 boe 2,400 MMcf Net potential unbooked locations 546 541 1,087 Reserve potential 177 MMboe 1.3 Tcf 387 MMboe Net boe/well 325,000 boe 400,000 boe Estimated avg. D&C $5.8MM $5.0MM Pre-tax IRR @$80/
Slide 18: Trenton/Black River – Hillsdale Co., MI
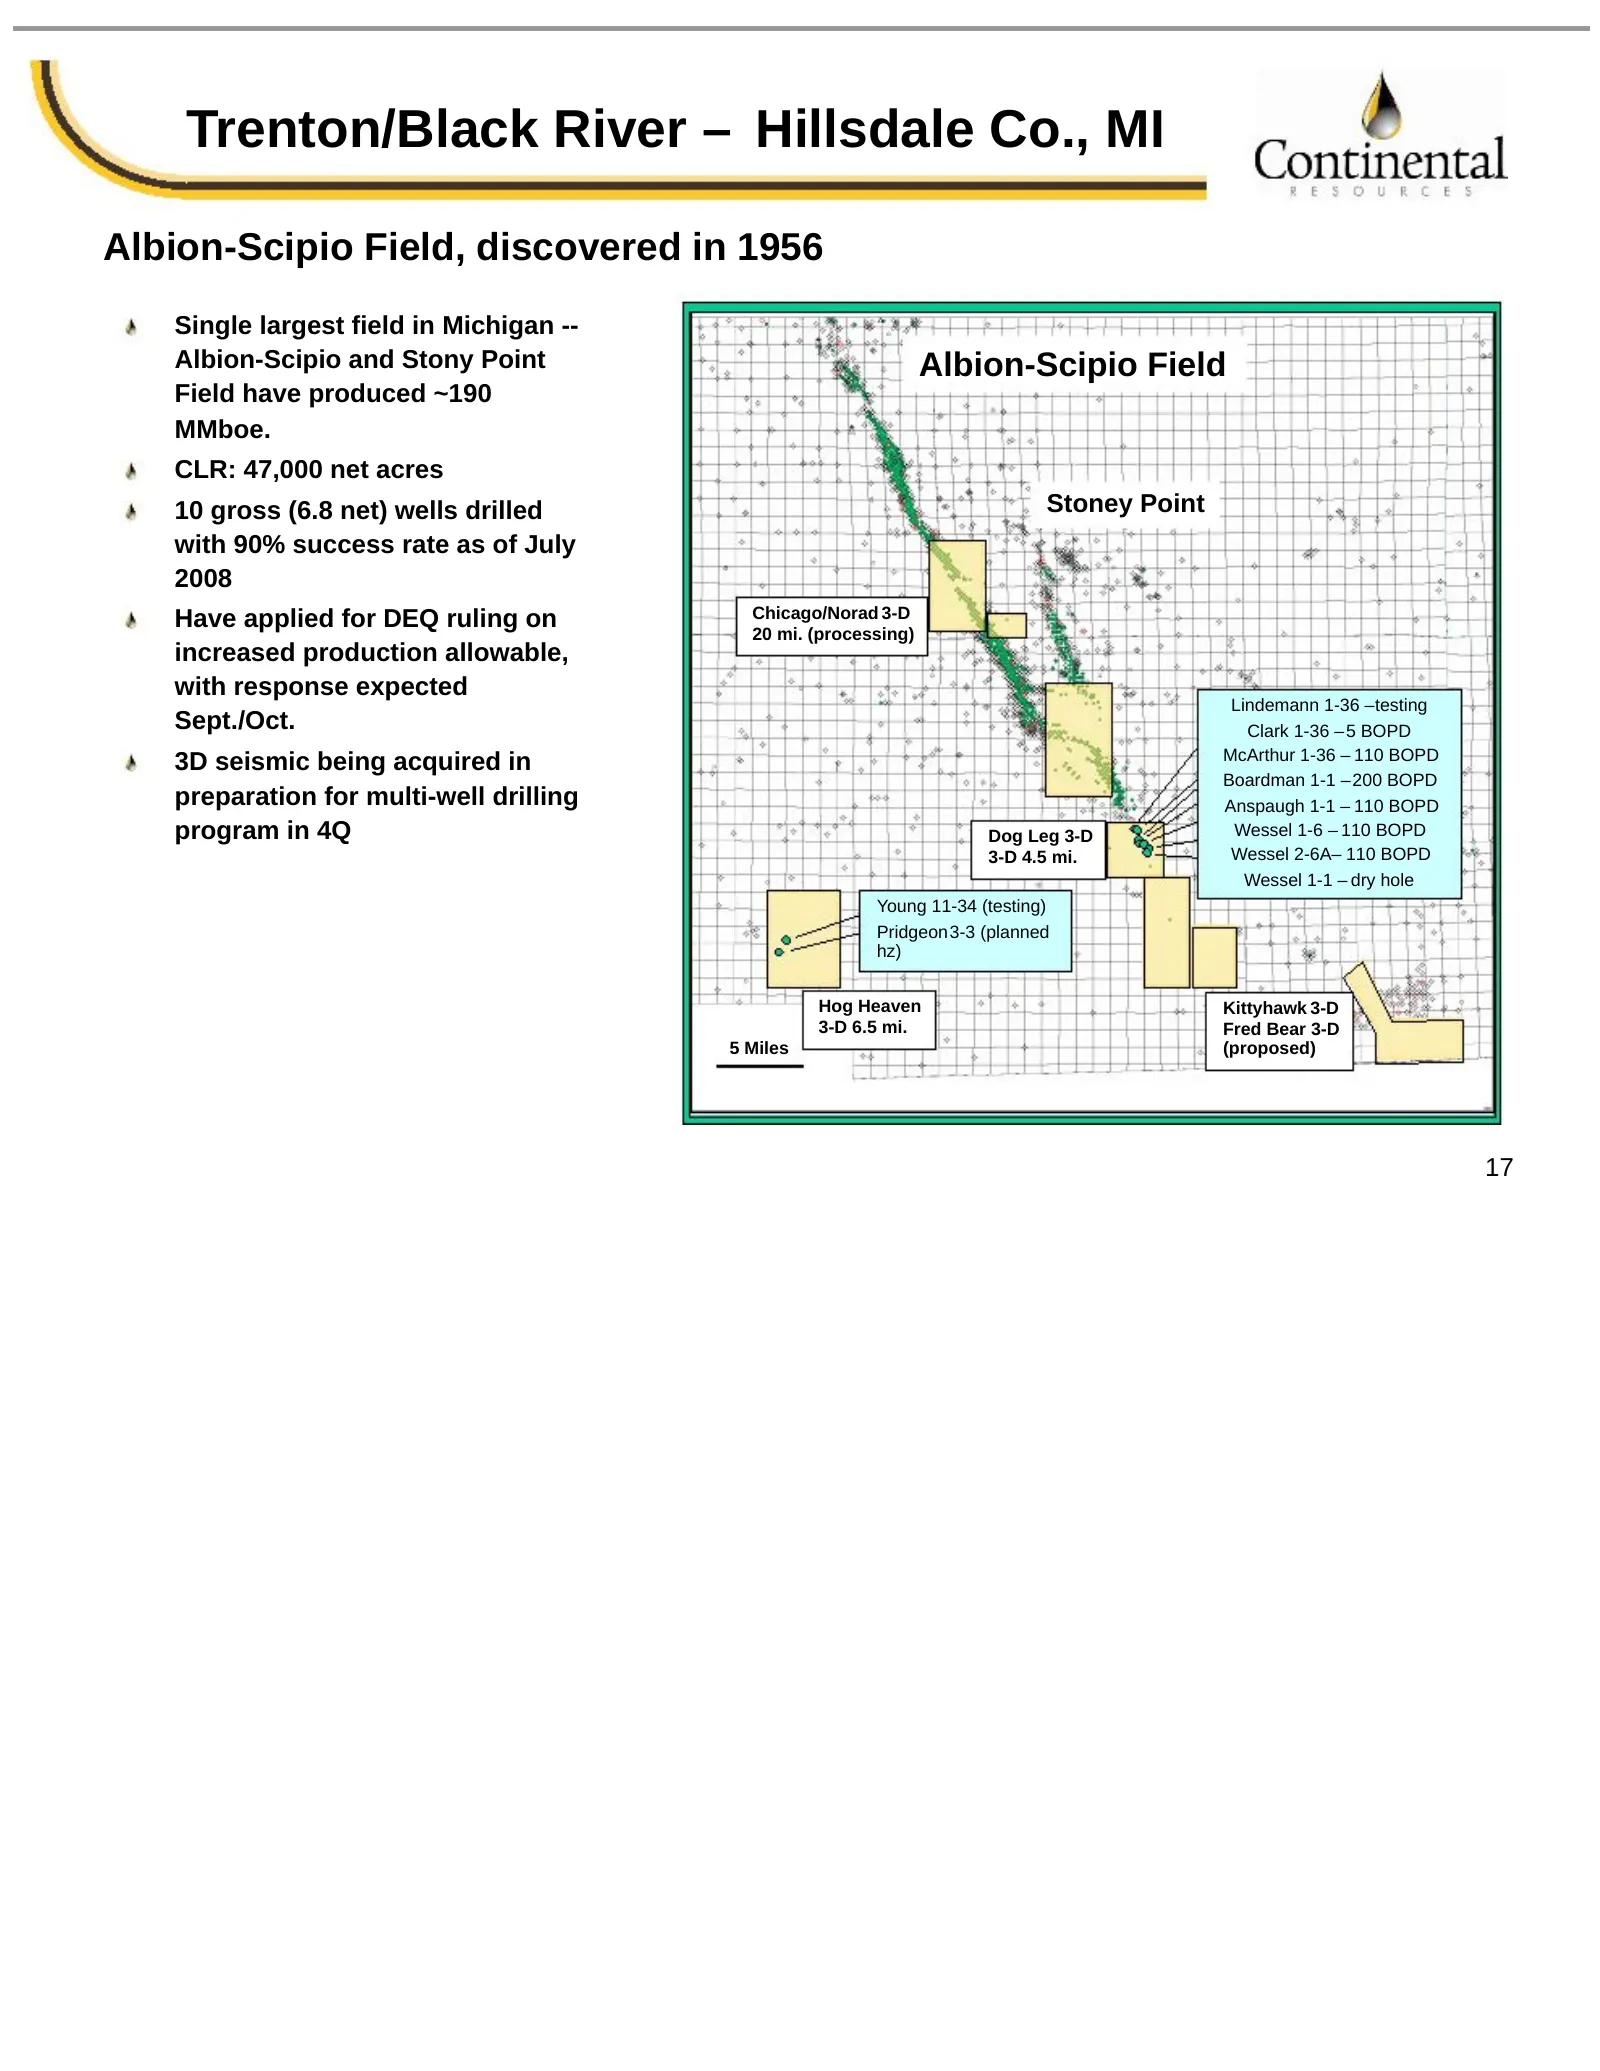
Trenton/Black River – Hillsdale Co., MI Albion-Scipio Field, discovered in 1956 Single largest field in Michigan -- Albion-Scipio and Stony Point Albion-Scipio Field Field have produced ~190 MMboe. CLR: 47,000 net acres 10 gross (6.8 net) wells drilled Stoney Point with 90% success rate as of July 2
Slide 19: Summary
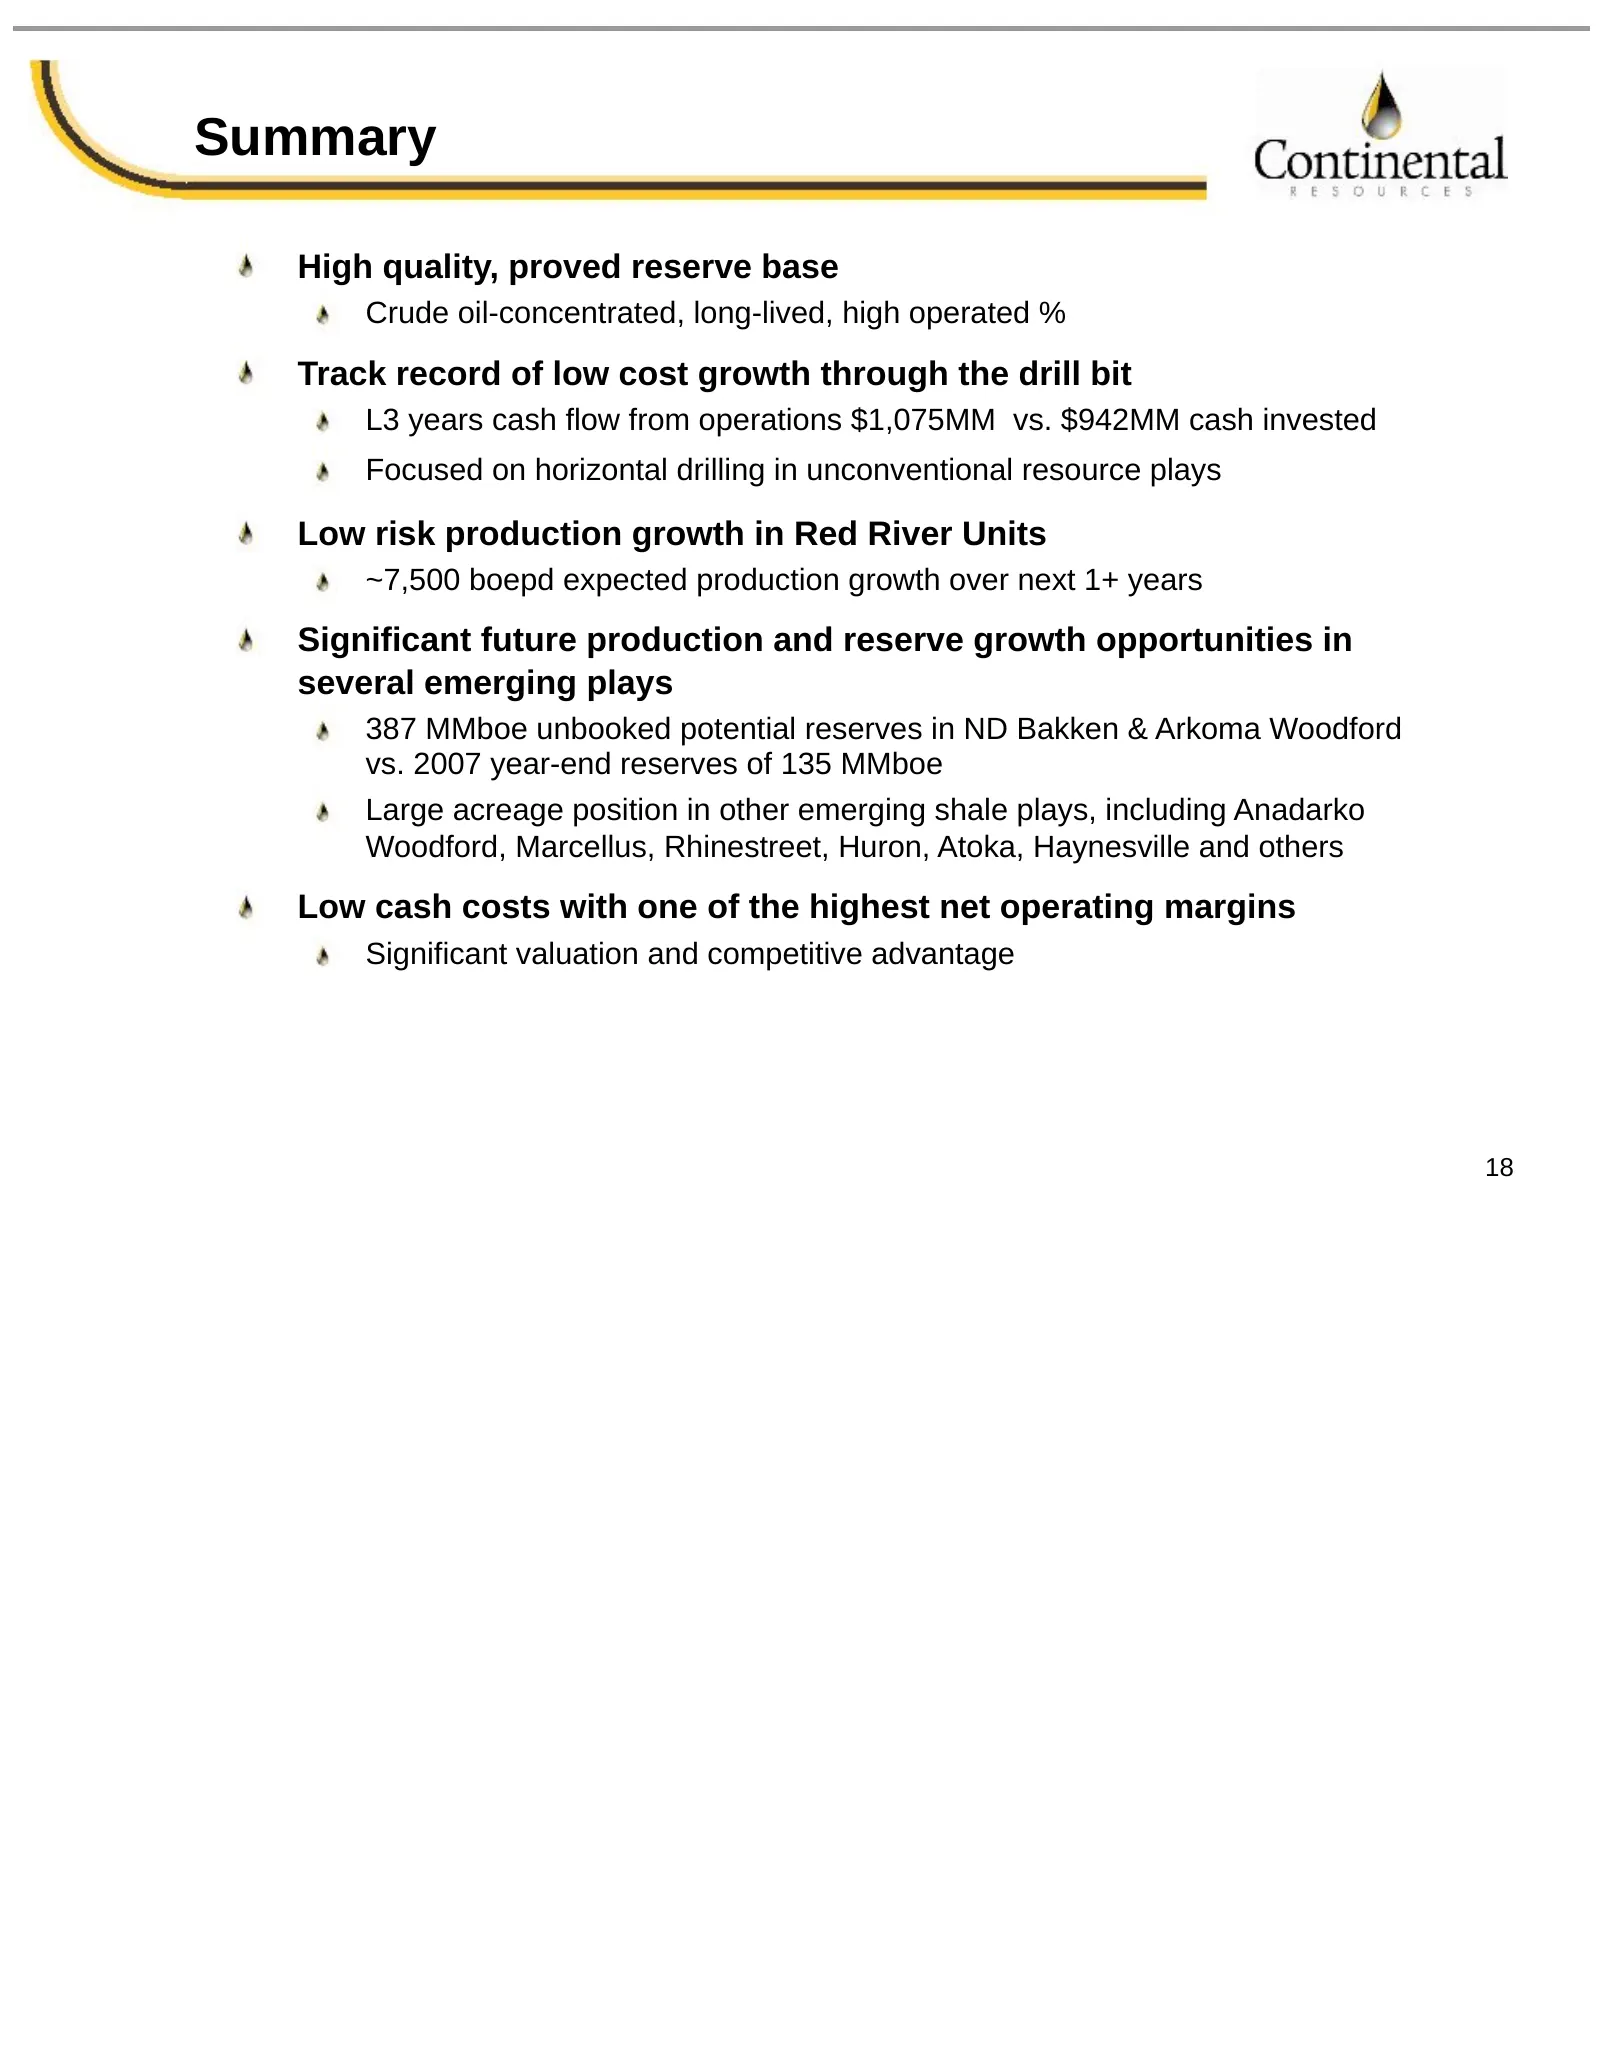
Summary High quality, proved reserve base Crude oil-concentrated, long-lived, high operated % Track record of low cost growth through the drill bit L3 years cash flow from operations $1,075MM vs. $942MM cash invested Focused on horizontal drilling in unconventional resource plays Low risk production
Source: SEC EDGAR · 8-K filed Aug 8, 2008
More decks from Continental Resources Inc
 Investor Day (October 2010)17 slides · Oct 12, 2010
 Investor Day (October 2010)14 slides · Oct 12, 2010
 Investor Day (October 2010)35 slides · Oct 12, 2010
 Investor Day (October 2010)16 slides · Oct 12, 2010
 Investor Day (October 2010)10 slides · Oct 12, 2010
 ENERCOM Energy Conference 201026 slides · Aug 24, 2010