Diversicare Healthcare Services Inc
Diversicare Healthcare Services — Q3 2017 Earnings Presentation
34 slides from Diversicare Healthcare Services's earnings presentation, Nov 2, 2017
Slide 1: Investor Update
Nasdaq: DVCR Investor Update As of September 30, 2017
Slide 2: Forward-Looking Statements
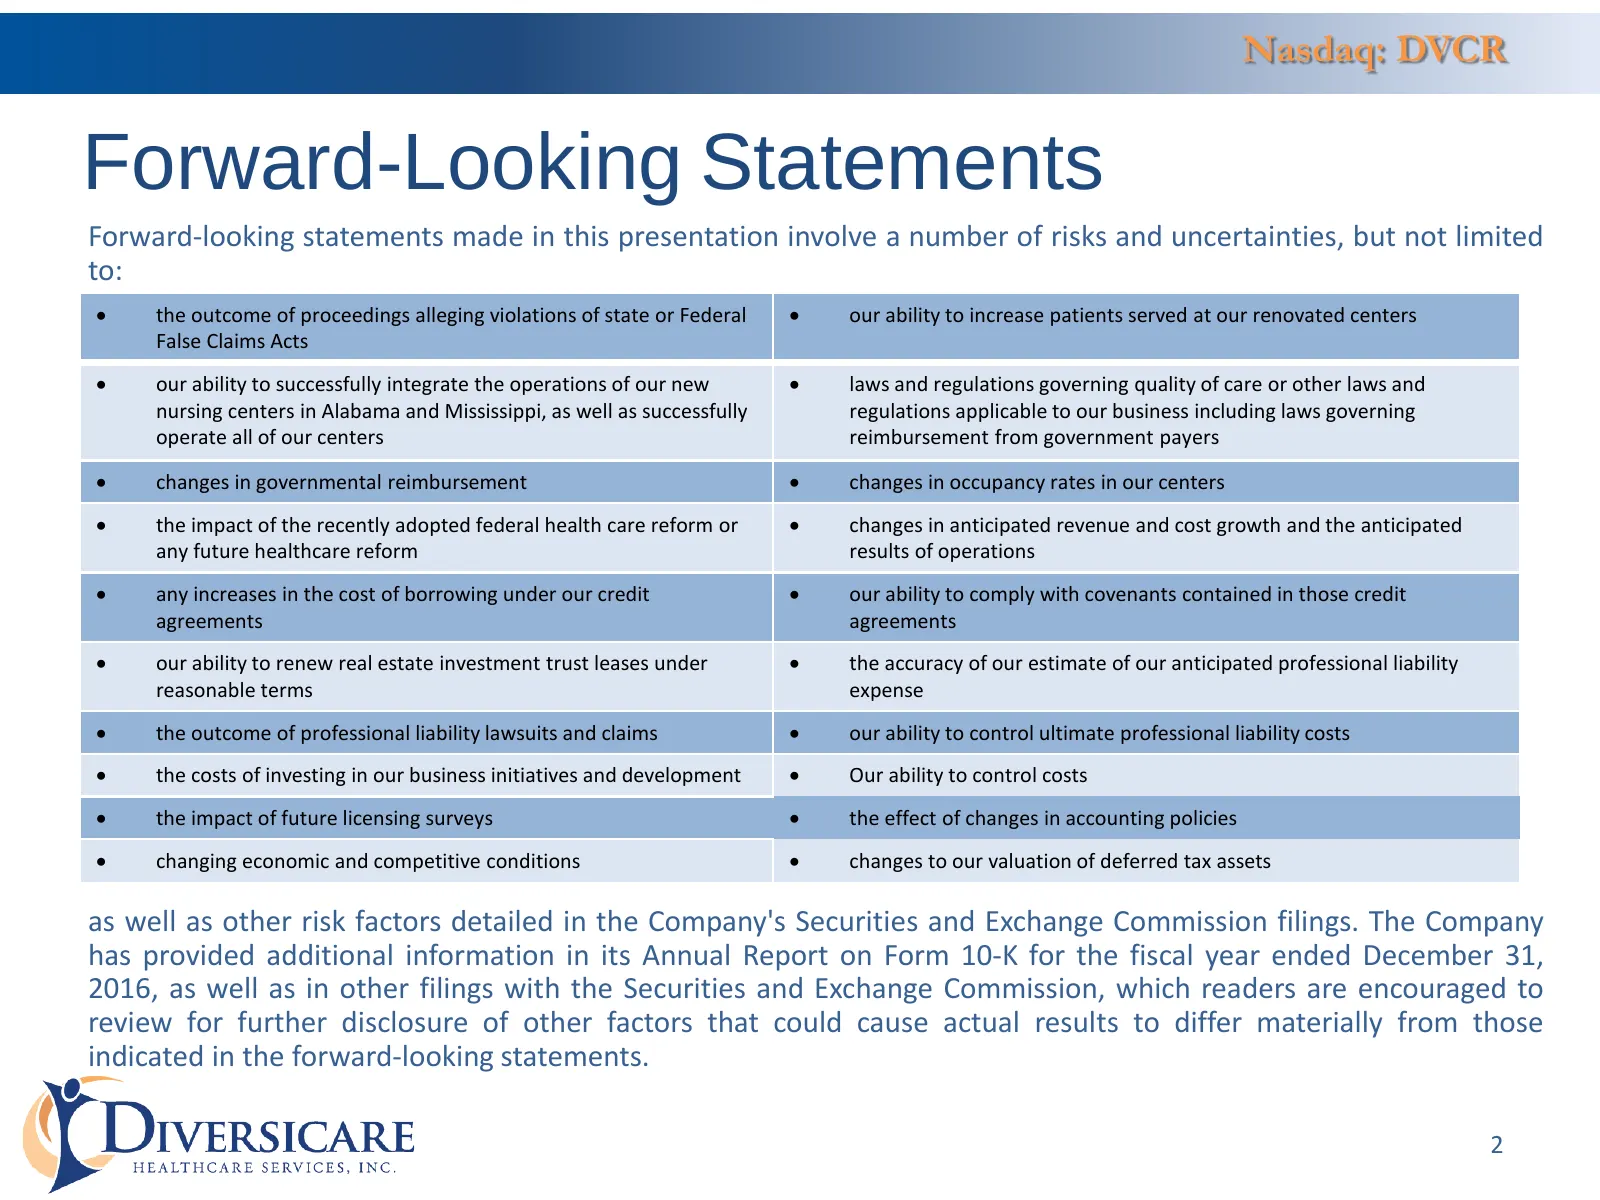
Nasdaq: DVCR Forward-Looking Statements Forward-looking statements made in this presentation involve a number of risks and uncertainties, but not limited to: the outcome of proceedings alleging violations of state or Federal our ability to increase patients served at our renovated centers False
Slide 3: Non-GAAP Information
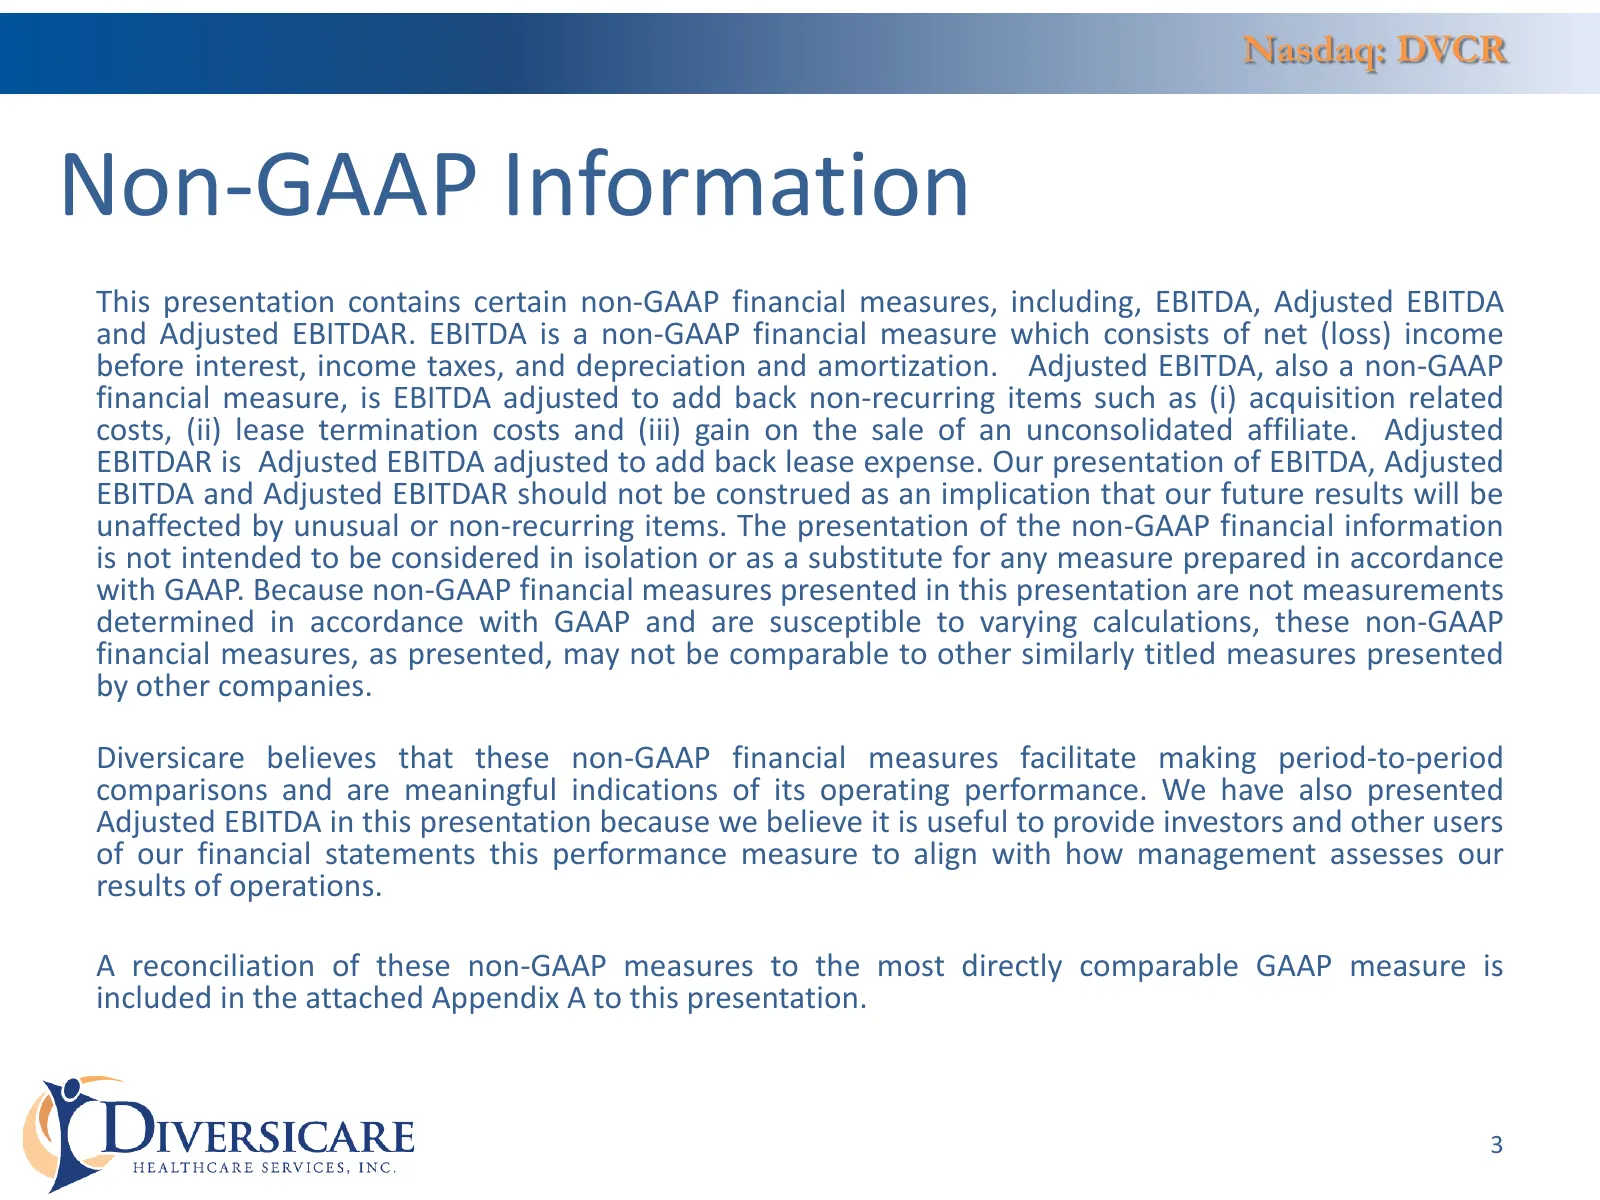
Nasdaq: DVCR Non-GAAP Information This presentation contains certain non-GAAP financial measures, including, EBITDA, Adjusted EBITDA and Adjusted EBITDAR. EBITDA is a non-GAAP financial measure which consists of net (loss) income before interest, income taxes, and depreciation and amortization. Adju
Slide 4: Investment Highlights
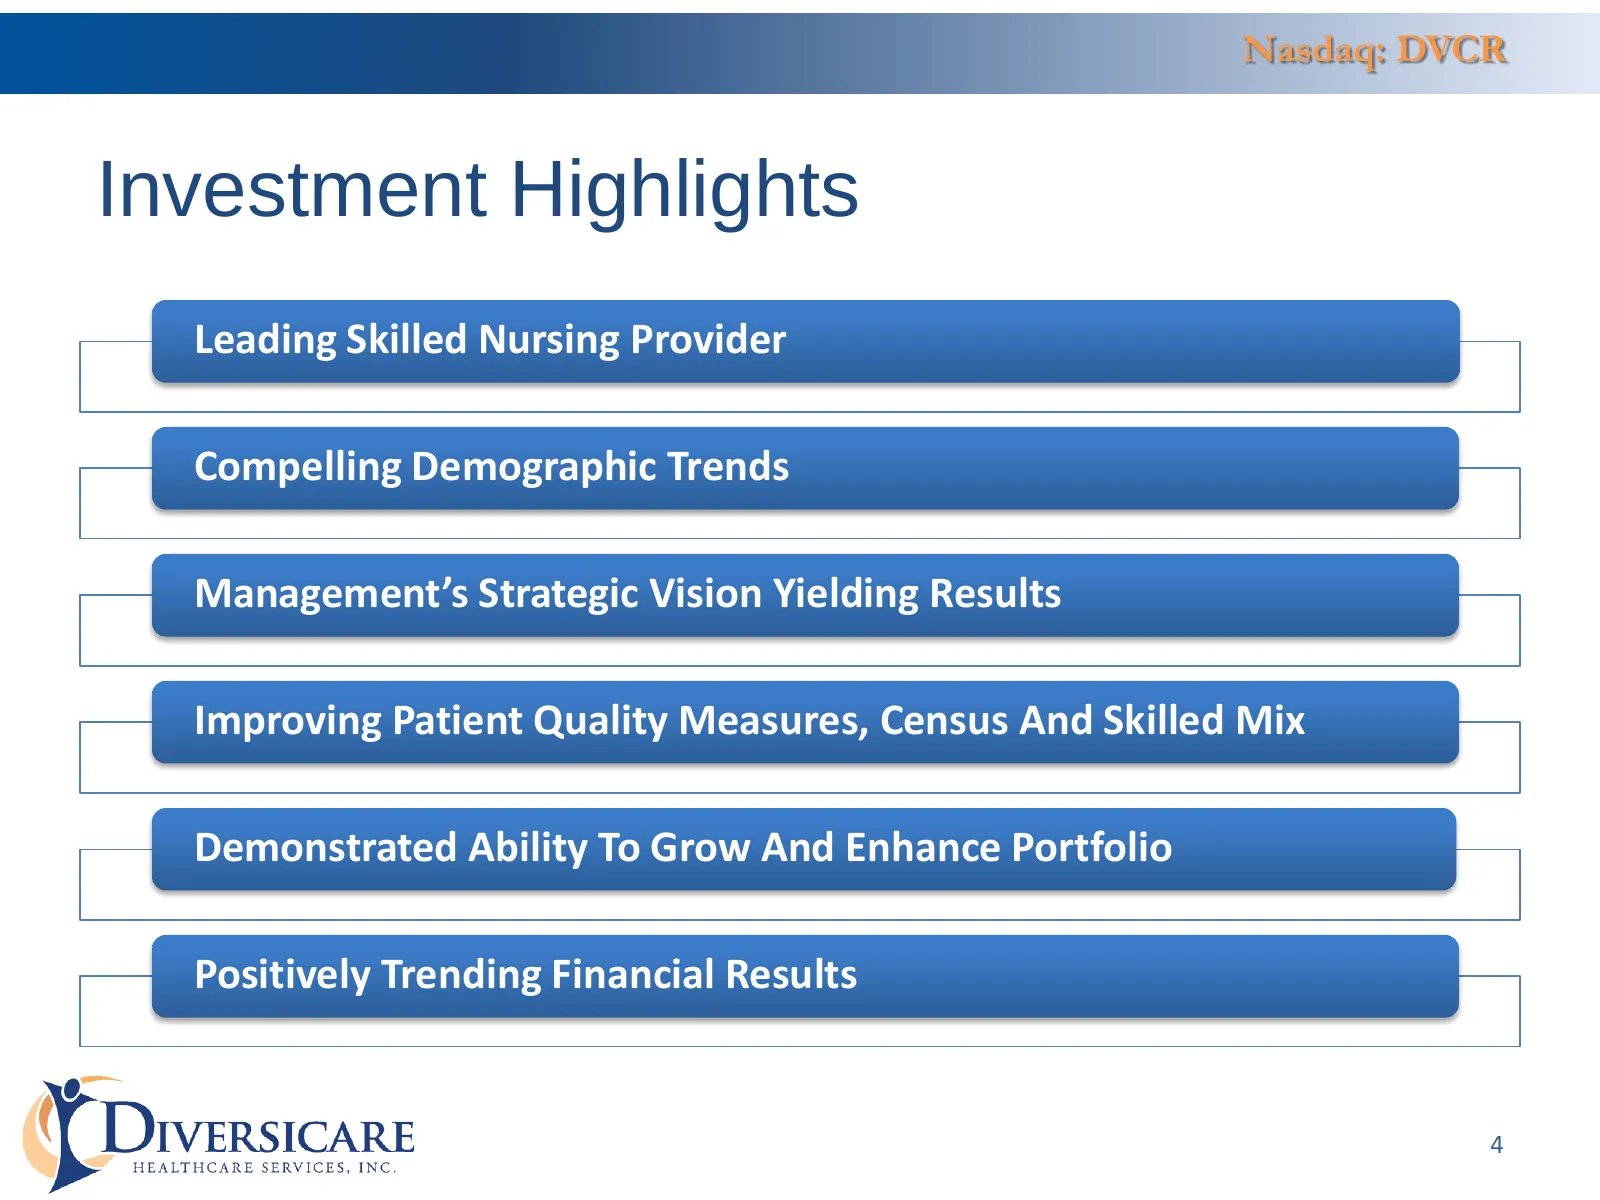
Nasdaq: DVCR Investment Highlights Leading Skilled Nursing Provider Compelling Demographic Trends Management’s Strategic Vision Yielding Results Improving Patient Quality Measures, Census And Skilled Mix Demonstrated Ability To Grow And Enhance Portfolio Positively Trending Financial Results 4
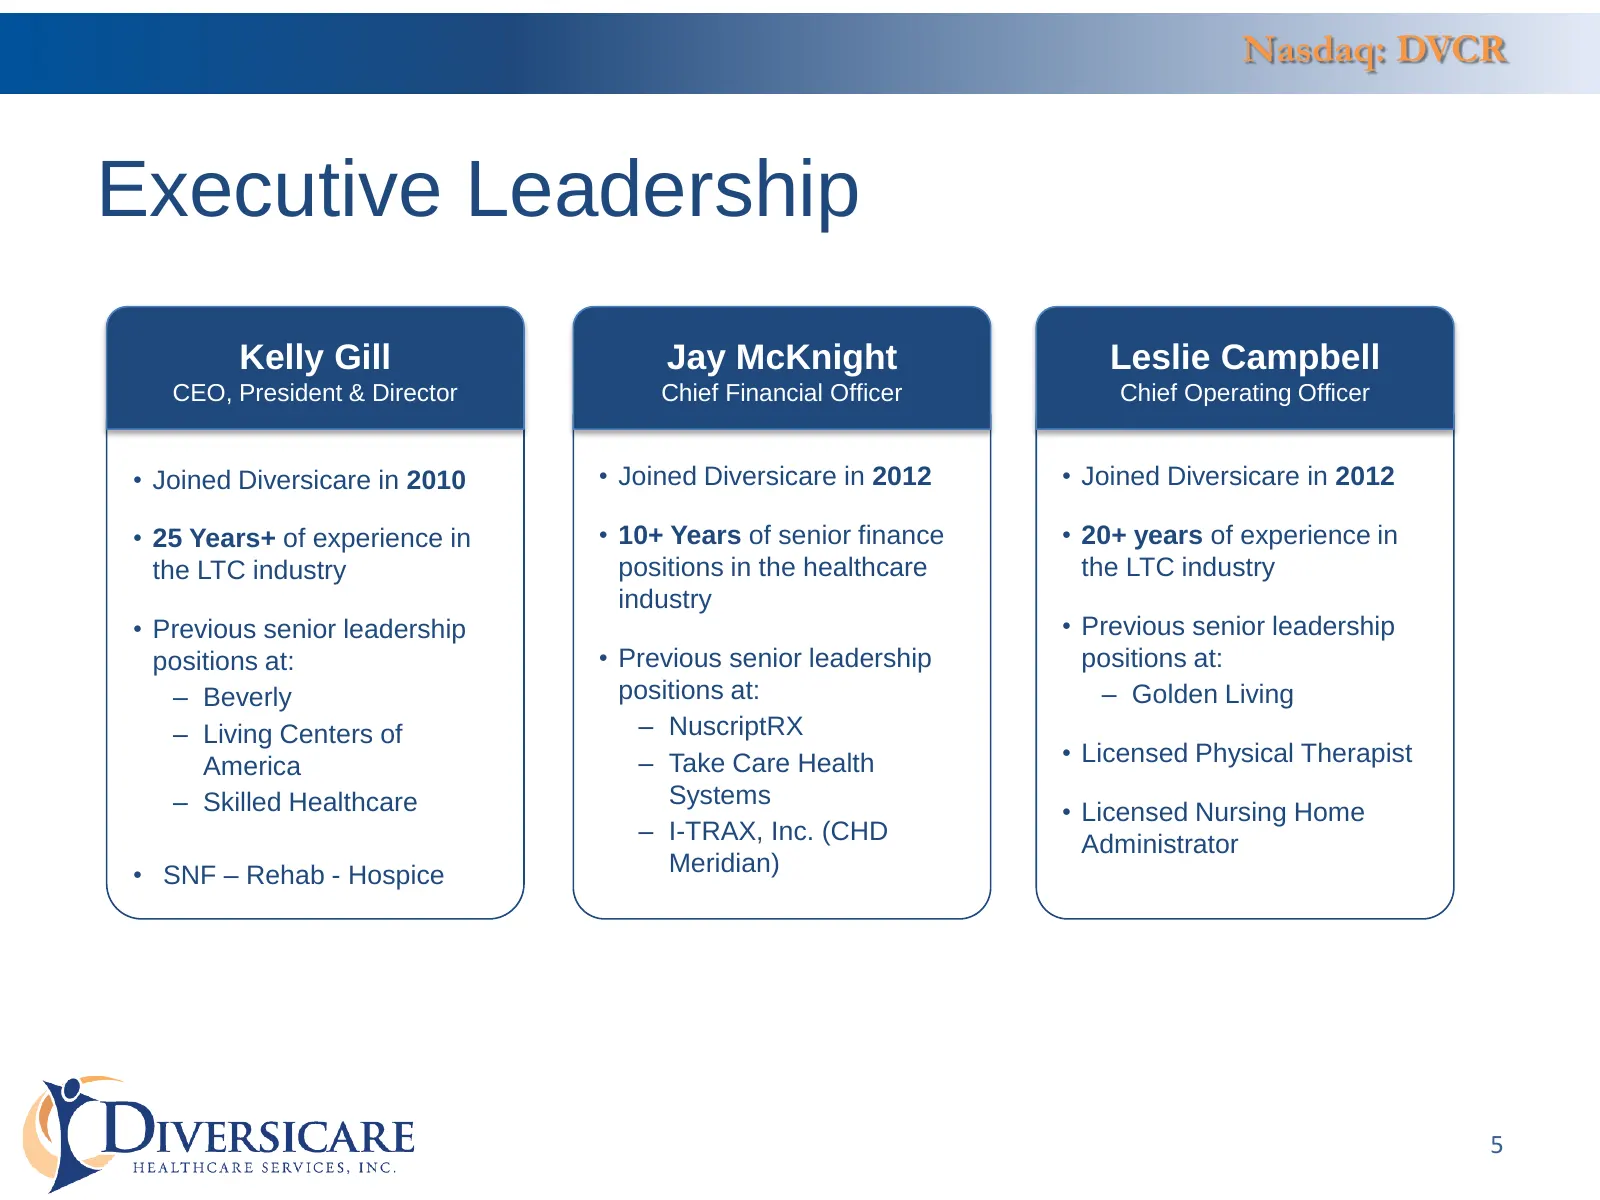
Slide 5: Executive Leadership
Nasdaq: DVCR Executive Leadership Kelly Gill Jay McKnight Leslie Campbell CEO, President & Director Chief Financial Officer Chief Operating Officer • Joined Diversicare in 2010 • Joined Diversicare in 2012 • Joined Diversicare in 2012 • 25 Years+ of experience in • 10+ Years of senior finance • 20+
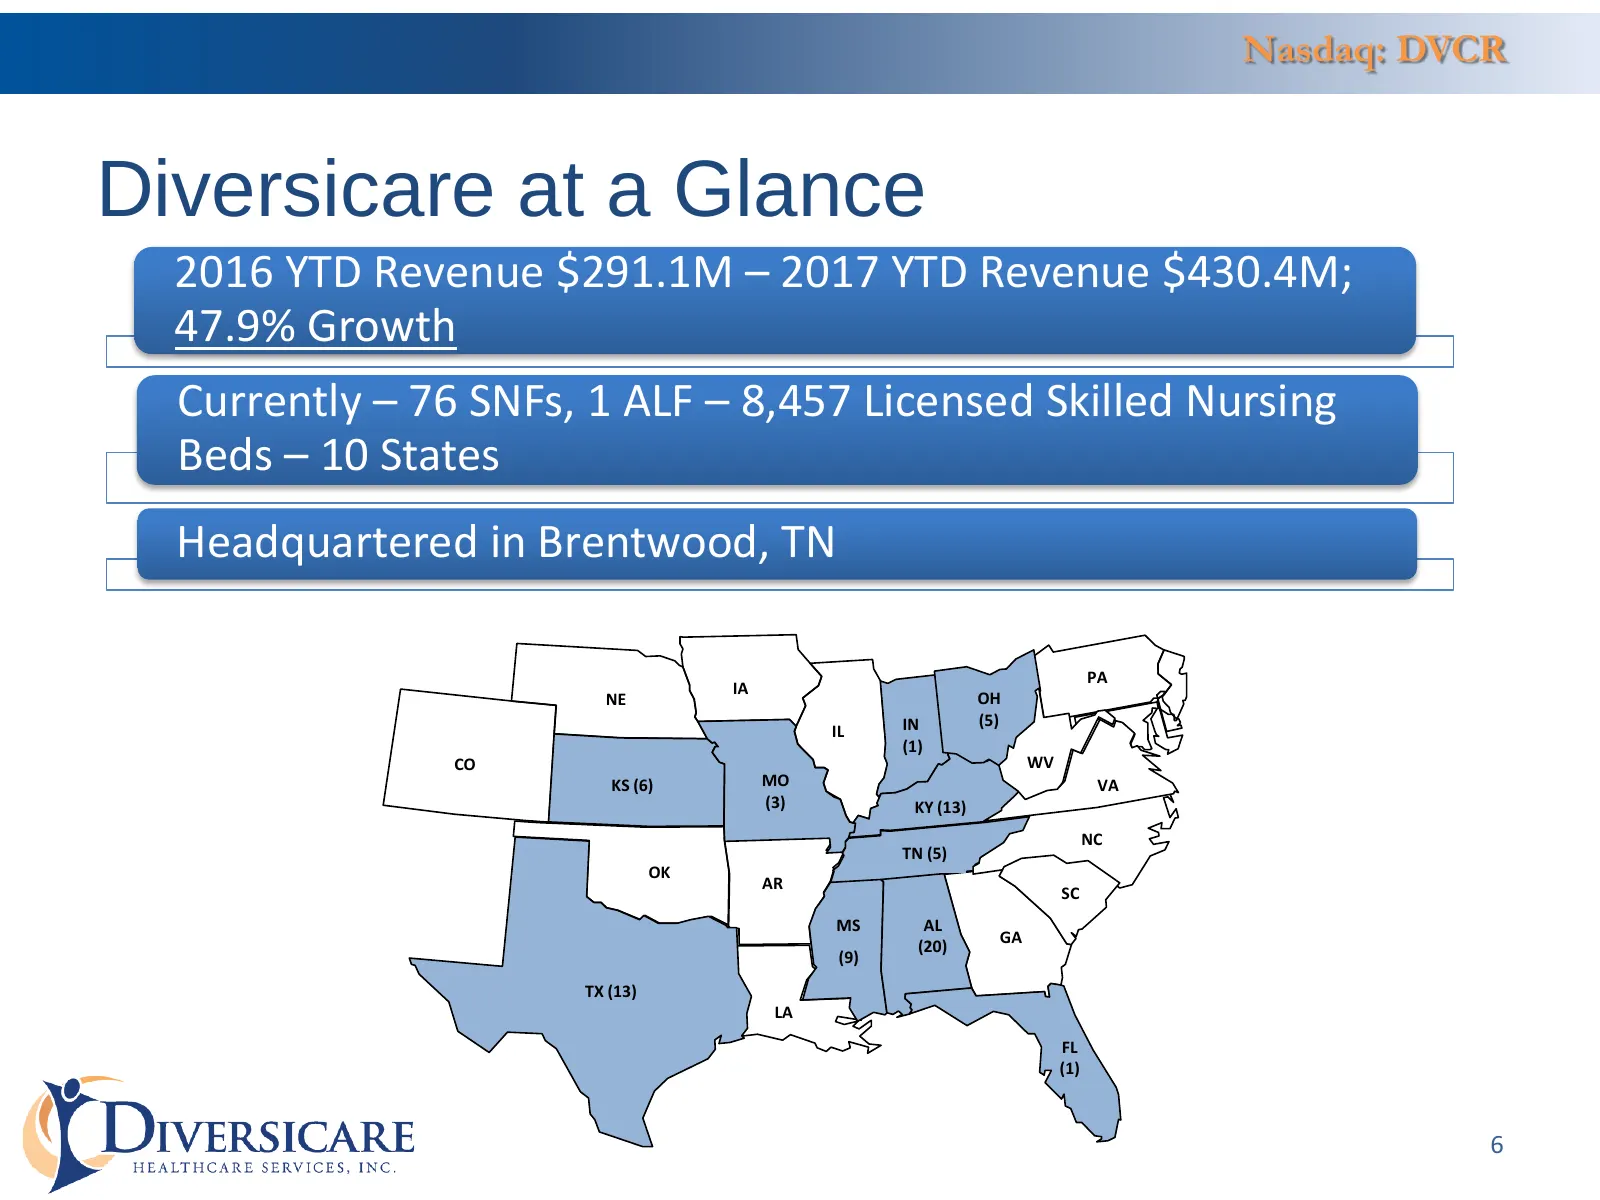
Slide 6: Diversicare at a Glance
Nasdaq: DVCR Diversicare at a Glance 2016 YTD Revenue $291.1M – 2017 YTD Revenue $430.4M; 47.9% Growth Currently – 76 SNFs, 1 ALF – 8,457 Licensed Skilled Nursing Beds – 10 States Headquartered in Brentwood, TN PA IA NE OH IN (5) IL (1) CO WV KS (6) MO VA (3) KY (13) NC TN (5) OK AR SC MS AL GA (20)
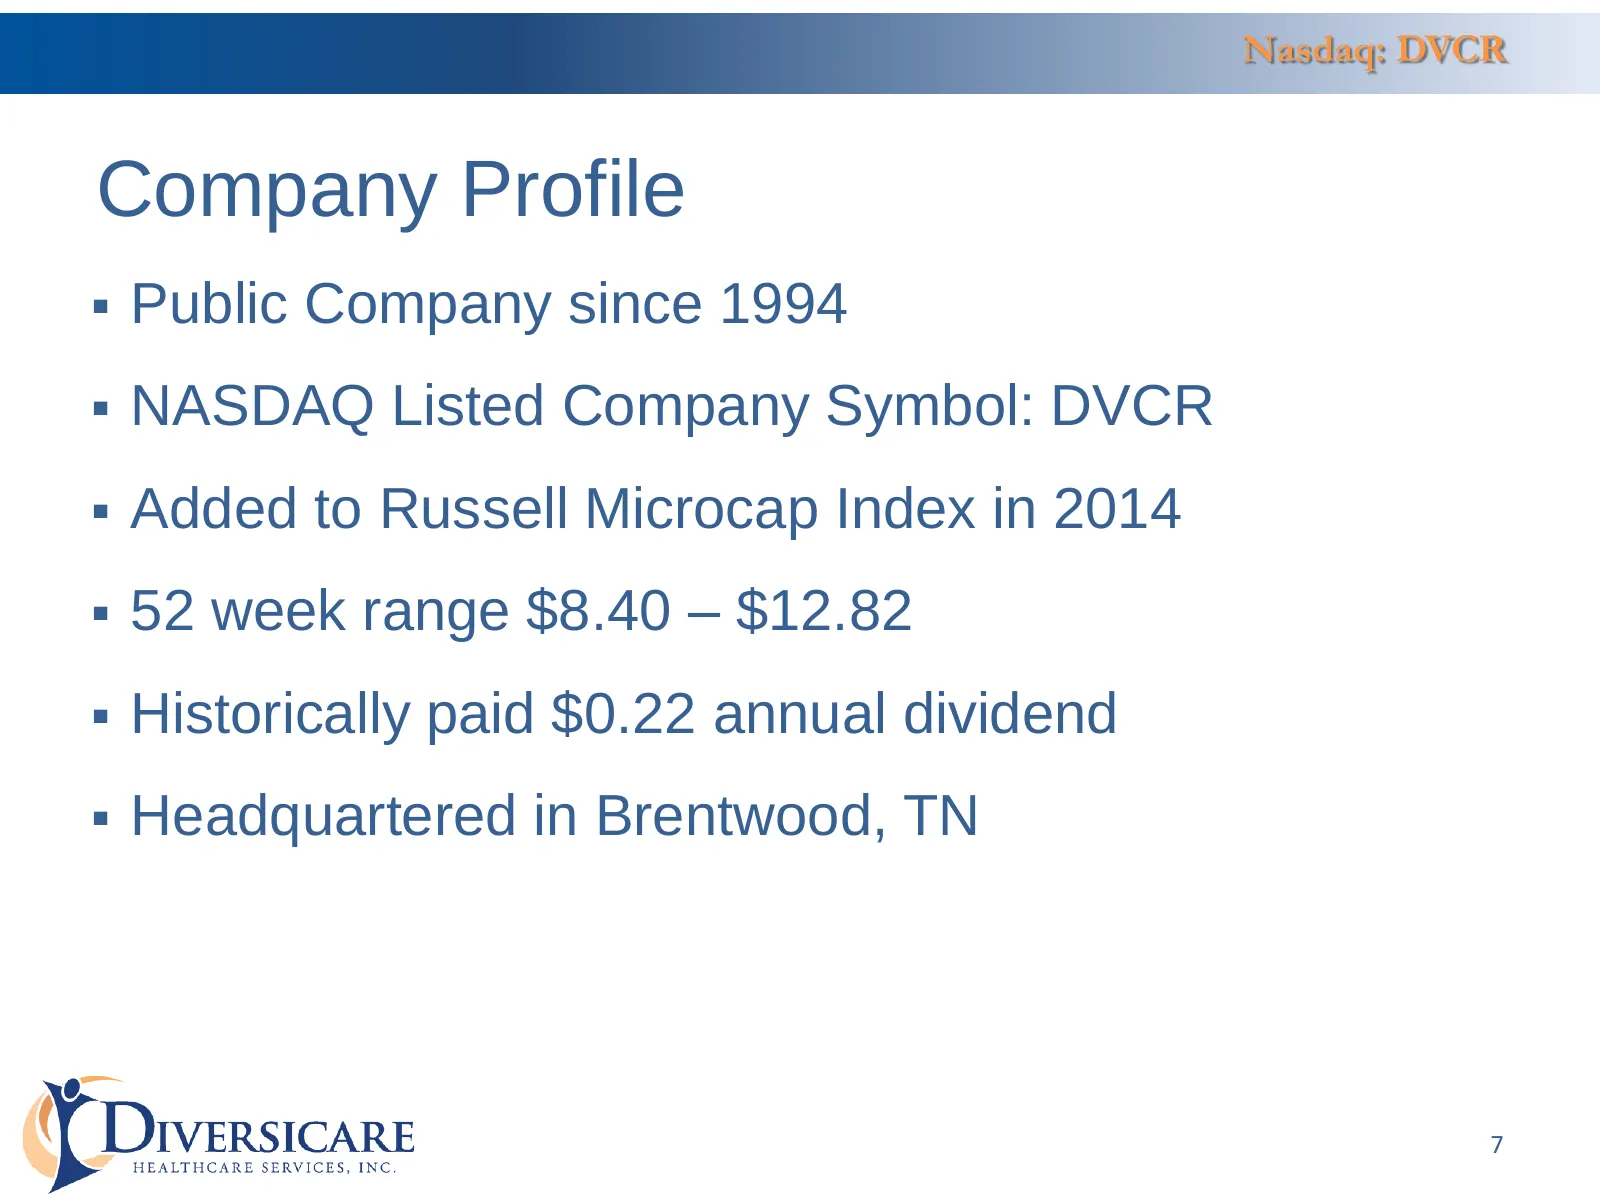
Slide 7: Company Profile
Nasdaq: DVCR Company Profile Public Company since 1994 NASDAQ Listed Company Symbol: DVCR Added to Russell Microcap Index in 2014 52 week range $8.40 – $12.82 Historically paid $0.22 annual dividend Headquartered in Brentwood, TN 7
Slide 8: Long Term Care Industry Overview
Nasdaq: DVCR Long Term Care Industry Overview • Compelling Demographic Trends • High Quality Clinical Outcomes • Relative Low Cost of Care • Risks to the Industry and the Company 8
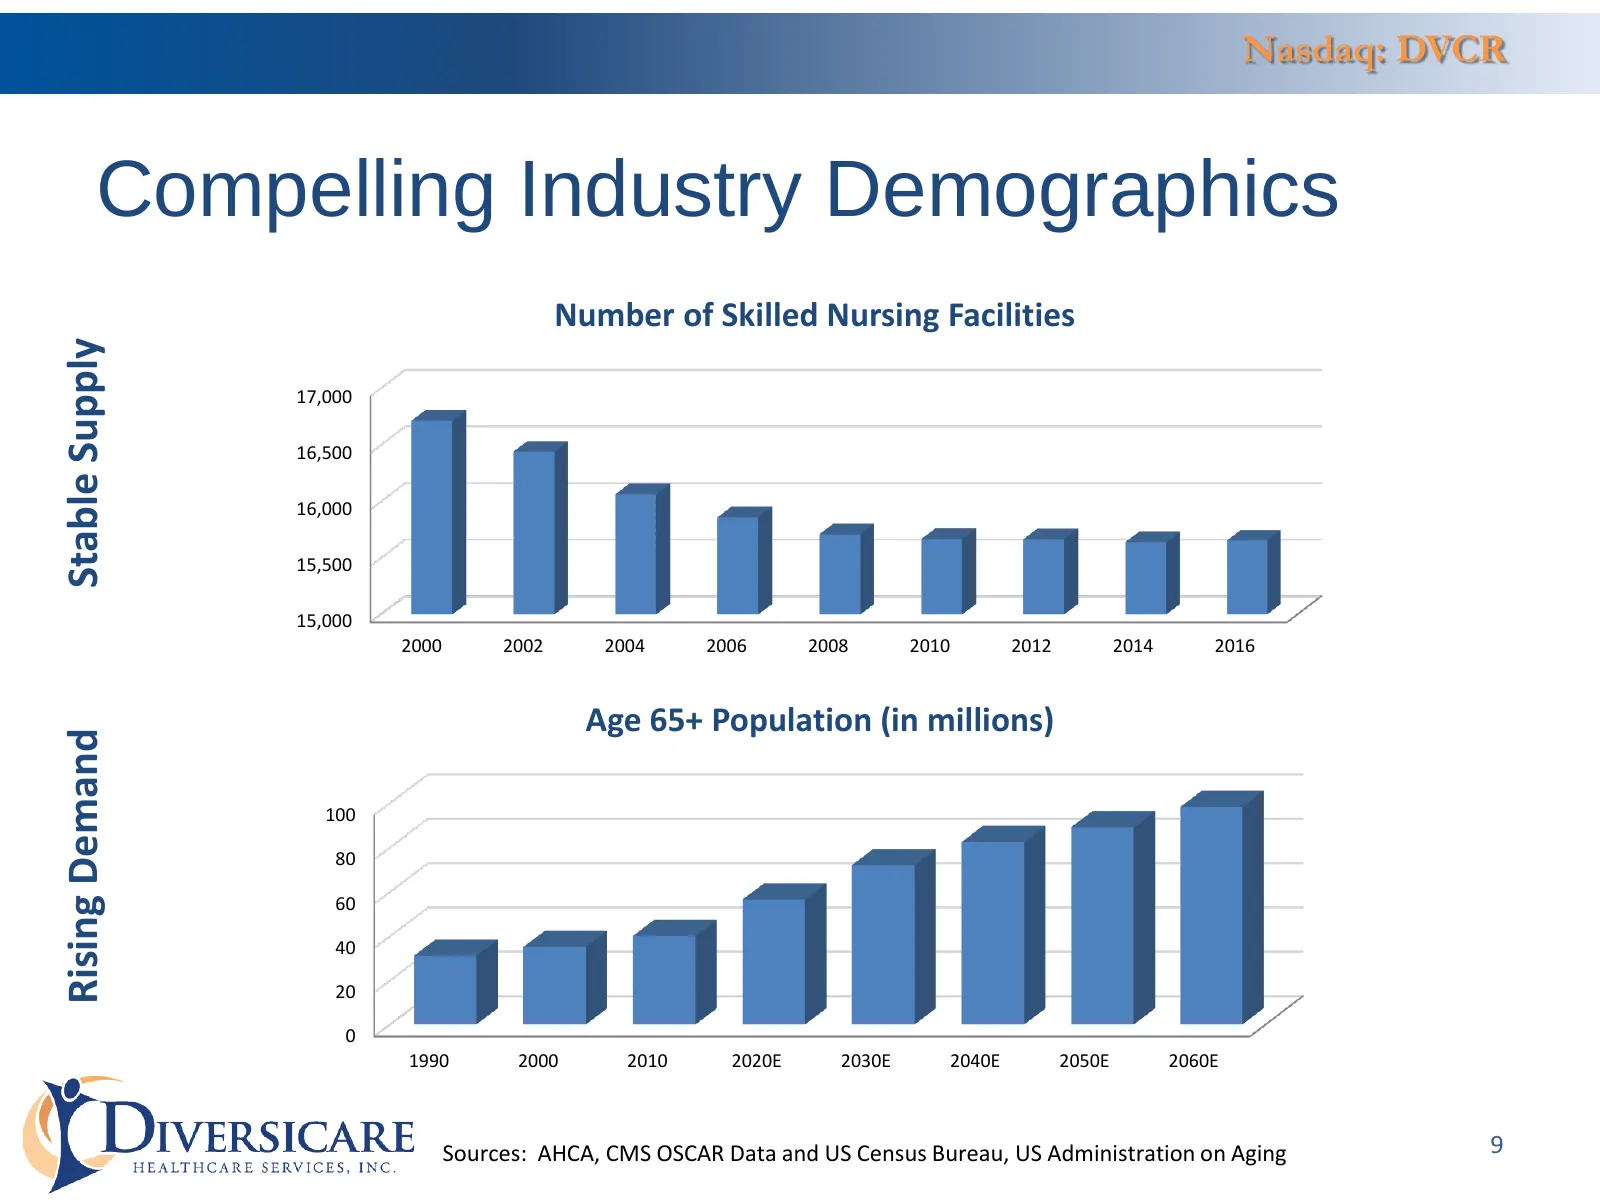
Slide 9: Compelling Industry Demographics
Nasdaq: DVCR Compelling Industry Demographics Number of Skilled Nursing Facilities Stable Supply 17,000 16,500 16,000 15,500 15,000 2000 2002 2004 2006 2008 2010 2012 2014 2016 Age 65+ Population (in millions) Rising Demand 100 80 60 40 20 0 1990 2000 2010 2020E 2030E 2040E 2050E 2060E Sources: AHCA
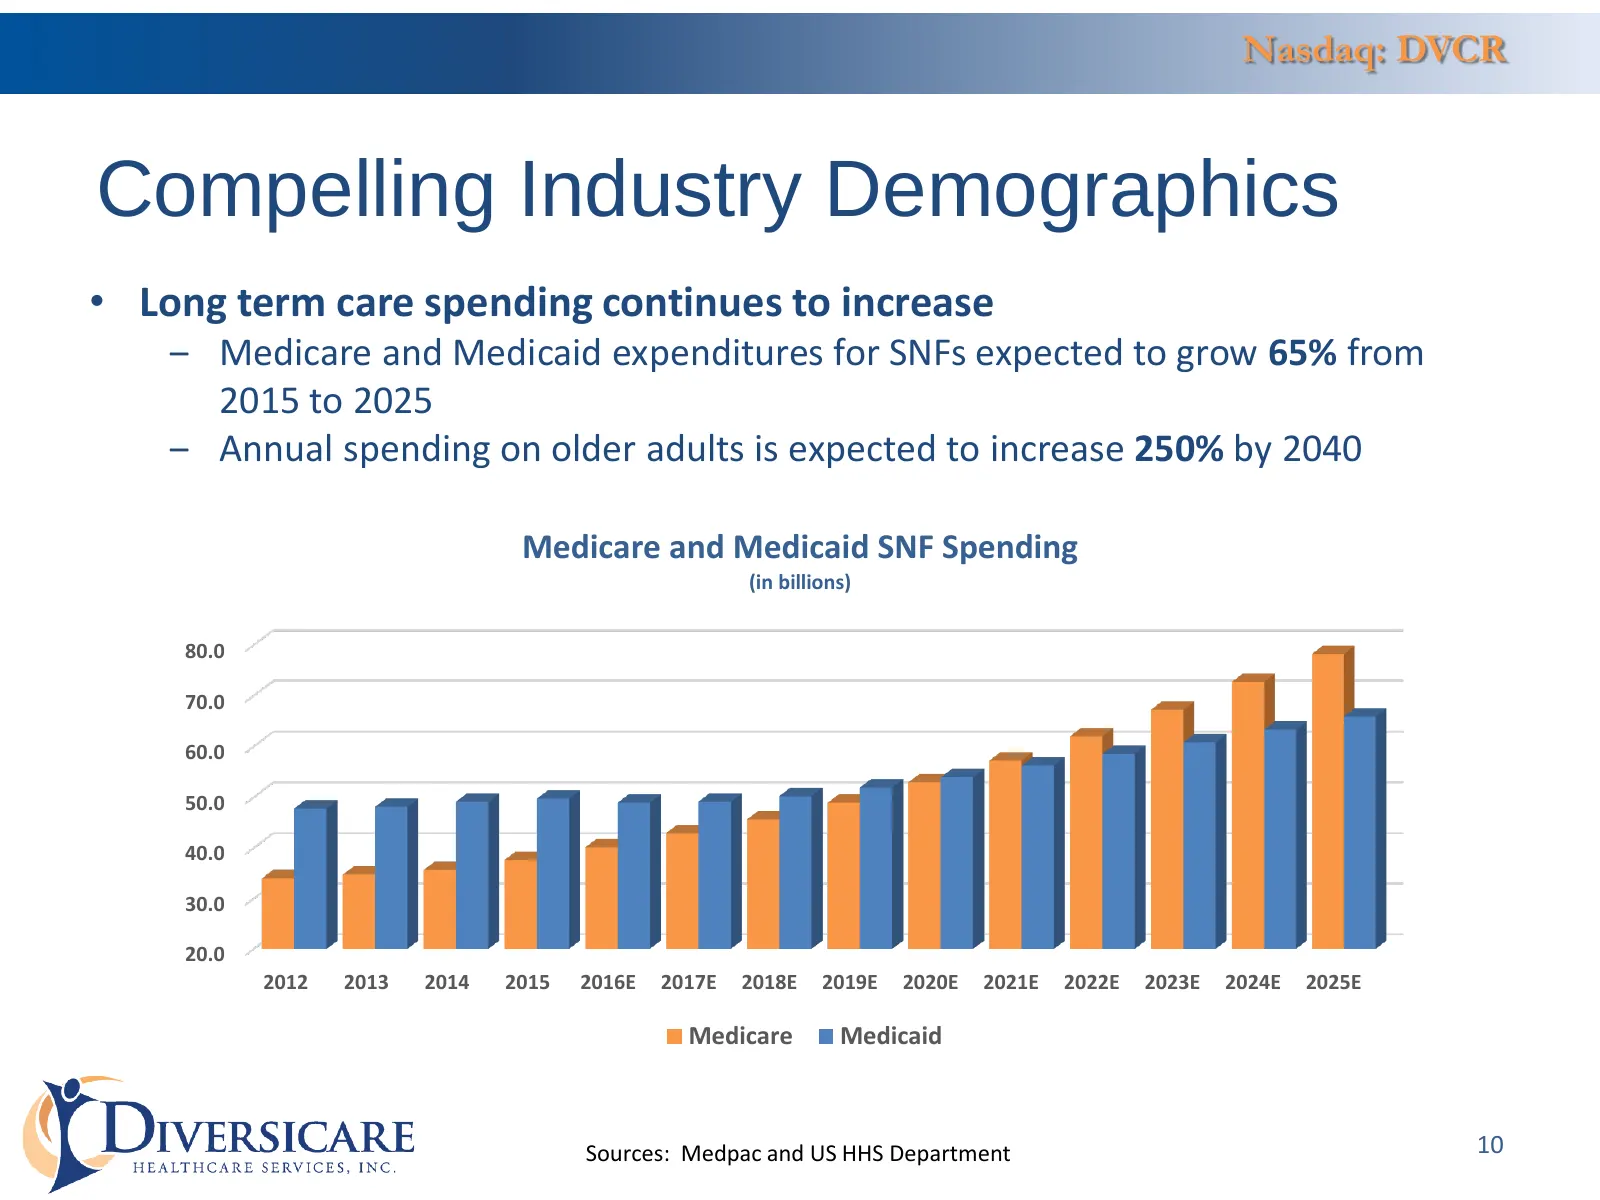
Slide 10: Compelling Industry Demographics
Nasdaq: DVCR Compelling Industry Demographics • Long term care spending continues to increase ‒ Medicare and Medicaid expenditures for SNFs expected to grow 65% from 2015 to 2025 ‒ Annual spending on older adults is expected to increase 250% by 2040 Medicare and Medicaid SNF Spending (in billions) 8
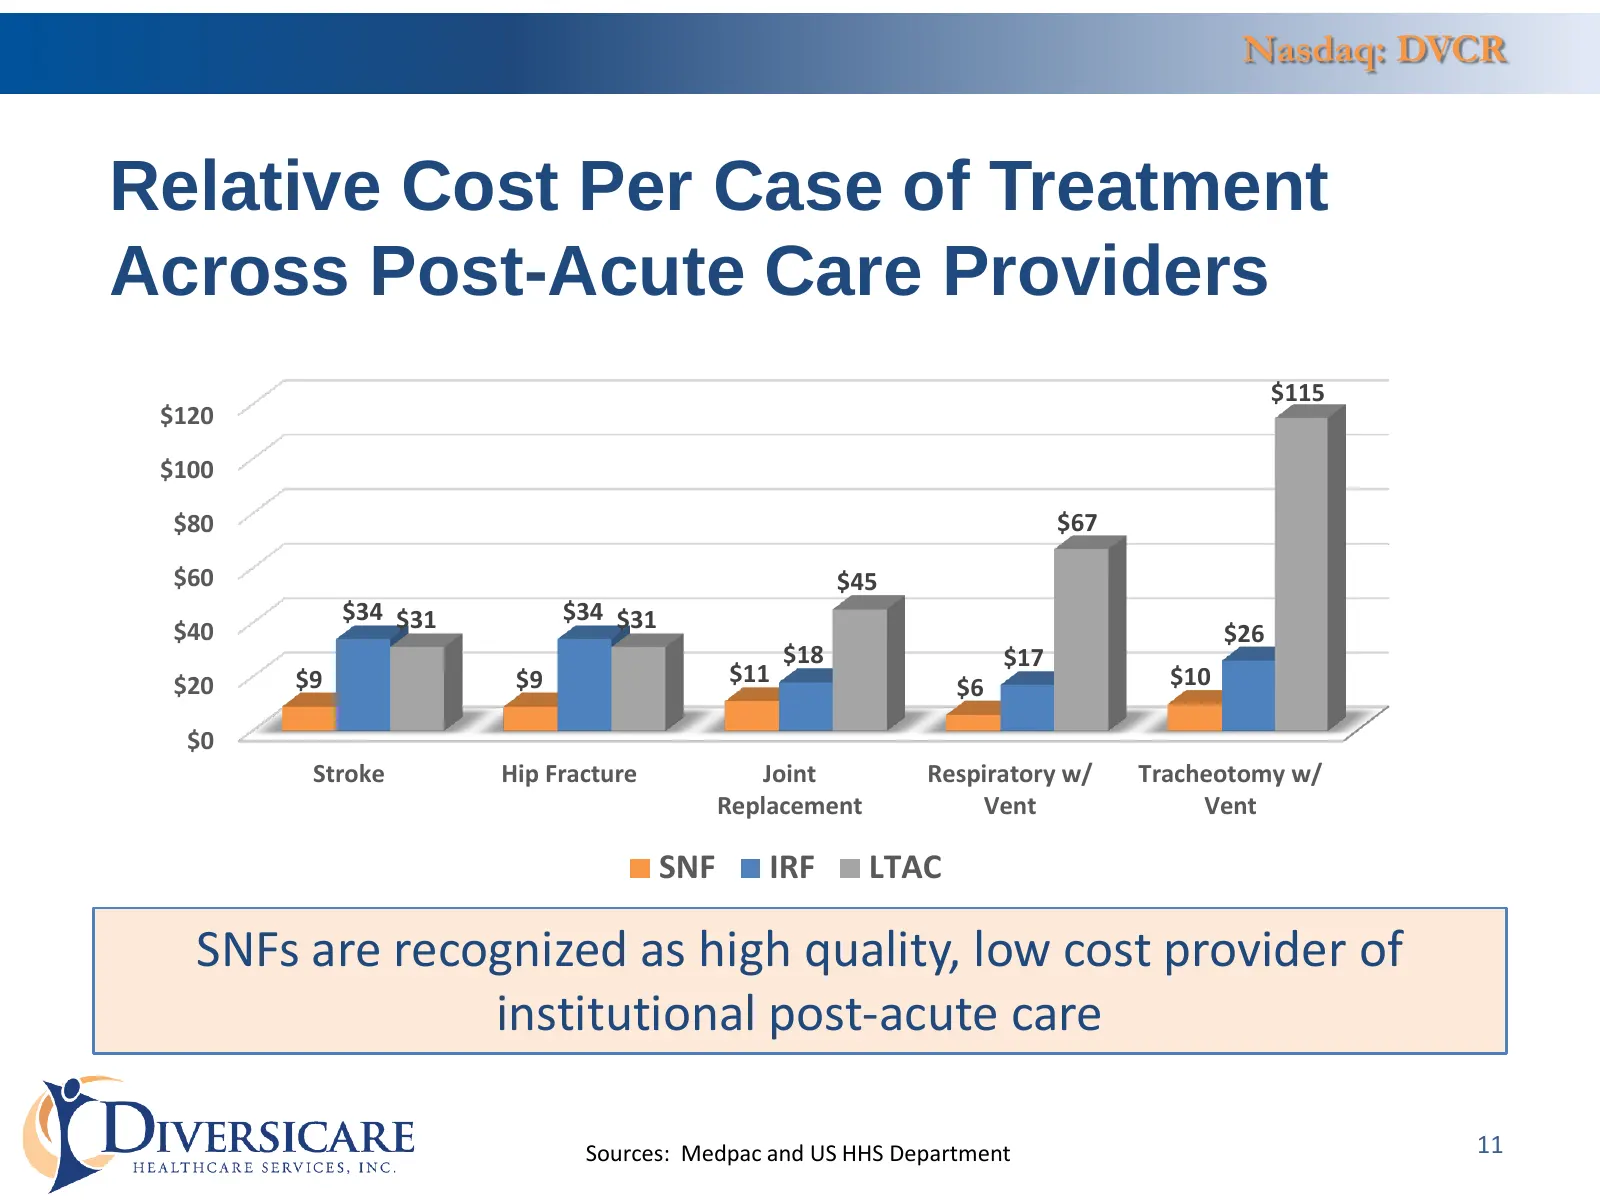
Slide 11: Relative Cost Per Case of Treatment Across Post-Acute Care Providers
Nasdaq: DVCR Relative Cost Per Case of Treatment Across Post-Acute Care Providers $115 $120 $100 $80 $67 $60 $45 $34 $31 $34 $31 $40 $26 $18 $17 $20 $9 $9 $11 $10 $6 $0 Stroke Hip Fracture Joint Respiratory w/ Tracheotomy w/ Replacement Vent Vent SNF IRF LTAC SNFs are recognized as high quality, low
Slide 12: Risks to the Industry and the Company
Nasdaq: DVCR Risks to the Industry and the Company A number of risks may impact the Industry in general and the Company in particular, including litigation risks and Government reimbursement/regulation risks. Litigation Risks include: • The provision of health care services results in numerous profe
Slide 13: Risks to the Industry and the Company
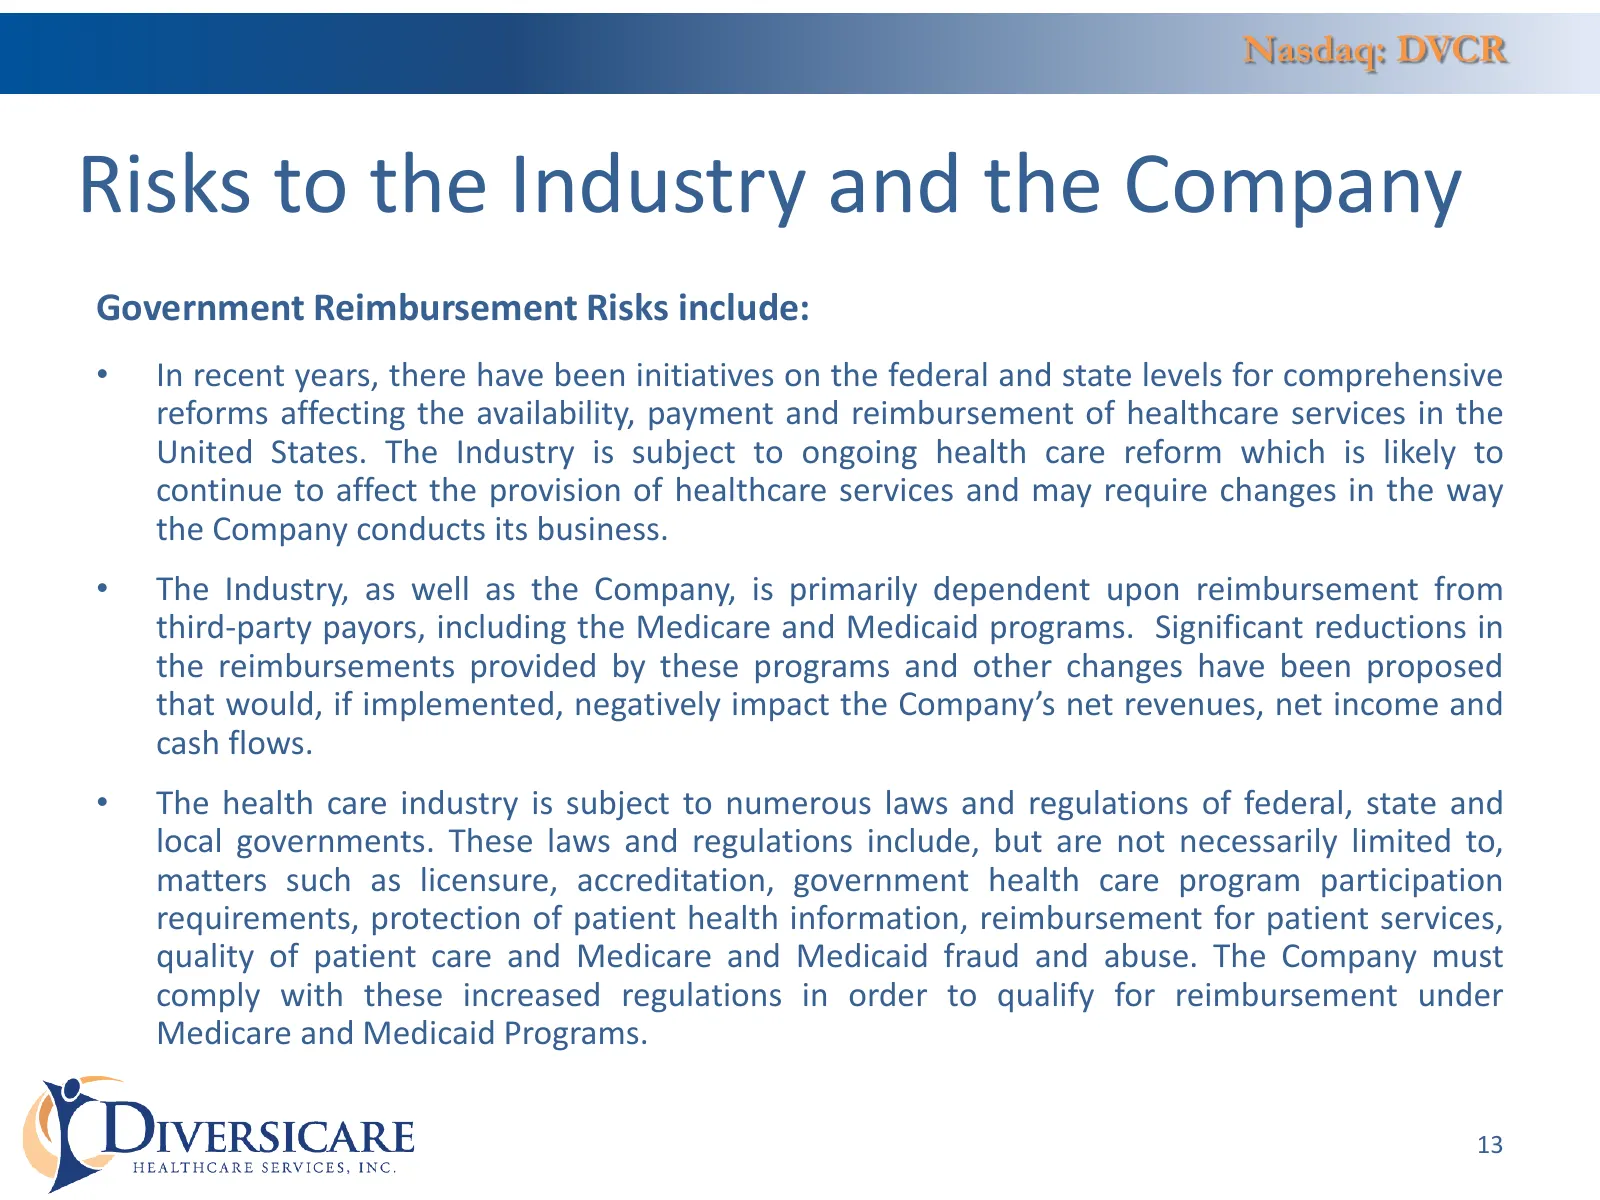
Nasdaq: DVCR Risks to the Industry and the Company Government Reimbursement Risks include: • In recent years, there have been initiatives on the federal and state levels for comprehensive reforms affecting the availability, payment and reimbursement of healthcare services in the United States. The I
Slide 14: Company Overview
Nasdaq: DVCR Company Overview • Mature Company • Provides a full spectrum of post-acute healthcare services • Robust operating platform capable of significant growth expansion 14
Slide 15: Key Strategic Accomplishments
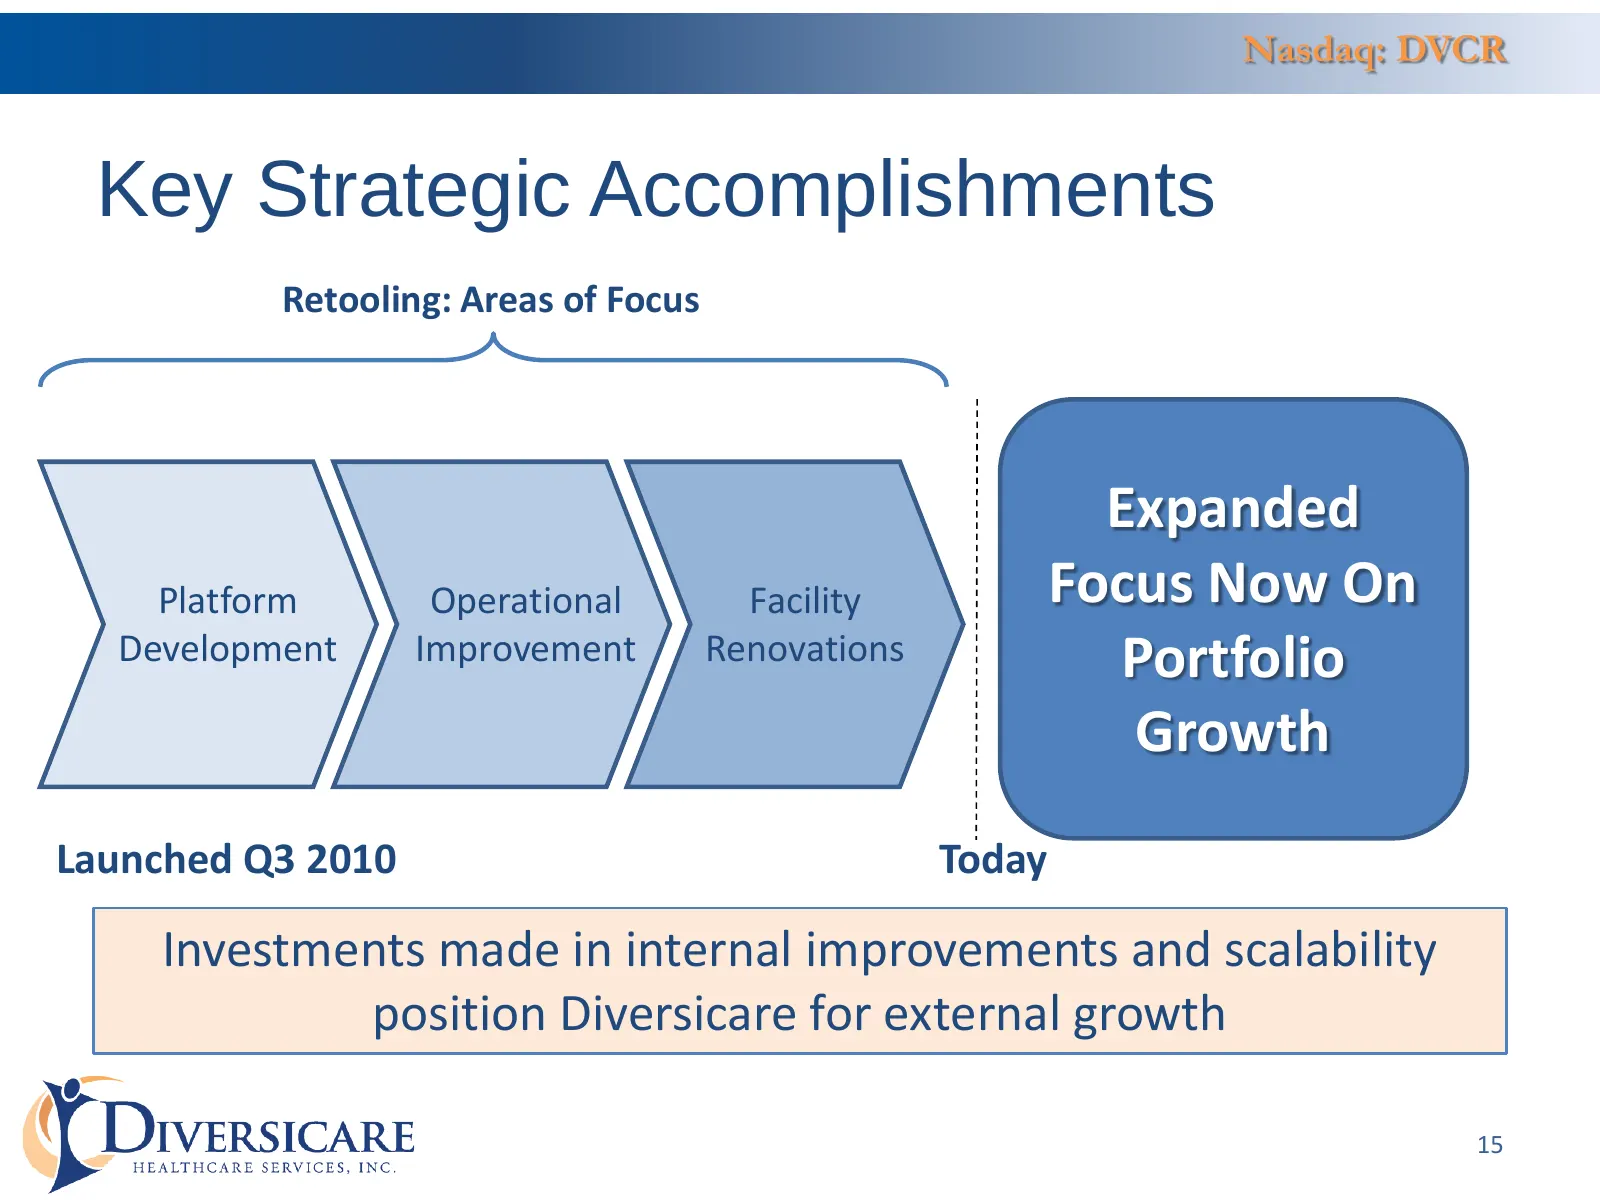
Nasdaq: DVCR Key Strategic Accomplishments Retooling: Areas of Focus Expanded Platform Operational Facility Focus Now On Development Improvement Renovations Portfolio Growth Launched Q3 2010 Today Investments made in internal improvements and scalability position Diversicare for external growth 15
Slide 16: Platform Development and Operational Improvements
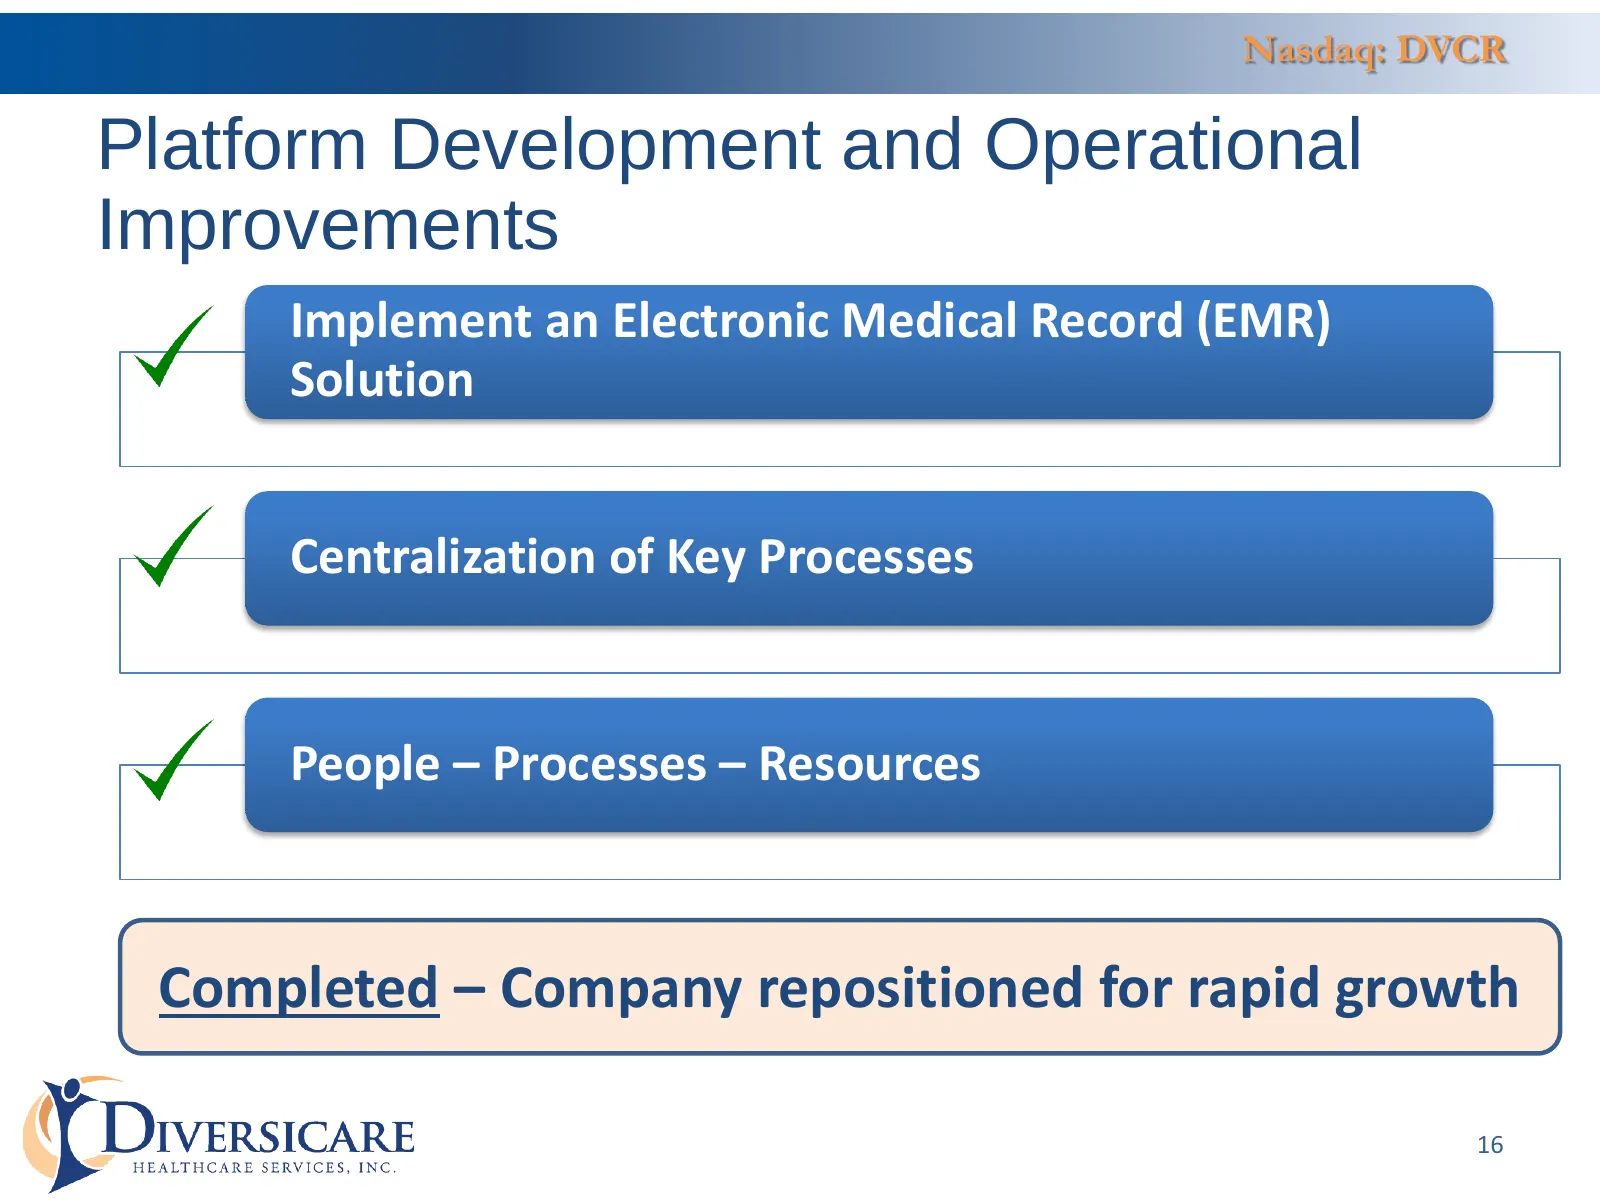
Nasdaq: DVCR Platform Development and Operational Improvements Implement an Electronic Medical Record (EMR) Solution Centralization of Key Processes People – Processes – Resources Completed – Company repositioned for rapid growth 16
Slide 17: Key Results and Outcomes
Nasdaq: DVCR Key Results and Outcomes • Improved Quality Measures • Improved patient mix and reimbursement rates • Improved operating and G&A leverage • Demonstrated growth through acquisitions 17
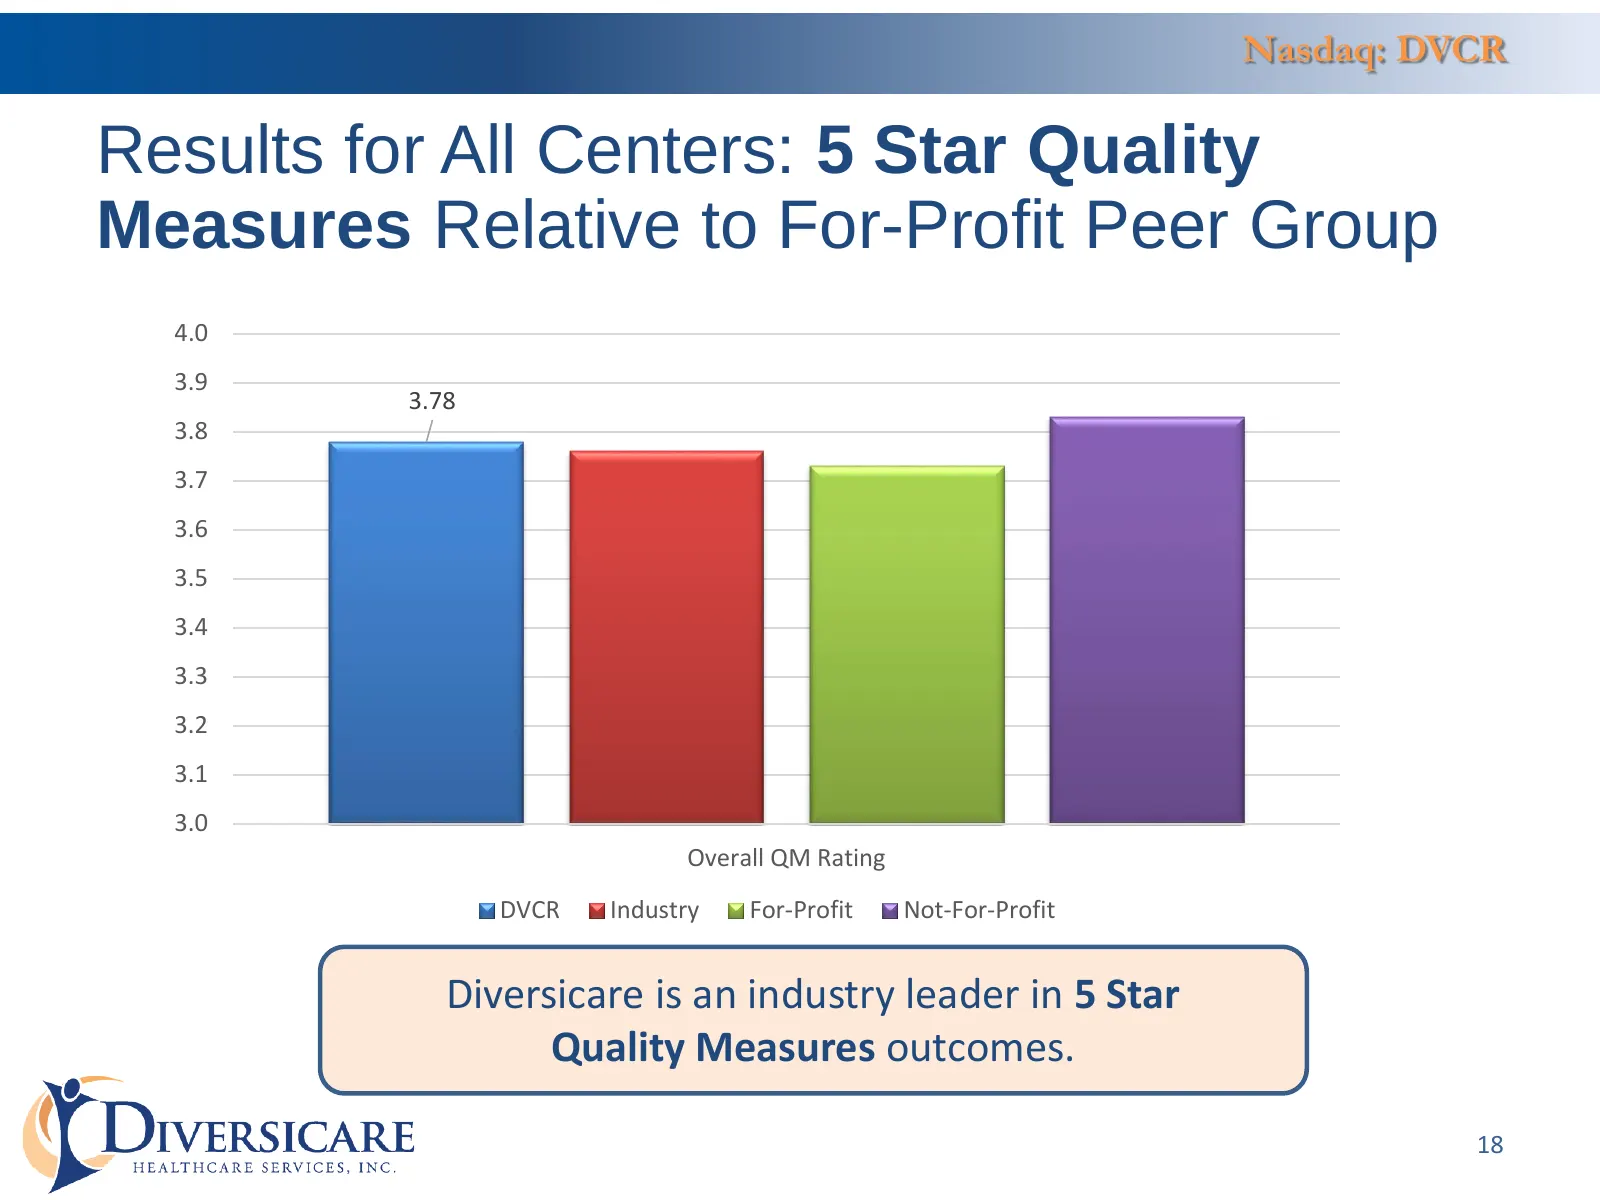
Slide 18: Results for All Centers: Star Quality Measures Relative to For-Profit Peer Group
Nasdaq: DVCR Results for All Centers: 5 Star Quality Measures Relative to For-Profit Peer Group 4.0 3.9 3.78 3.8 3.7 3.6 3.5 3.4 3.3 3.2 3.1 3.0 Overall QM Rating DVCR Industry For-Profit Not-For-Profit Diversicare is an industry leader in 5 Star Quality Measures outcomes. 18
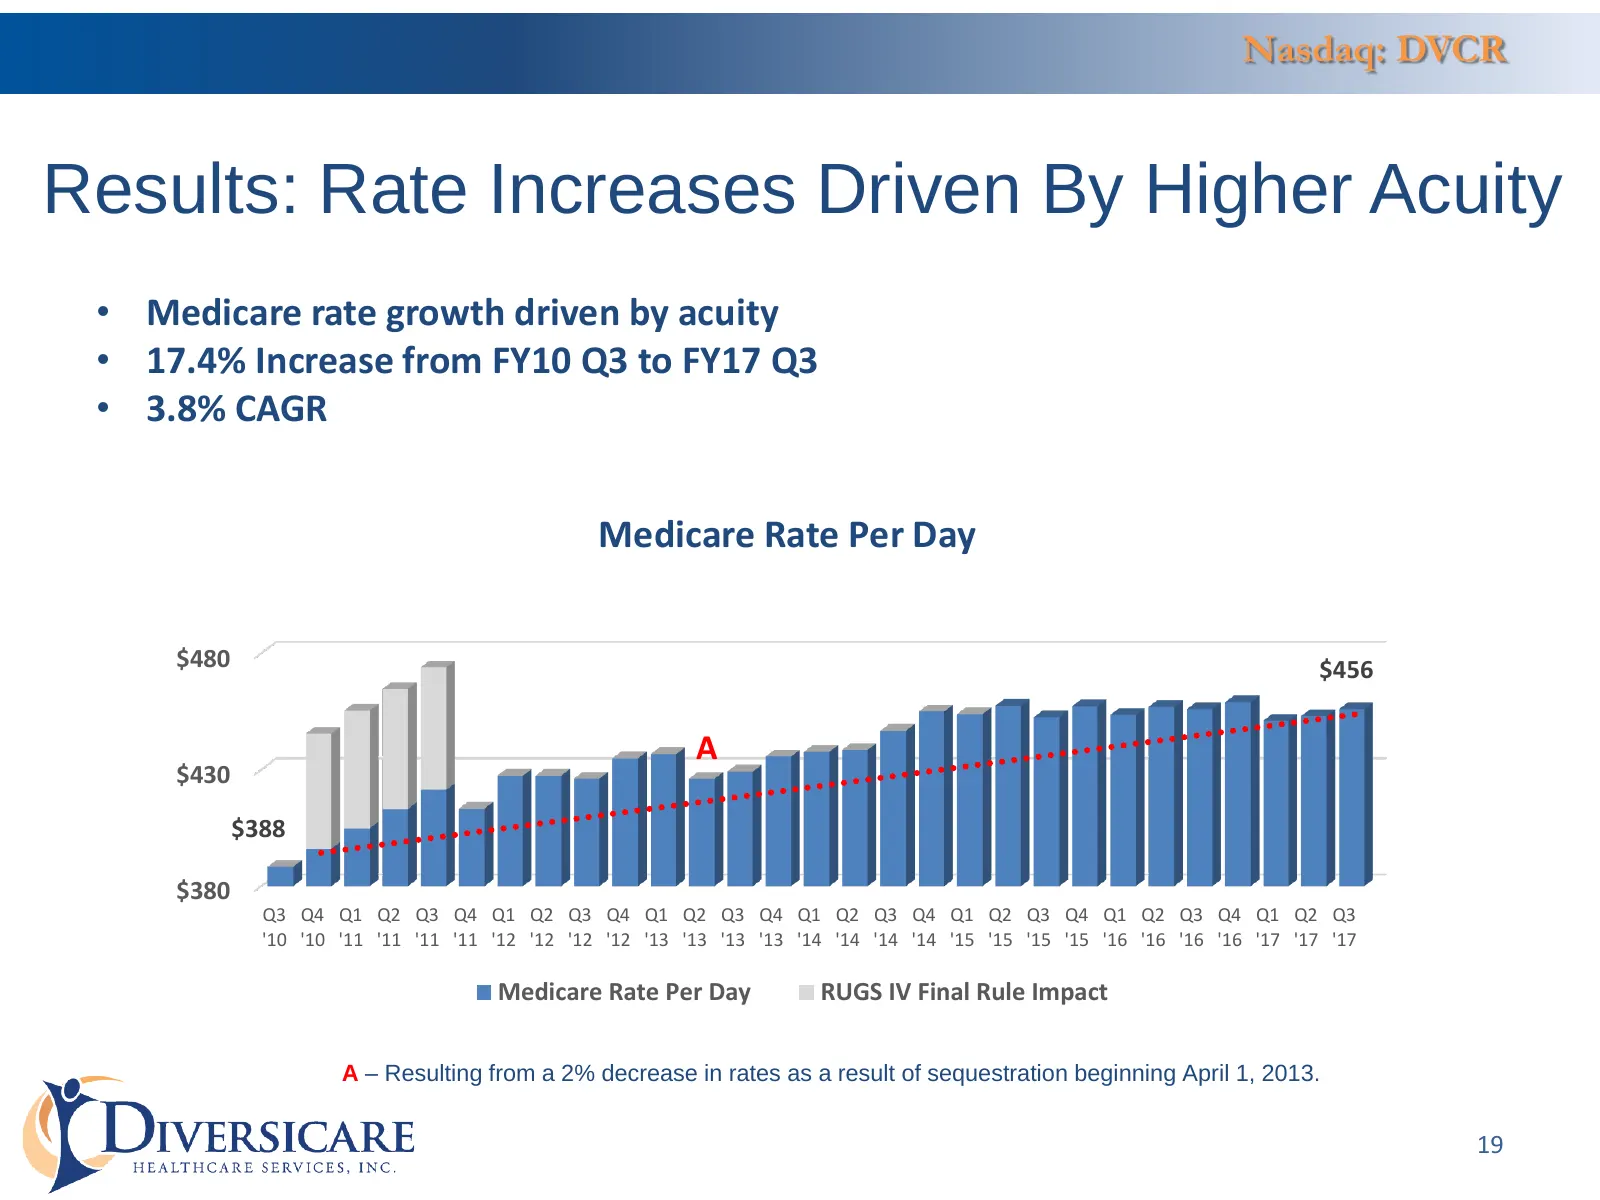
Slide 19: Results: Rate Increases Driven By Higher Acuity
Nasdaq: DVCR Results: Rate Increases Driven By Higher Acuity • Medicare rate growth driven by acuity • 17.4% Increase from FY10 Q3 to FY17 Q3 • 3.8% CAGR Medicare Rate Per Day $480 $456 A $430 $388 $380 Q3 Q4 Q1 Q2 Q3 Q4 Q1 Q2 Q3 Q4 Q1 Q2 Q3 Q4 Q1 Q2 Q3 Q4 Q1 Q2 Q3 Q4 Q1 Q2 Q3 Q4 Q1 Q2 Q3 '10 '10 '1
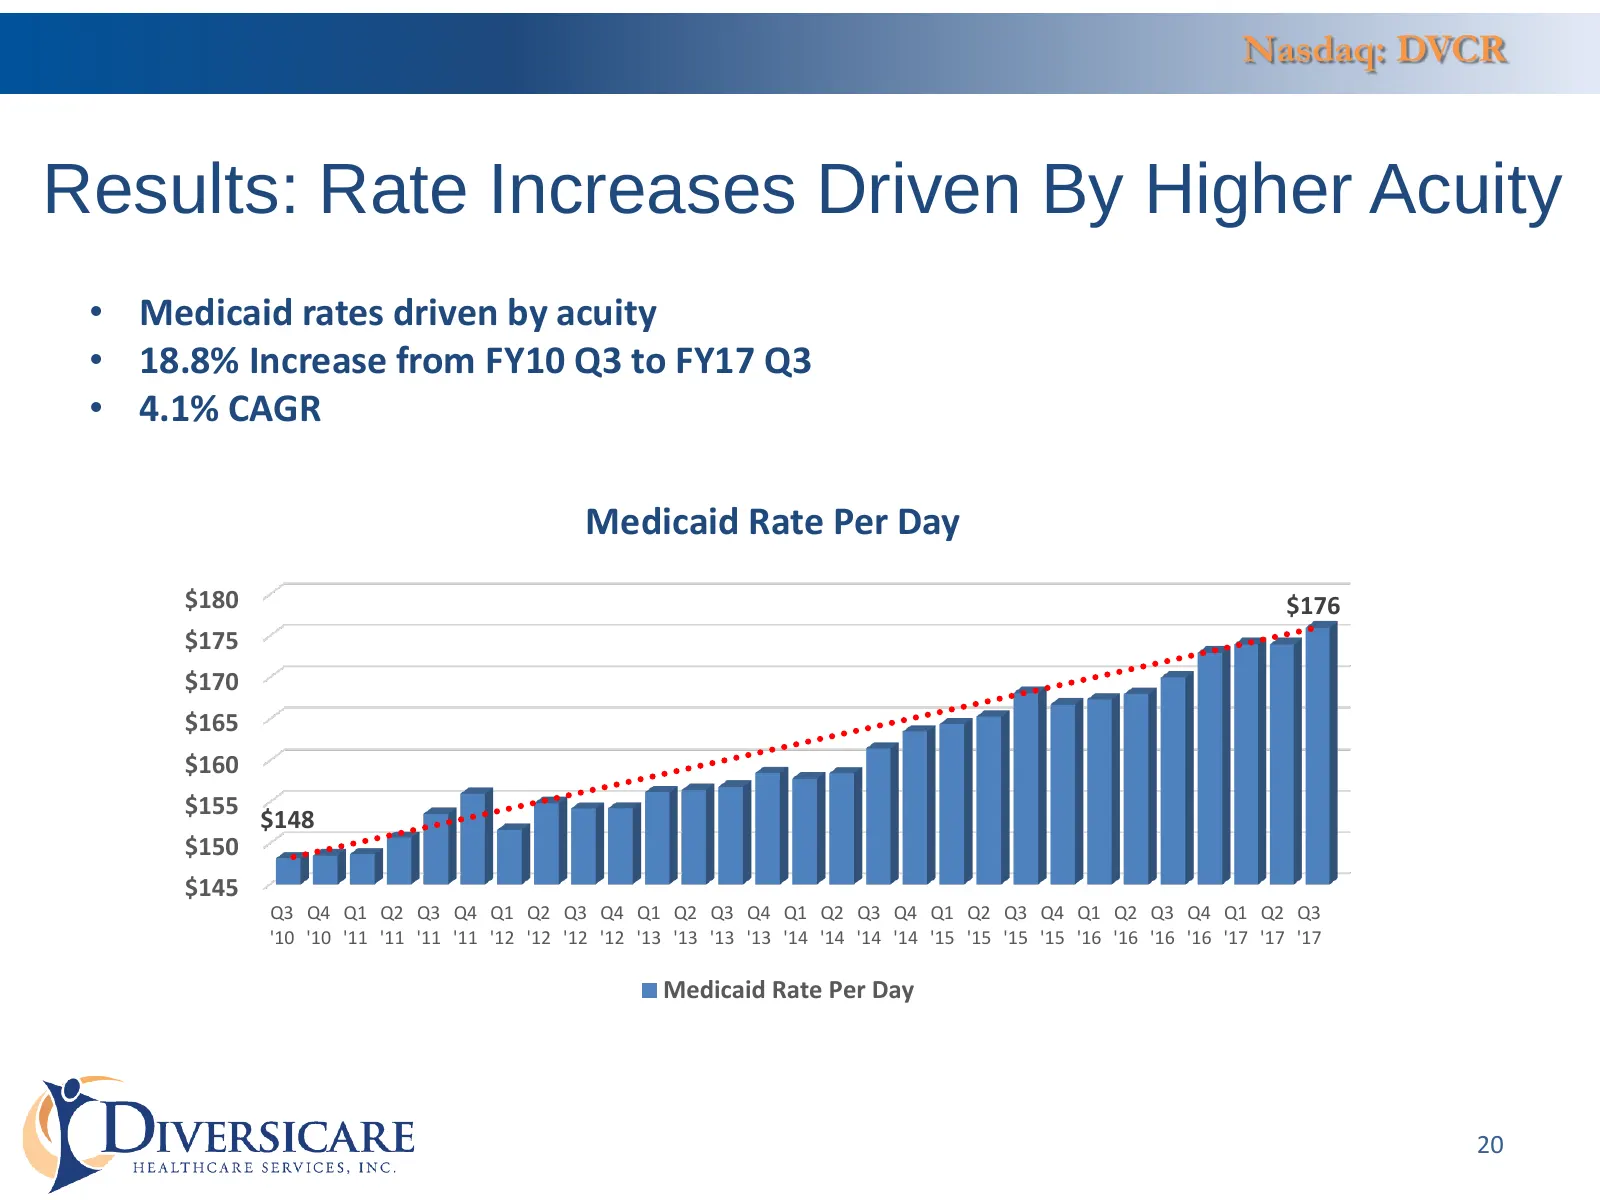
Slide 20: Results: Rate Increases Driven By Higher Acuity
Nasdaq: DVCR Results: Rate Increases Driven By Higher Acuity • Medicaid rates driven by acuity • 18.8% Increase from FY10 Q3 to FY17 Q3 • 4.1% CAGR Medicaid Rate Per Day $180 $176 $175 $170 $165 $160 $155 $148 $150 $145 Q3 Q4 Q1 Q2 Q3 Q4 Q1 Q2 Q3 Q4 Q1 Q2 Q3 Q4 Q1 Q2 Q3 Q4 Q1 Q2 Q3 Q4 Q1 Q2 Q3 Q4 Q1
Slide 21: Results: Growth in Operated Facilities
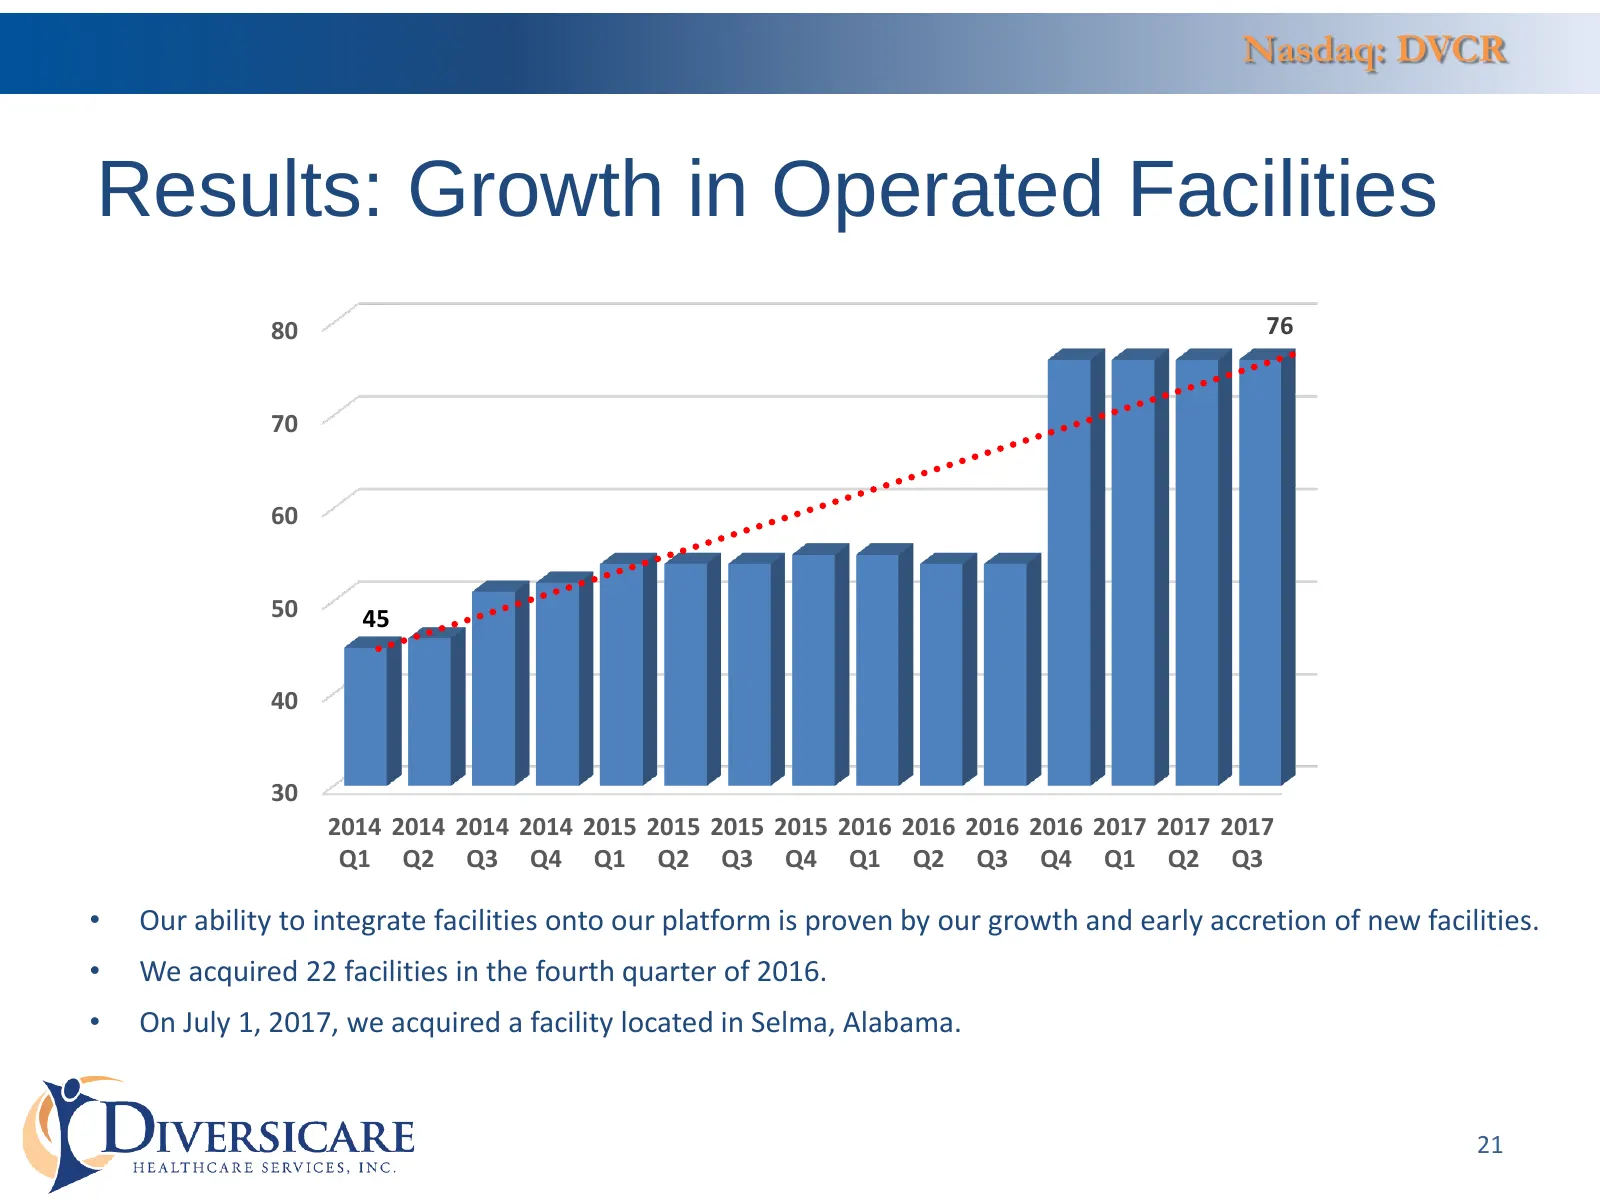
Nasdaq: DVCR Results: Growth in Operated Facilities 80 76 70 60 50 45 40 30 2014 2014 2014 2014 2015 2015 2015 2015 2016 2016 2016 2016 2017 2017 2017 Q1 Q2 Q3 Q4 Q1 Q2 Q3 Q4 Q1 Q2 Q3 Q4 Q1 Q2 Q3 • Our ability to integrate facilities onto our platform is proven by our growth and early accretion of n
Slide 22: Results: Impact Of New Centers
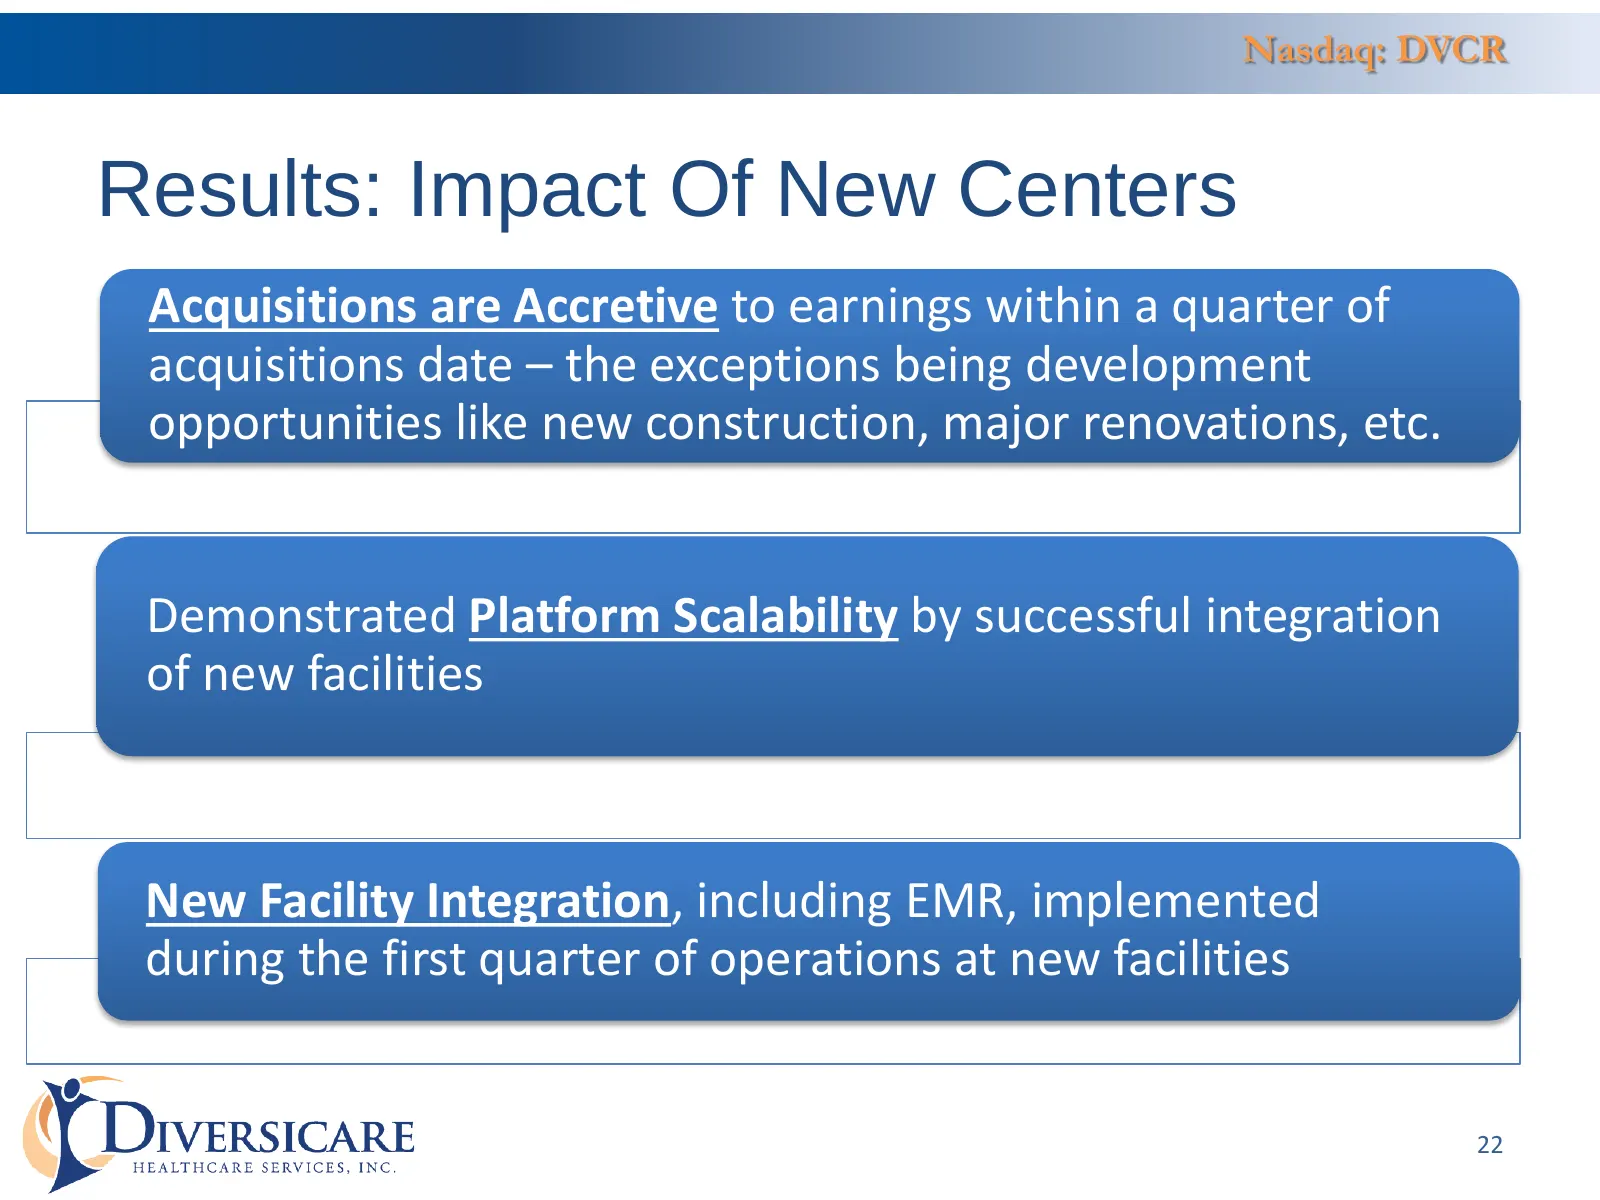
Nasdaq: DVCR Results: Impact Of New Centers Acquisitions are Accretive to earnings within a quarter of acquisitions date – the exceptions being development opportunities like new construction, major renovations, etc. Demonstrated Platform Scalability by successful integration of new facilities New F
Slide 23: Results: Revenue Impact of Acquisitions
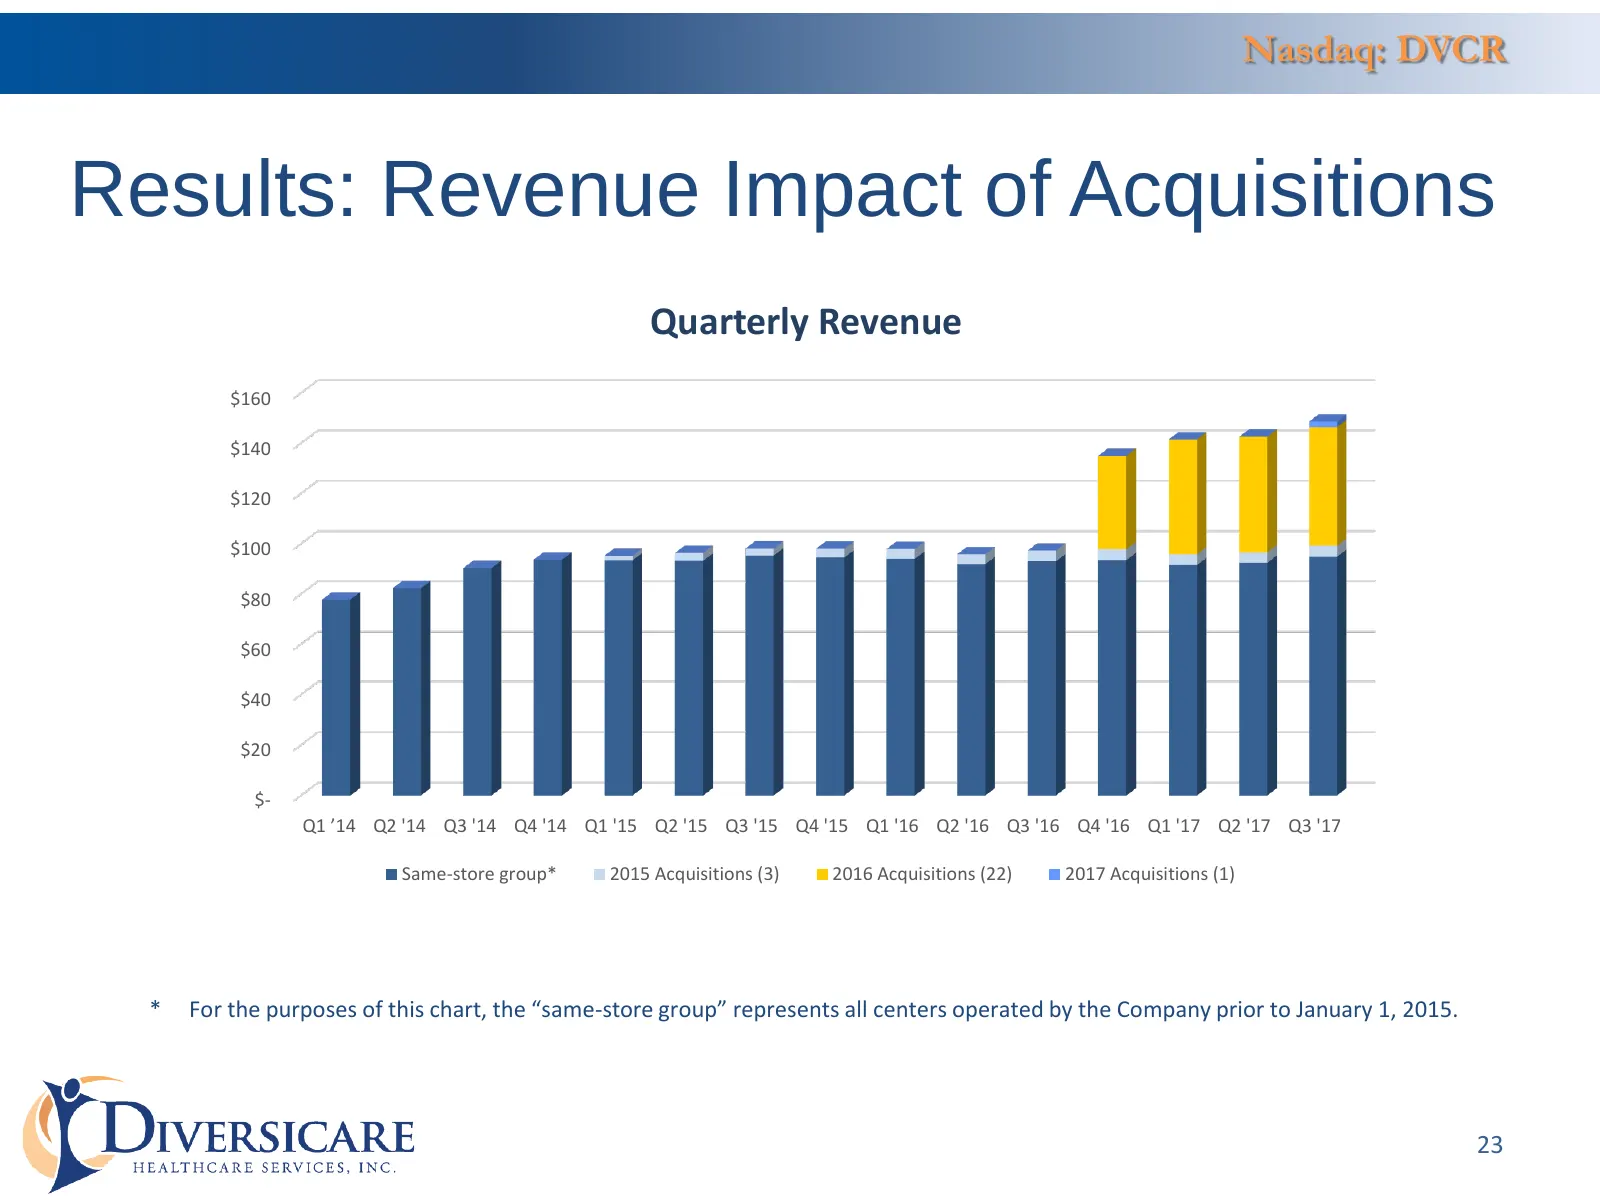
Nasdaq: DVCR Results: Revenue Impact of Acquisitions Quarterly Revenue $160 $140 $120 $100 $80 $60 $40 $20 $- Q1 ’14 Q2 '14 Q3 '14 Q4 '14 Q1 '15 Q2 '15 Q3 '15 Q4 '15 Q1 '16 Q2 '16 Q3 '16 Q4 '16 Q1 '17 Q2 '17 Q3 '17 Same-store group* 2015 Acquisitions (3) 2016 Acquisitions (22) 2017 Acquisitions (1)
Slide 24: Results: New Centers and Same-Store
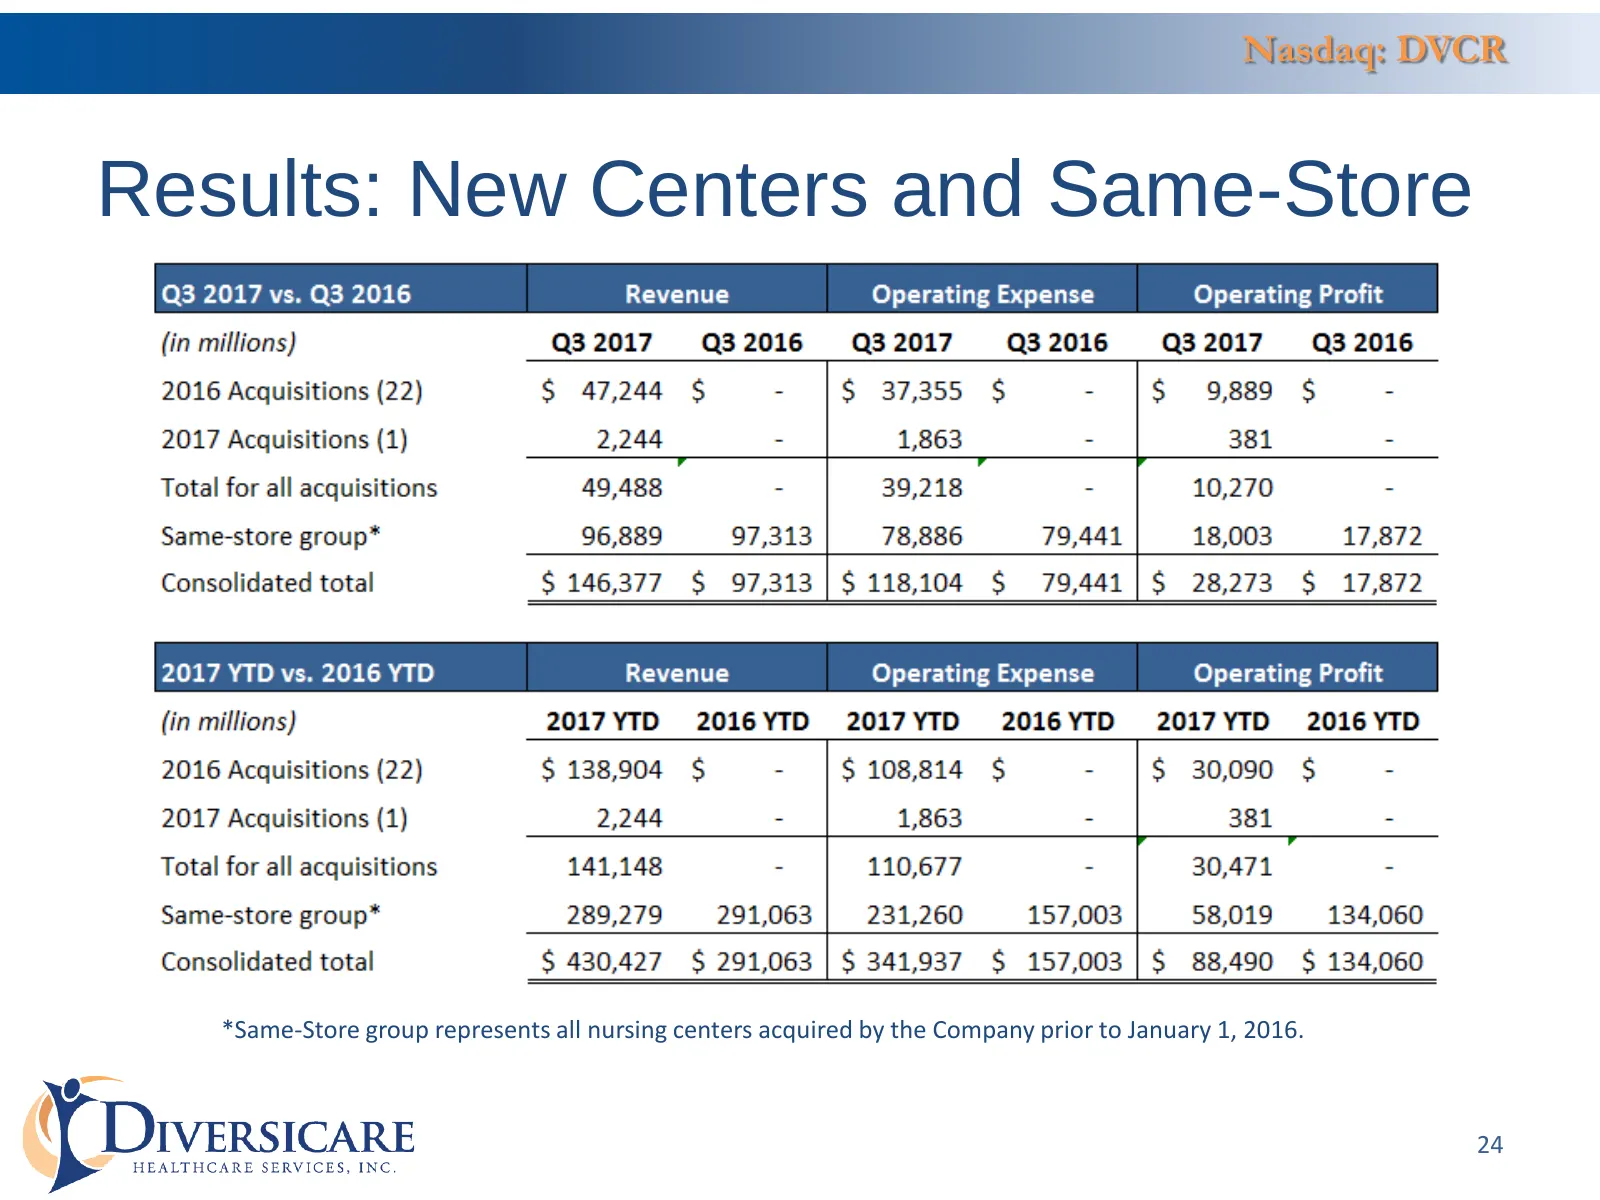
Nasdaq: DVCR Results: New Centers and Same-Store *Same-Store group represents all nursing centers acquired by the Company prior to January 1, 2016. 24
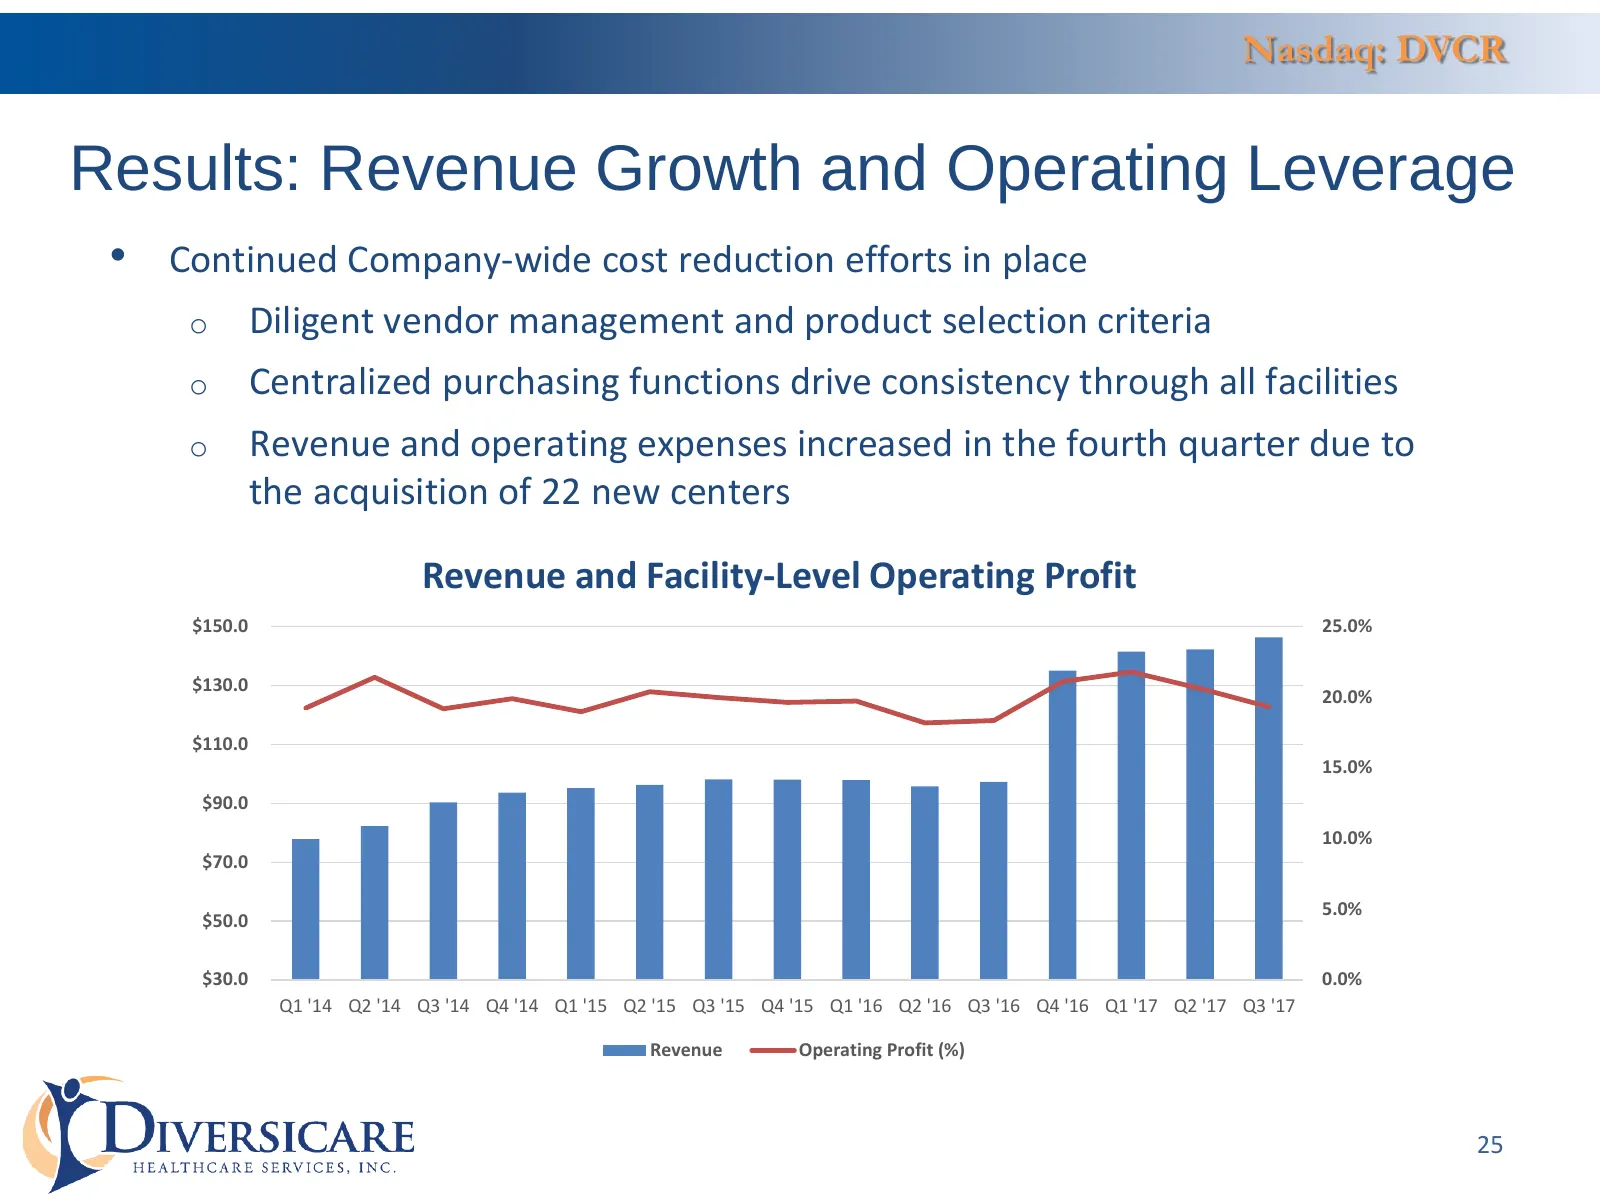
Slide 25: Results: Revenue Growth and Operating Leverage
Nasdaq: DVCR Results: Revenue Growth and Operating Leverage • Continued Company-wide cost reduction efforts in place o Diligent vendor management and product selection criteria o Centralized purchasing functions drive consistency through all facilities o Revenue and operating expenses increased in t
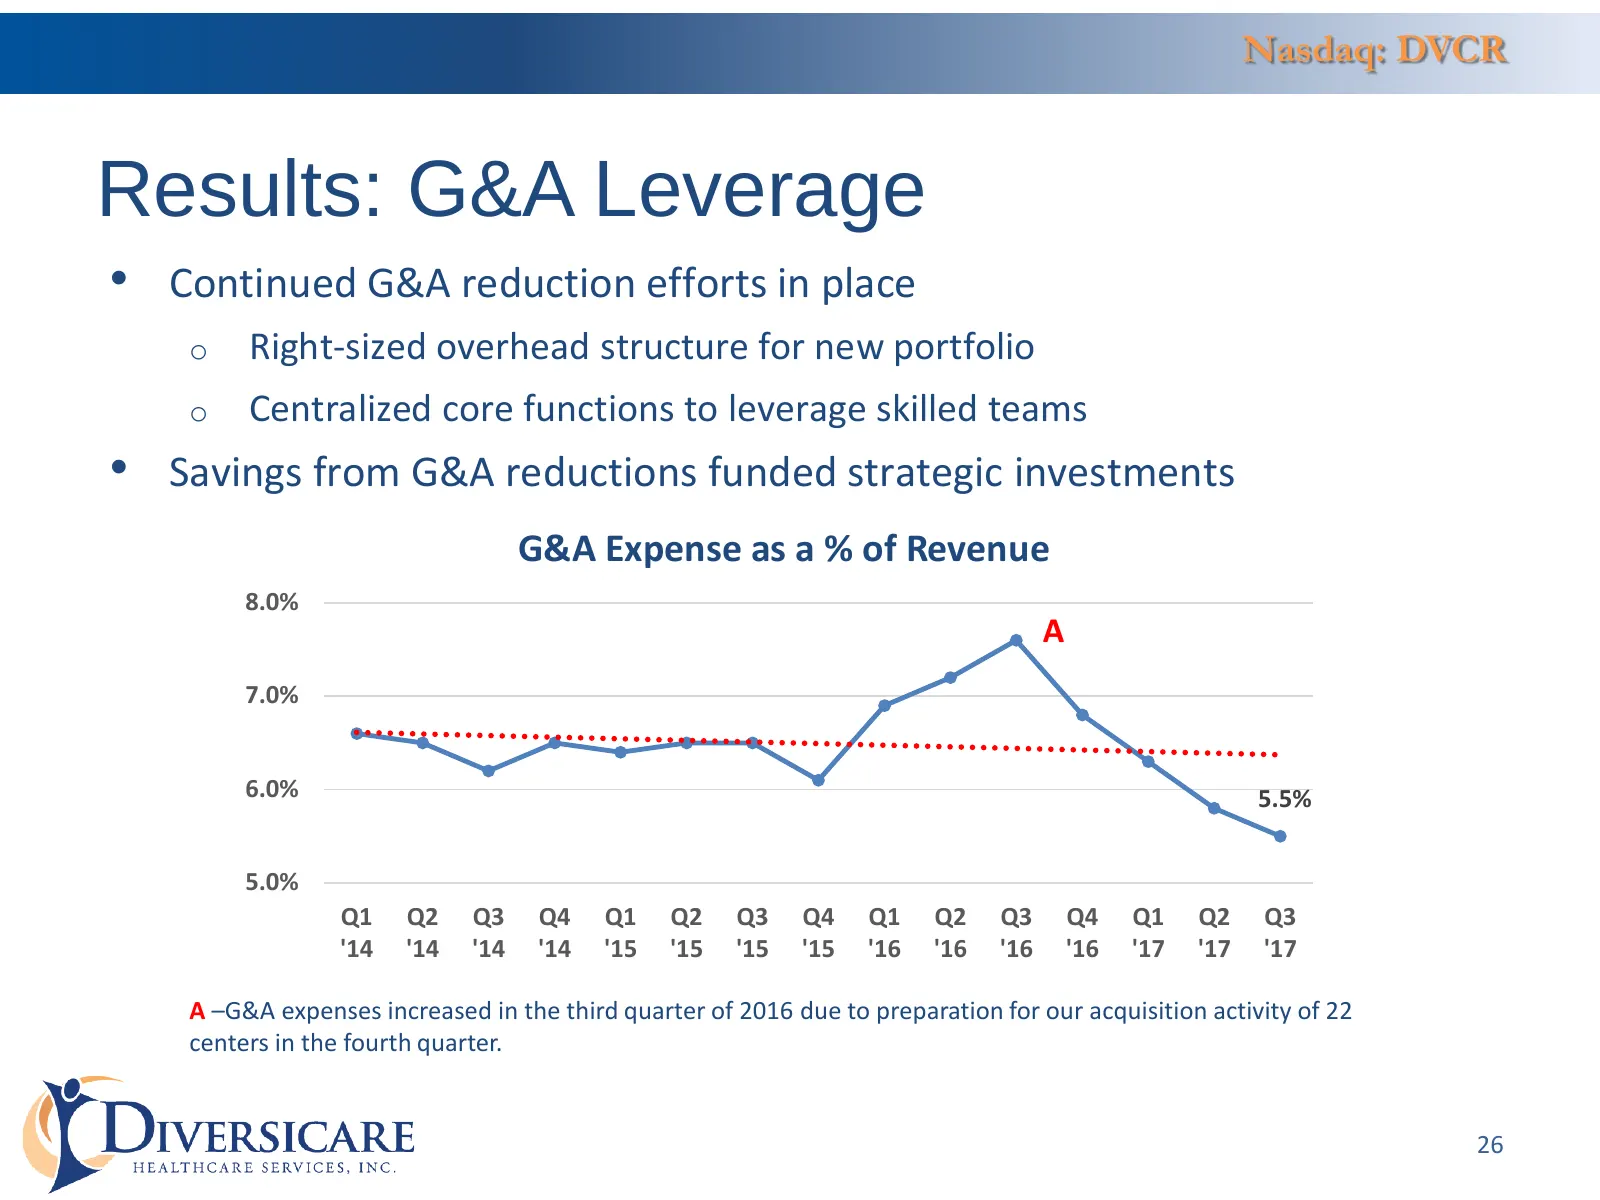
Slide 26: Results: G&A Leverage
Nasdaq: DVCR Results: G&A Leverage • Continued G&A reduction efforts in place o Right-sized overhead structure for new portfolio o Centralized core functions to leverage skilled teams • Savings from G&A reductions funded strategic investments G&A Expense as a % of Revenue 8.0% A 7.0% 6.0% 5.5% 5.0%
Slide 27: Current Areas of Focus
Nasdaq: DVCR Current Areas of Focus • Continuous quality improvement • Enhancing existing portfolio • Growth through accretive acquisitions 27
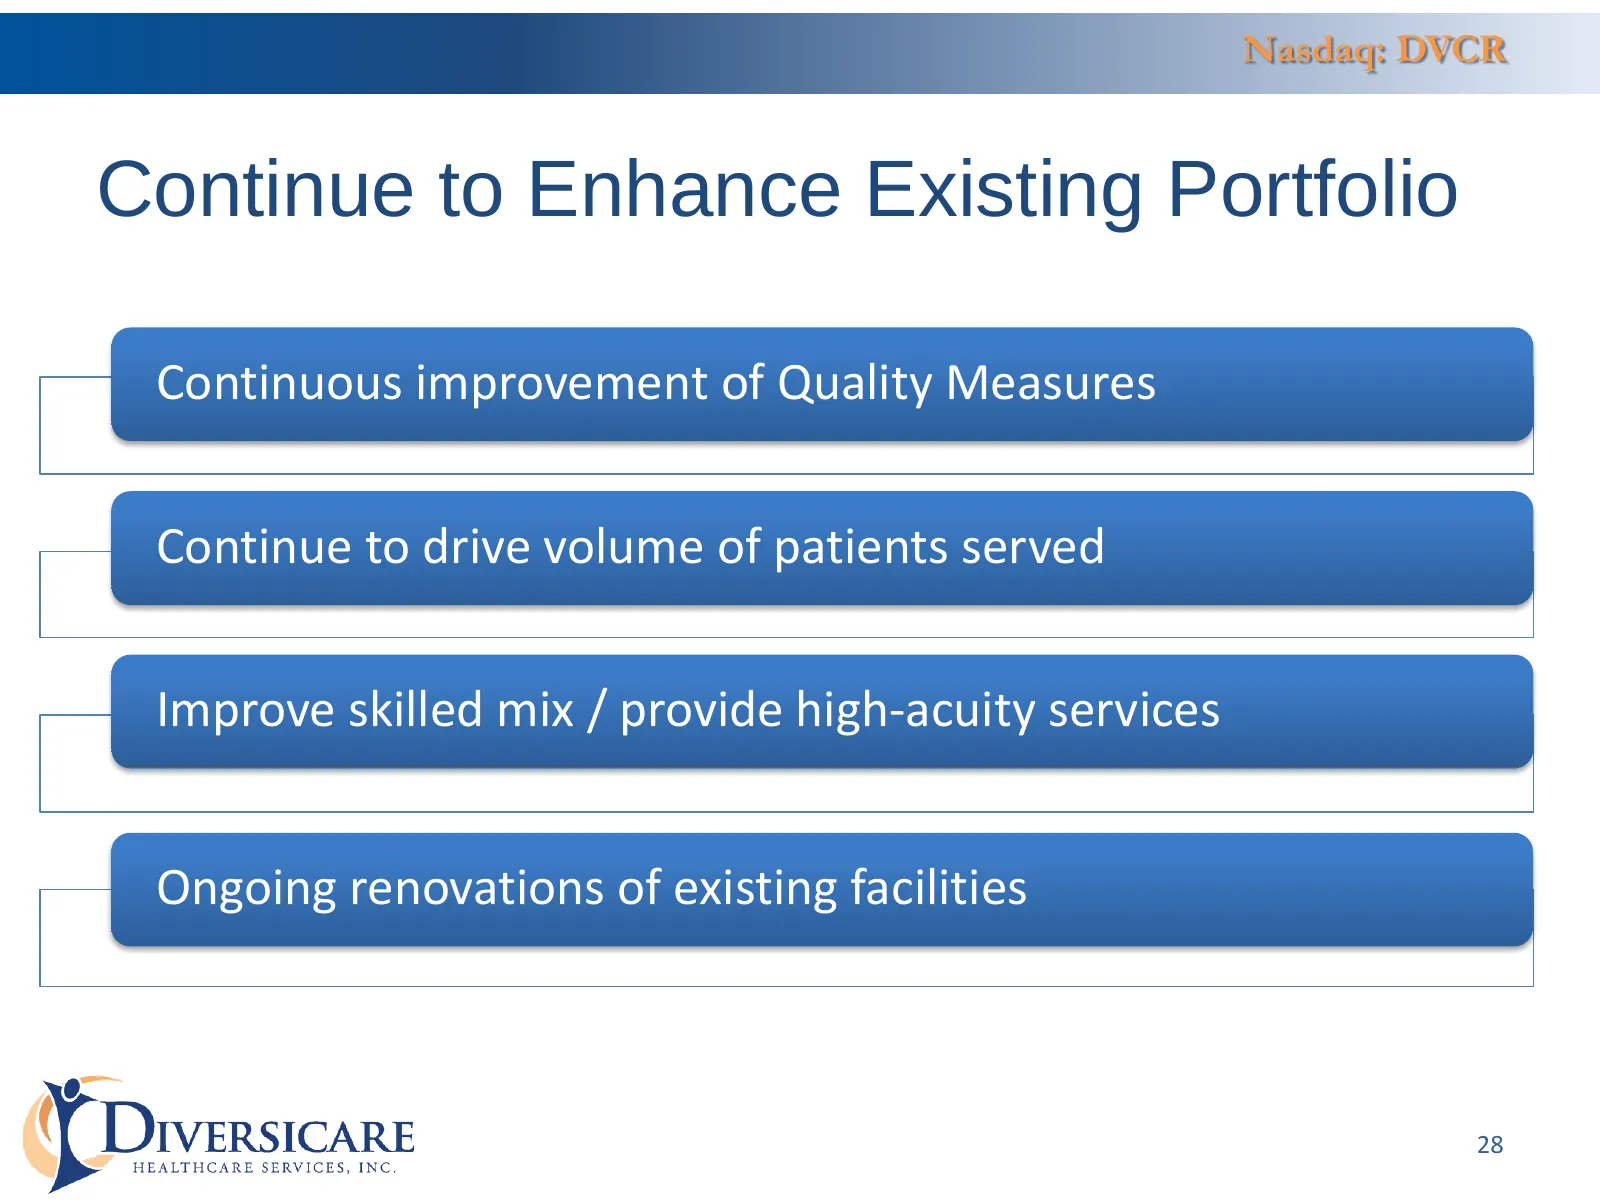
Slide 28: Continue to Enhance Existing Portfolio
Nasdaq: DVCR Continue to Enhance Existing Portfolio Continuous improvement of Quality Measures Continue to drive volume of patients served Improve skilled mix / provide high-acuity services Ongoing renovations of existing facilities 28
Slide 29: Portfolio Growth
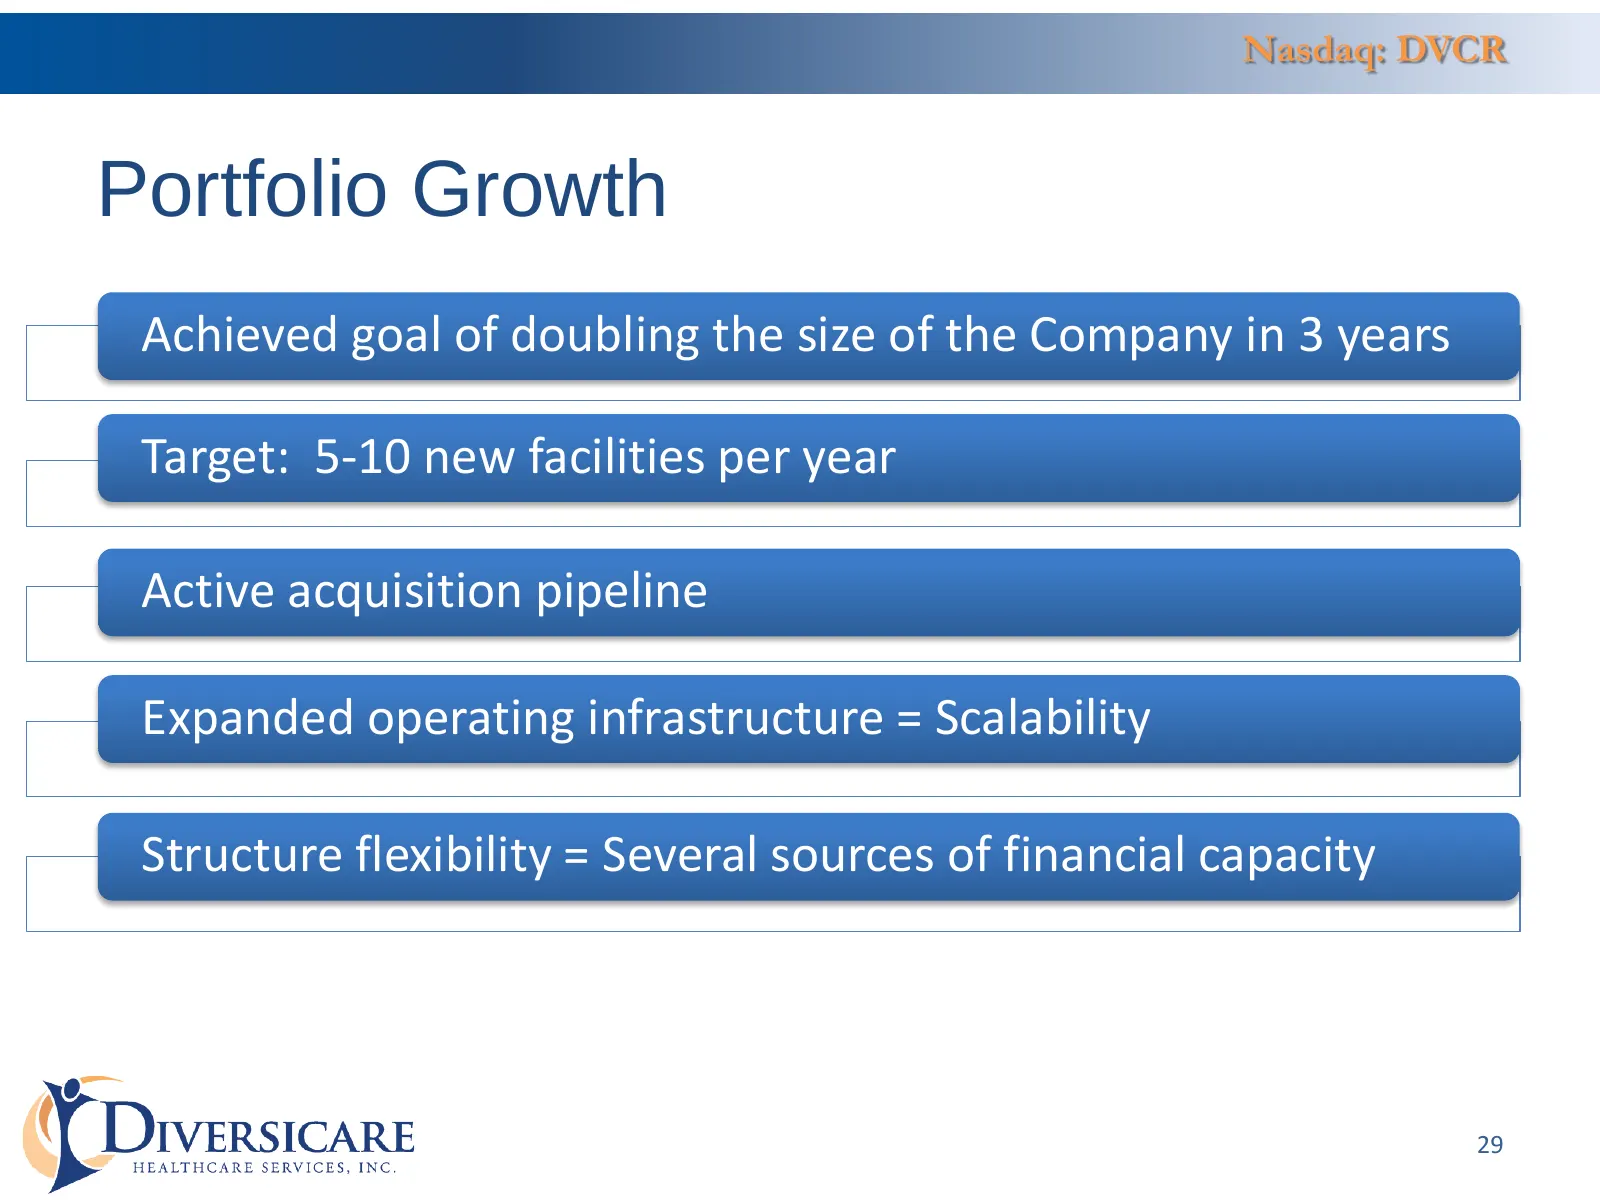
Nasdaq: DVCR Portfolio Growth Achieved goal of doubling the size of the Company in 3 years Target: 5-10 new facilities per year Active acquisition pipeline Expanded operating infrastructure = Scalability Structure flexibility = Several sources of financial capacity 29
Slide 30: Flexible Structure Broadens Pipeline
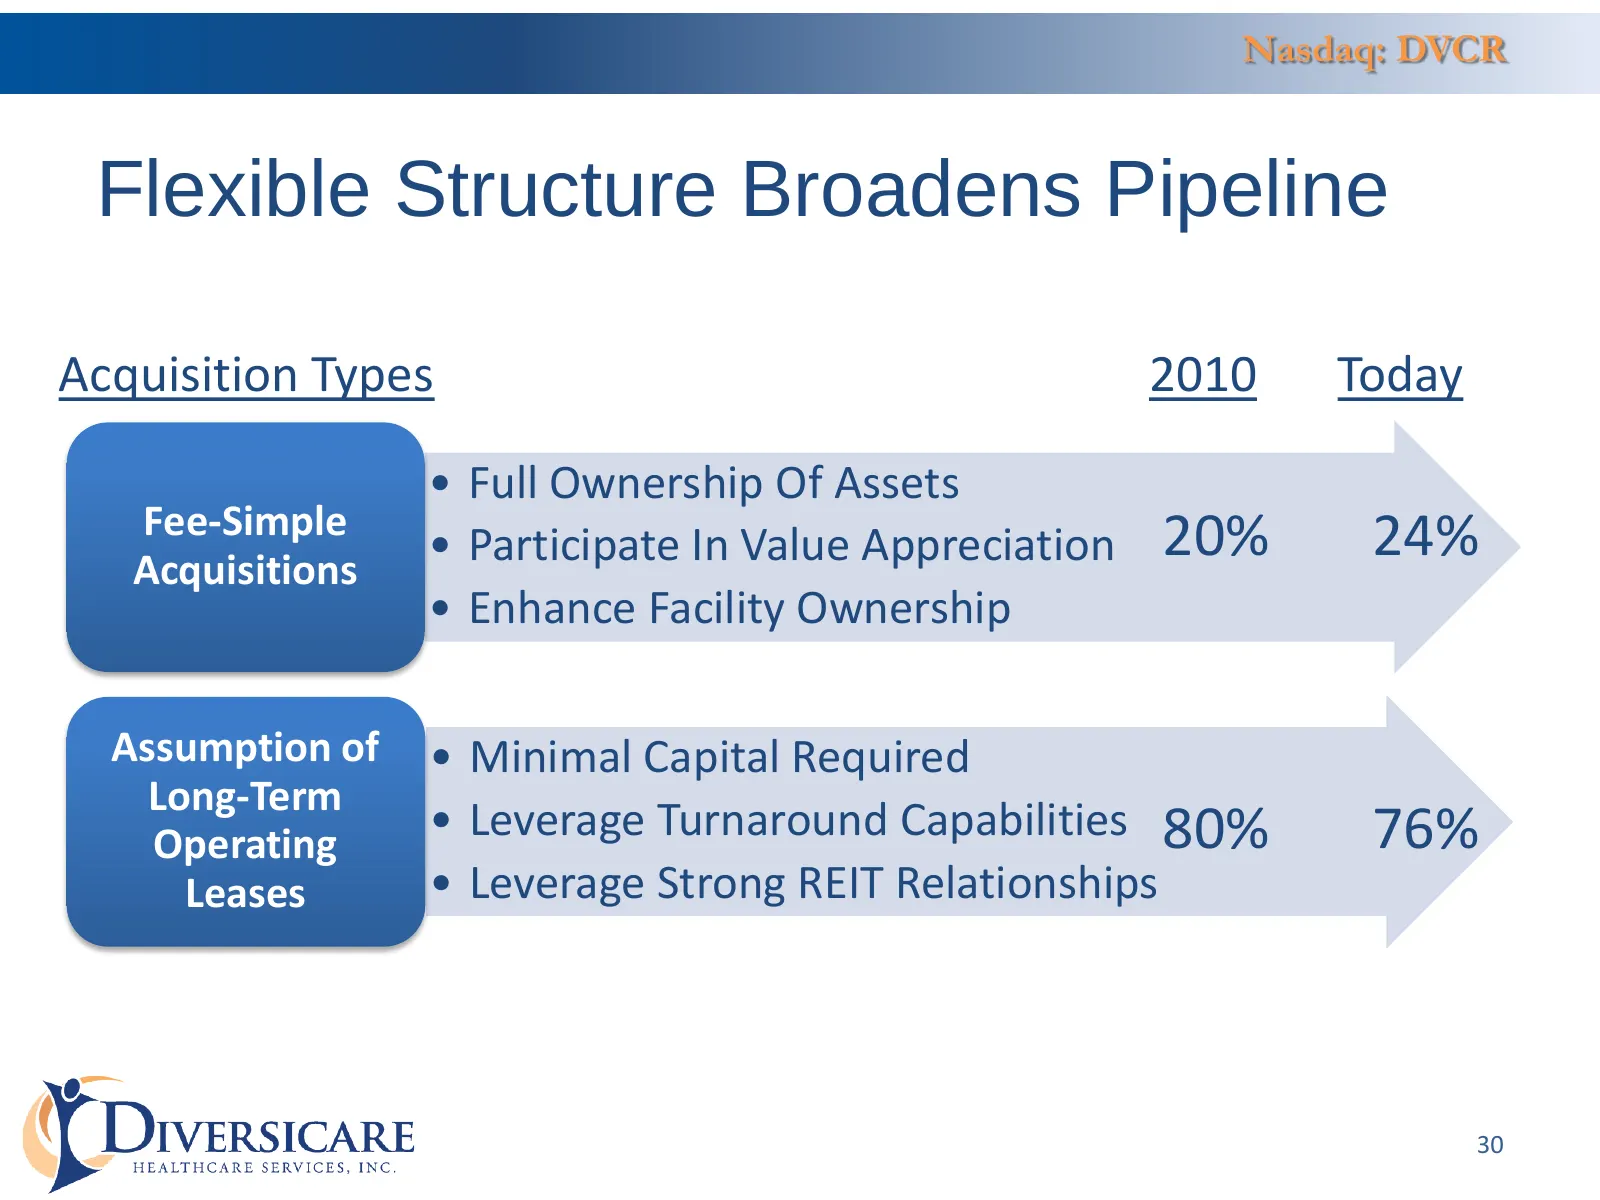
Nasdaq: DVCR Flexible Structure Broadens Pipeline Acquisition Types 2010 Today • Full Ownership Of Assets Fee-Simple 20% 24% Acquisitions • Participate In Value Appreciation • Enhance Facility Ownership Assumption of • Minimal Capital Required Long-Term Operating • Leverage Turnaround Capabilities 8
Slide 31: Summary
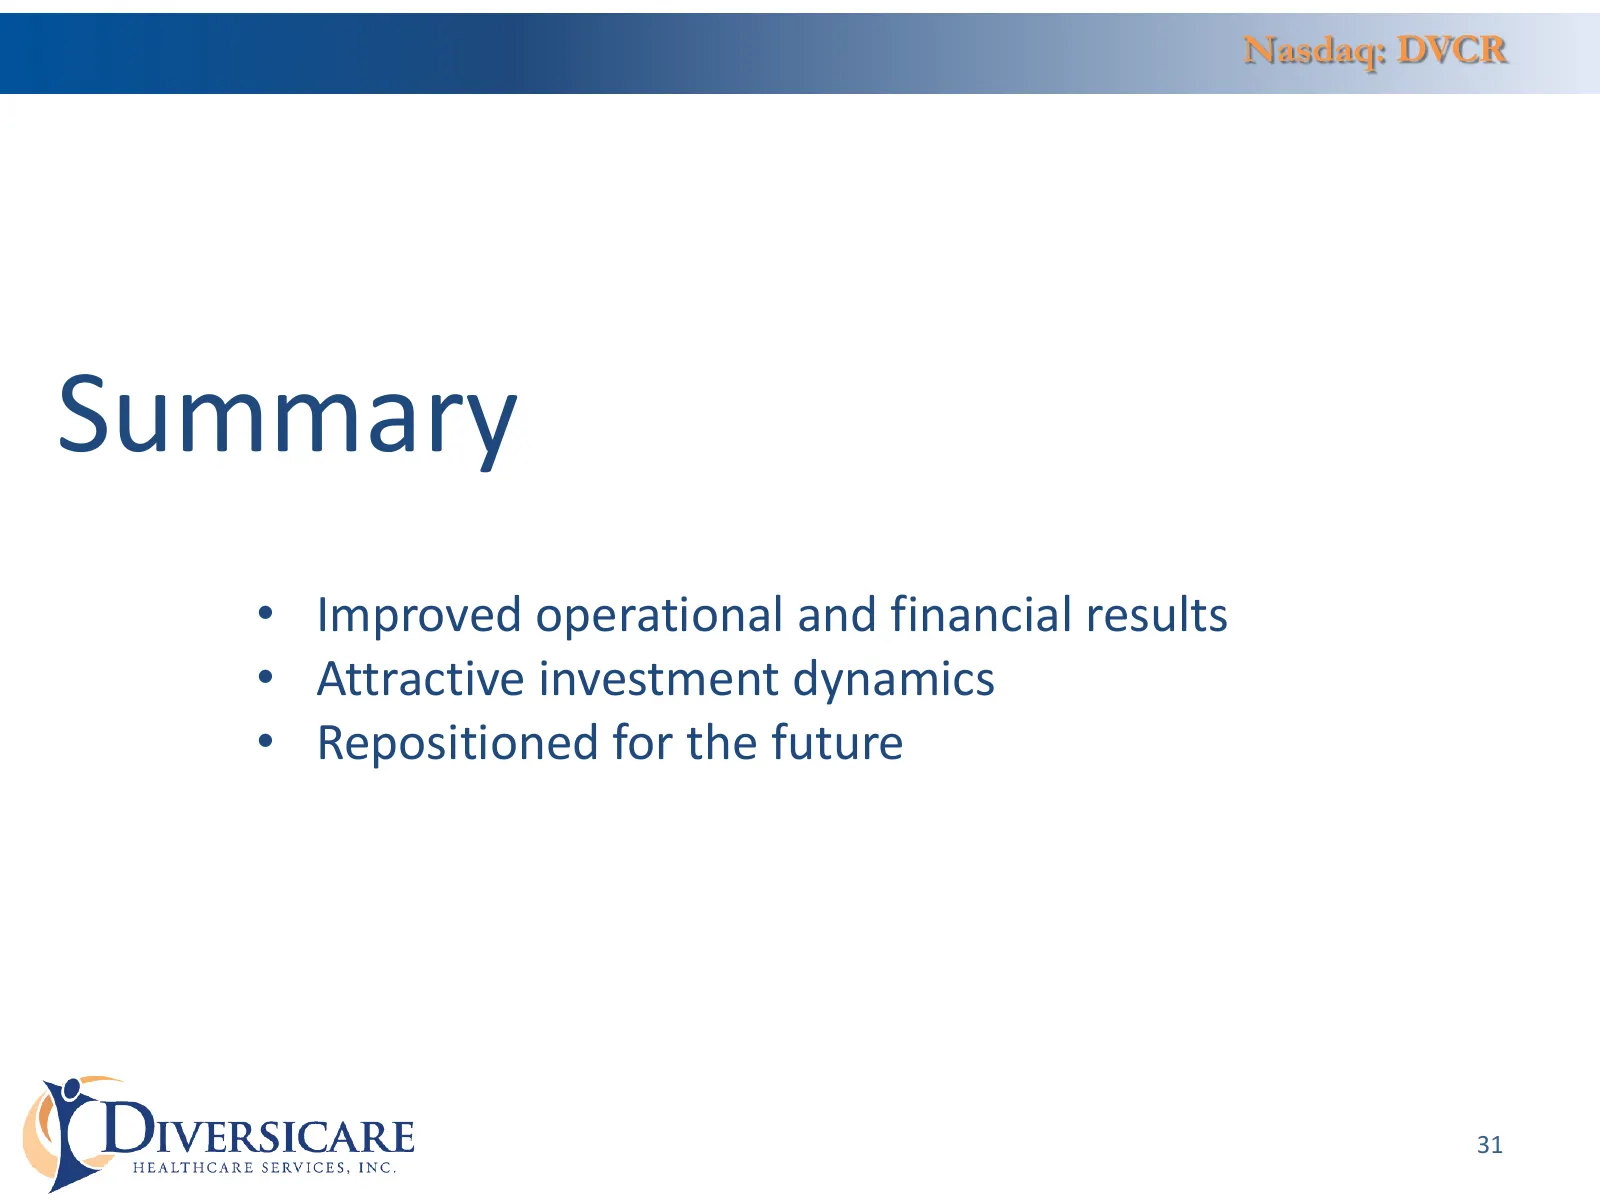
Nasdaq: DVCR Summary • Improved operational and financial results • Attractive investment dynamics • Repositioned for the future 31
Slide 32: Key Financial and Operating Statistics
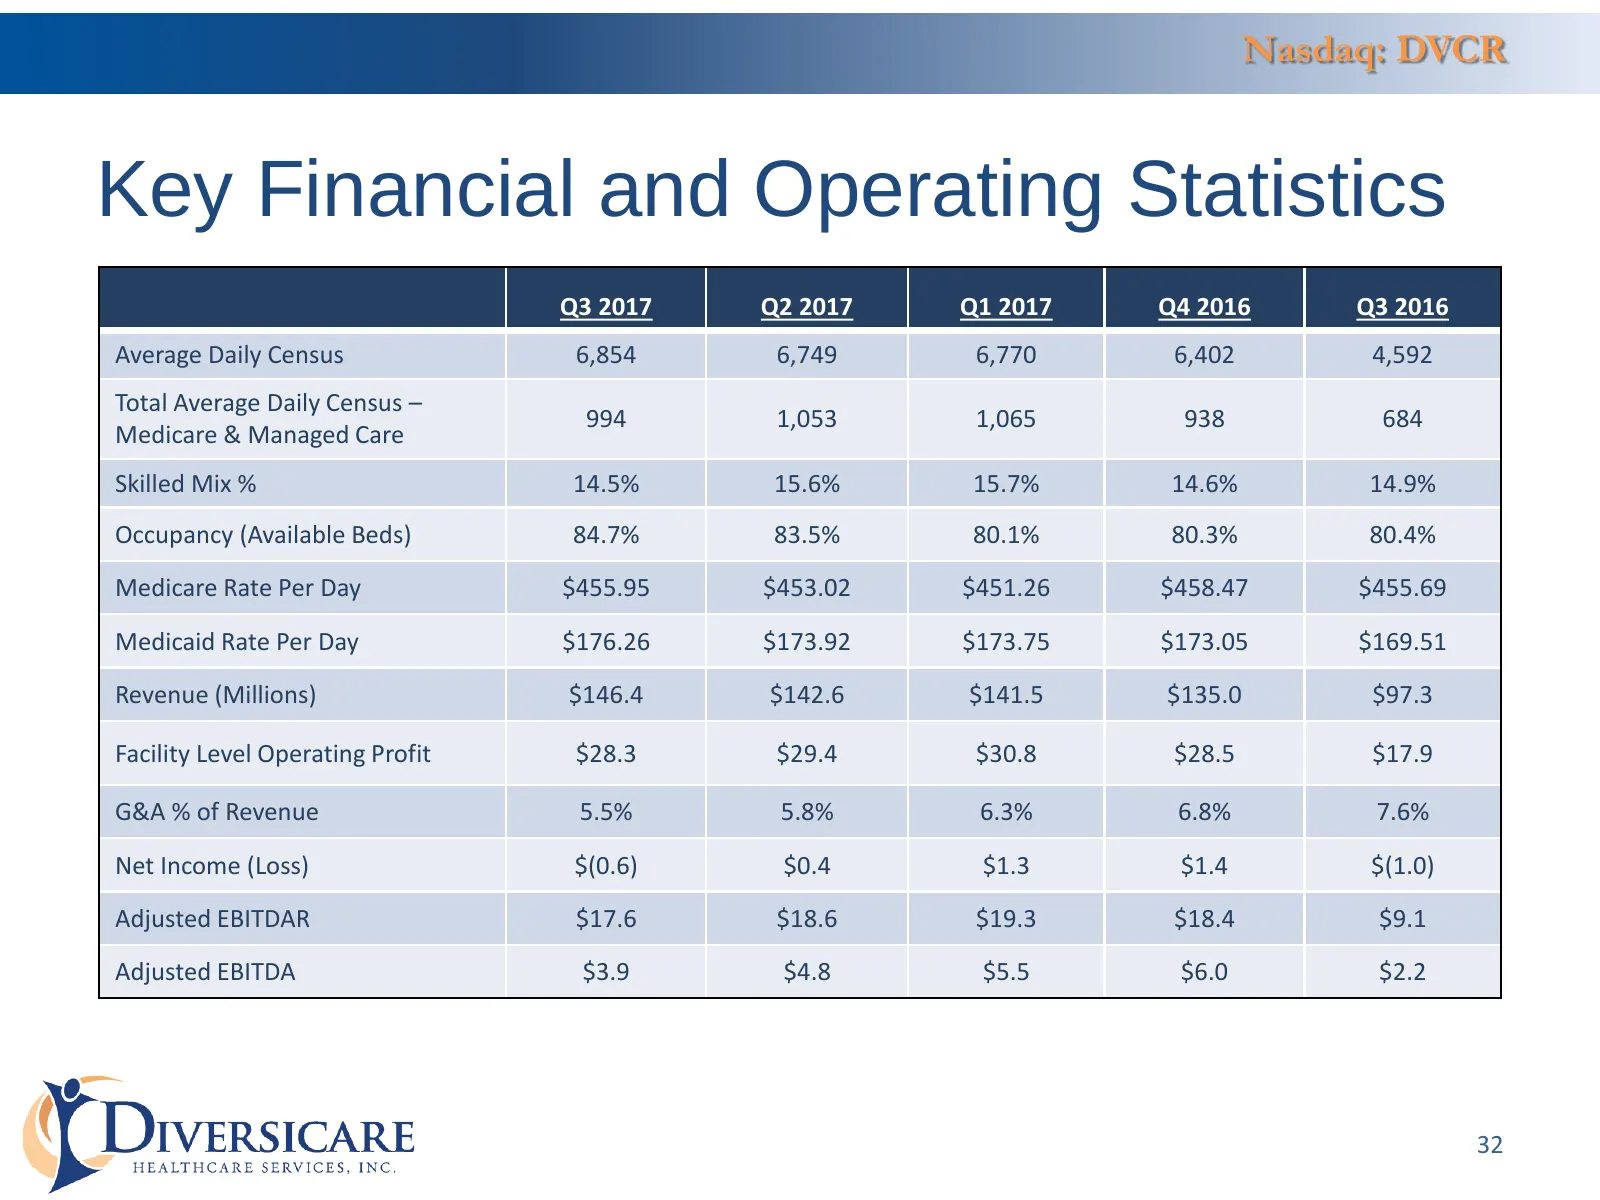
Nasdaq: DVCR Key Financial and Operating Statistics Q3 2017 Q2 2017 Q1 2017 Q4 2016 Q3 2016 Average Daily Census 6,854 6,749 6,770 6,402 4,592 Total Average Daily Census – 994 1,053 1,065 938 684 Medicare & Managed Care Skilled Mix % 14.5% 15.6% 15.7% 14.6% 14.9% Occupancy (Available Beds) 84.7% 83.
Slide 33: Investment Highlights
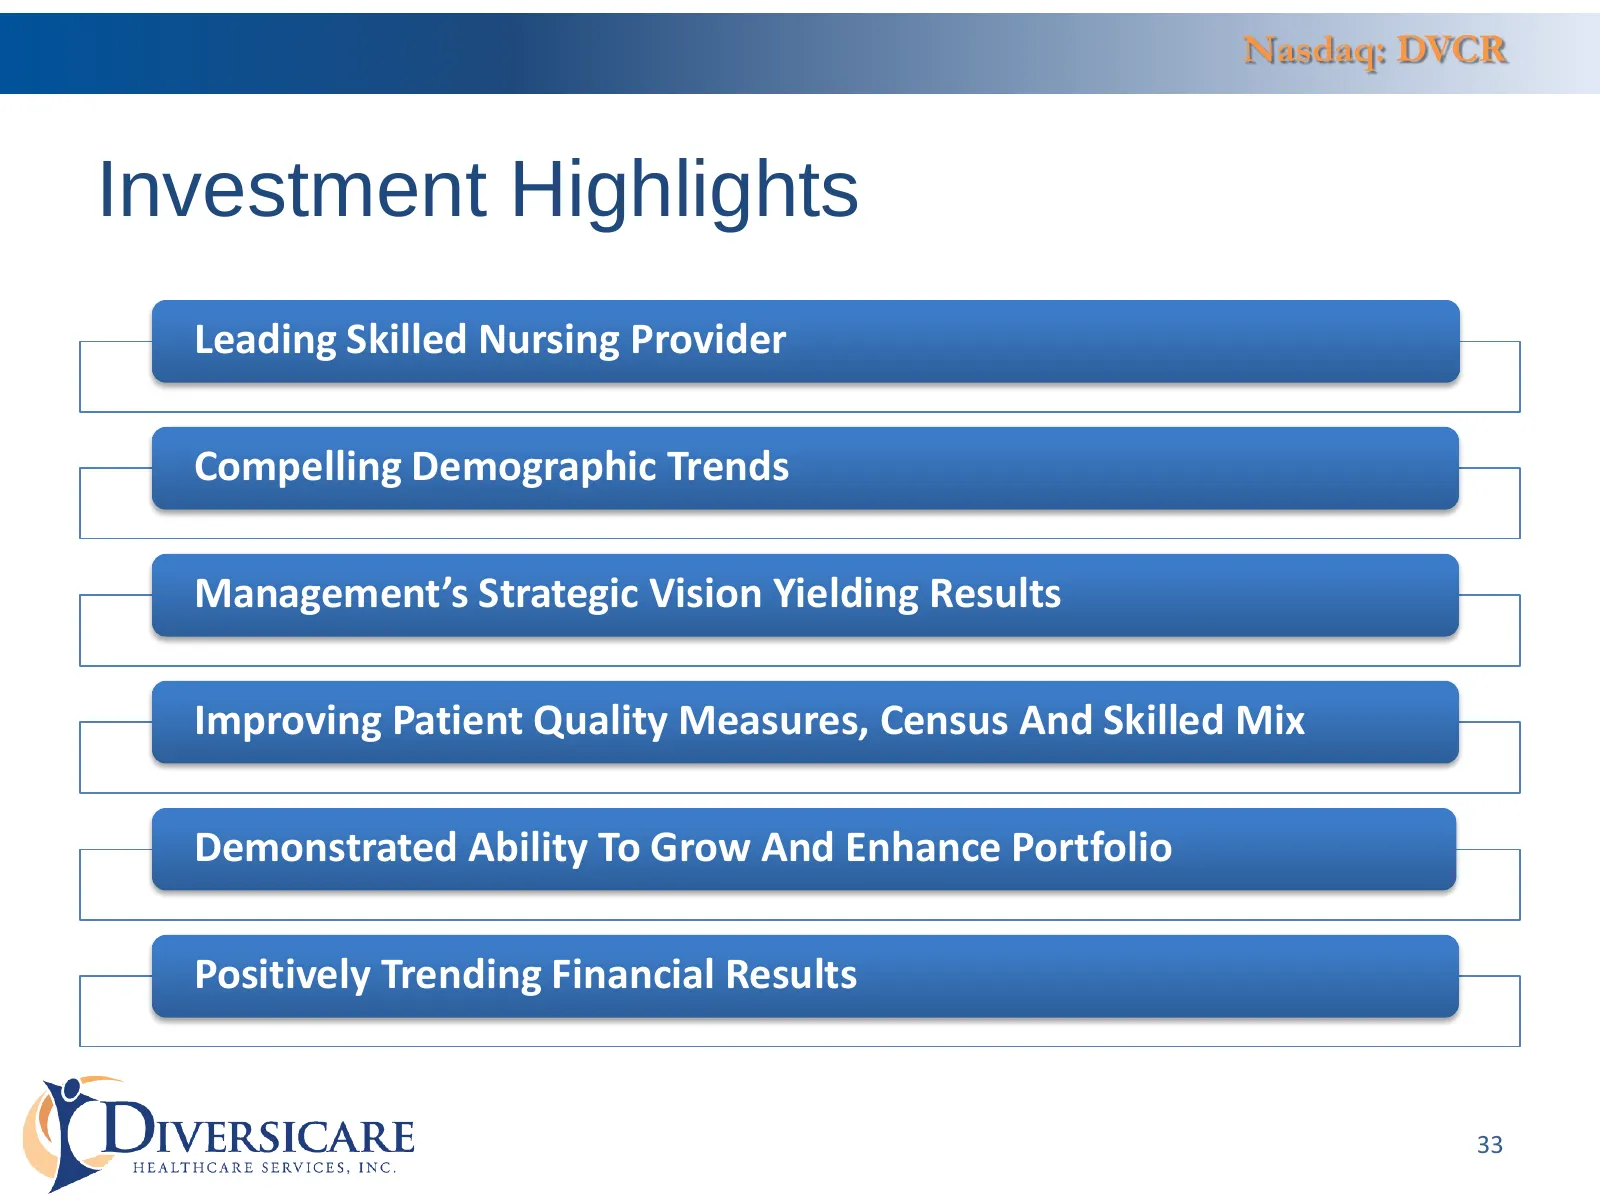
Nasdaq: DVCR Investment Highlights Leading Skilled Nursing Provider Compelling Demographic Trends Management’s Strategic Vision Yielding Results Improving Patient Quality Measures, Census And Skilled Mix Demonstrated Ability To Grow And Enhance Portfolio Positively Trending Financial Results 33
Slide 34: Appendix A: Reconciliation of Net Income to Adjusted EBITDA and Adjusted EBITDAR
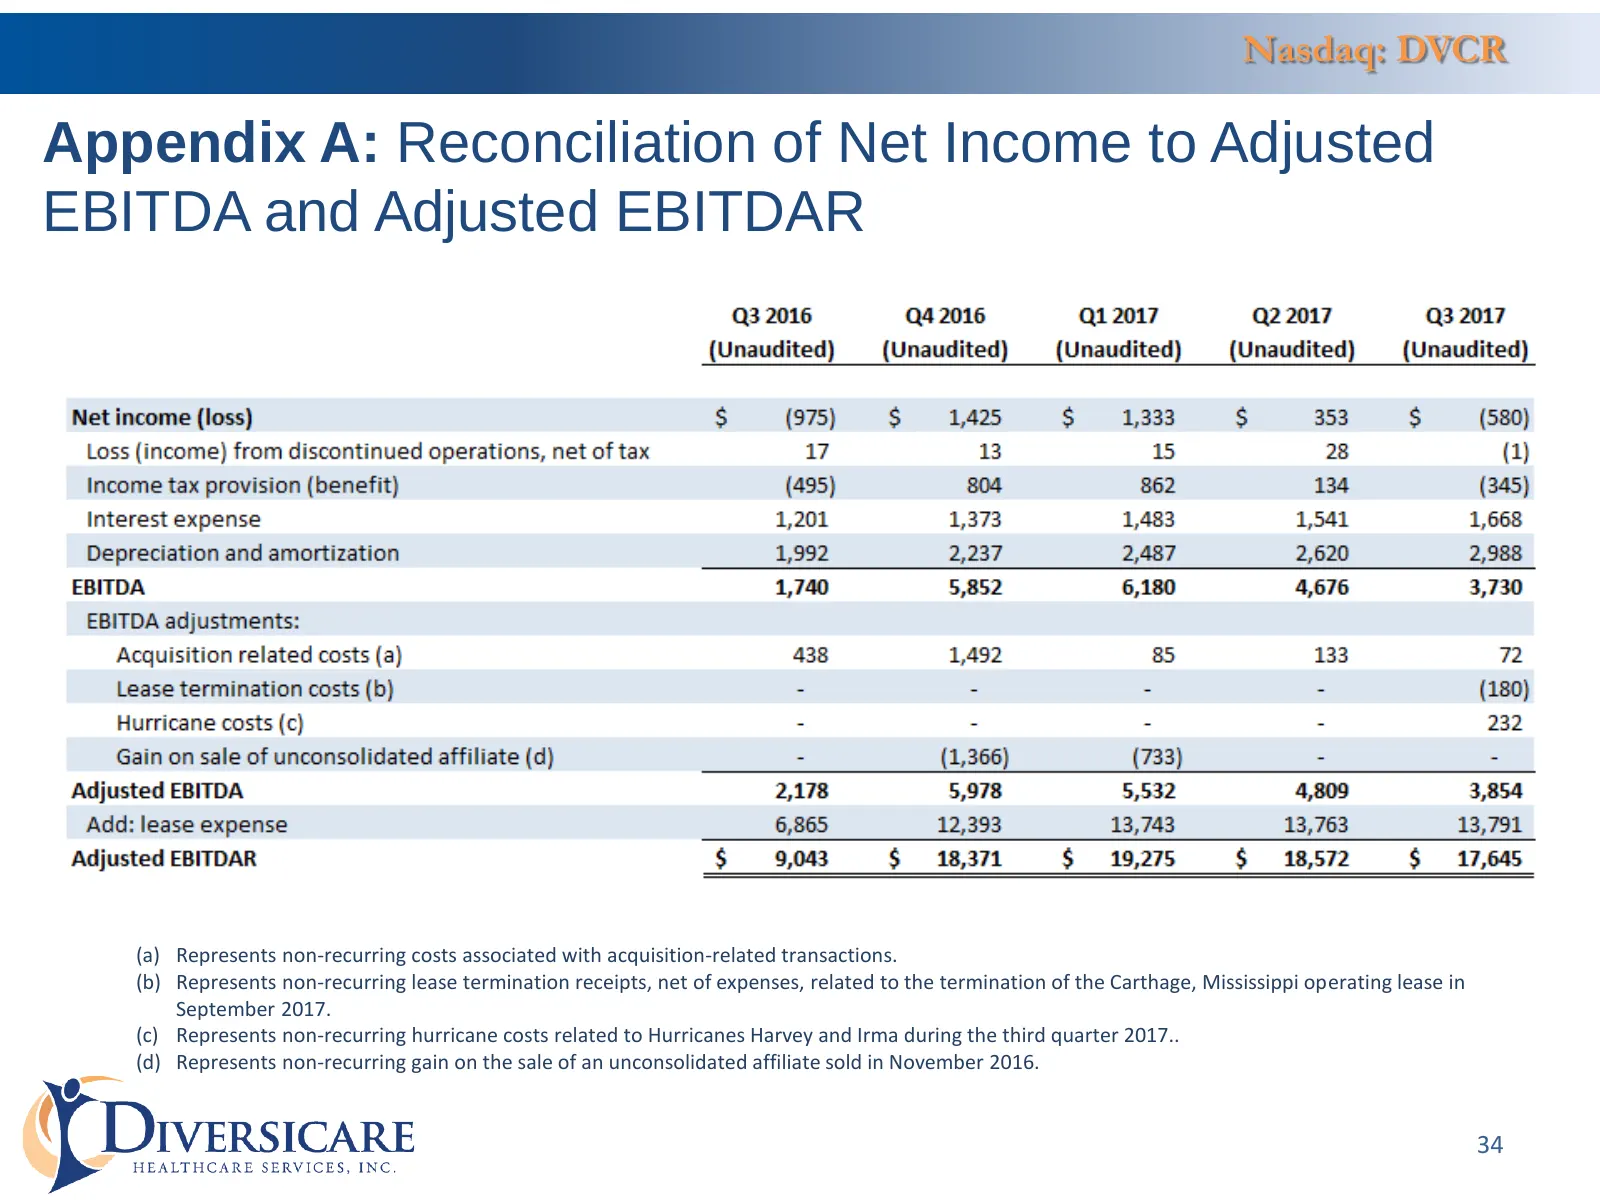
Nasdaq: DVCR Appendix A: Reconciliation of Net Income to Adjusted EBITDA and Adjusted EBITDAR (a) Represents non-recurring costs associated with acquisition-related transactions. (b) Represents non-recurring lease termination receipts, net of expenses, related to the termination of the Carthage, Mis
Source: SEC EDGAR · 8-K filed Nov 2, 2017
More decks from Diversicare Healthcare Services Inc
 Q2 2021 Earnings Presentation31 slides · Aug 10, 2021
 Q1 2021 Earnings Presentation31 slides · May 11, 2021
 Q4 2020 Earnings Presentation31 slides · Mar 11, 2021
 Q3 2019 Earnings Presentation5 slides · Oct 31, 2019
 Q2 2018 Earnings Presentation35 slides · Aug 2, 2018
 Q1 2018 Earnings Presentation35 slides · May 3, 2018