Southern States Bancshares Inc
Southern States Bancshares — Debt Investor Presentation (October 2022)
52 slides from Southern States Bancshares's debt investor presentation, Oct 27, 2022
Slide 1: Subordinated Notes Offering Presentation
Subordinated Notes Offering Presentation NASDAQGS: SSBK September 2022 CONFIDENTIAL
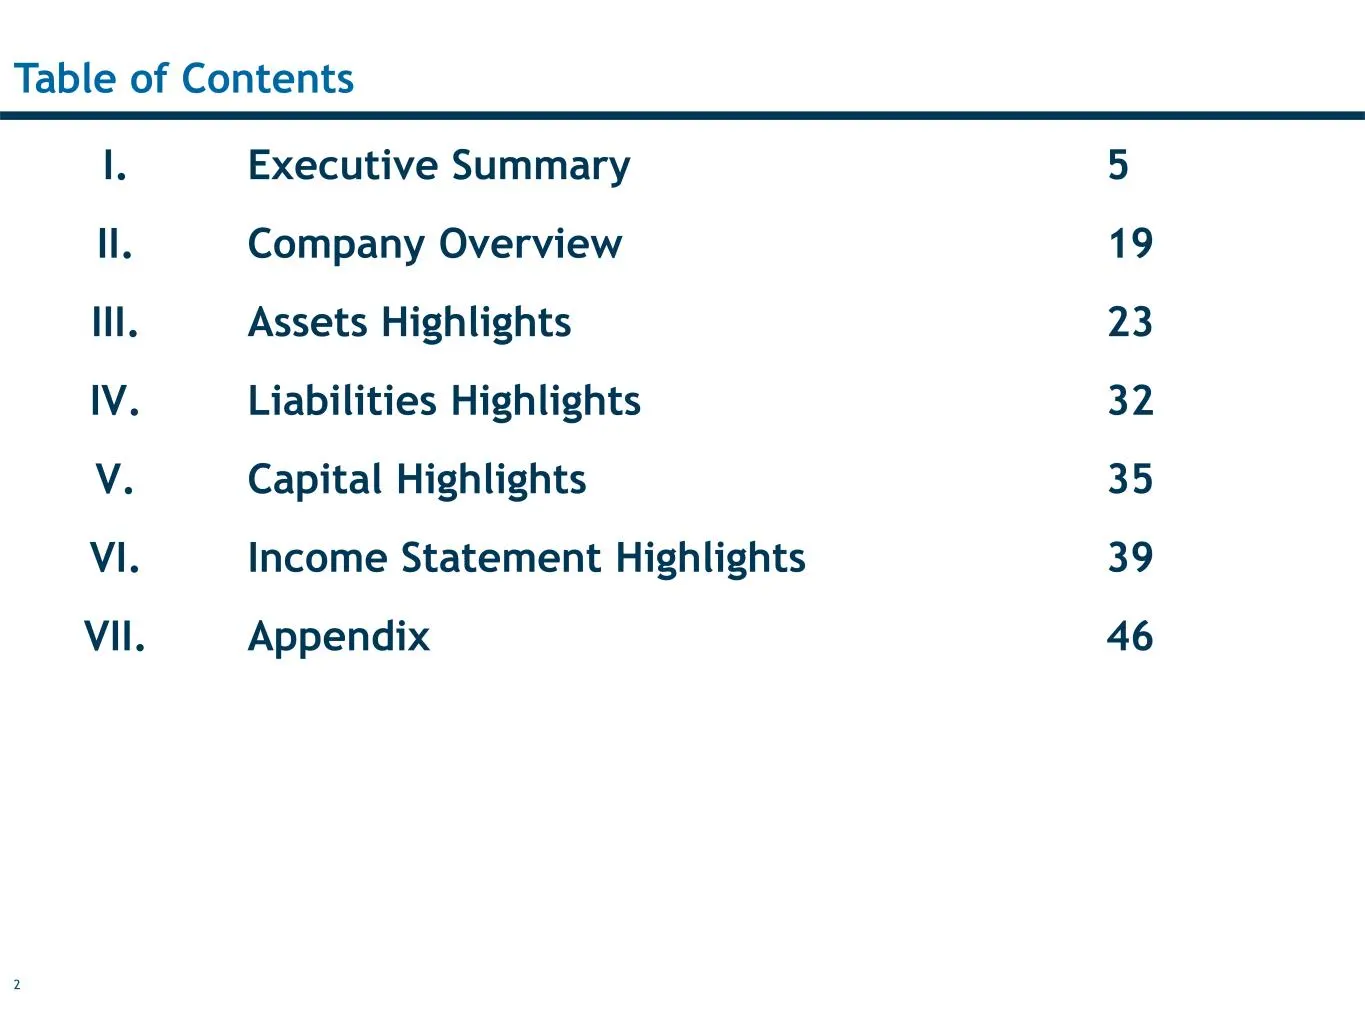
Slide 2: Table of Contents
2 Table of Contents I. II. III. IV. V. VI. VII. Executive Summary Company Overview Assets Highlights Liabilities Highlights Capital Highlights Income Statement Highlights Appendix 5 19 23 32 35 39 46
Slide 3: Notice to Recipients
3 Notice to Recipients This confidential presentation (this “Presentation”) has been prepared solely for general informational purposes by Southern States Bancshares, Inc. (the “Company,” the “holding company,” “we” or “our”), and is being furnished solely for use by prospective participants in cons
Slide 4: Offering Disclaimer
4 Offering Disclaimer Any offering, purchase and sale of Securities may be made only by the NPA and the information contained herein will be superseded in its entirety by such NPA. Each potential investor should review the NPA, make such investigation as it deems necessary to arrive at an independen
Slide 5: Executive Summary
Ll. Executive Summary fy SOUTHERN STATES BANCSHARES, INC,
Slide 6: Offering Summary
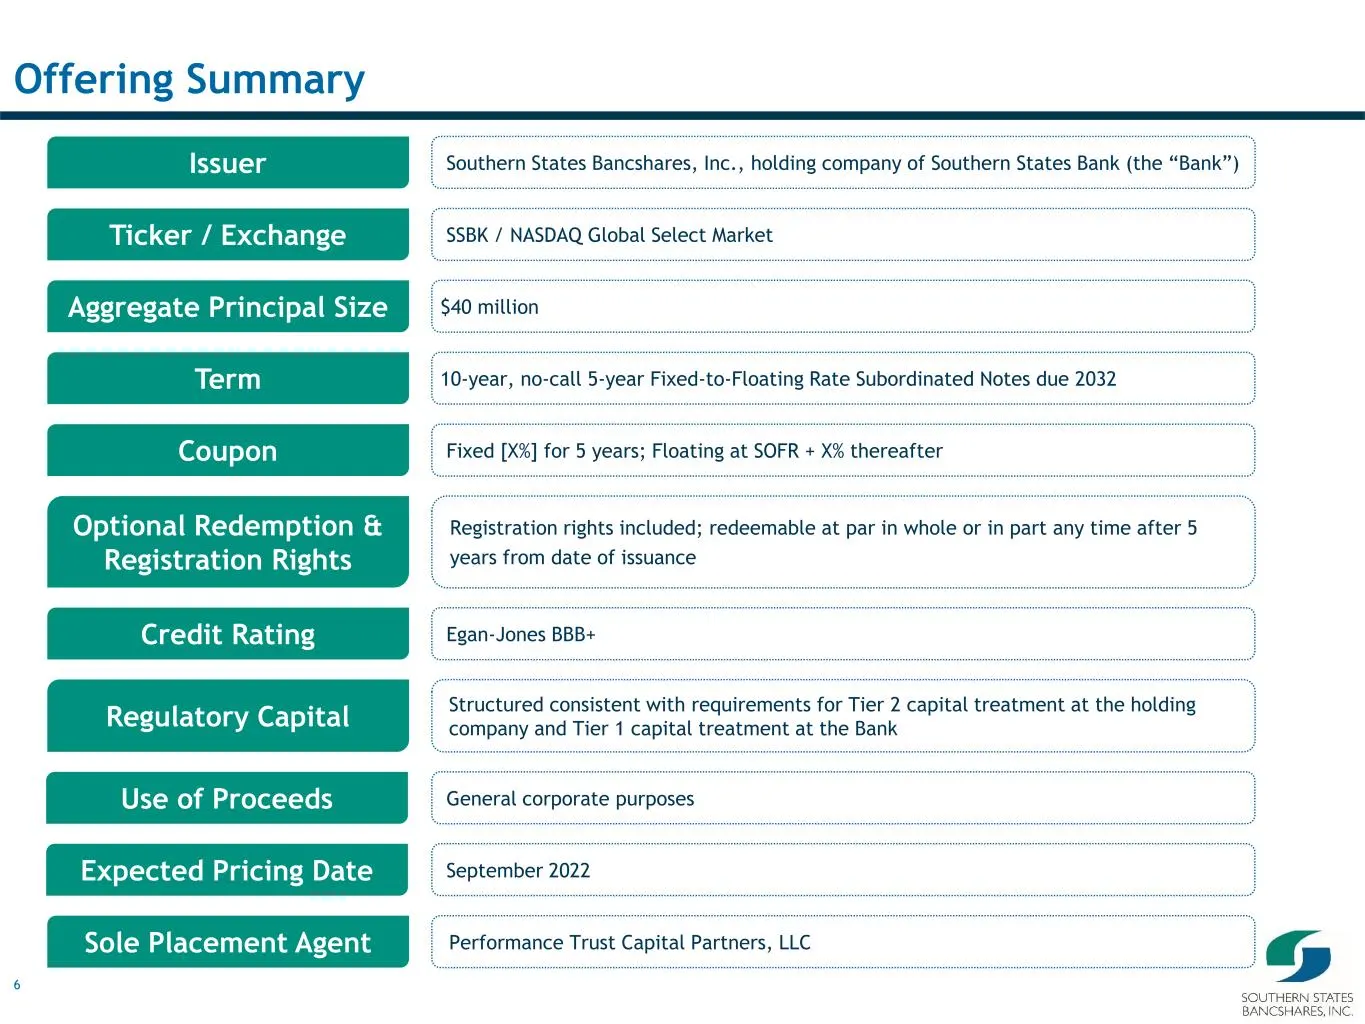
6 Offering Summary SSBK / NASDAQ Global Select Market 10-year, no-call 5-year Fixed-to-Floating Rate Subordinated Notes due 2032 Southern States Bancshares, Inc., holding company of Southern States Bank (the “Bank”) September 2022 Coupon Optional Redemption & Registration Rights Regulatory Capital U
Slide 7: Overview of Southern States Bancshares, Inc.
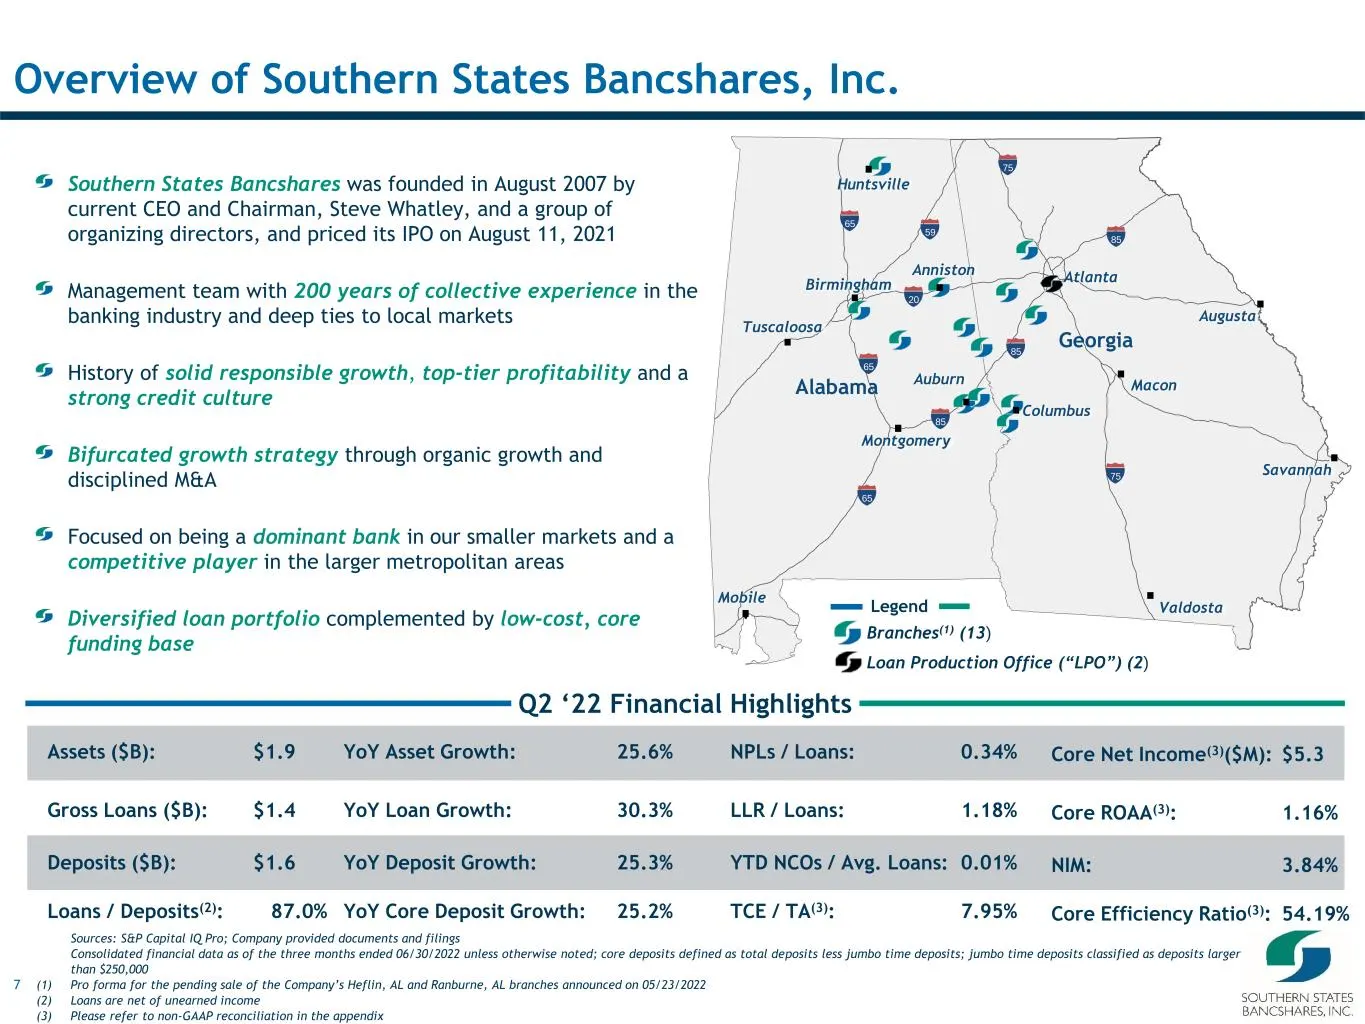
7 Huntsville Birmingham Montgomery Columbus Atlanta Alabama Georgia 65 85 75 Anniston Auburn 20 85 75 85 65 65 59 Tuscaloosa YoY Core Deposit Growth: 25.2%Loans / Deposits(2): 87.0% Overview of Southern States Bancshares, Inc. Q2 ‘22 Financial Highlights YoY Asset Growth: 25.6%Assets ($B): $1.9 NPLs
Slide 8: Investment Highlights
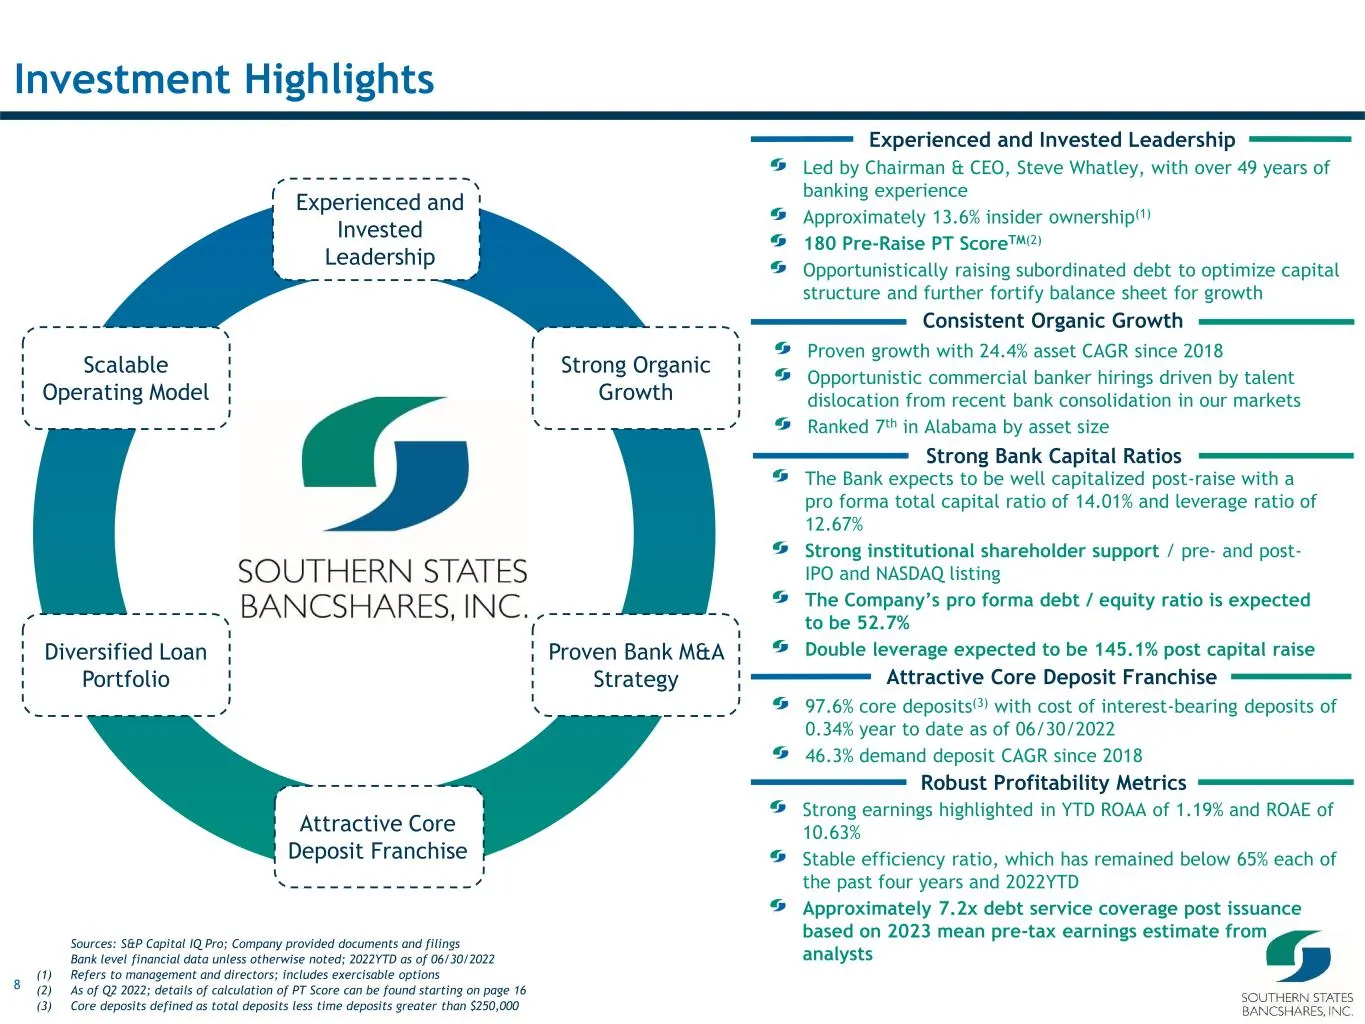
8 Investment Highlights Experienced and Invested Leadership Strong Organic Growth Proven Bank M&A Strategy Diversified Loan Portfolio Attractive Core Deposit Franchise Scalable Operating Model Led by Chairman & CEO, Steve Whatley, with over 49 years of banking experience Approximately 13.6% insider
Slide 9: Q2 2022 Highlights
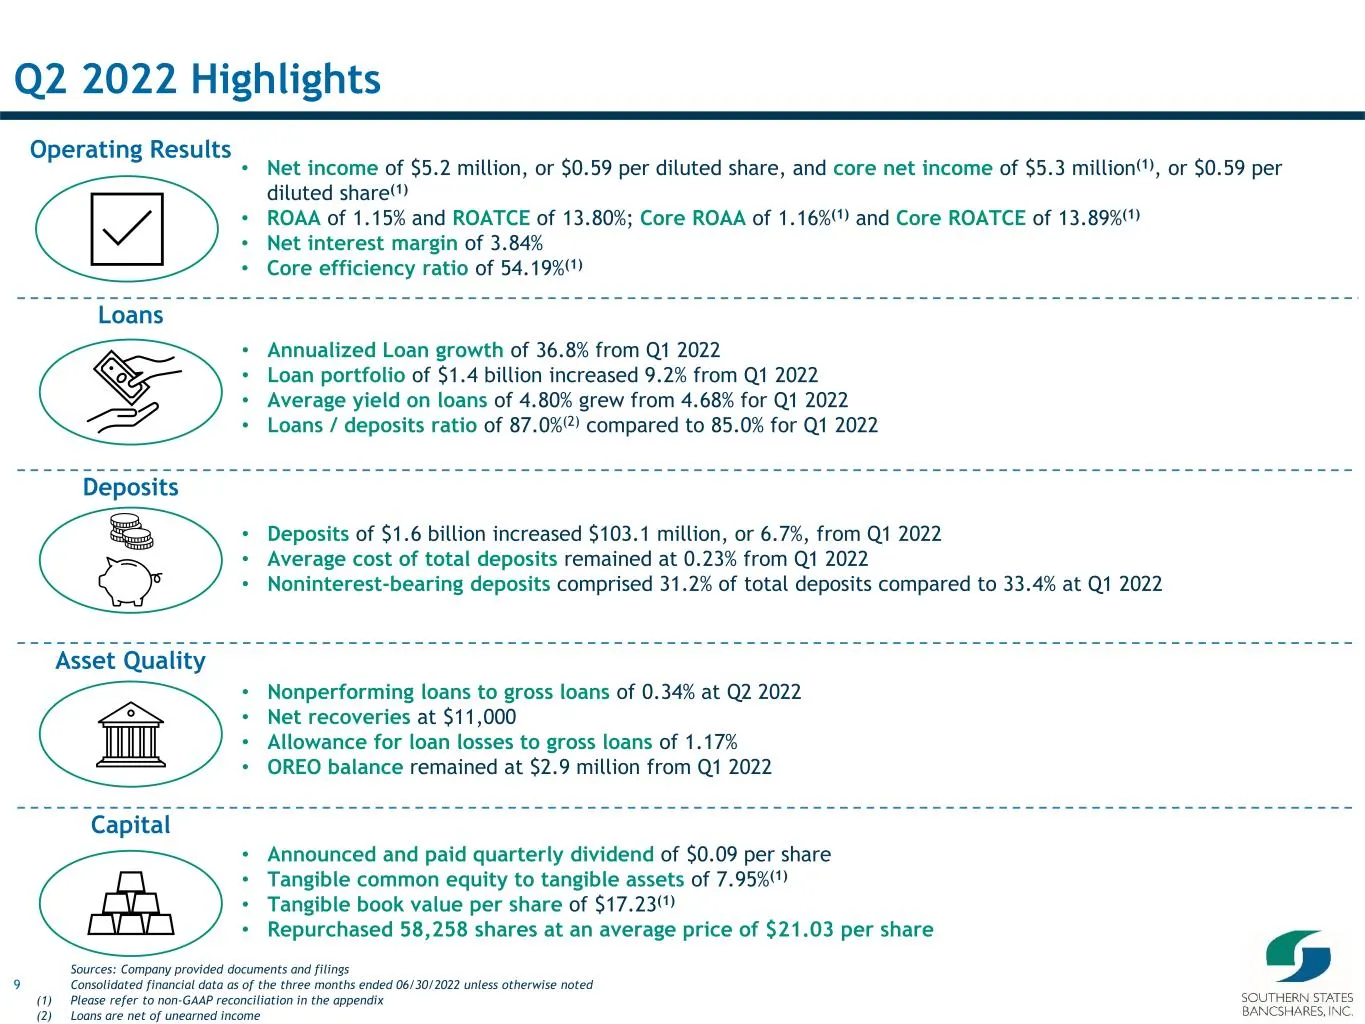
9 Q2 2022 Highlights Sources: Company provided documents and filings Consolidated financial data as of the three months ended 06/30/2022 unless otherwise noted (1) Please refer to non-GAAP reconciliation in the appendix (2) Loans are net of unearned income Loans Deposits Asset Quality Capital Operat
Slide 10: SSBK Stock Performance
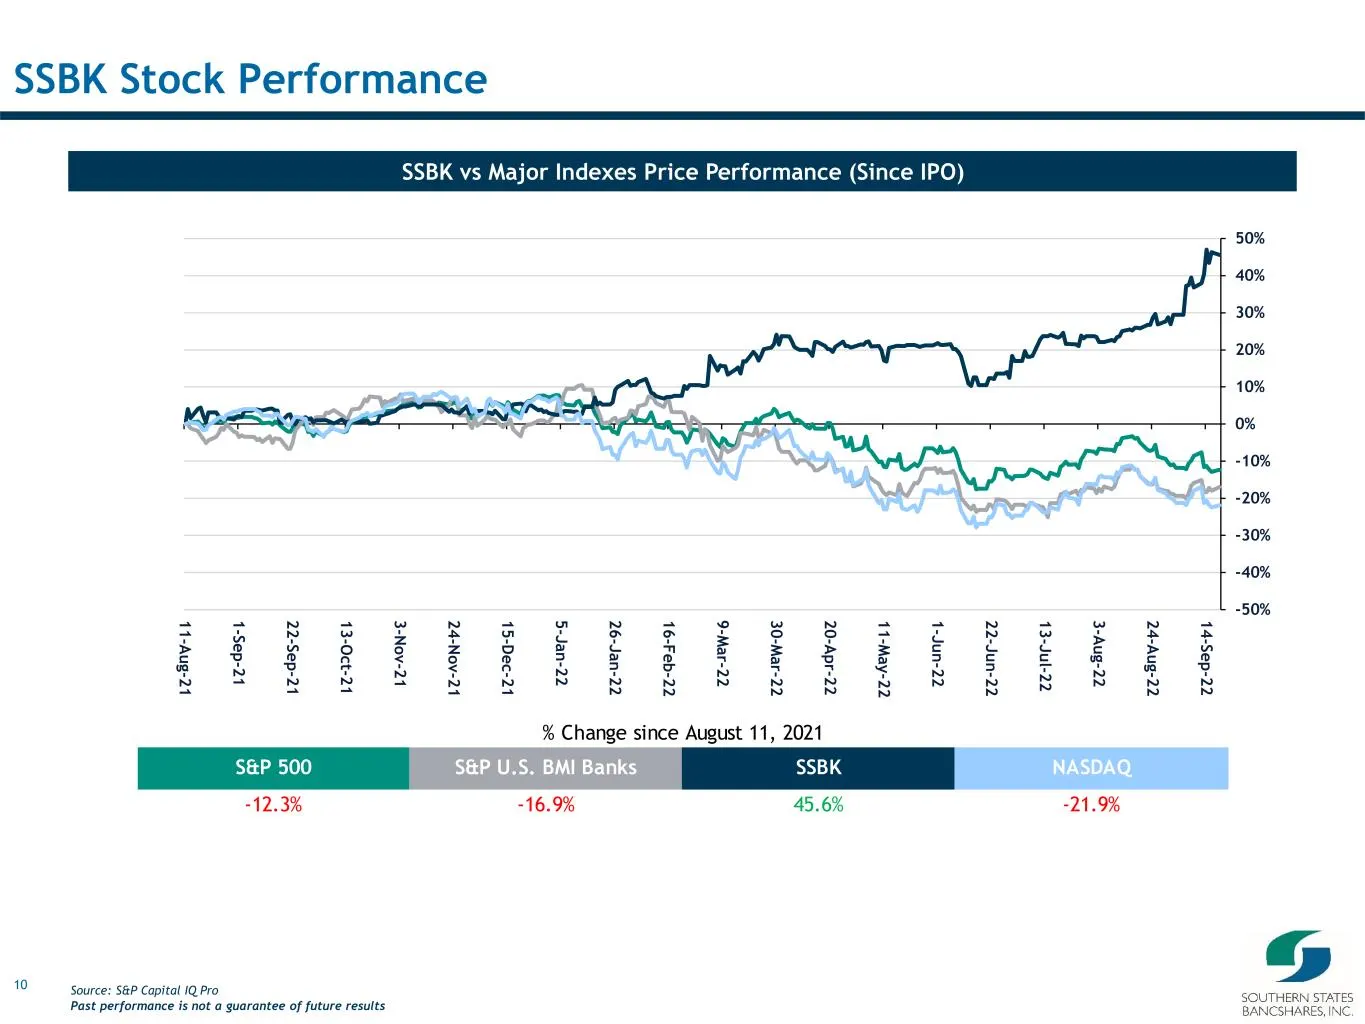
10 SSBK Stock Performance Source: S&P Capital IQ Pro Past performance is not a guarantee of future results SSBK vs Major Indexes Price Performance (Since IPO) -50% -40% -30% -20% -10% 0% 10% 20% 30% 40% 50% 1 1 -A u g -2 1 1 -S e p -2 1 2 2 -S e p -2 1 1 3 -O c t-2 1 3 -N o v -2 1 2 4 -N o v -2 1 1
Slide 11: SSBK Top Institutional Ownership
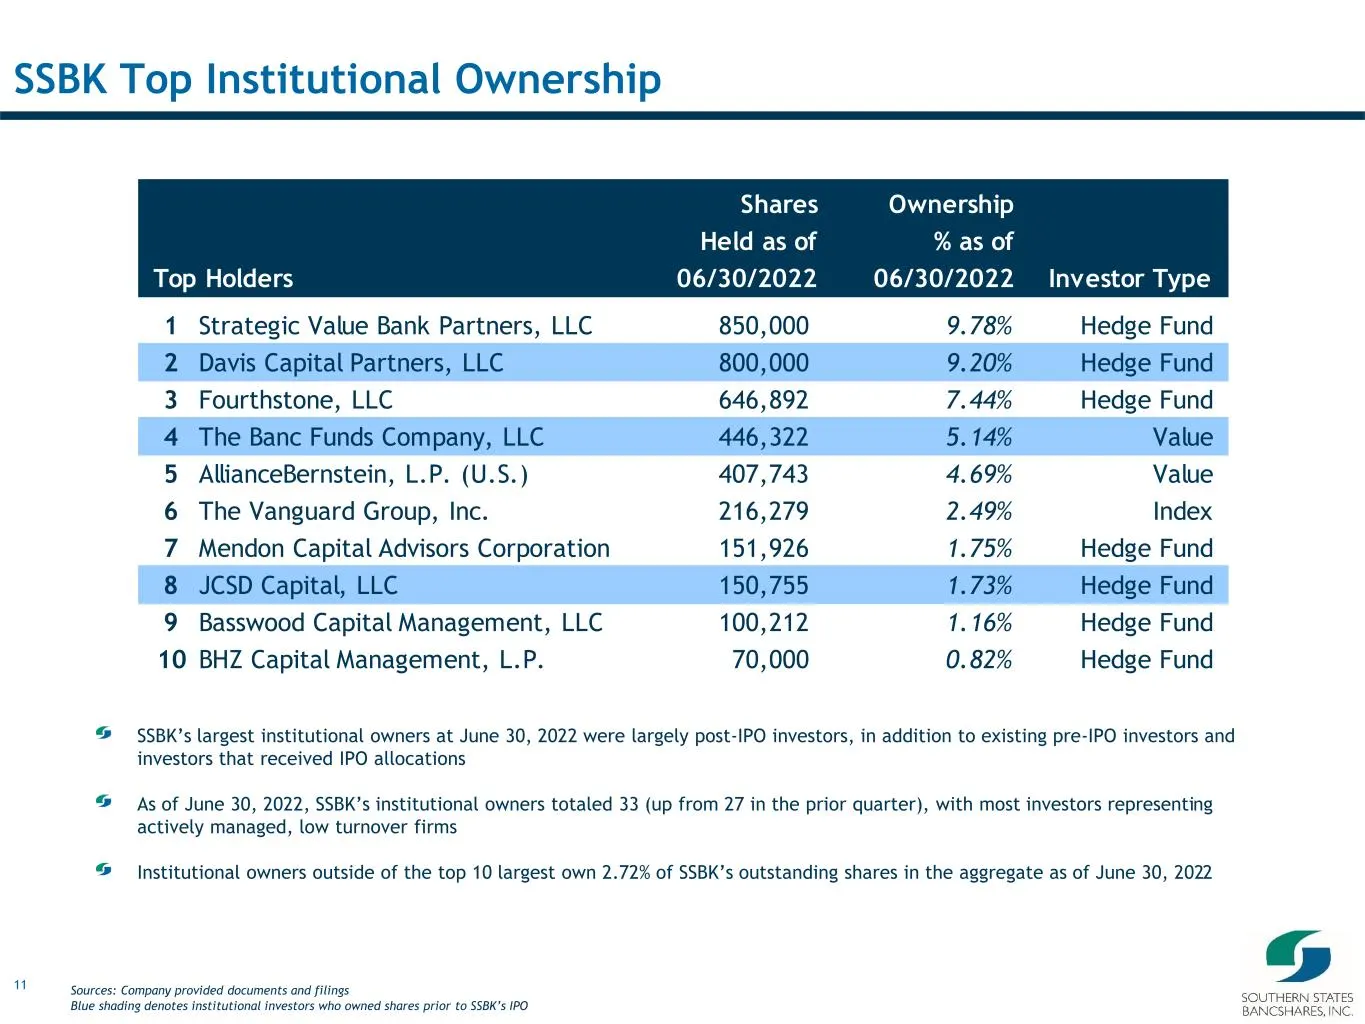
11 SSBK Top Institutional Ownership Sources: Company provided documents and filings Blue shading denotes institutional investors who owned shares prior to SSBK’s IPO Top Holders Shares Held as of 06/30/2022 Ownership % as of 06/30/2022 Investor Type 1 Strategic Value Bank Partners, LLC 850,000 9.78%
Slide 12: Market highlights
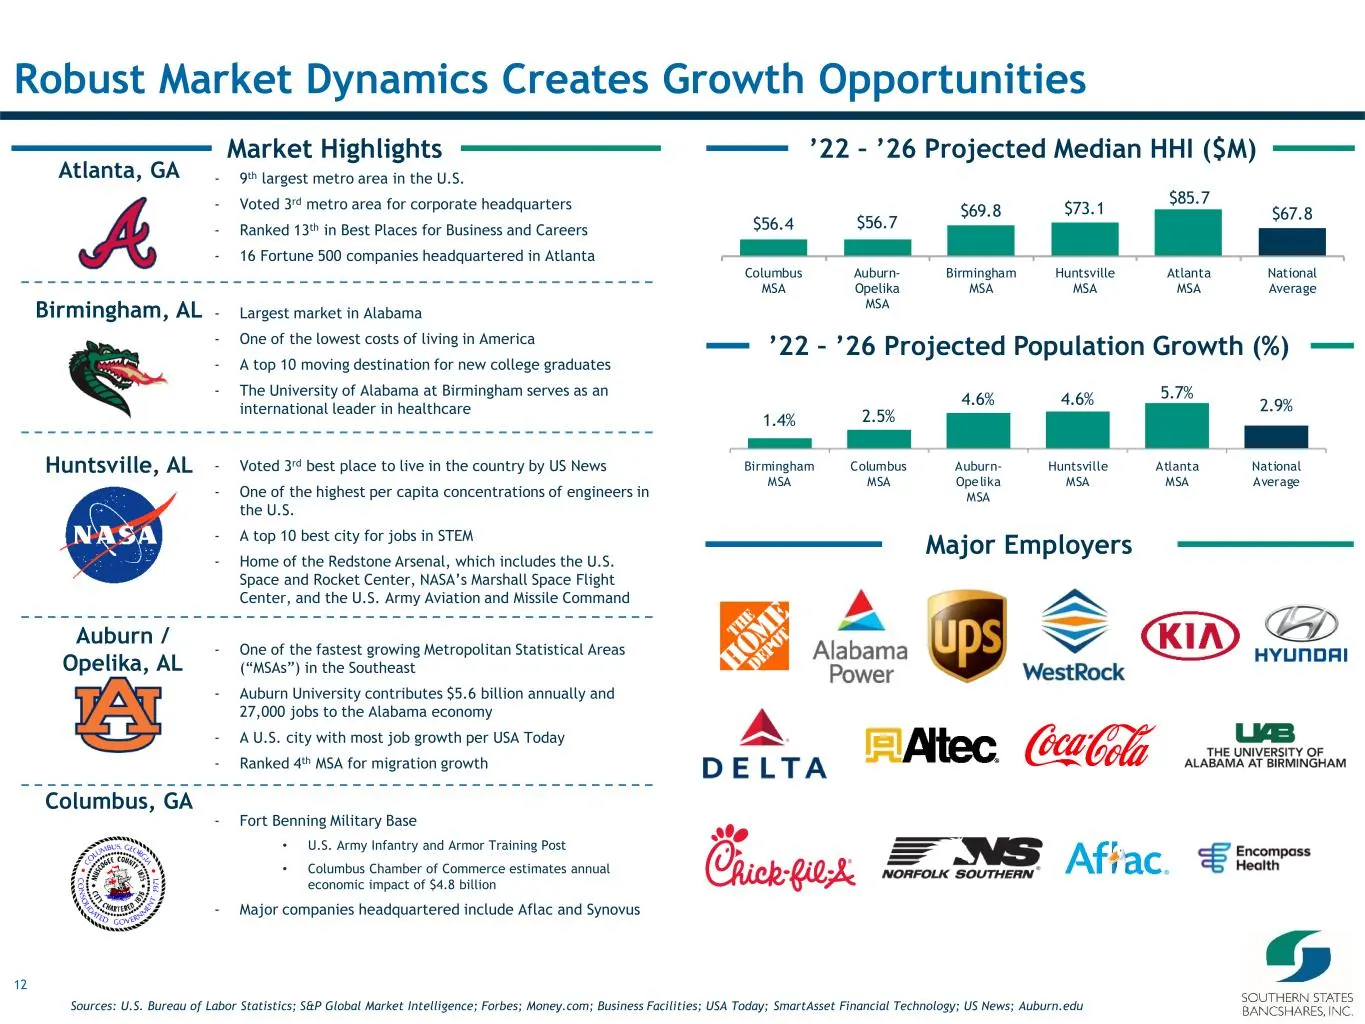
12 - 9th largest metro area in the U.S. - Voted 3rd metro area for corporate headquarters - Ranked 13th in Best Places for Business and Careers - 16 Fortune 500 companies headquartered in Atlanta - Largest market in Alabama - One of the lowest costs of living in America - A top 10 moving destination
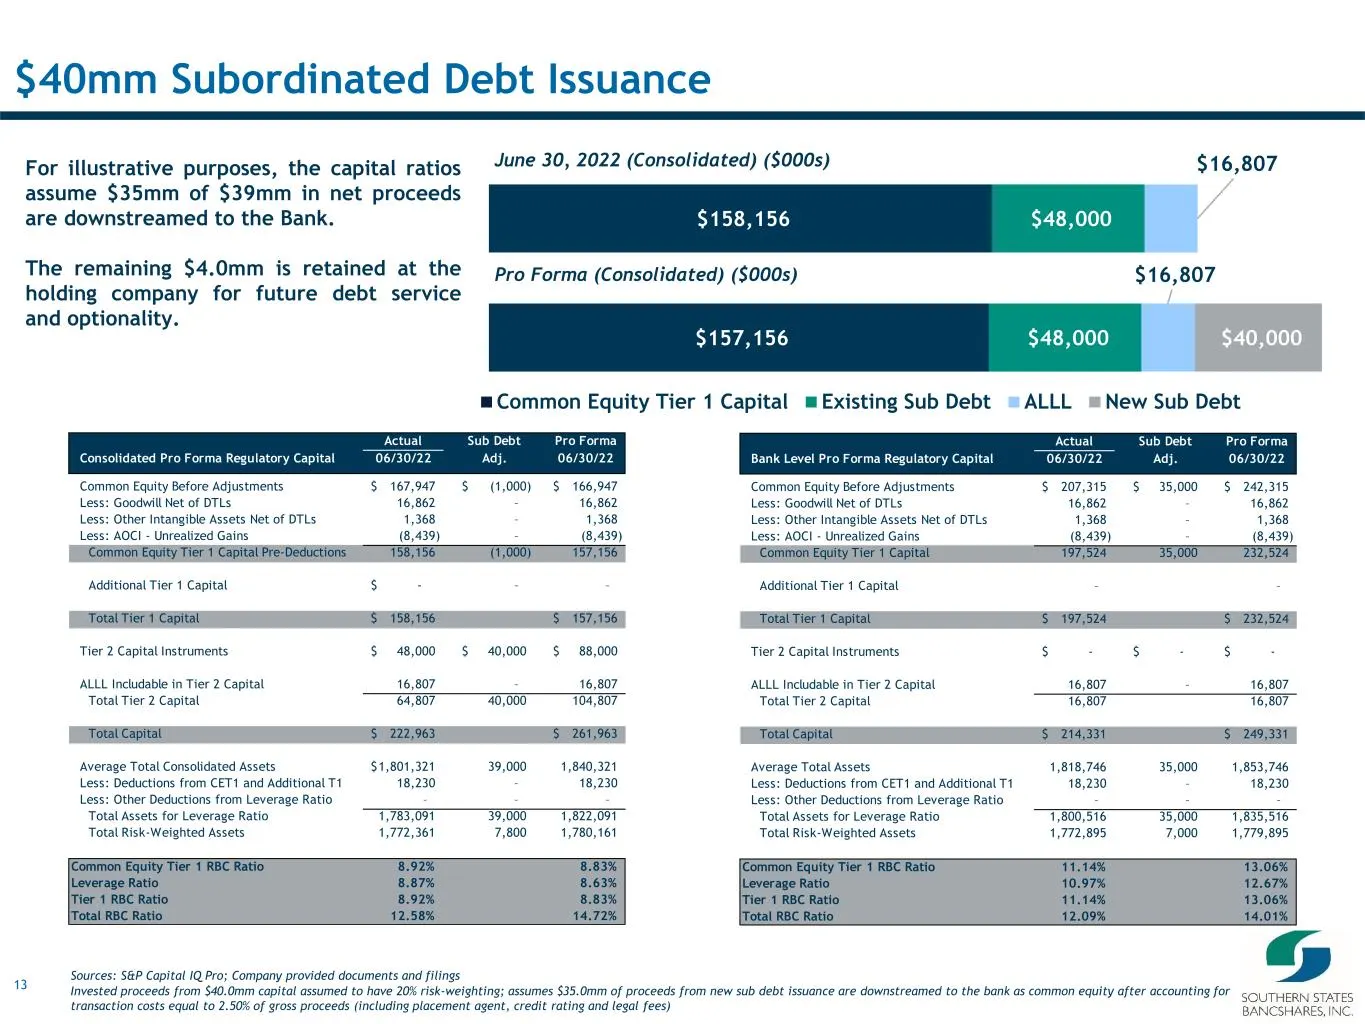
Slide 13: Pro Forma Regulatory Capital
13 Actual Sub Debt Pro Forma Consolidated Pro Forma Regulatory Capital 06/30/22 Adj. 06/30/22 Common Equity Before Adjustments 167,947$ (1,000)$ 166,947$ Less: Goodwill Net of DTLs 16,862 – 16,862 Less: Other Intangible Assets Net of DTLs 1,368 – 1,368 Less: AOCI - Unrealized Gains (8,439) – (8,439)
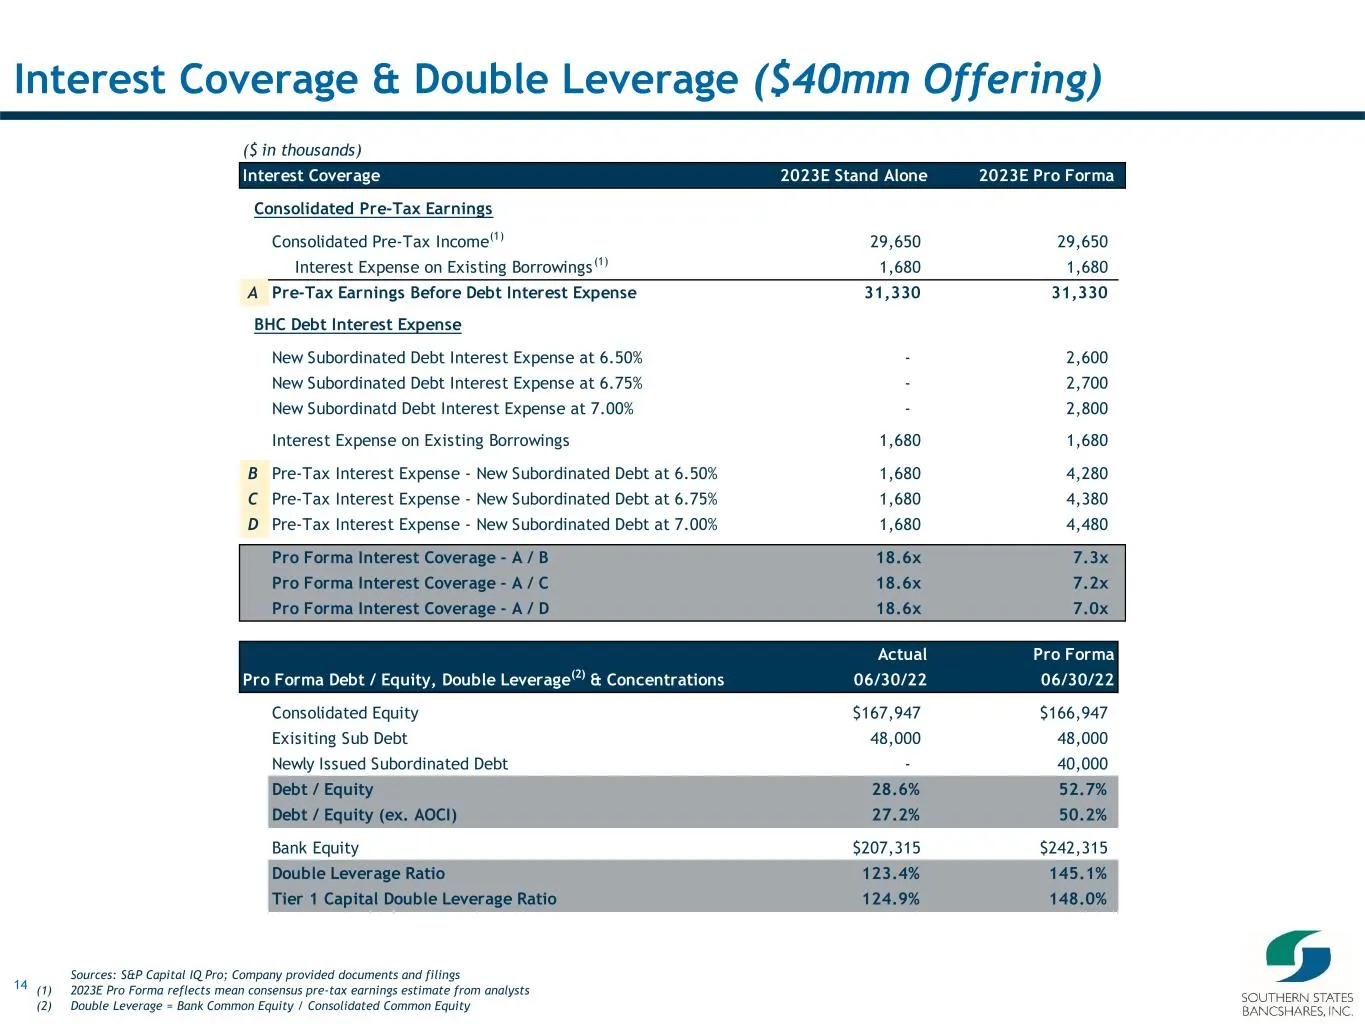
Slide 14: Interest Coverage & Double Leverage ($40mm Offering)
14 Interest Coverage & Double Leverage ($40mm Offering) Sources: S&P Capital IQ Pro; Company provided documents and filings (1) 2023E Pro Forma reflects mean consensus pre-tax earnings estimate from analysts (2) Double Leverage = Bank Common Equity / Consolidated Common Equity ($ in thousands) Inter
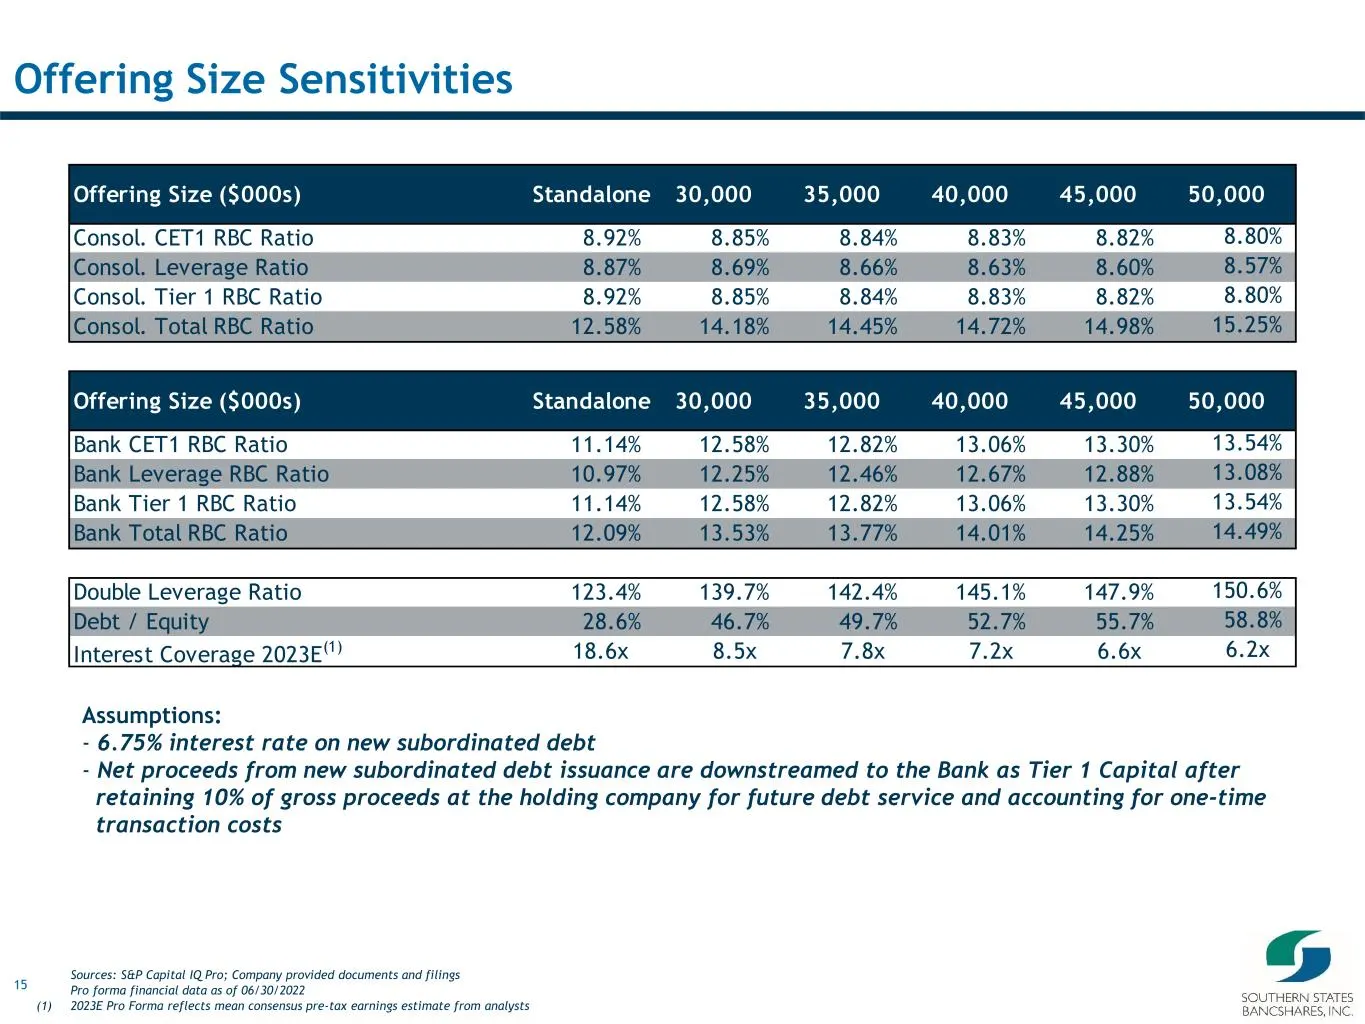
Slide 15: Offering Size Sensitivities
15 Offering Size Sensitivities Assumptions: - 6.75% interest rate on new subordinated debt - Net proceeds from new subordinated debt issuance are downstreamed to the Bank as Tier 1 Capital after retaining 10% of gross proceeds at the holding company for future debt service and accounting for one-tim
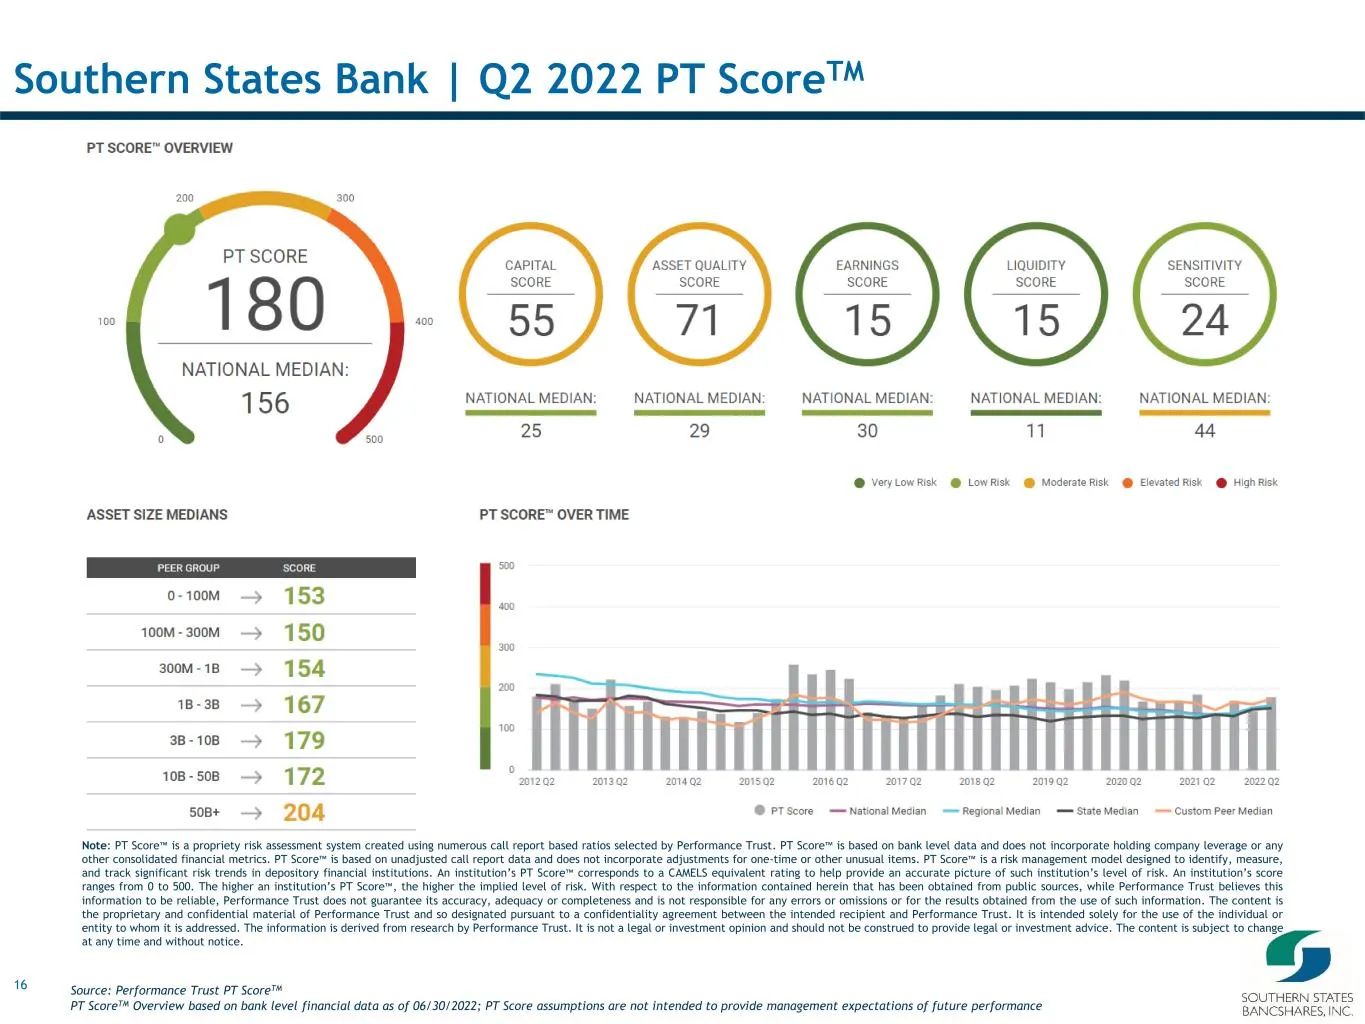
Slide 16: Southern States Bank Q2 2022 PT Score
16 Southern States Bank | Q2 2022 PT ScoreTM Note: PT Score™ is a propriety risk assessment system created using numerous call report based ratios selected by Performance Trust. PT Score™ is based on bank level data and does not incorporate holding company leverage or any other consolidated financia
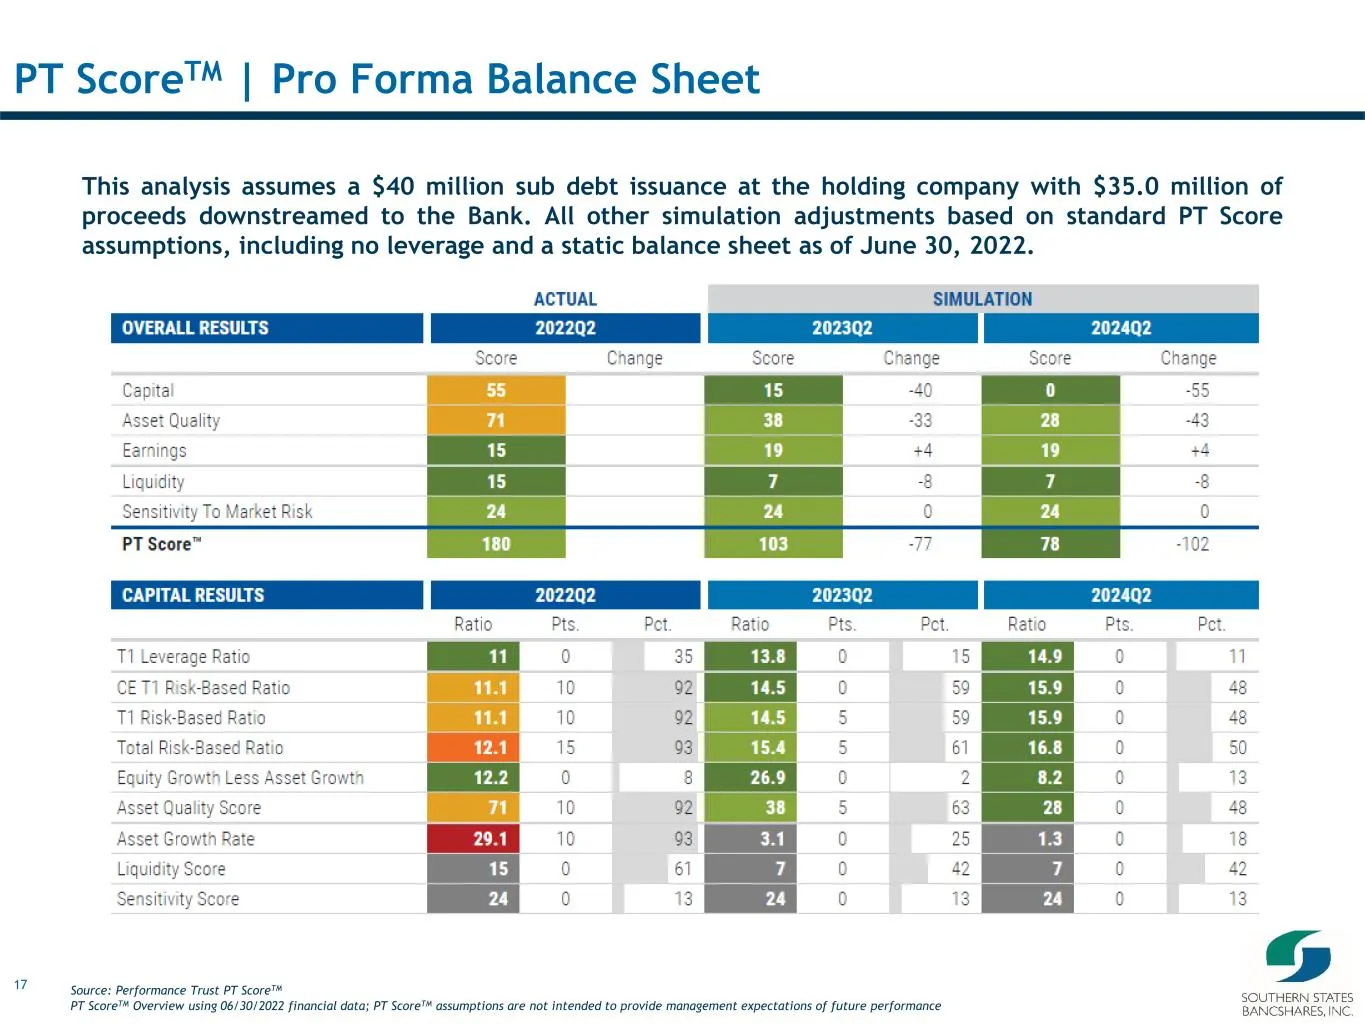
Slide 17: PT Score | Pro Forma Balance Sheet
17 PT ScoreTM | Pro Forma Balance Sheet This analysis assumes a $40 million sub debt issuance at the holding company with $35.0 million of proceeds downstreamed to the Bank. All other simulation adjustments based on standard PT Score assumptions, including no leverage and a static balance sheet as o
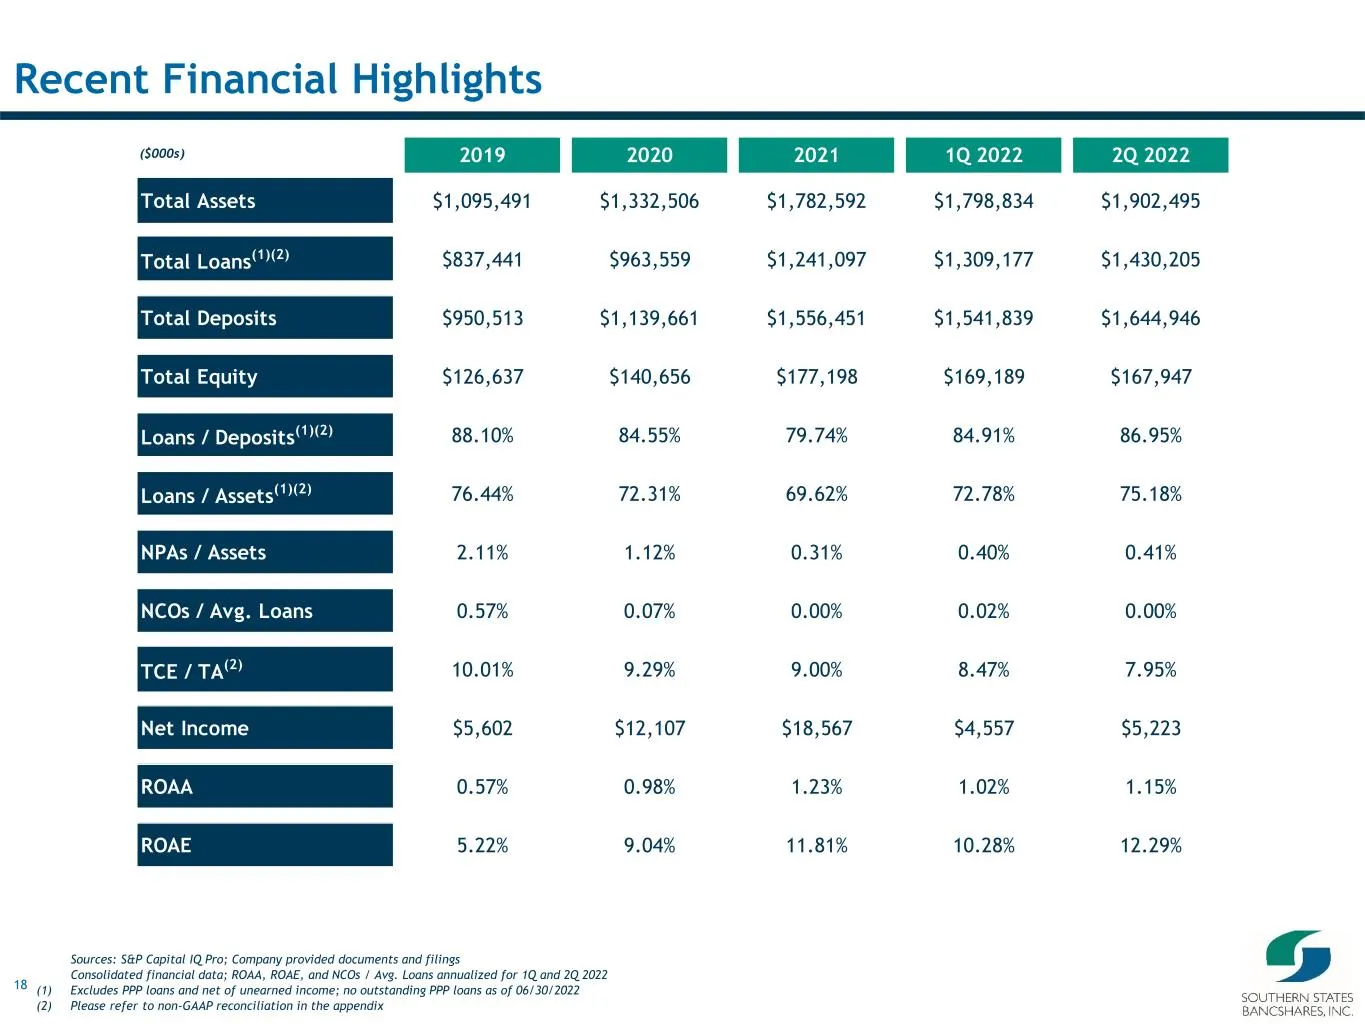
Slide 18: Recent Financial Highlights
18 Recent Financial Highlights Sources: S&P Capital IQ Pro; Company provided documents and filings Consolidated financial data; ROAA, ROAE, and NCOs / Avg. Loans annualized for 1Q and 2Q 2022 (1) Excludes PPP loans and net of unearned income; no outstanding PPP loans as of 06/30/2022 (2) Please refe
Slide 19: Company Overview
19 Company Overview fy SOUTHERN STATES BANCSHARES, INC,
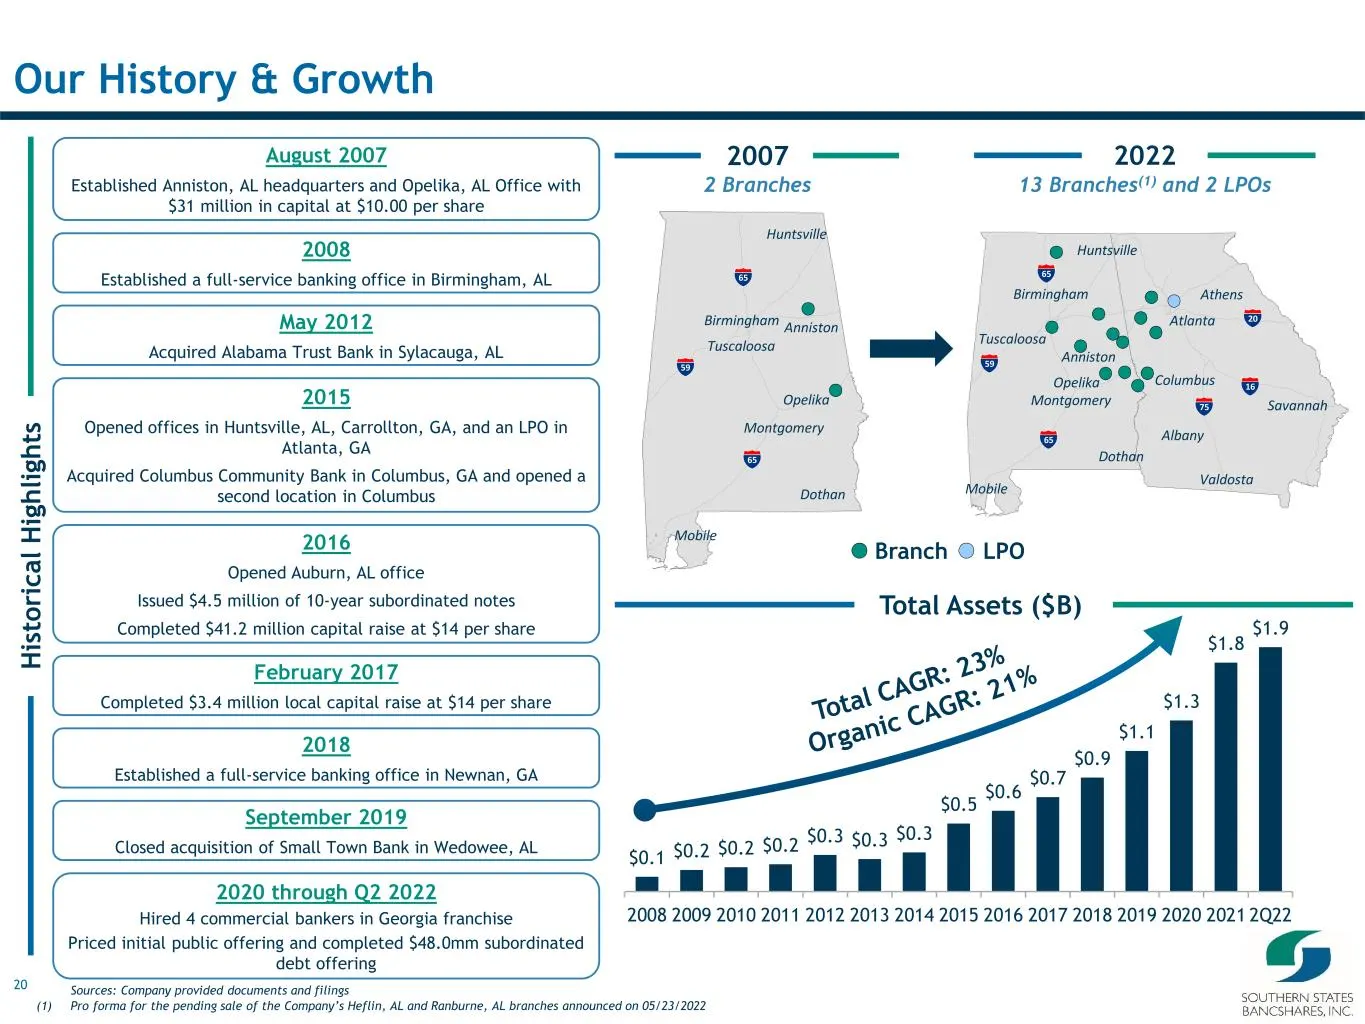
Slide 20: Our History & Growth
20 2007 Our History & Growth H is to ri c a l H ig h li g h ts August 2007 Established Anniston, AL headquarters and Opelika, AL Office with $31 million in capital at $10.00 per share May 2012 Acquired Alabama Trust Bank in Sylacauga, AL 2015 Opened offices in Huntsville, AL, Carrollton, GA, and an
Slide 21: Experienced Management Team
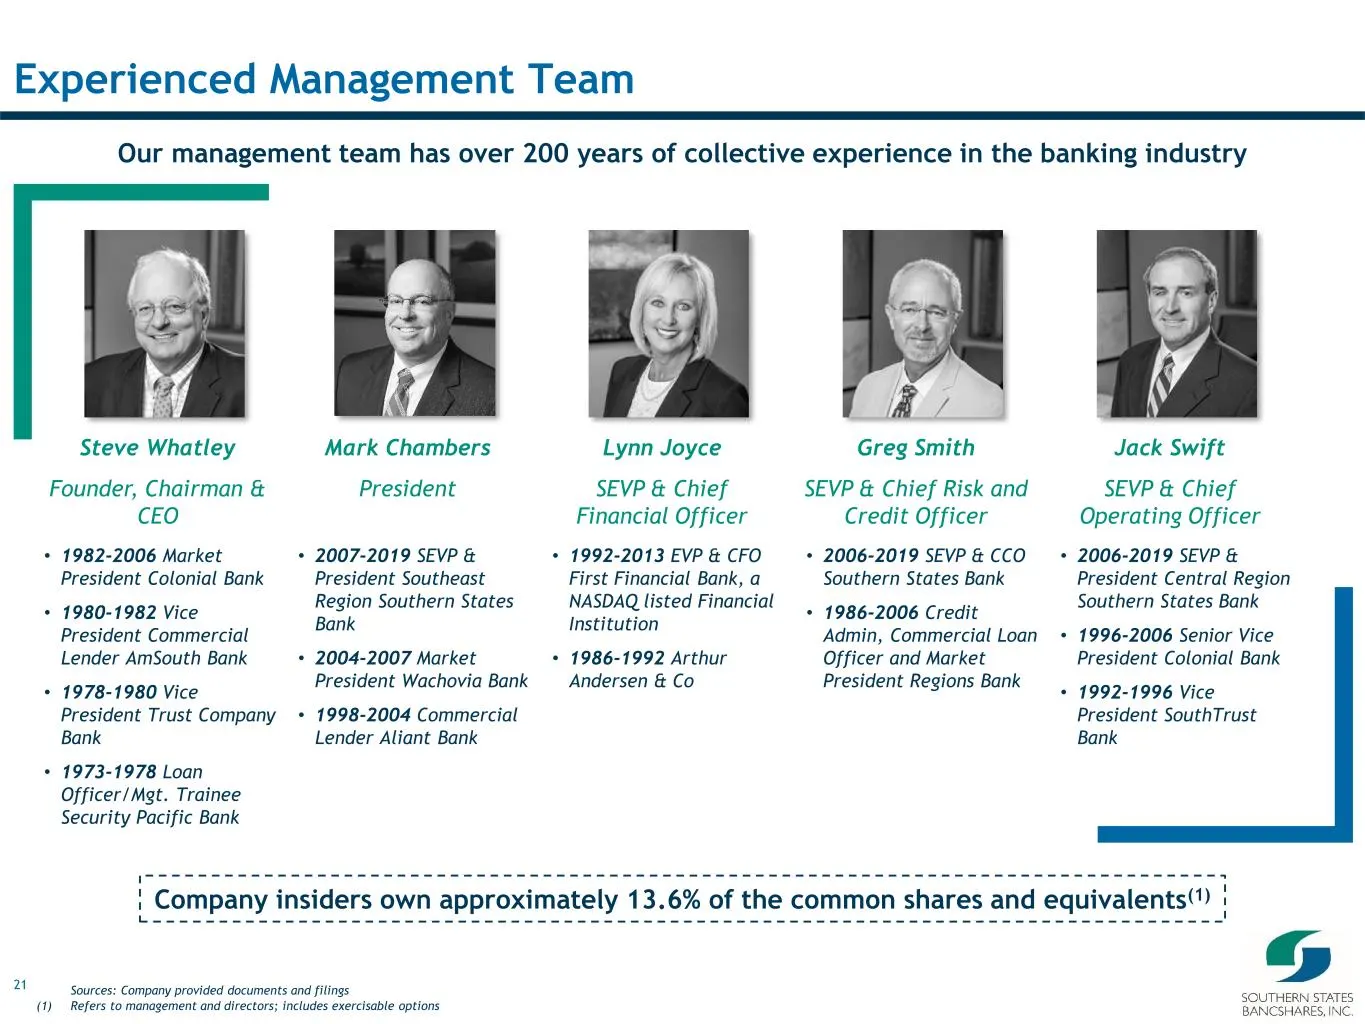
21 Experienced Management Team Steve Whatley Founder, Chairman & CEO Lynn Joyce SEVP & Chief Financial Officer Greg Smith SEVP & Chief Risk and Credit Officer Jack Swift SEVP & Chief Operating Officer Our management team has over 200 years of collective experience in the banking industry Mark Chambe
Slide 22: Near-Term Outlook
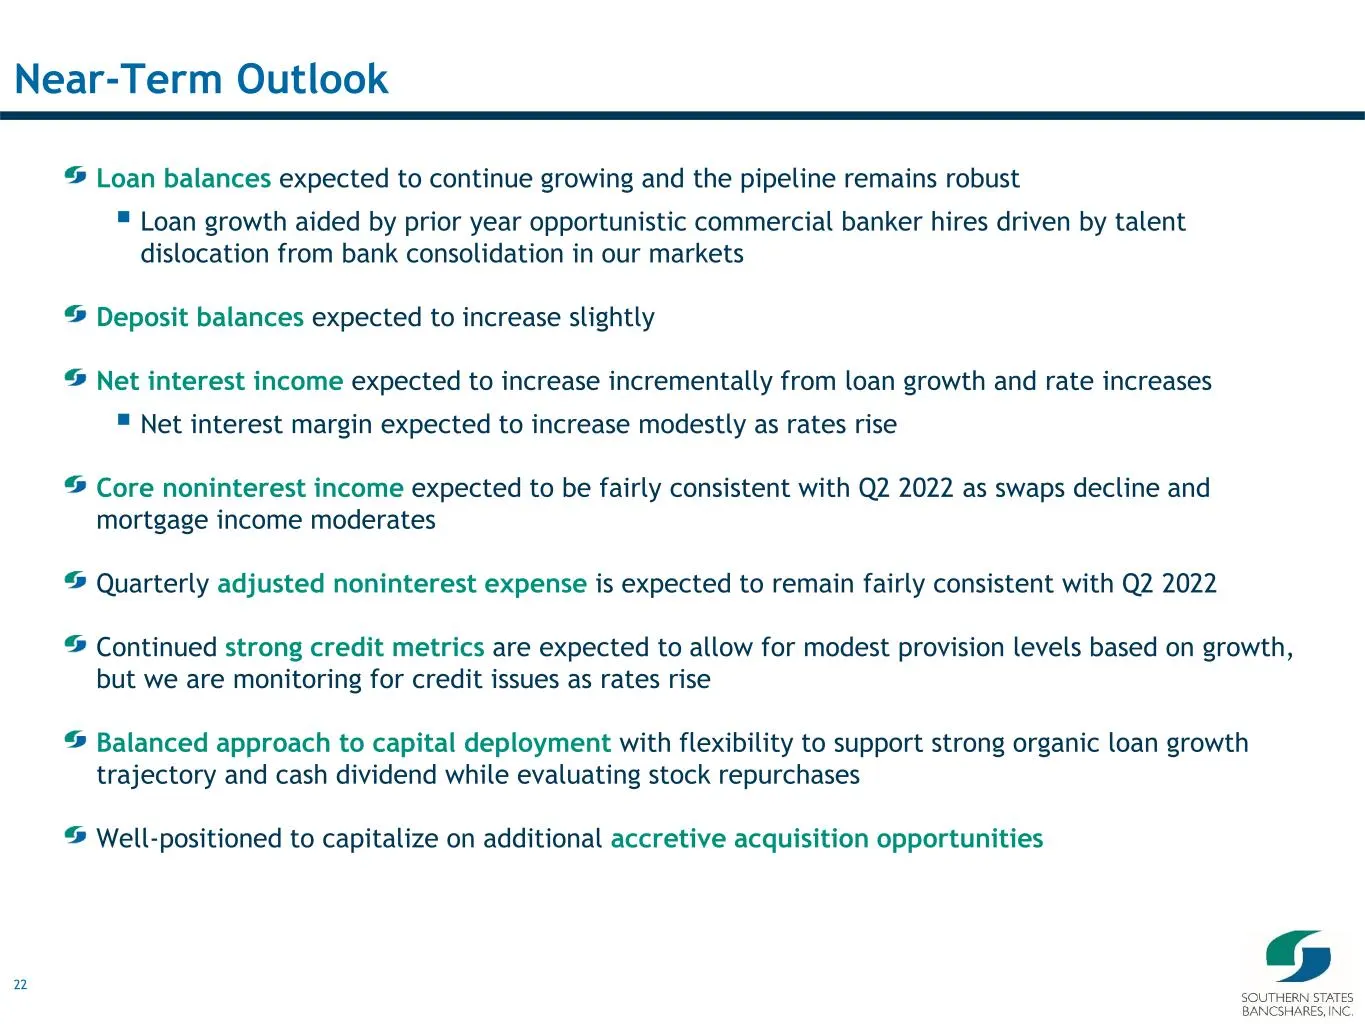
22 Near-Term Outlook Loan balances expected to continue growing and the pipeline remains robust ▪ Loan growth aided by prior year opportunistic commercial banker hires driven by talent dislocation from bank consolidation in our markets Deposit balances expected to increase slightly Net interest inco
Slide 23: Assets Highlights
2B Assets Highlights fy SOUTHERN STATES BANCSHARES, INC,
Slide 24: Balance Sheet Growth
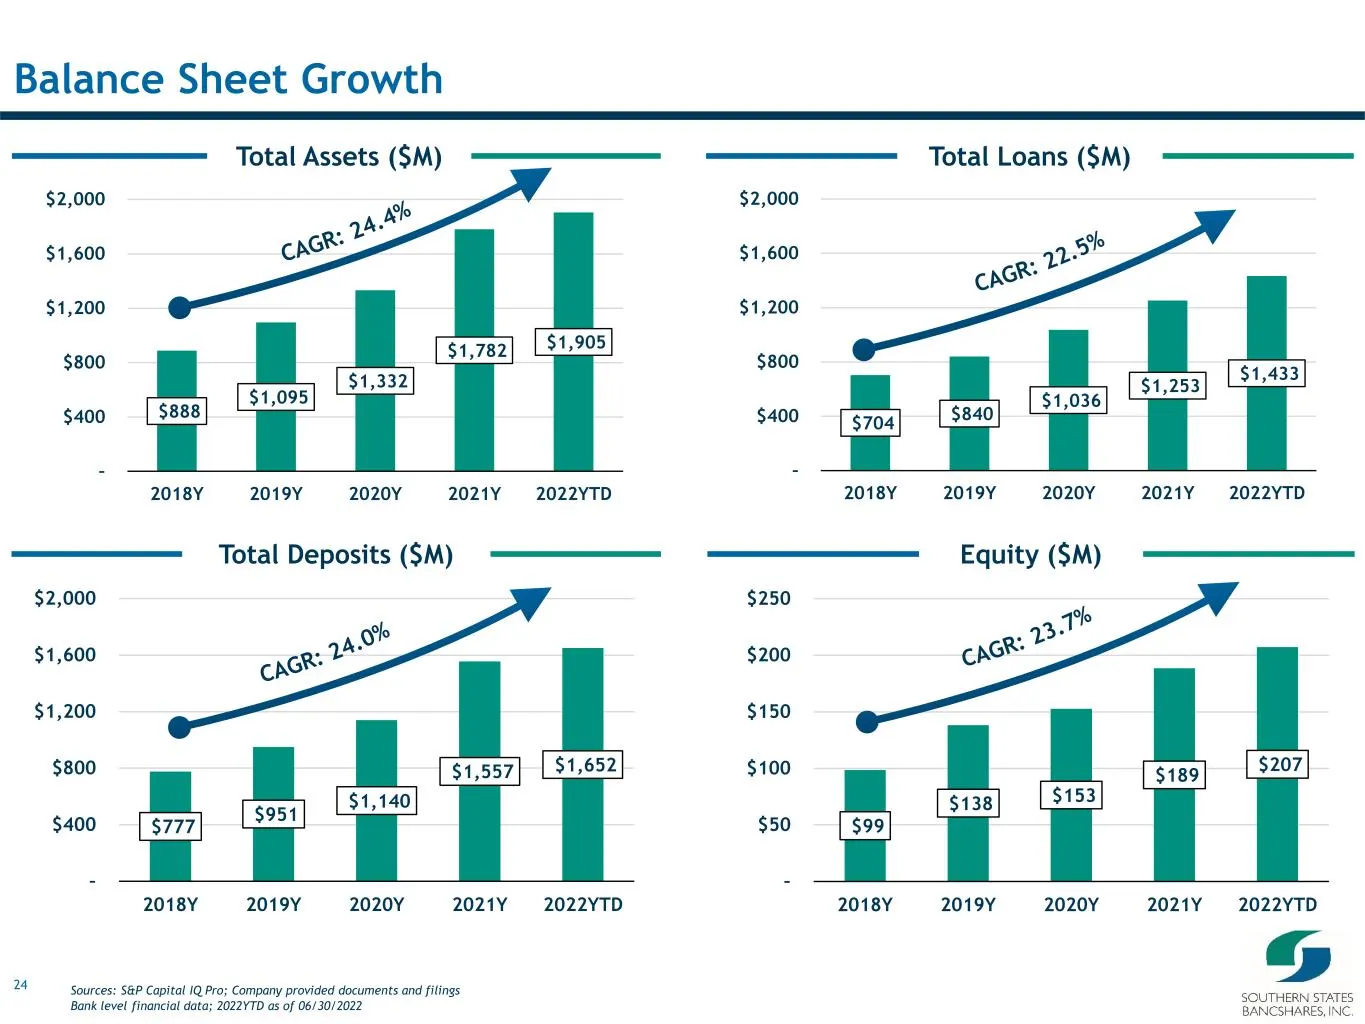
24 $99 $138 $153 $189 $207 – $50 $100 $150 $200 $250 2018Y 2019Y 2020Y 2021Y 2022YTD $777 $951 $1,140 $1,557 $1,652 – $400 $800 $1,200 $1,600 $2,000 2018Y 2019Y 2020Y 2021Y 2022YTD $704 $840 $1,036 $1,253 $1,433 – $400 $800 $1,200 $1,600 $2,000 2018Y 2019Y 2020Y 2021Y 2022YTD $888 $1,095 $1,332 $1,7
Slide 25: Investment Portfolio Detail
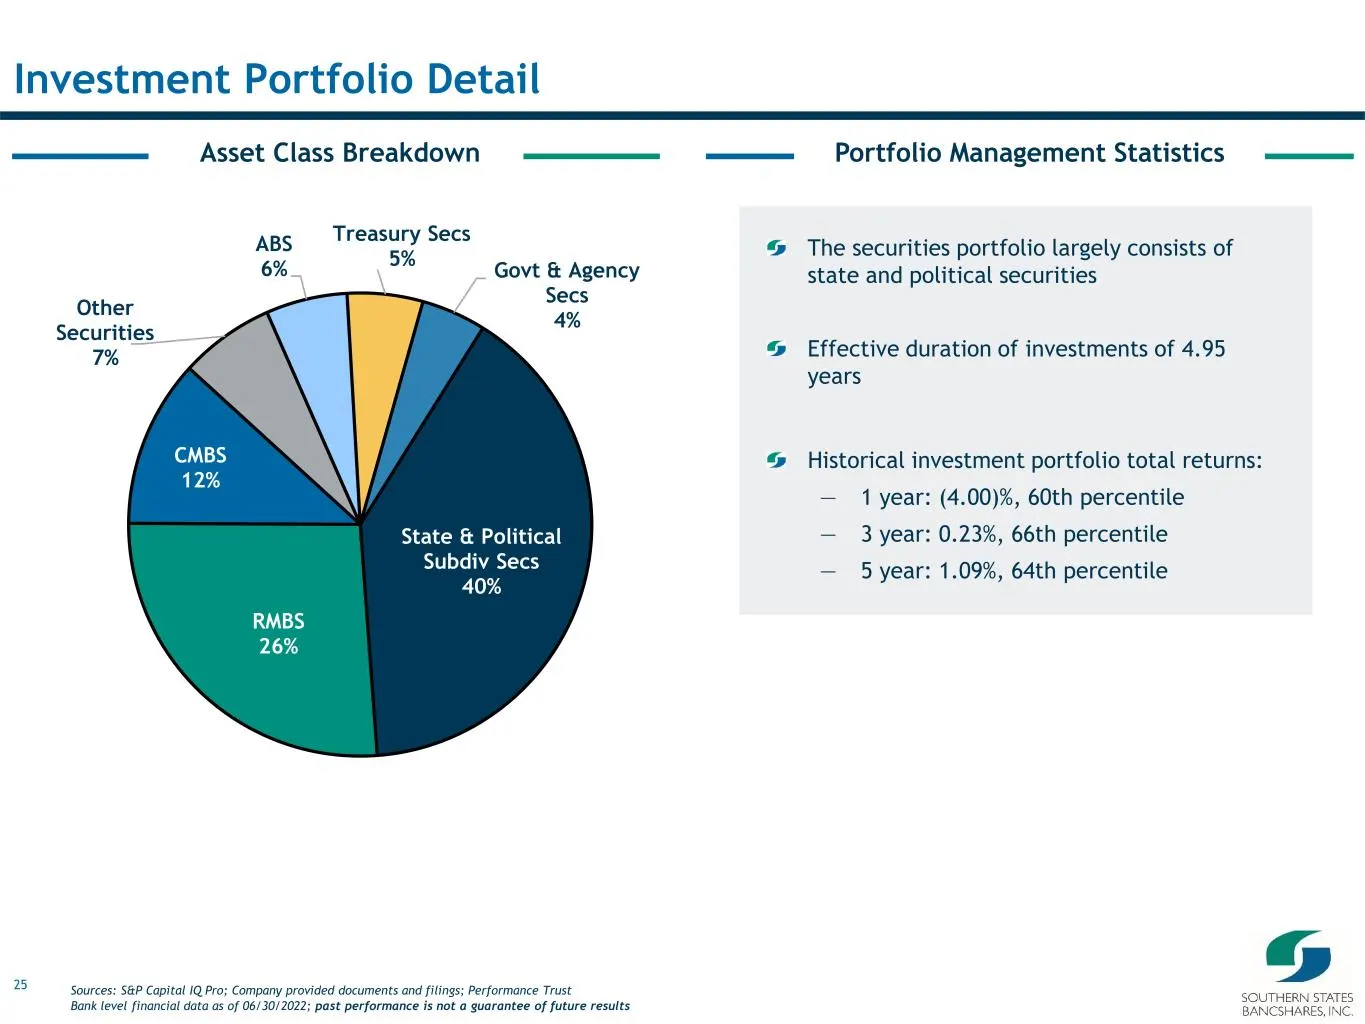
25 Asset Class Breakdown Investment Portfolio Detail The securities portfolio largely consists of state and political securities Effective duration of investments of 4.95 years Historical investment portfolio total returns: — 1 year: (4.00)%, 60th percentile — 3 year: 0.23%, 66th percentile — 5 year
Slide 26: Loan Portfolio Diversification & Growth
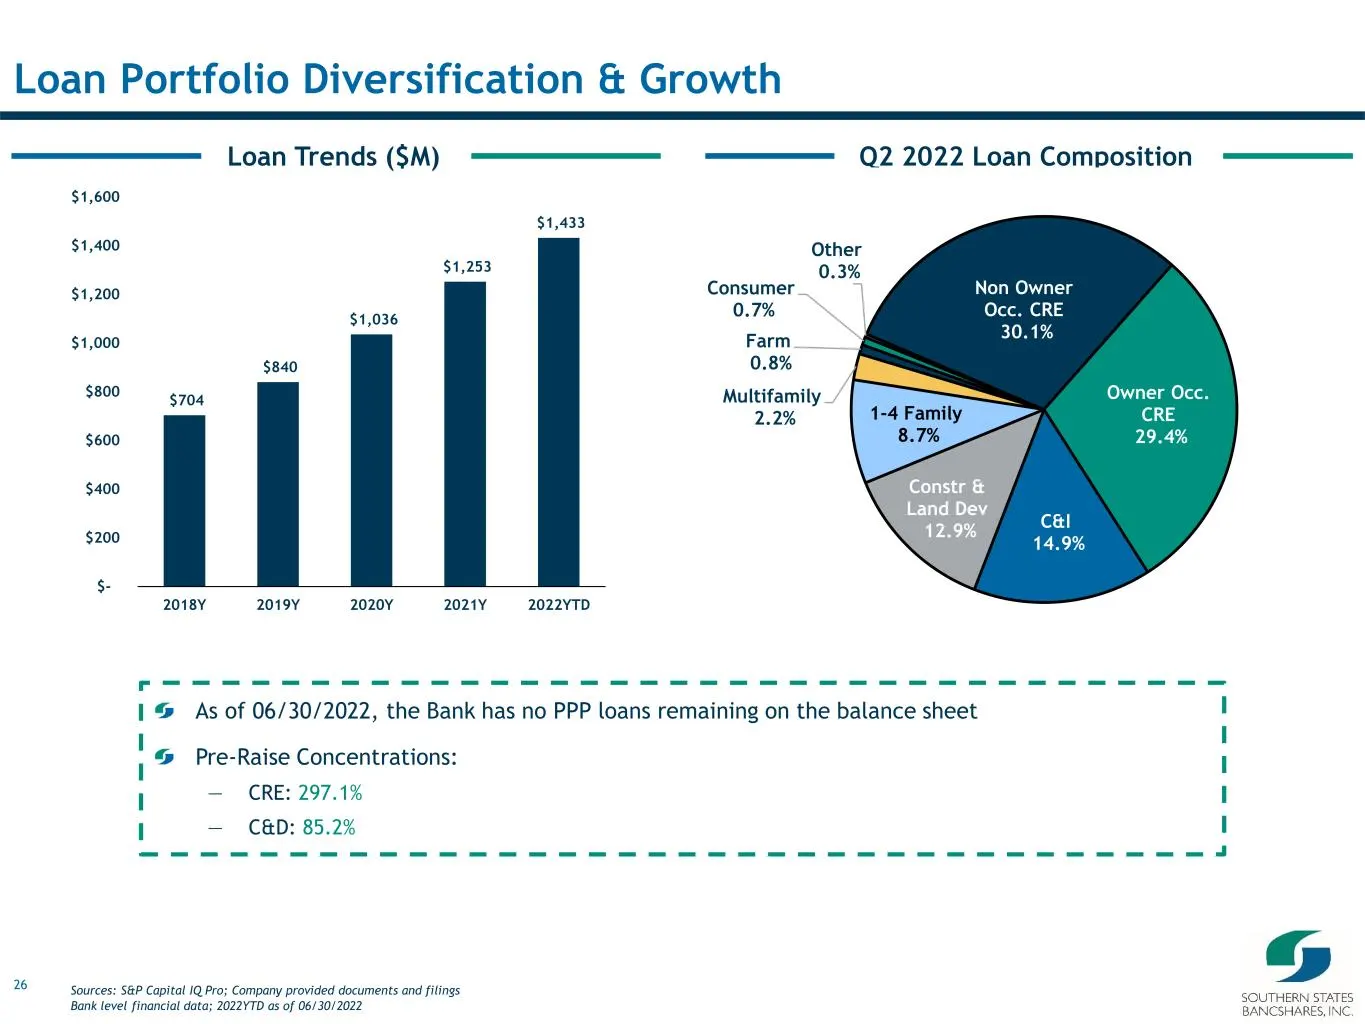
26 Q2 2022 Loan CompositionLoan Trends ($M) Loan Portfolio Diversification & Growth As of 06/30/2022, the Bank has no PPP loans remaining on the balance sheet Pre-Raise Concentrations: — CRE: 297.1% — C&D: 85.2% $704 $840 $1,036 $1,253 $1,433 $- $200 $400 $600 $800 $1,000 $1,200 $1,400 $1,600 2018Y
Slide 27: CRE and C&D Loan Detail
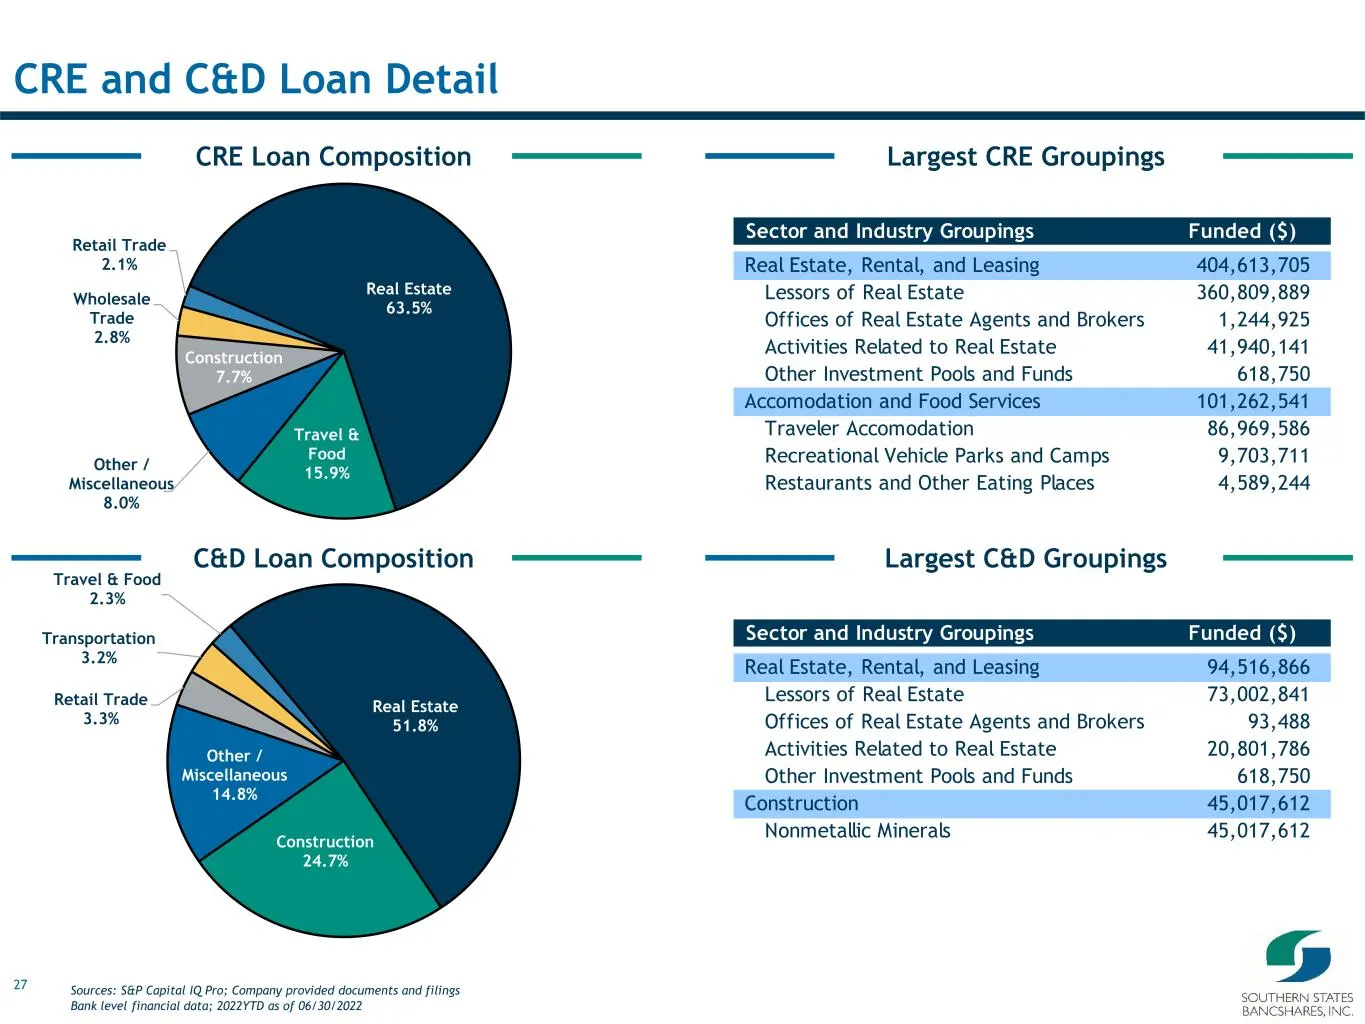
27 Real Estate 63.5% Travel & Food 15.9% Other / Miscellaneous 8.0% Construction 7.7% Wholesale Trade 2.8% Retail Trade 2.1% Largest CRE GroupingsCRE Loan Composition CRE and C&D Loan Detail Sources: S&P Capital IQ Pro; Company provided documents and filings Bank level financial data; 2022YTD as of
Slide 28: Loan Composition Since 2018
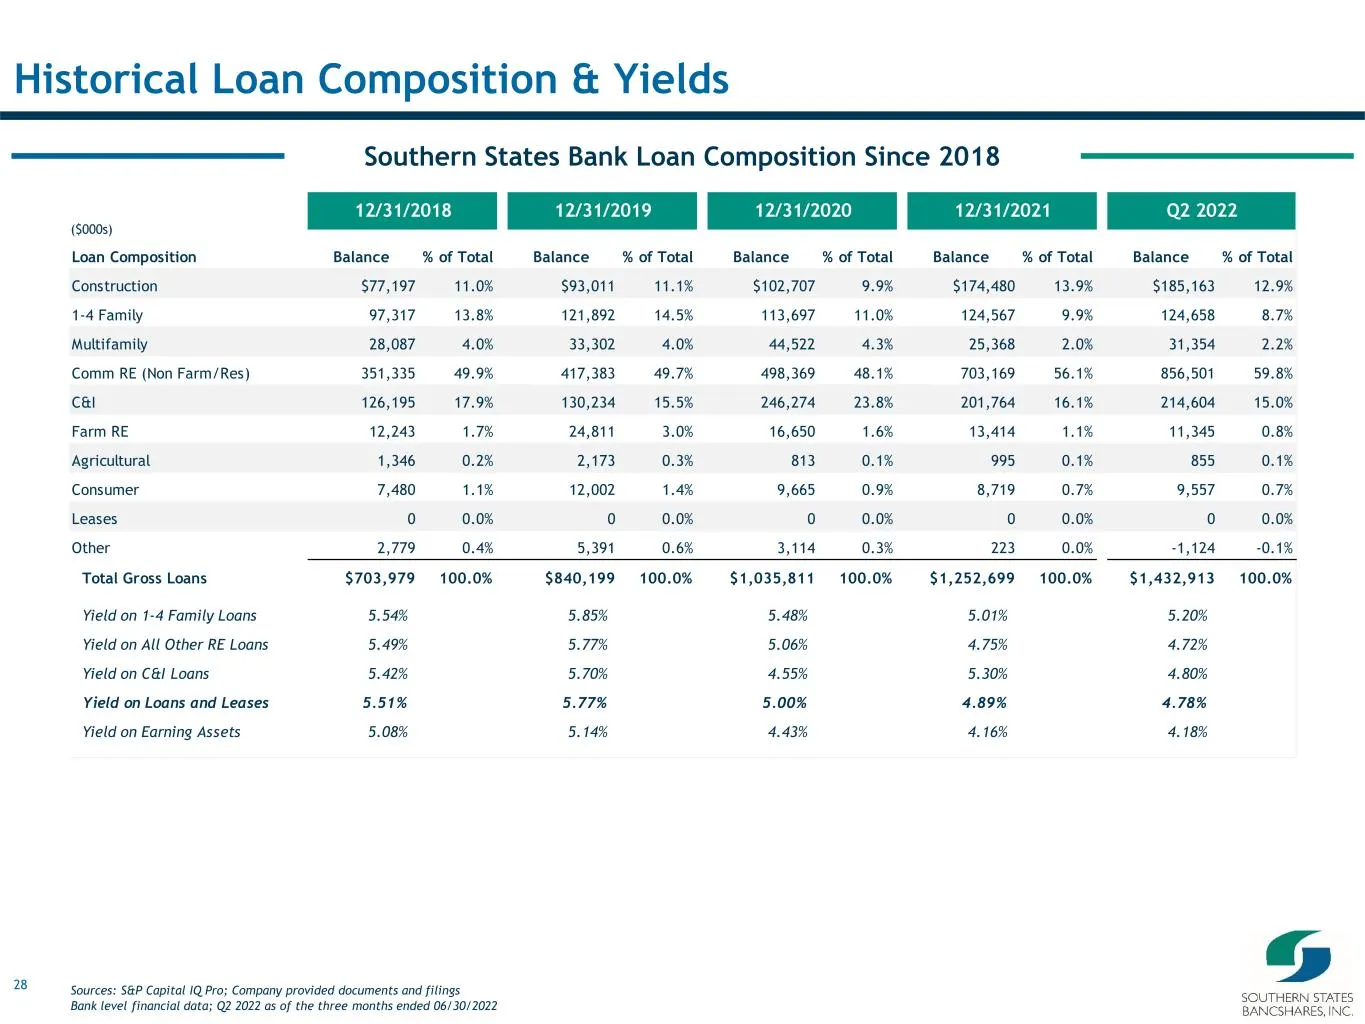
28 Southern States Bank Loan Composition Since 2018 Historical Loan Composition & Yields 12/31/2018 12/31/2019 12/31/2020 12/31/2021 Q2 2022 Loan Composition Balance % of Total Balance % of Total Balance % of Total Balance % of Total Balance % of Total Construction $77,197 11.0% $93,011 11.1% $102,7
Slide 29: Asset Quality Detail
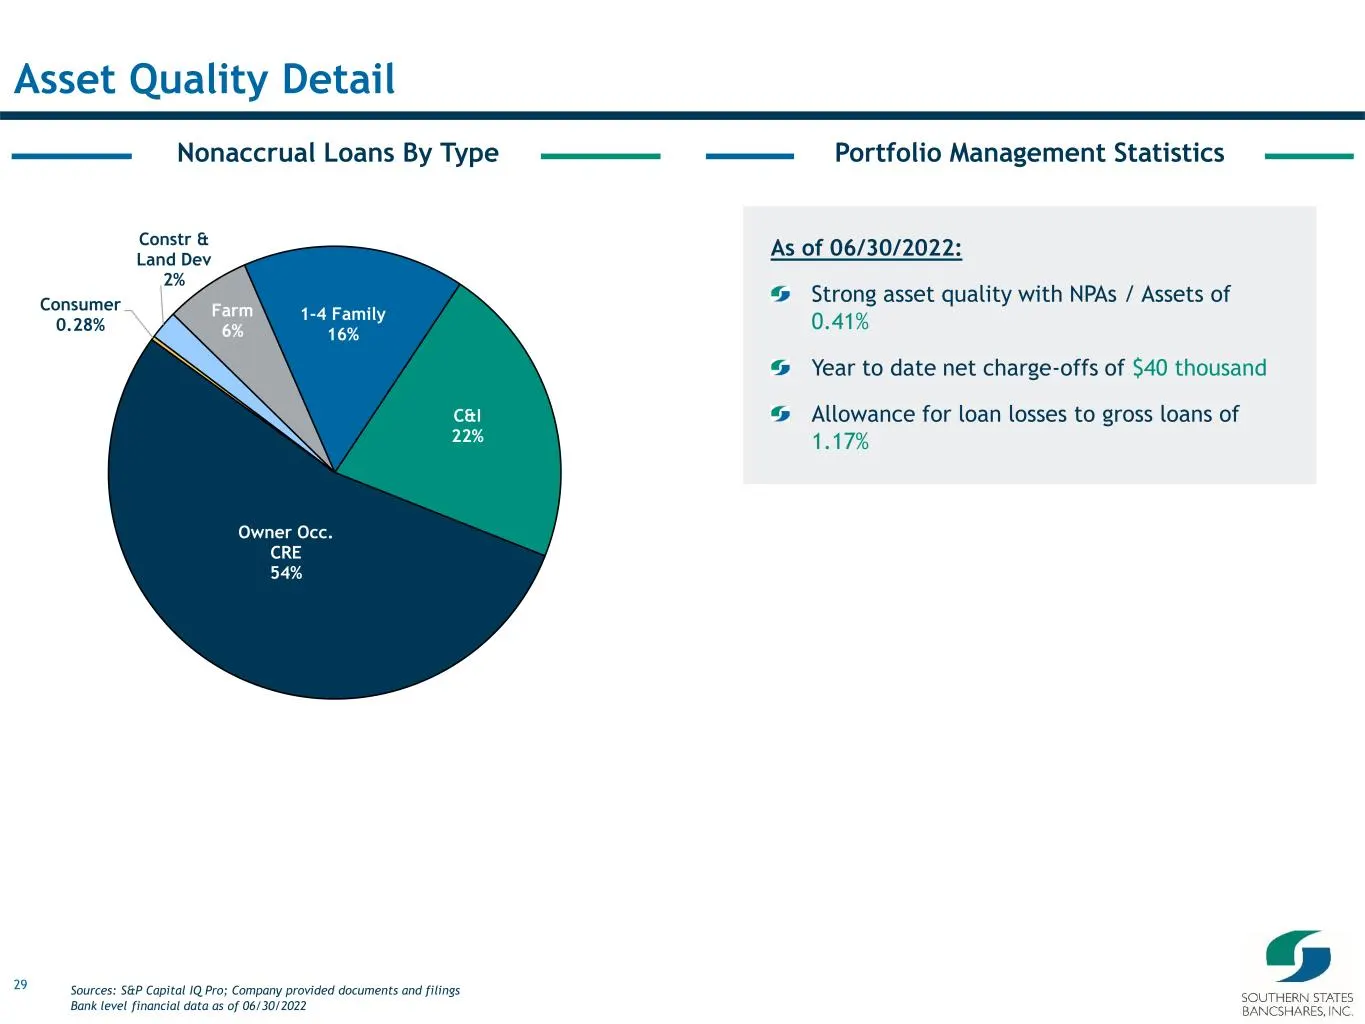
29 Nonaccrual Loans By Type Asset Quality Detail As of 06/30/2022: Strong asset quality with NPAs / Assets of 0.41% Year to date net charge-offs of $40 thousand Allowance for loan losses to gross loans of 1.17% Portfolio Management Statistics Constr & Land Dev 2% Farm 6% 1-4 Family 16% C&I 22% Owner
Slide 30: Asset Quality & Reserve Coverage Ratios
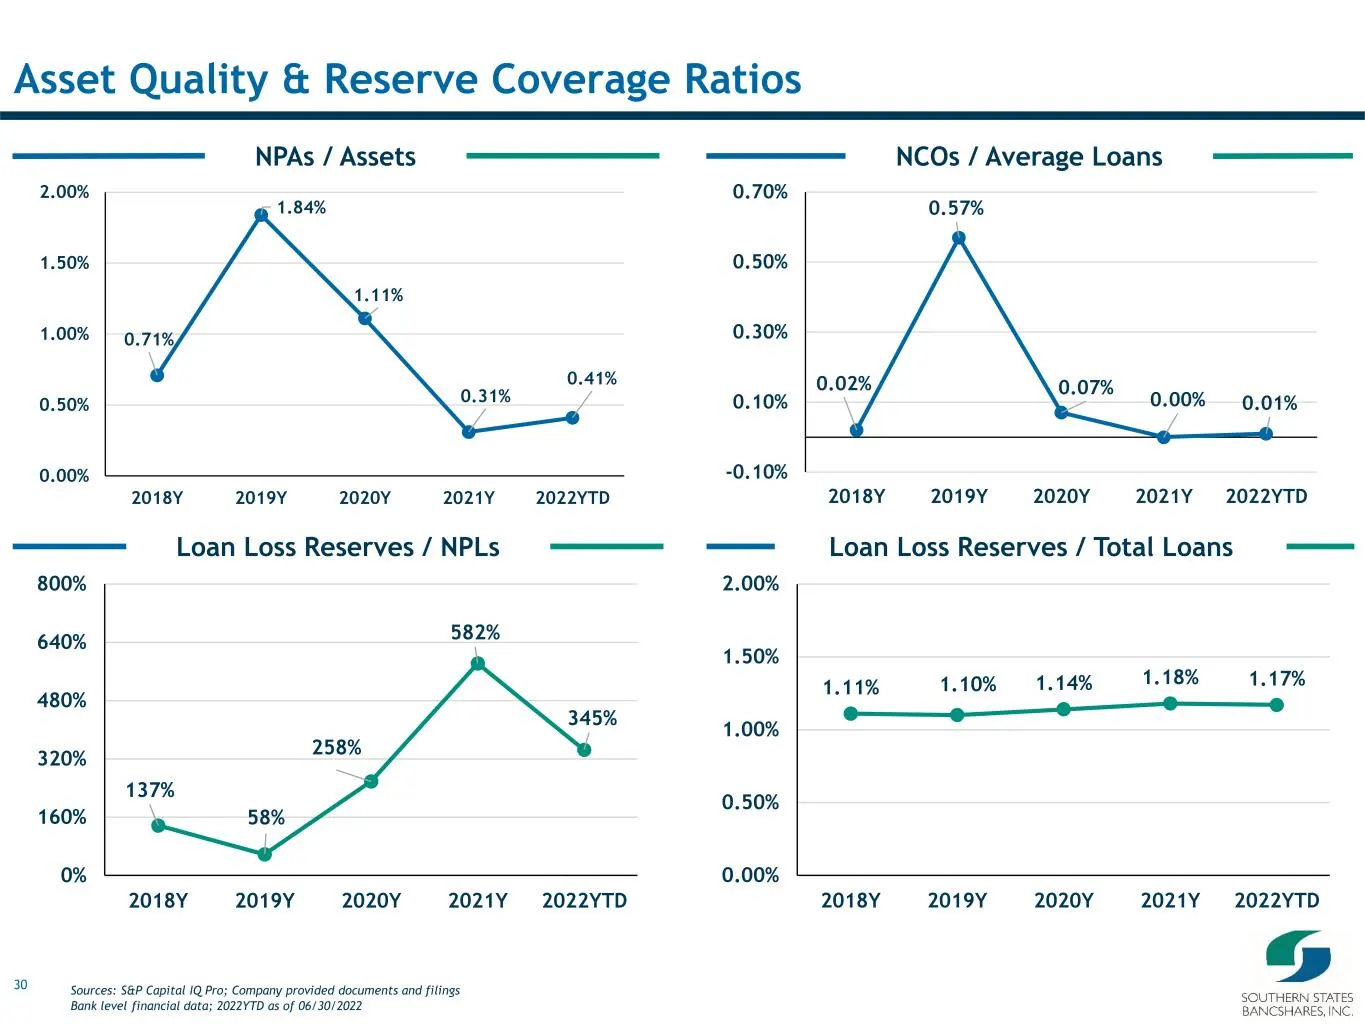
30 1.11% 1.10% 1.14% 1.18% 1.17% 0.00% 0.50% 1.00% 1.50% 2.00% 2018Y 2019Y 2020Y 2021Y 2022YTD Loan Loss Reserves / NPLs NCOs / Average LoansNPAs / Assets Asset Quality & Reserve Coverage Ratios Loan Loss Reserves / Total Loans 0.71% 1.84% 1.11% 0.31% 0.41% 0.00% 0.50% 1.00% 1.50% 2.00% 2018Y 2019Y
Slide 31: Historical Net Charge-Offs & Non-performing Assets
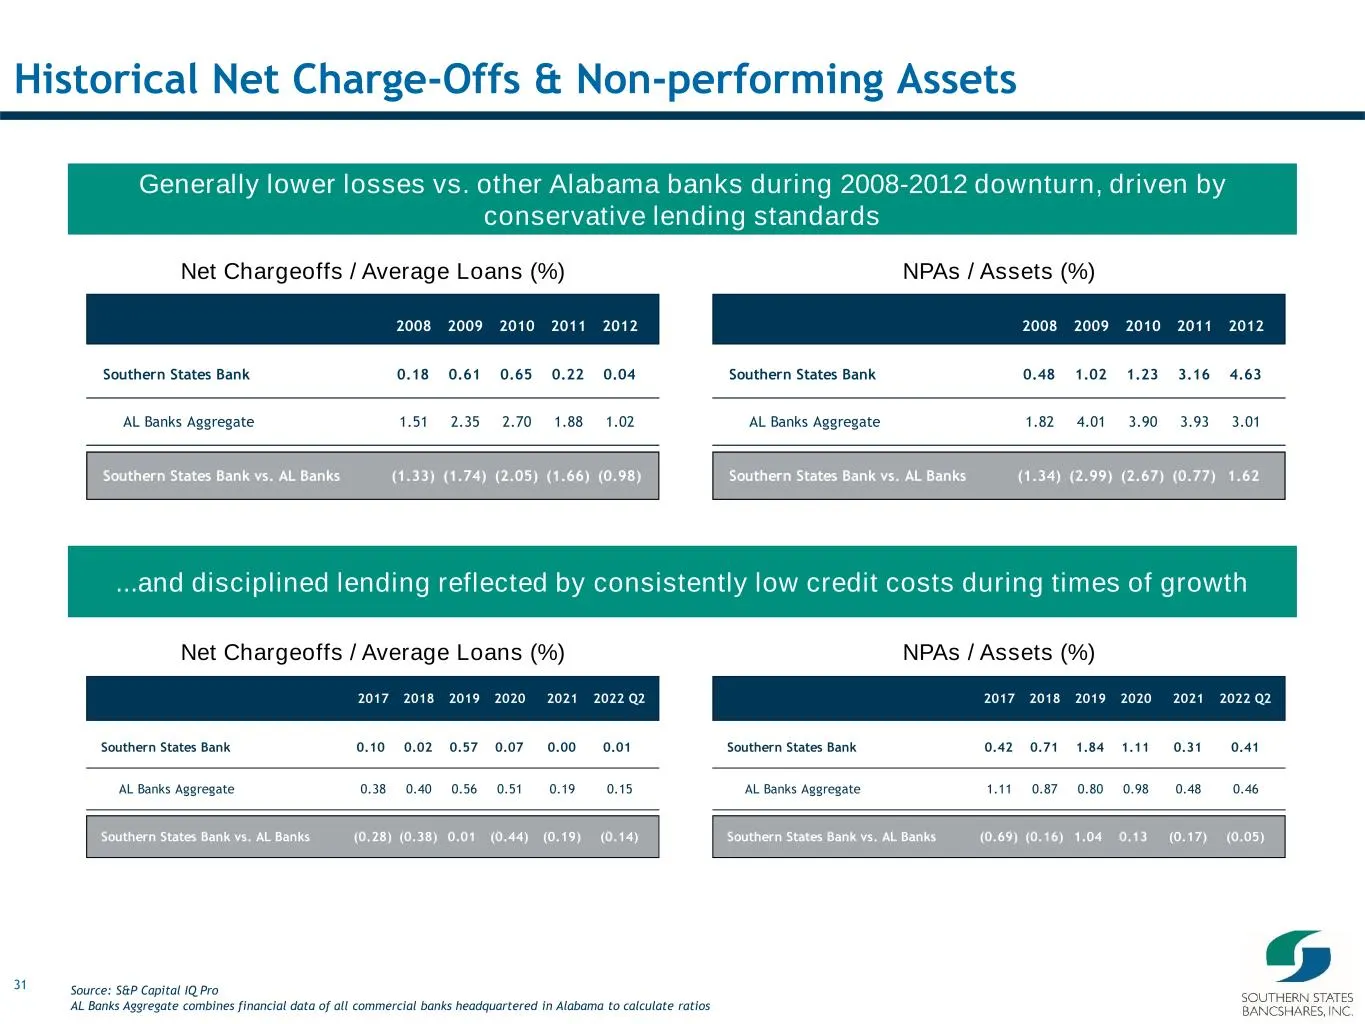
31 Historical Net Charge-Offs & Non-performing Assets Source: S&P Capital IQ Pro AL Banks Aggregate combines financial data of all commercial banks headquartered in Alabama to calculate ratios 2017 2018 2019 2020 2021 2022 Q2 Southern States Bank 0.10 0.02 0.57 0.07 0.00 0.01 AL Banks Aggregate 0.38
Slide 32: Liabilities Highlights
32 IV. Liabilities Highlights
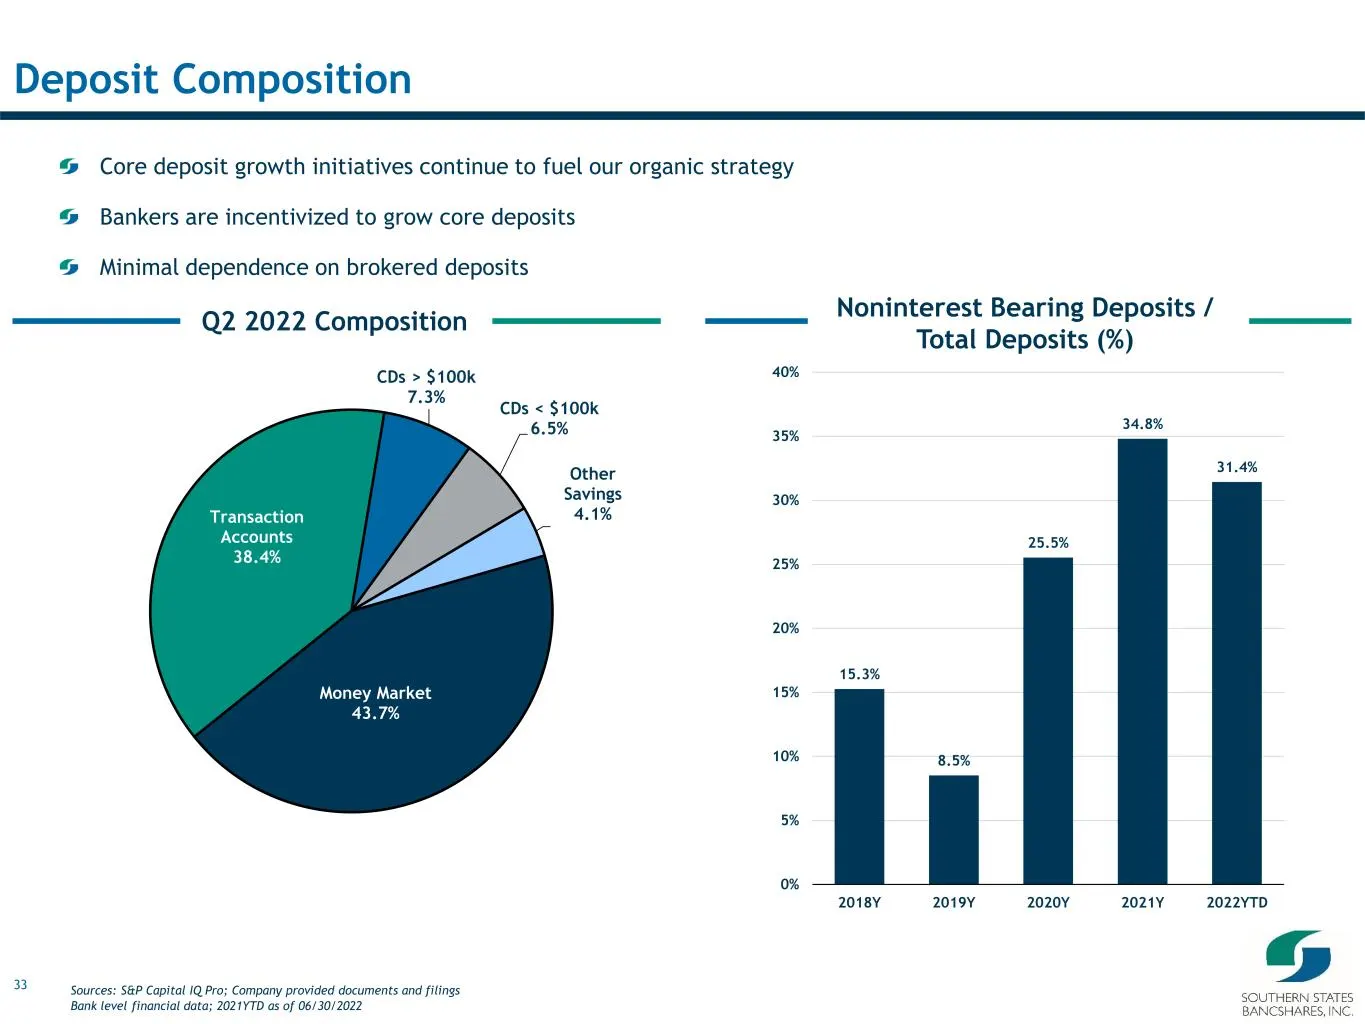
Slide 33: Deposit Composition
33 Core deposit growth initiatives continue to fuel our organic strategy Bankers are incentivized to grow core deposits Minimal dependence on brokered deposits 15.3% 8.5% 25.5% 34.8% 31.4% 0% 5% 10% 15% 20% 25% 30% 35% 40% 2018Y 2019Y 2020Y 2021Y 2022YTD Noninterest Bearing Deposits / Total Deposits
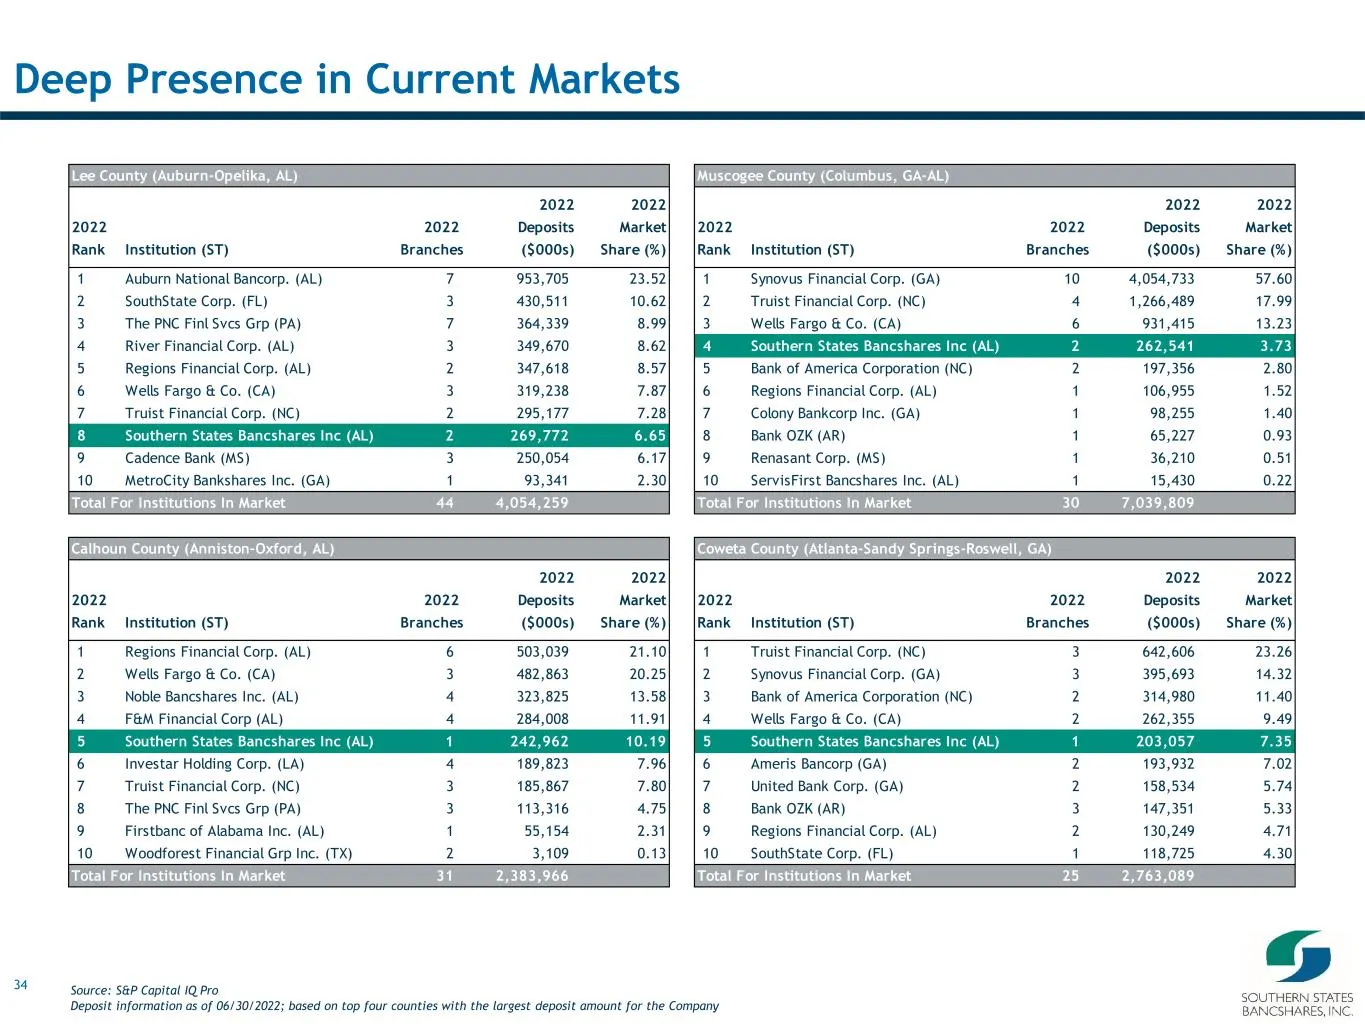
Slide 34: Deep Presence in Current Markets
34 Deep Presence in Current Markets Calhoun County (Anniston–Oxford, AL) 2022 2022 2022 2022 Deposits Market Rank Institution (ST) Branches ($000s) Share (%) 1 Regions Financial Corp. (AL) 6 503,039 21.10 2 Wells Fargo & Co. (CA) 3 482,863 20.25 3 Noble Bancshares Inc. (AL) 4 323,825 13.58 4 F&M Fin
Slide 35: Capital Highlights
35 Capital Highlights fy SOUTHERN STATES BANCSHARES, INC,
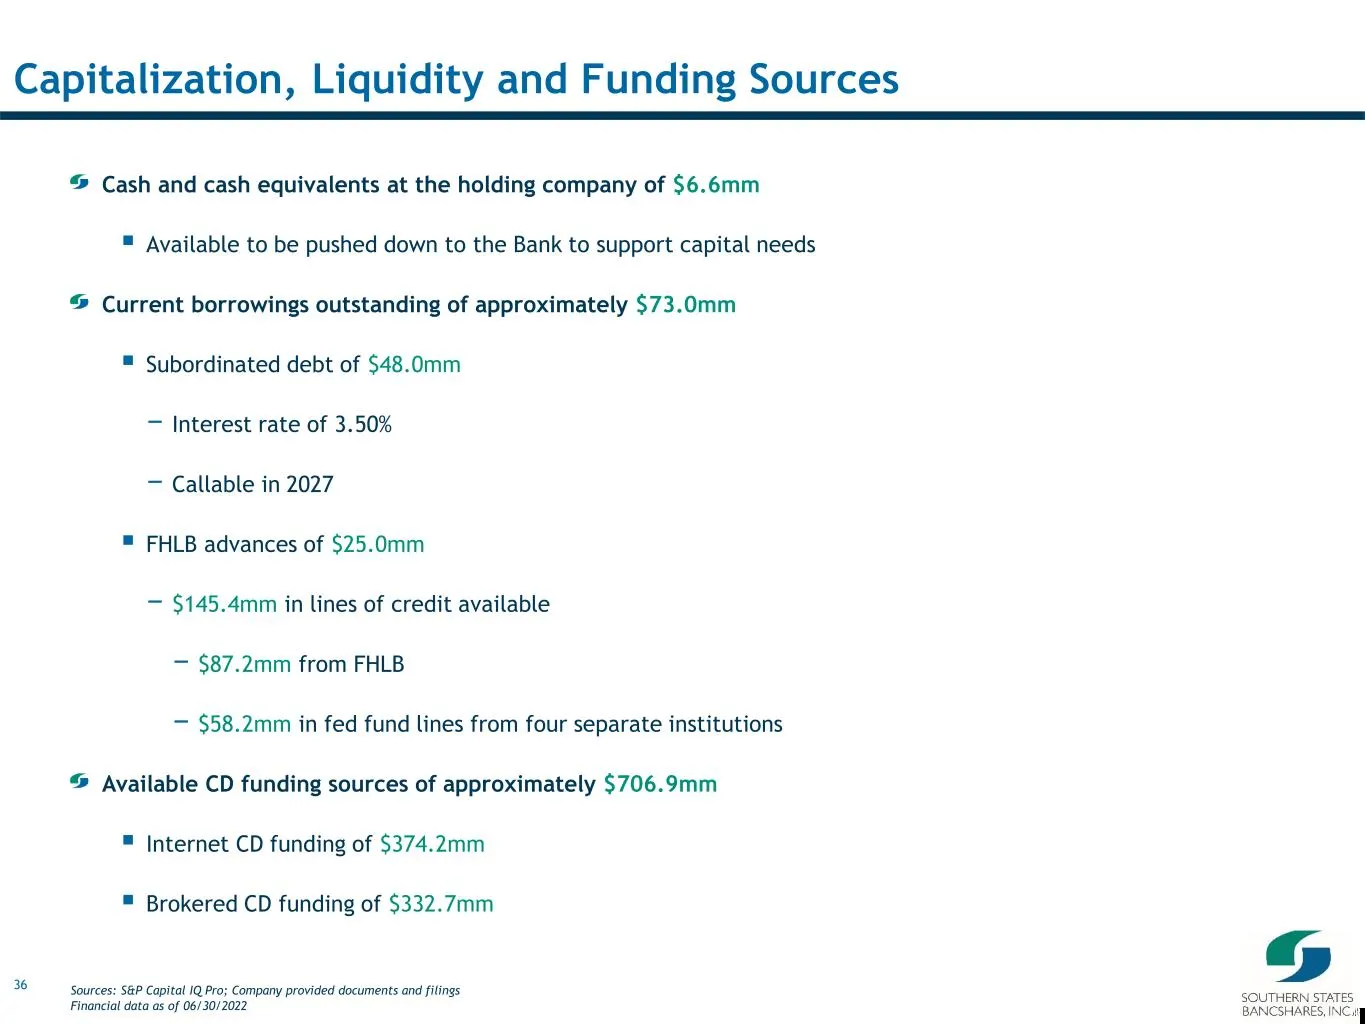
Slide 36: Capitalization, Liquidity and Funding Sources
36 Sources: S&P Capital IQ Pro; Company provided documents and filings Financial data as of 06/30/2022 Cash and cash equivalents at the holding company of $6.6mm ▪ Available to be pushed down to the Bank to support capital needs Current borrowings outstanding of approximately $73.0mm ▪ Subordinated
Slide 37: Bank Capital Ratios
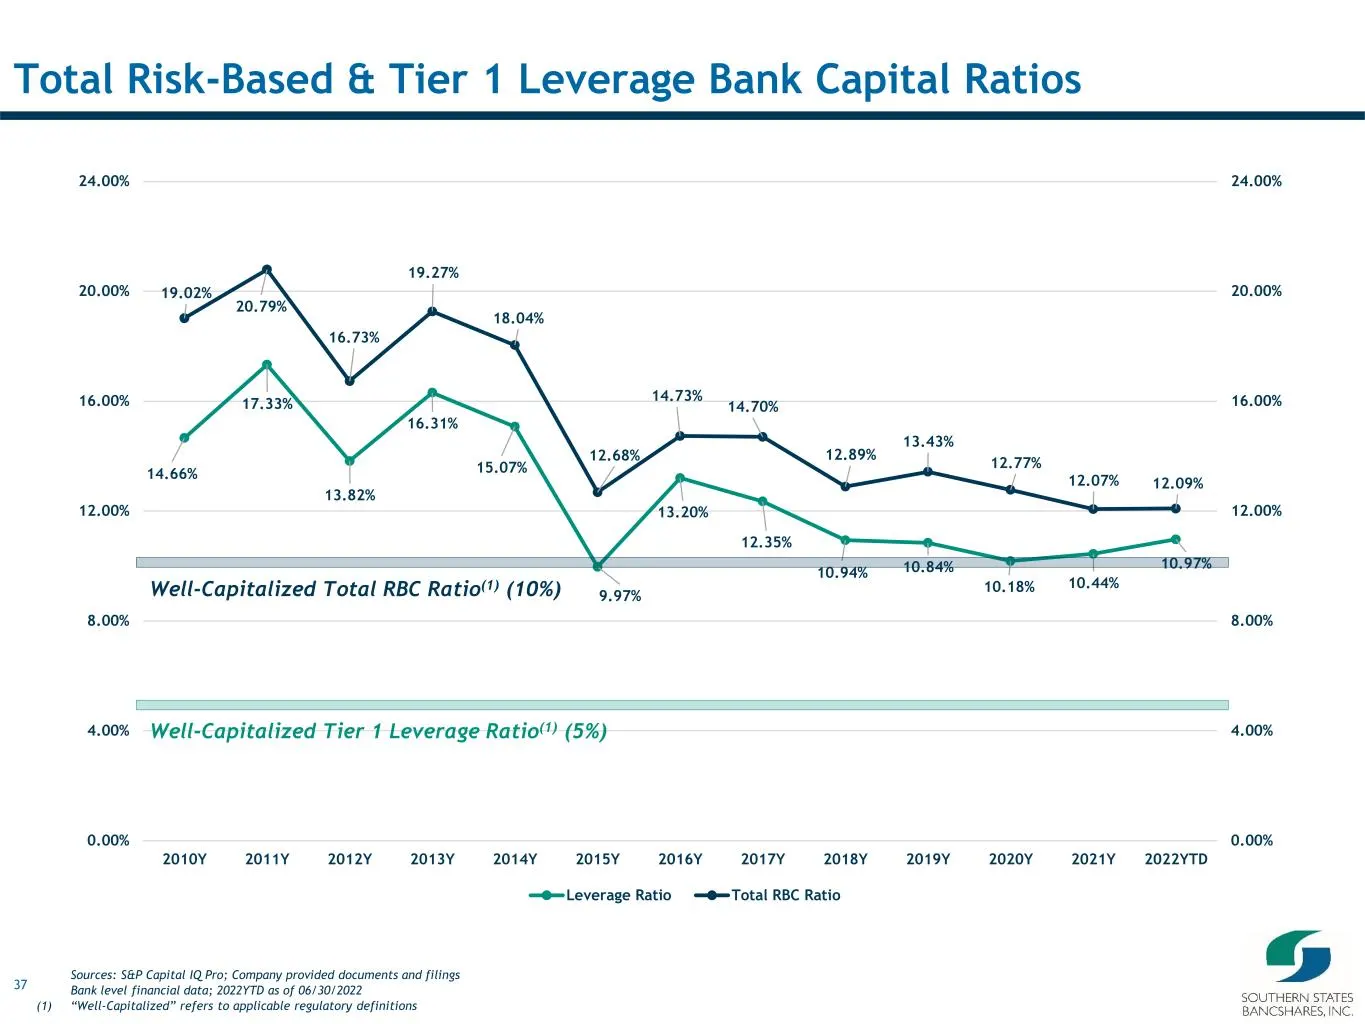
37 14.66% 17.33% 13.82% 16.31% 15.07% 9.97% 13.20% 12.35% 10.94% 10.84% 10.18% 10.44% 10.97% 19.02% 20.79% 16.73% 19.27% 18.04% 12.68% 14.73% 14.70% 12.89% 13.43% 12.77% 12.07% 12.09% 0.00% 4.00% 8.00% 12.00% 16.00% 20.00% 24.00% 0.00% 4.00% 8.00% 12.00% 16.00% 20.00% 24.00% 2010Y 2011Y 2012Y 2013Y
Slide 38: Historical Regulatory Capital Ratios
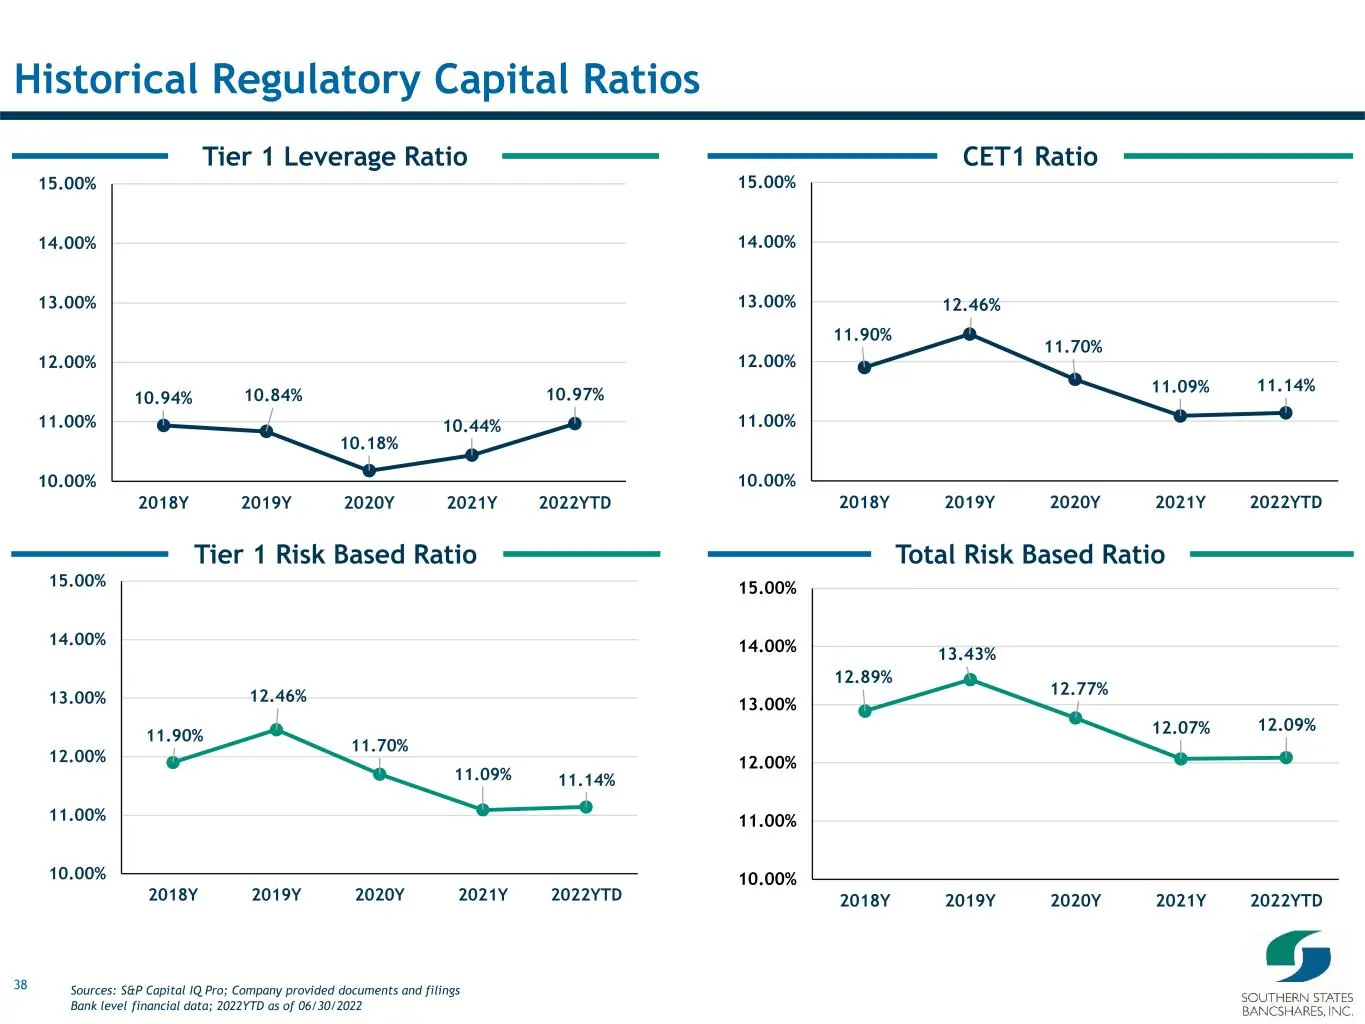
38 Total Risk Based RatioTier 1 Risk Based Ratio CET1 RatioTier 1 Leverage Ratio Historical Regulatory Capital Ratios 10.94% 10.84% 10.18% 10.44% 10.97% 10.00% 11.00% 12.00% 13.00% 14.00% 15.00% 2018Y 2019Y 2020Y 2021Y 2022YTD 12.89% 13.43% 12.77% 12.07% 12.09% 10.00% 11.00% 12.00% 13.00% 14.00% 15.
Slide 39: Income Statement Highlights
39 VI. Income Statement Highlights
Slide 40: Historical Profitability
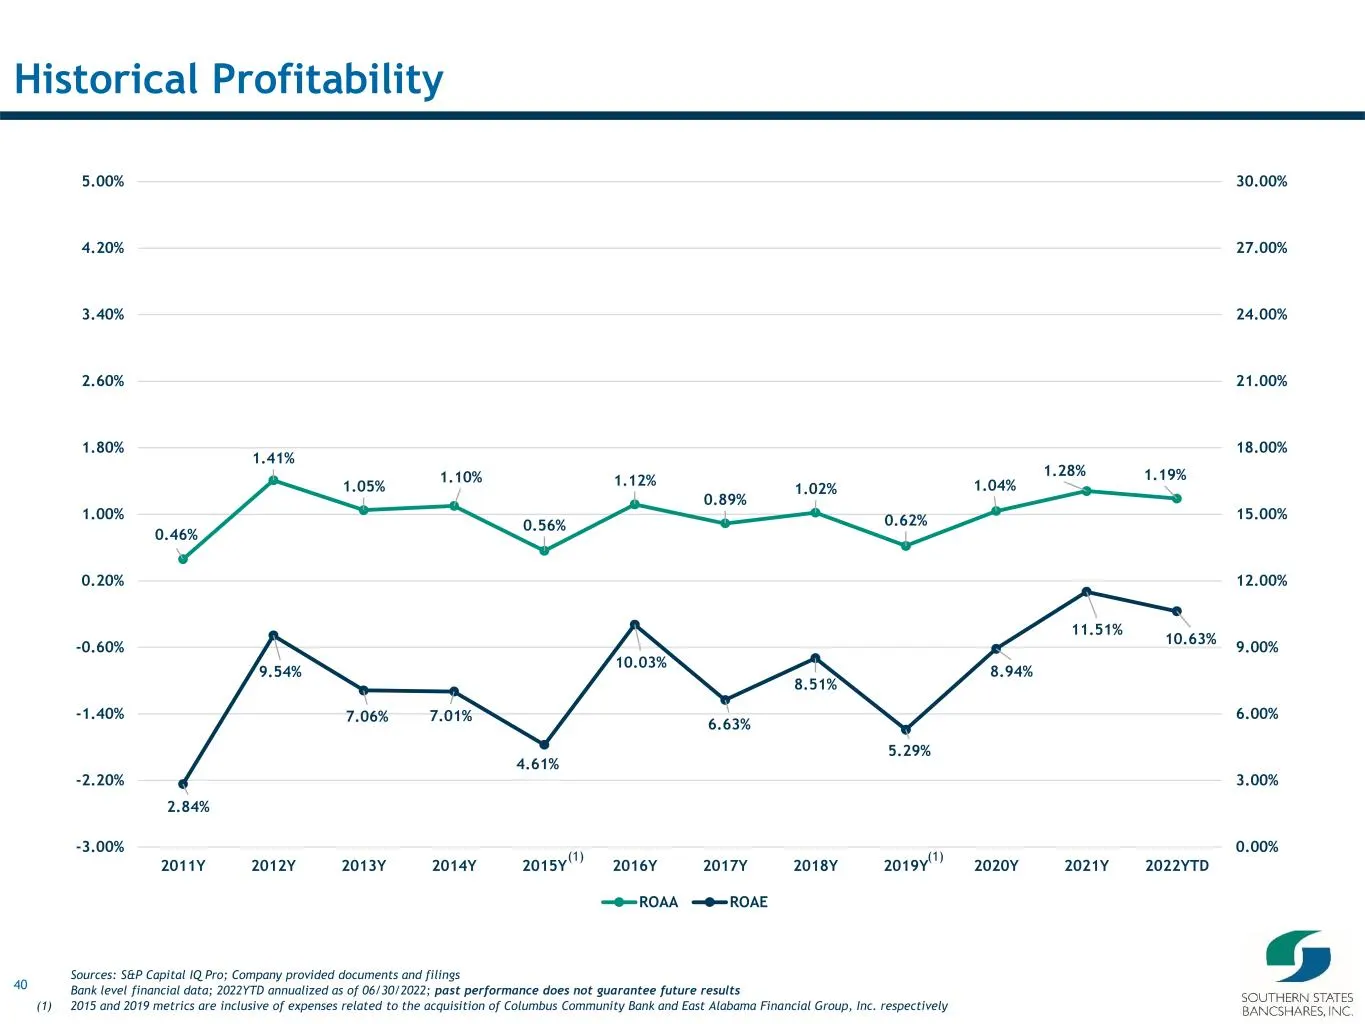
40 0.46% 1.41% 1.05% 1.10% 0.56% 1.12% 0.89% 1.02% 0.62% 1.04% 1.28% 1.19% 2.84% 9.54% 7.06% 7.01% 4.61% 10.03% 6.63% 8.51% 5.29% 8.94% 11.51% 10.63% 0.00% 3.00% 6.00% 9.00% 12.00% 15.00% 18.00% 21.00% 24.00% 27.00% 30.00% -3.00% -2.20% -1.40% -0.60% 0.20% 1.00% 1.80% 2.60% 3.40% 4.20% 5.00% 2011Y 2
Slide 41: Core Revenue Detail
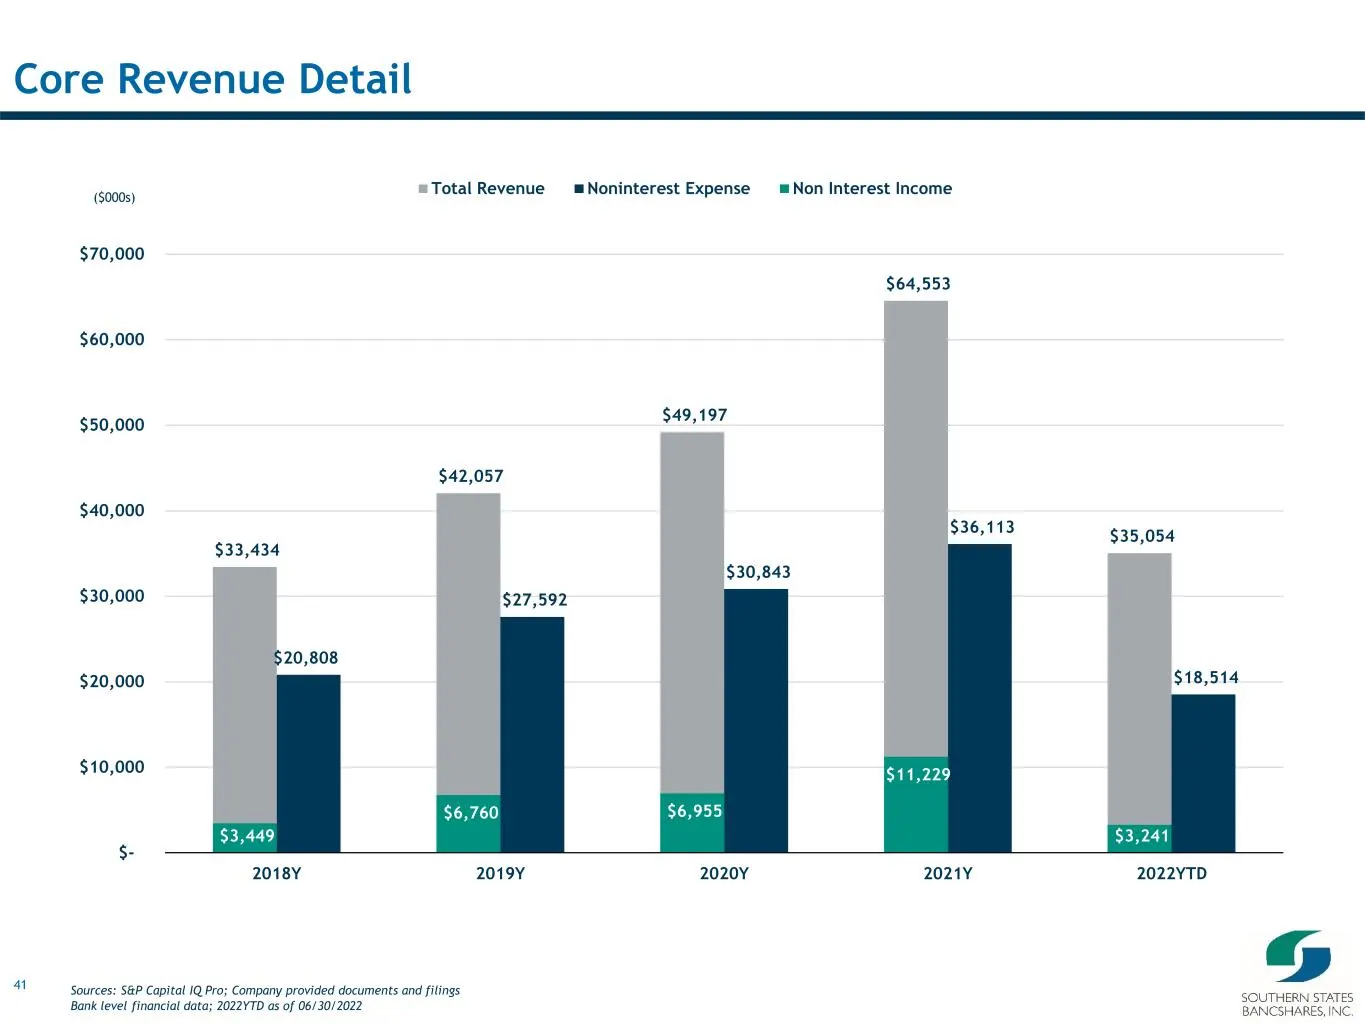
41 $33,434 $42,057 $49,197 $64,553 $35,054 $20,808 $27,592 $30,843 $36,113 $18,514 $3,449 $6,760 $6,955 $11,229 $3,241 $- $10,000 $20,000 $30,000 $40,000 $50,000 $60,000 $70,000 2018Y 2019Y 2020Y 2021Y 2022YTD Total Revenue Noninterest Expense Non Interest Income Core Revenue Detail Sources: S&P Cap
Slide 42: Net Interest Income & Net Interest Margin
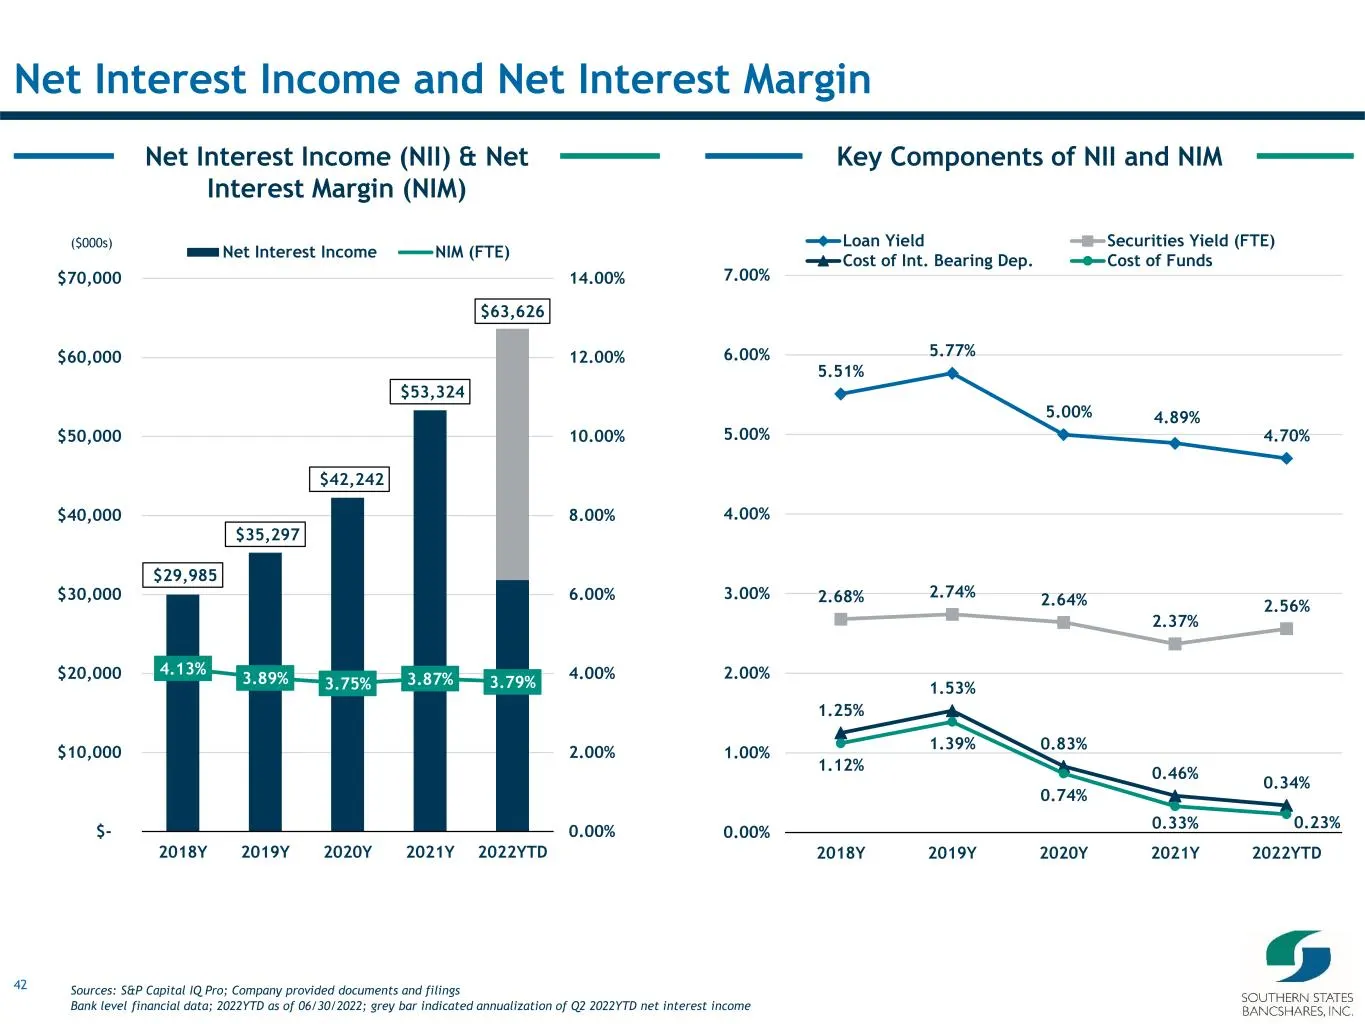
42 Key Components of NII and NIMNet Interest Income (NII) & Net Interest Margin (NIM) Net Interest Income and Net Interest Margin $29,985 $35,297 $42,242 $53,324 $63,626 4.13% 3.89% 3.75% 3.87% 3.79% 0.00% 2.00% 4.00% 6.00% 8.00% 10.00% 12.00% 14.00% $- $10,000 $20,000 $30,000 $40,000 $50,000 $60,00
Slide 43: Profitability and Expense Controls
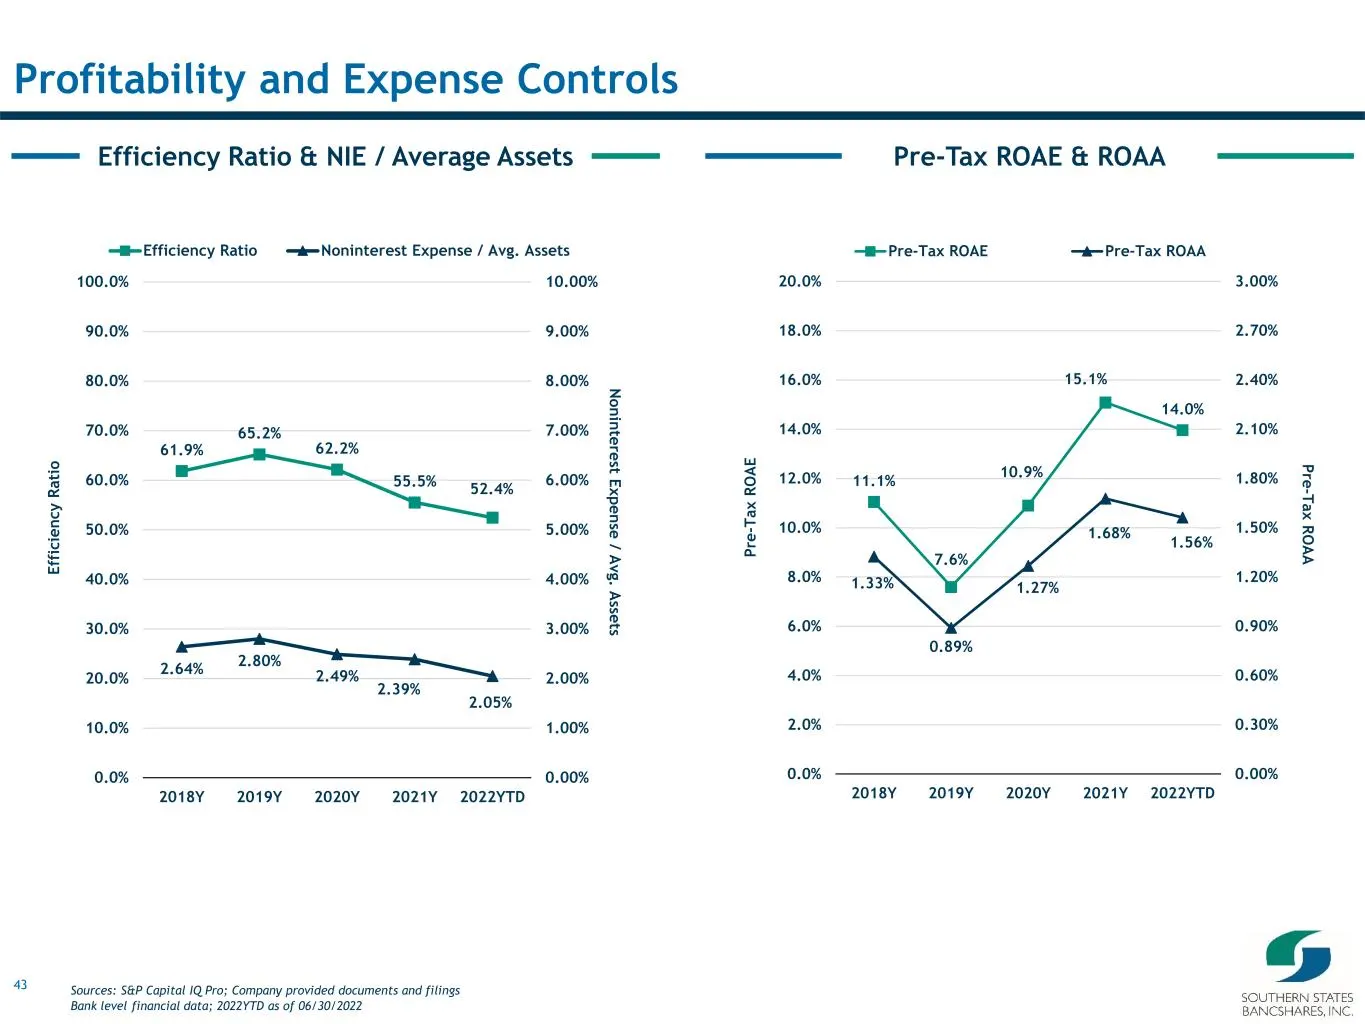
43 Pre-Tax ROAE & ROAAEfficiency Ratio & NIE / Average Assets Profitability and Expense Controls 61.9% 65.2% 62.2% 55.5% 52.4% 2.64% 2.80% 2.49% 2.39% 2.05% 0.00% 1.00% 2.00% 3.00% 4.00% 5.00% 6.00% 7.00% 8.00% 9.00% 10.00% 0.0% 10.0% 20.0% 30.0% 40.0% 50.0% 60.0% 70.0% 80.0% 90.0% 100.0% 2018Y 2019
Slide 44: Net Interest Margin vs. Net Noninterest Expense
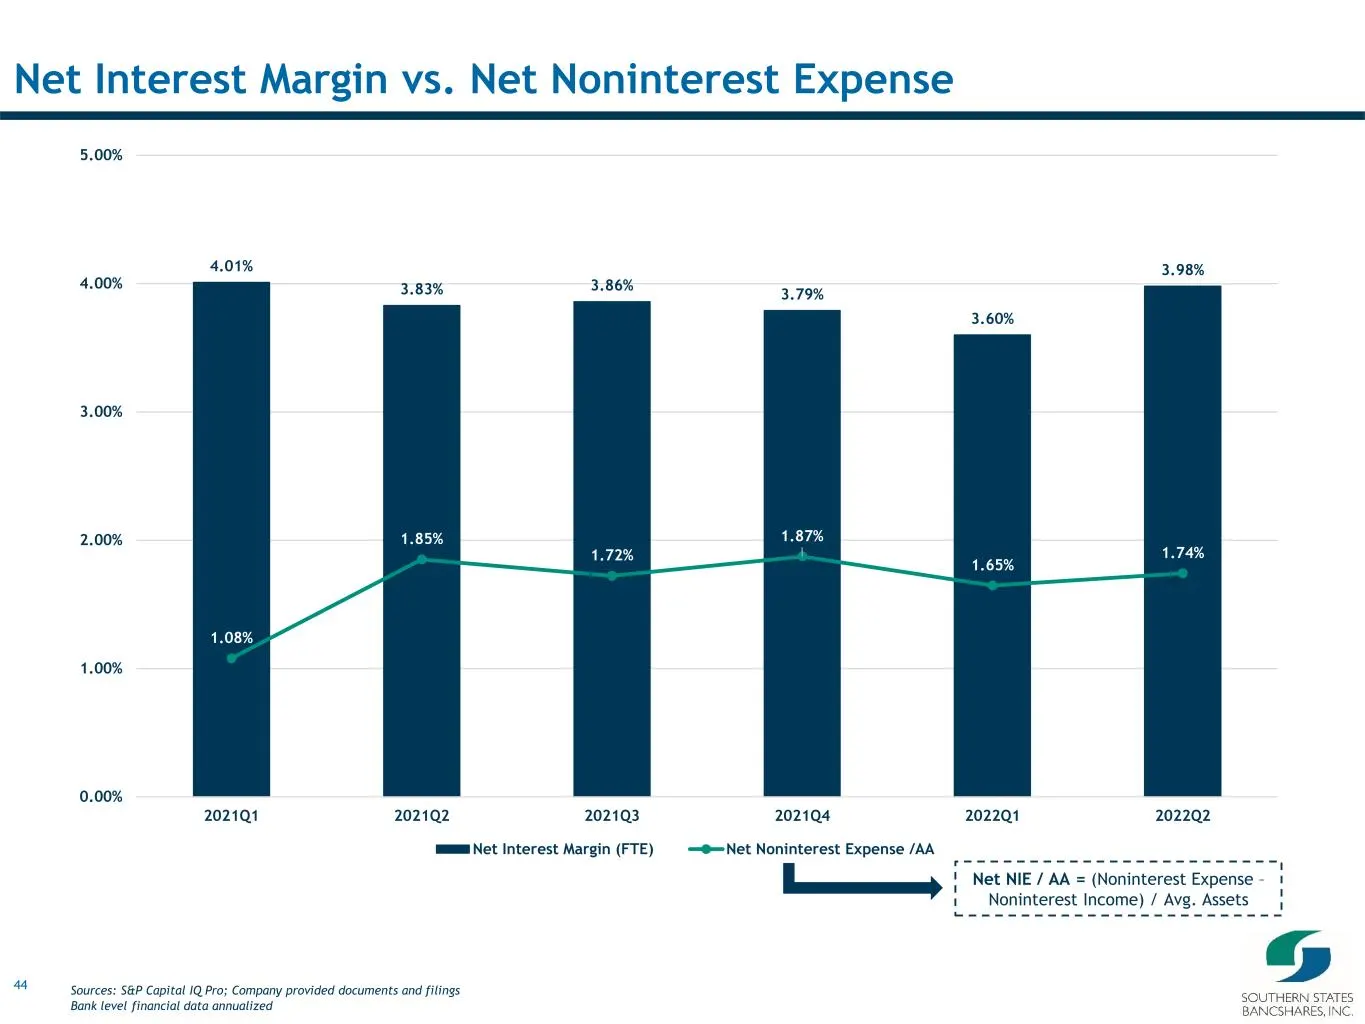
44 Net Interest Margin vs. Net Noninterest Expense 4.01% 3.83% 3.86% 3.79% 3.60% 3.98% 1.08% 1.85% 1.72% 1.87% 1.65% 1.74% 0.00% 1.00% 2.00% 3.00% 4.00% 5.00% 2021Q1 2021Q2 2021Q3 2021Q4 2022Q1 2022Q2 Net Interest Margin (FTE) Net Noninterest Expense /AA Net NIE / AA = (Noninterest Expense – Noninte
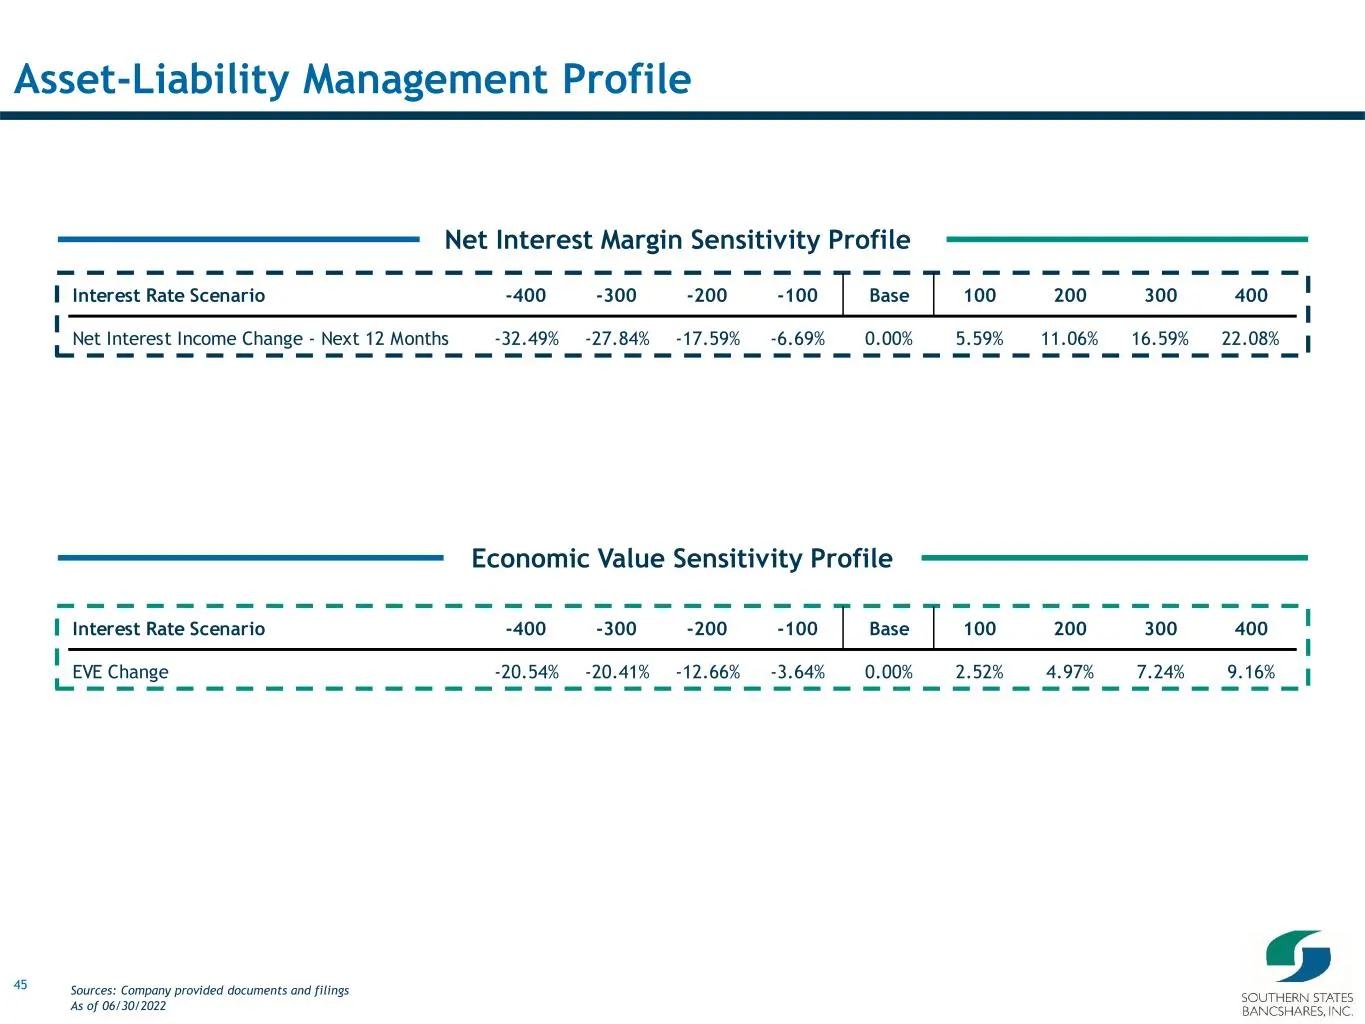
Slide 45: Interest Rate Sensitivity Profile
45 Net Interest Margin Sensitivity Profile Asset-Liability Management Profile Economic Value Sensitivity Profile Interest Rate Scenario -400 -300 -200 -100 Base 100 200 300 400 Net Interest Income Change - Next 12 Months -32.49% -27.84% -17.59% -6.69% 0.00% 5.59% 11.06% 16.59% 22.08% Interest Rate S
Slide 46: Appendix
46 Vil. Appendix fy SOUTHERN STATES BANCSHARES, INC,
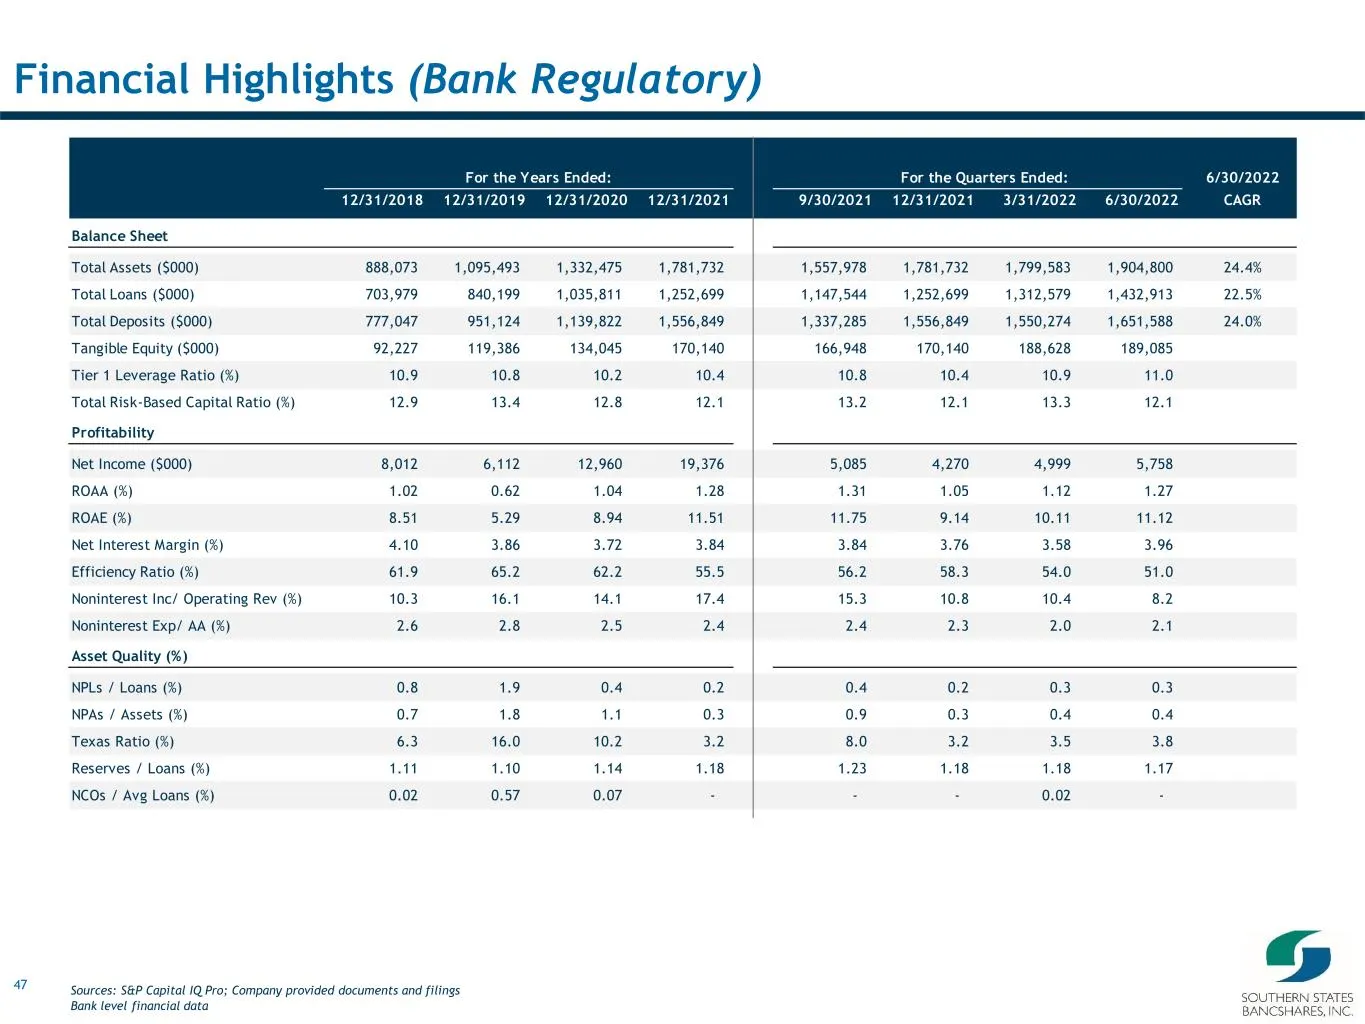
Slide 47: Financial Highlights (Bank Regulatory)
47 Financial Highlights (Bank Regulatory) For the Years Ended: For the Quarters Ended: 6/30/2022 12/31/2018 12/31/2019 12/31/2020 12/31/2021 9/30/2021 12/31/2021 3/31/2022 6/30/2022 CAGR Balance Sheet Total Assets ($000) 888,073 1,095,493 1,332,475 1,781,732 1,557,978 1,781,732 1,799,583 1,904,800 2
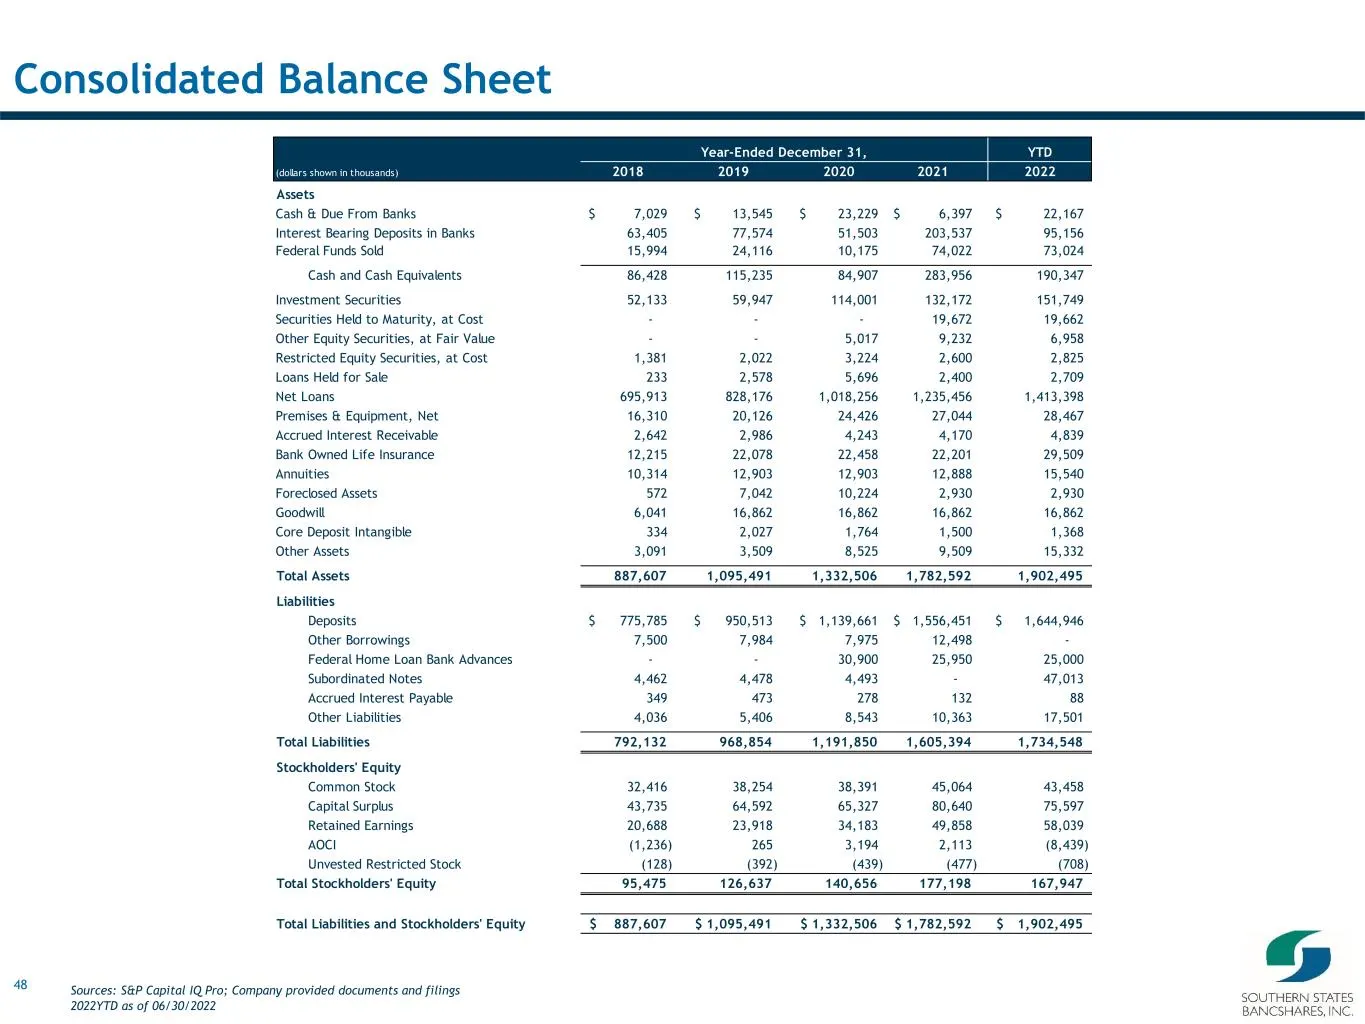
Slide 48: Consolidated Balance Sheet
48 Consolidated Balance Sheet Year-Ended December 31, YTD (dollars shown in thousands) 2018 2019 2020 2021 2022 Assets Cash & Due From Banks 7,029$ 13,545$ 23,229$ 6,397$ 22,167$ Interest Bearing Deposits in Banks 63,405 77,574 51,503 203,537 95,156 Federal Funds Sold 15,994 24,116 10,175 74,022 73,
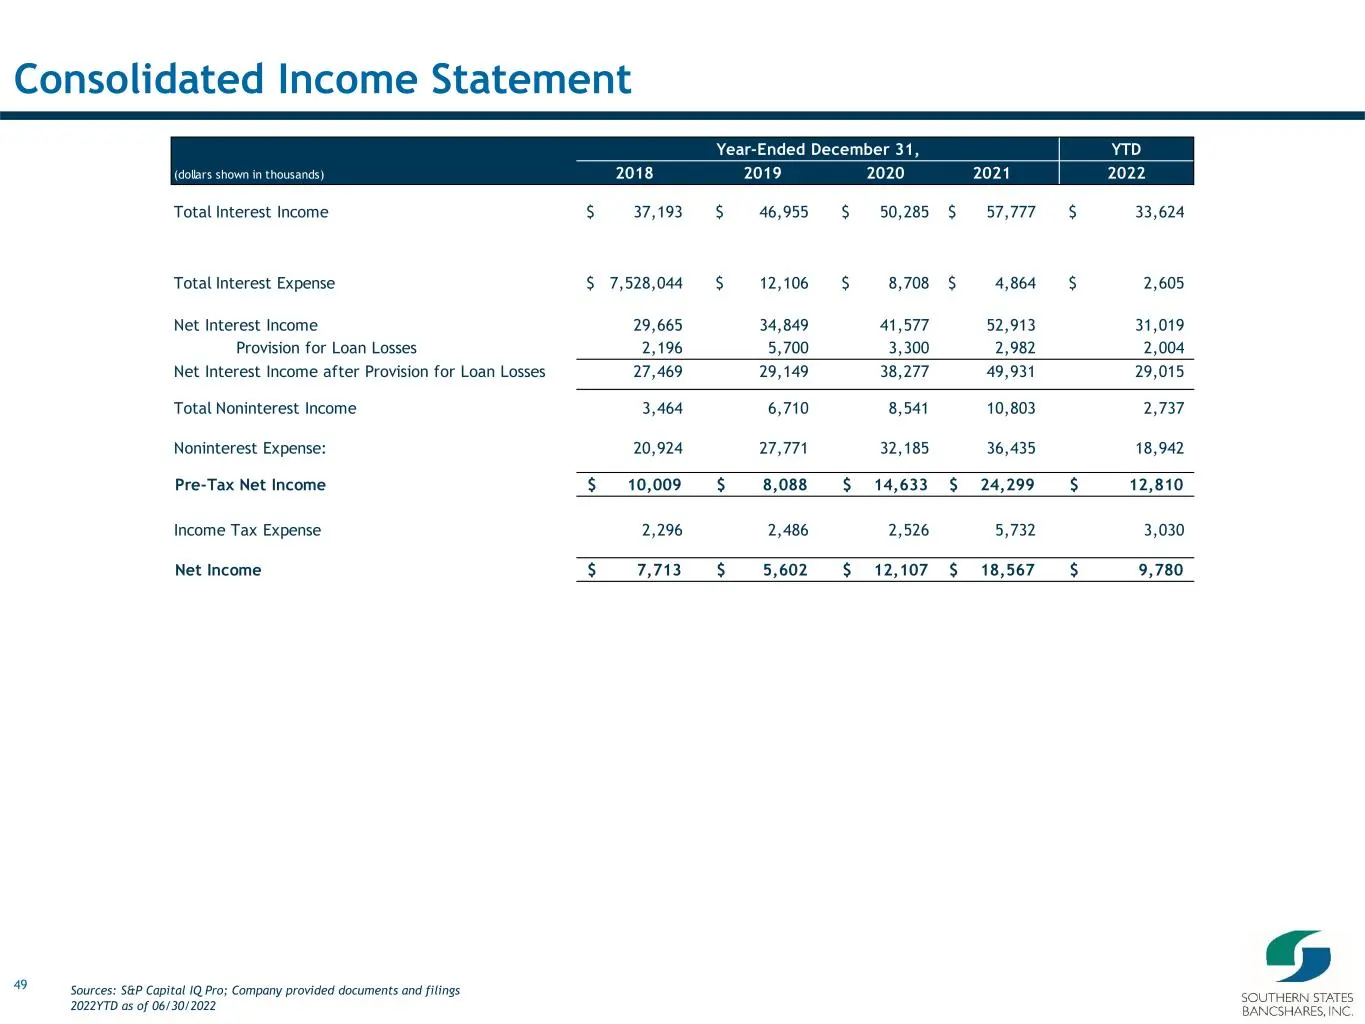
Slide 49: Consolidated Income Statement
49 Consolidated Income Statement Year-Ended December 31, YTD (dollars shown in thousands) 2018 2019 2020 2021 2022 Total Interest Income 37,193$ 46,955$ 50,285$ 57,777$ 33,624$ Total Interest Expense 7,528,044$ 12,106$ 8,708$ 4,864$ 2,605$ Net Interest Income 29,665 34,849 41,577 52,913 31,019 Provi
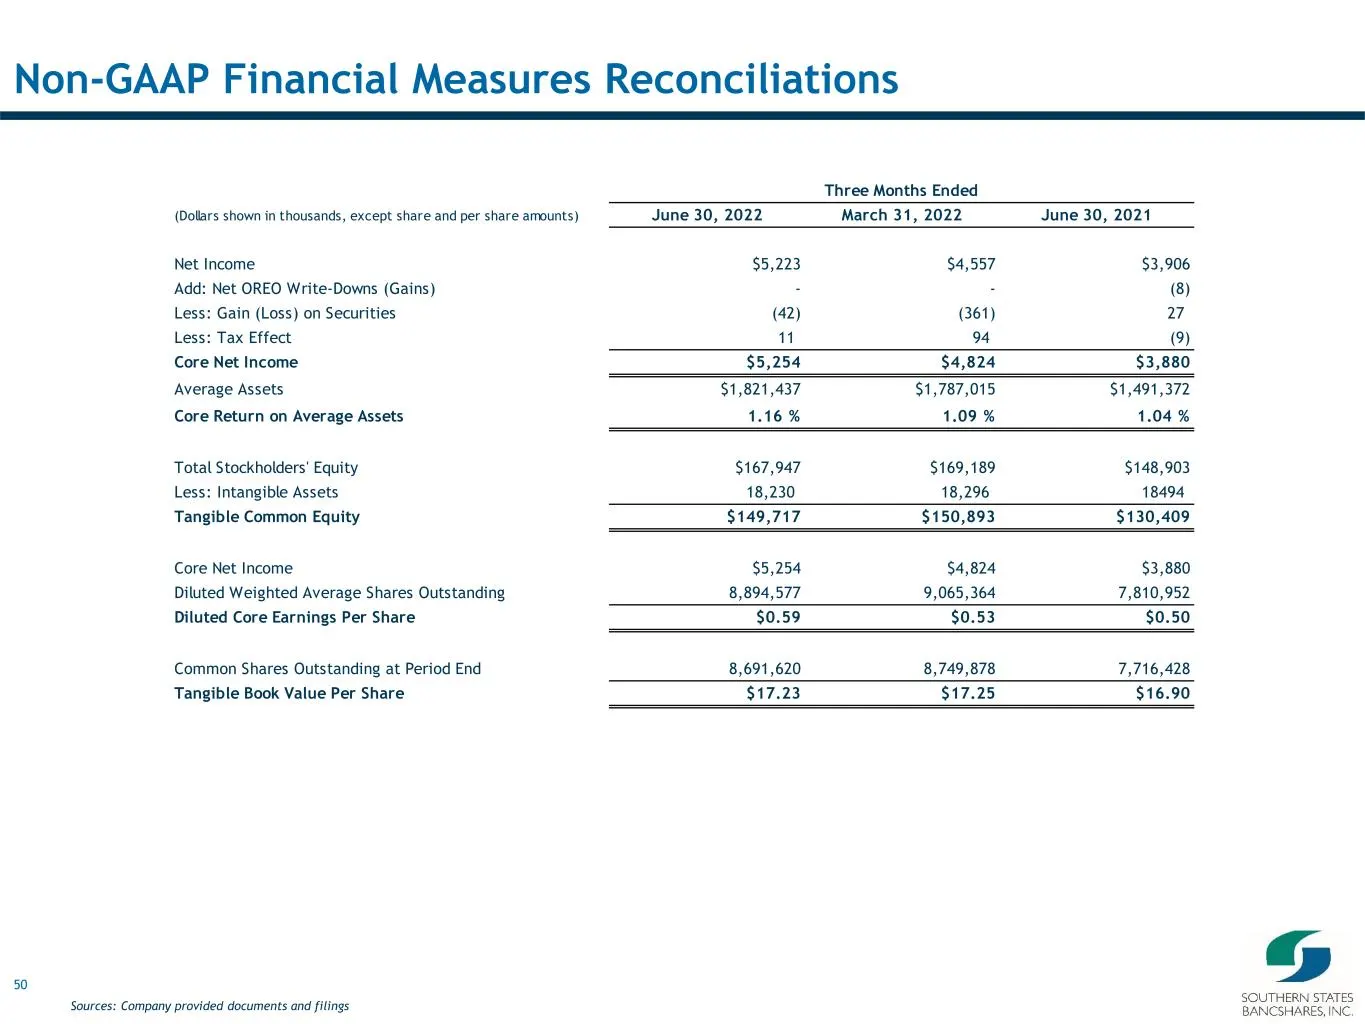
Slide 50: Non-GAAP Financial Measures Reconciliations
50 Non-GAAP Financial Measures Reconciliations Sources: Company provided documents and filings Three Months Ended (Dollars shown in thousands, except share and per share amounts) June 30, 2022 March 31, 2022 June 30, 2021 Net Income $5,223 $4,557 $3,906 Add: Net OREO Write-Downs (Gains) - - (8) Less
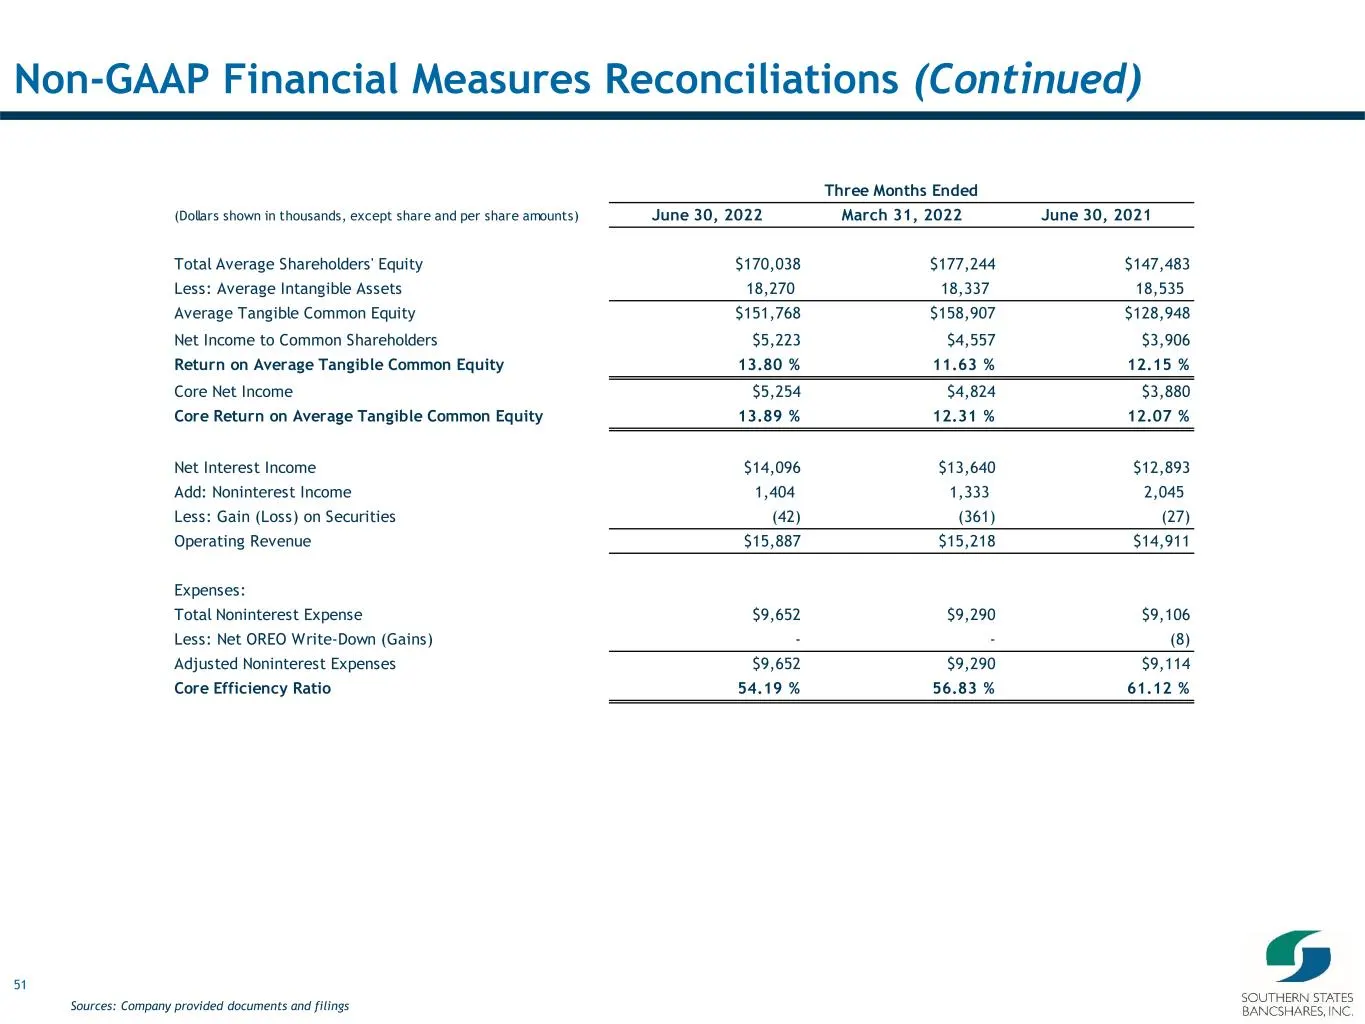
Slide 51: Non-GAAP Financial Measures Reconciliations (Continued)
51 Non-GAAP Financial Measures Reconciliations (Continued) Three Months Ended (Dollars shown in thousands, except share and per share amounts) June 30, 2022 March 31, 2022 June 30, 2021 Total Average Shareholders' Equity $170,038 $177,244 $147,483 Less: Average Intangible Assets 18,270 18,337 18,535
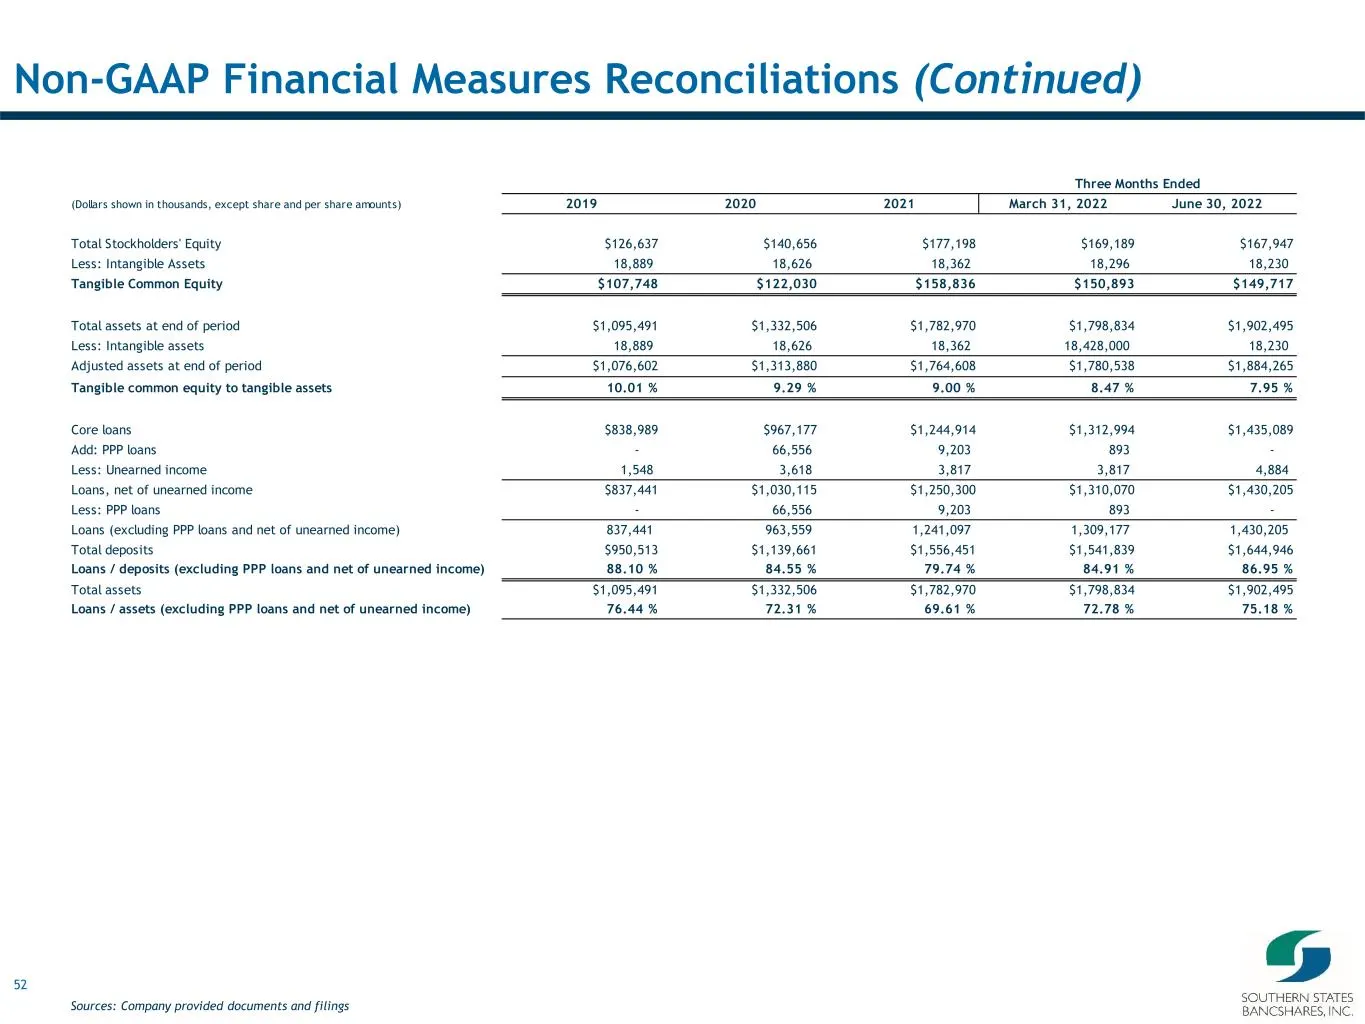
Slide 52: Non-GAAP Financial Measures Reconciliations (Continued)
52 Non-GAAP Financial Measures Reconciliations (Continued) Three Months Ended (Dollars shown in thousands, except share and per share amounts) 2019 2020 2021 March 31, 2022 June 30, 2022 Total Stockholders' Equity $126,637 $140,656 $177,198 $169,189 $167,947 Less: Intangible Assets 18,889 18,626 18,
Source: SEC EDGAR · 8-K filed Oct 27, 2022
More decks from Southern States Bancshares Inc
 Stephens Investor Conference 202537 slides · Jun 3, 2025
 Q1 2025 Earnings Presentation22 slides · Apr 22, 2025
 Merger or Acquisition (March 2025)20 slides · Mar 31, 2025
 Q4 2024 Earnings Presentation22 slides · Jan 22, 2025
 Q3 2024 Earnings Presentation19 slides · Oct 22, 2024
 Q2 2024 Earnings Presentation17 slides · Jul 23, 2024