Bridge Capital — D. A. Davidson 10th Annual Financial Services Conference (May 2008)
30 slides from Bridge Capital's conference presentation, May 7, 2008

Slide 1: D. A. Davidson 10th Annual Financial Services Conference
D. A. Davidson 10 th Annual Financial Services Conference Thomas A. Sa Executive Vice President Chief Financial Officer Daniel P. Myers President and Chief Executive Officer May 7, 2008

Slide 2: Forward Looking Statements
Forward Looking Statements Certain matters discussed herein constitute forward-looking statements within the meaning of the Private Securities Litigation Reform Act of 1995, and are subject to the safe harbors created by that Act. Forward-looking statements describe future plans, strategies, and exp

Slide 3: Financial and Trading Snapshot
Bridge Capital Holdings Financial and Trading Snapshot 1 Based on First Call FY08 consensus EPS of $1.32 per share. Market NASDAQ (Global Select Market) Symbol BBNK Recent Price History 5-02-08 52 Wk: High Low $14.98 $24.58 $13.45 Shares Outstanding 6,512,000 Market Capitalization $96.7 million P/E

Slide 4: Bridge Bank
BRIDGE BANK Business Banking Model Established 2001 National Charter (OCC) Offices Two Regional Offices Eight Business Offices 170 Employees Primary Lines of Business 1. Commercial and Industrial 2. Technology Industries 3. Asset-Based Lending/Factoring 4. International 5. SBA and Commercial Mortgag
Slide 5: Our Model
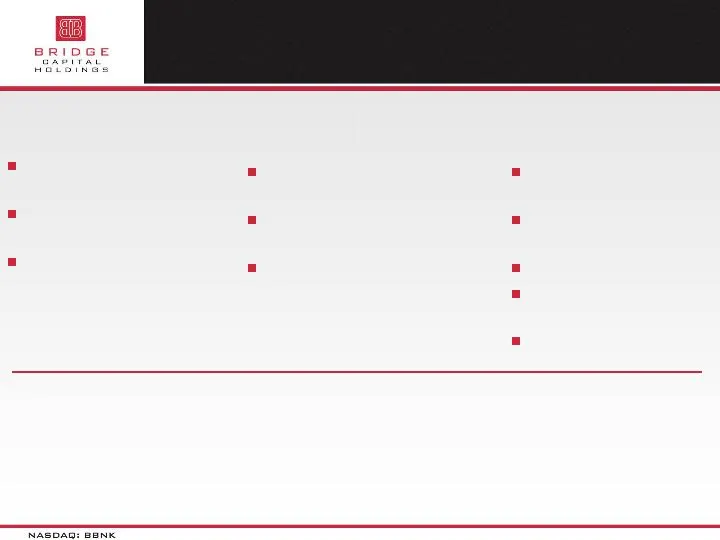
Our Model Opportunity Expertise Execution = Results Fundamental business banking focus Attractive SV/SCC demographics Compelling bank market opportunity + + Experienced board & execs Ability to recruit top-tier bankers Deep and broad relative product and service menu for bank size Strategic vendor a

Slide 6: Our Vision
Our Vision A business banking franchise that is the Professional Business Bank of Choice for small and middle-market businesses and emerging technology companies in Silicon Valley, California and the nation.
Slide 7: Unique Value Proposition
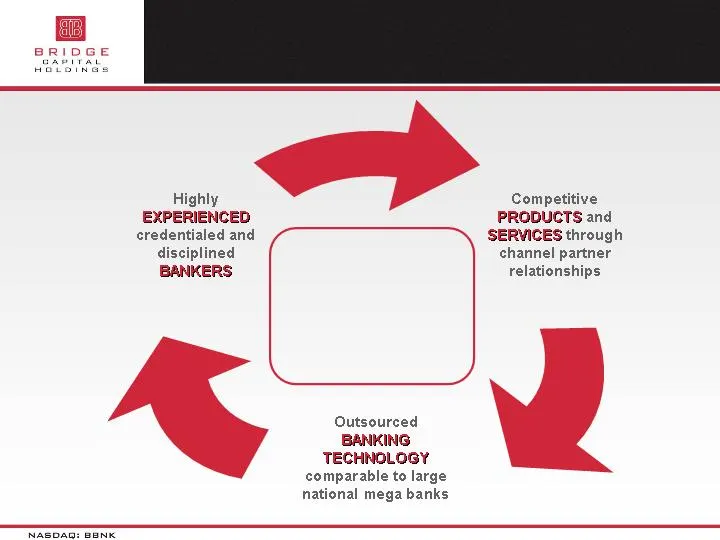
Unique Value Proposition SIMPLIFIED customer experience. SOPHISTICATED business banking.

Slide 8: Market Dynamics
Market Dynamics Core region – Silicon Valley* $101b deposit market 1 121k HQ businesses (<250 employees) 2 Silicon Valley represents 33-36% of US venture capital investment ($10.1b in 2007, $2.6b Q1 ‘08) 3 Population 3.9 million 4 (+3.6% since ’00) San Jose 10 th largest city in US 5 Among highest m
Slide 9: Significant Market Opportunity
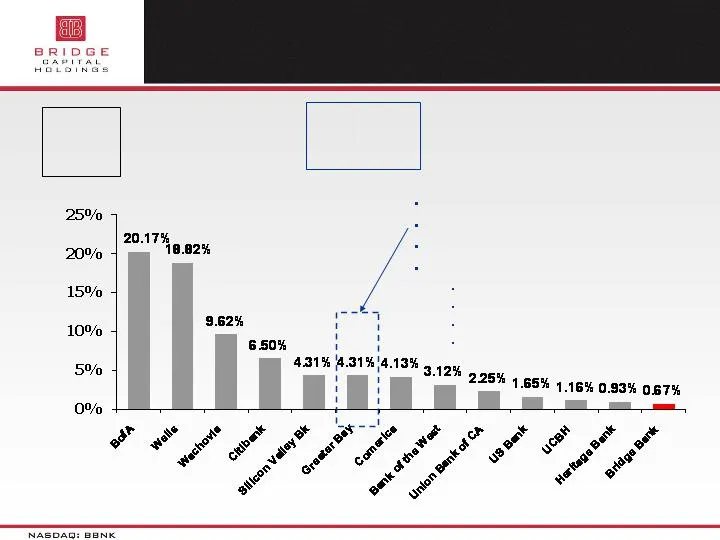
Significant Market Opportunity % Deposits Santa Clara, San Mateo Alameda Counties Source: FDIC; as of June 30, 2007 Silicon Valley Region Deposits: $101.1b Sale to WFB closed 10-01-07 Integration started 3-01-08 $4b deposits Includes former GBBK business banking brands: San Jose National Mid Peninsu

Slide 10: Opportunistic Growth
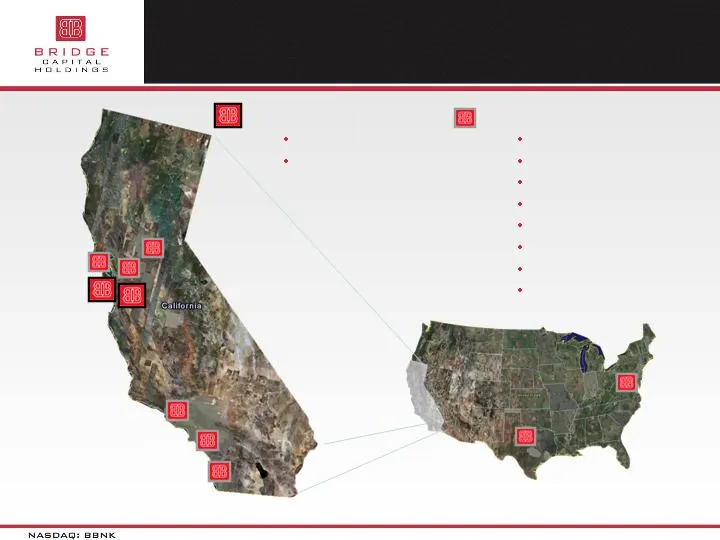
Opportunistic Growth Expansion beyond Northern California Ability to successfully export unique banking model to complimentary markets Leverage core competencies and bank technology for growth opportunities Tech Banking: SoCal, Dallas TX, Reston VA All organic growth and expansion to date
Slide 11: Markets
Markets REGIONAL OFFICES San Jose (Main) Palo Alto BUSINESS OFFICES Sacramento (C&I, SBA) San Diego (SBA) East Bay (C&I) Los Angeles (SBA) Redwood City (const) Dallas, TX (tech) Reston, VA (tech) Orange County (tech)
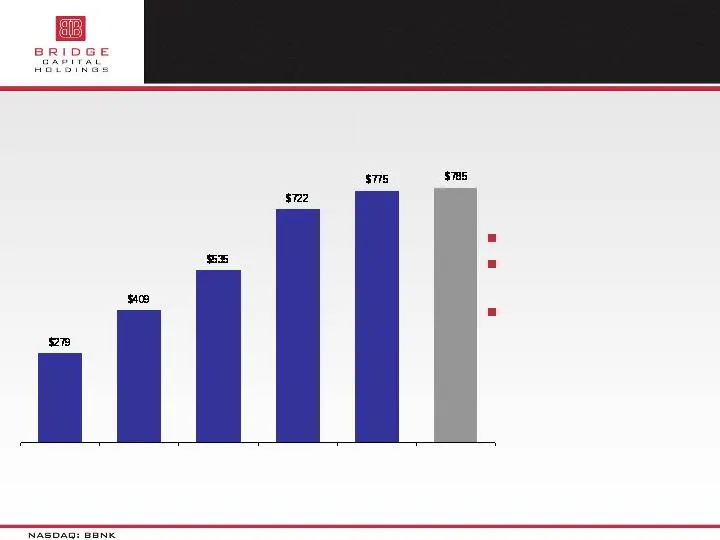
Slide 12: Balance Sheet Growth
Balance Sheet Growth Total Assets in Millions (EOP) 12/31/04 12/31/05 12/31/06 12/31/07 24.3% CAGR (3 Years) Purely Organic Growth Consistent Leverage 12/31/03 03/31/08
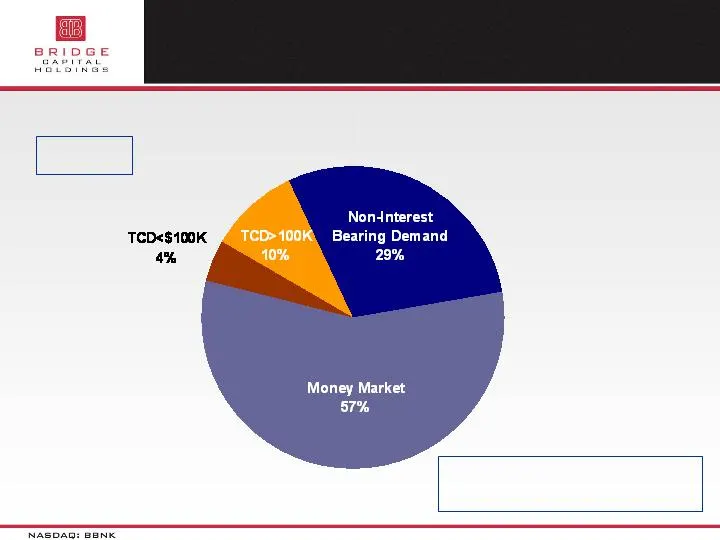
Slide 13: Focus on Core Funding Sources
Focus on Core Funding Sources Deposit Mix as of 3/31/08 Does Not Include Off Balance Sheet Bridge Investment Services Funds $188 Million @ 3-31-08 $689 Million @ 3-31-08
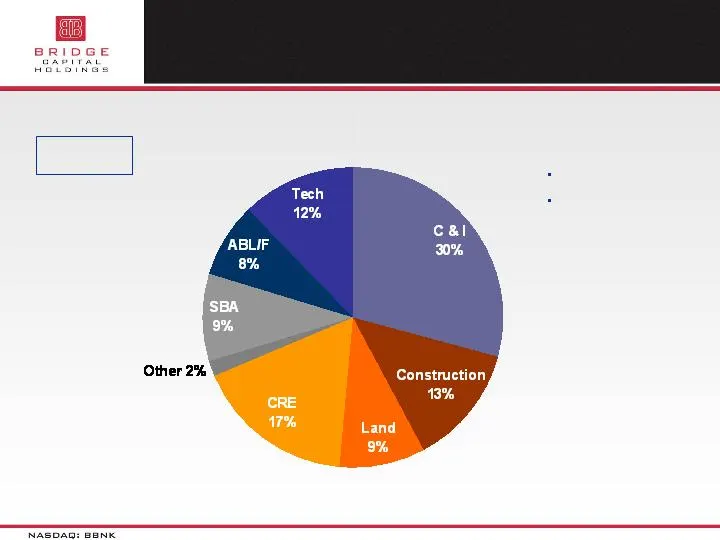
Slide 14: Diversification of Lending Activity
Diversification of Lending Activity Loan Mix as of 3/31/08 $671 Million @ 3-31-08 50% Non RE Loans* Peer = 79%* 98 th Percentile of Peers* * = SNL Data US Public Banks $500M-$1.5b TA at 12-31-07
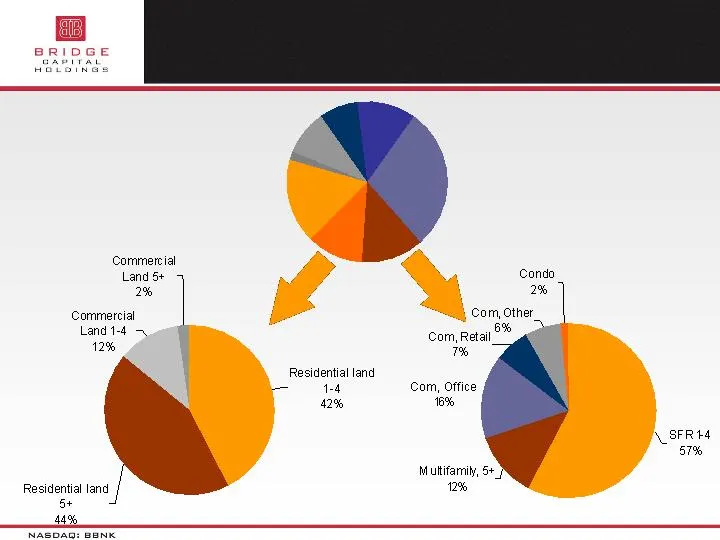
Slide 15: A Closer Look
A Closer Look Total Loan Portfolio Construction (13%) Land Development (9%)
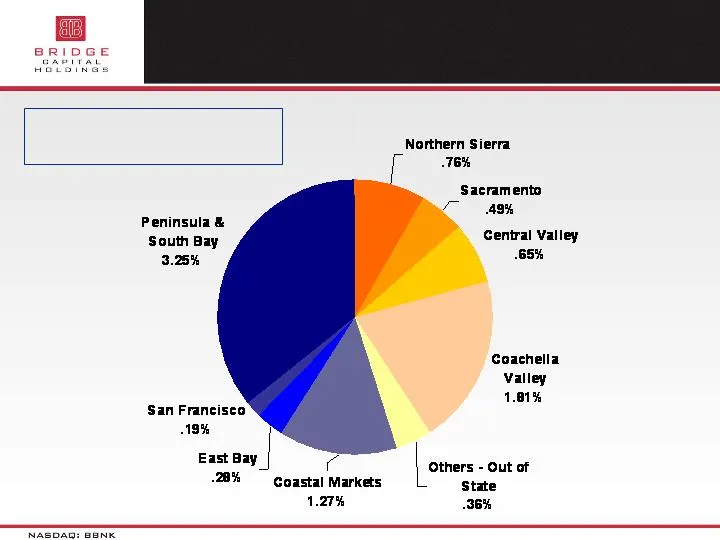
Slide 16: Land Development by Region
Land Development by Region Percentage of Total Loans (9% Land Development)
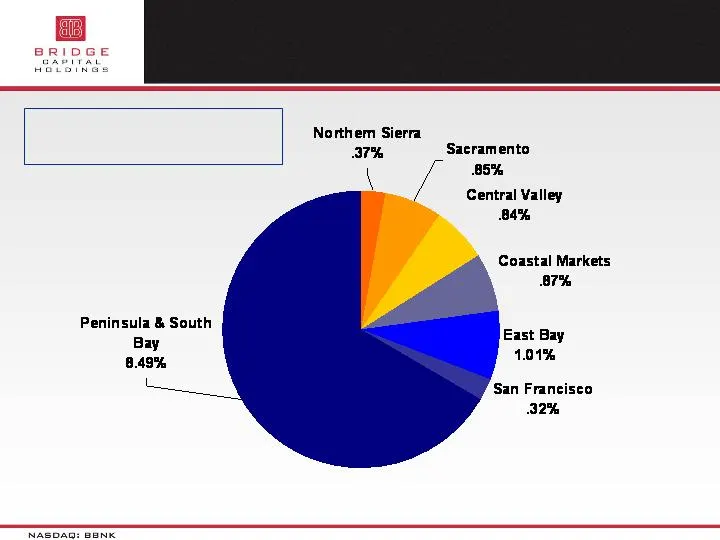
Slide 17: Construction by Region
Construction by Region Percentage of Total Loans (13% Construction)
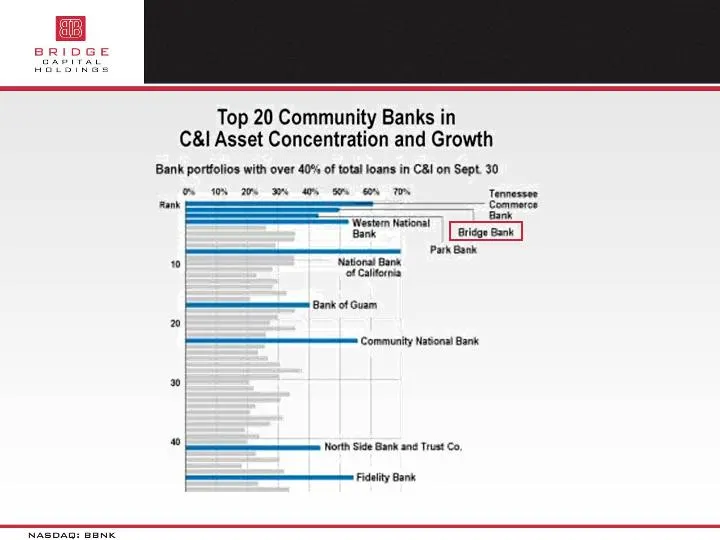
Slide 18: Ranked # for C&I Lending
Ranked # 2 for C&I Lending SOURCE: American Banker magazine, American Bankers Association, September 30, 2007 issue; US banks $500M - $1b Total Assets
Slide 19: Proactive Credit Risk Management
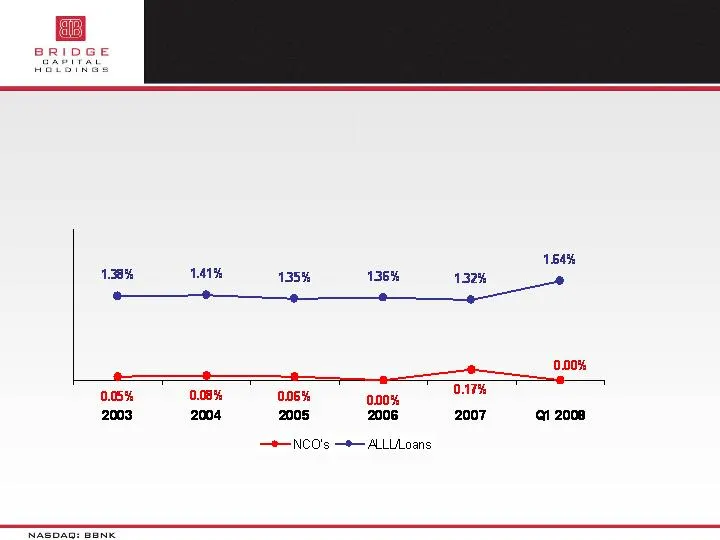
Proactive Credit Risk Management ALLL and Net Charge-Offs % of Average Total Loans
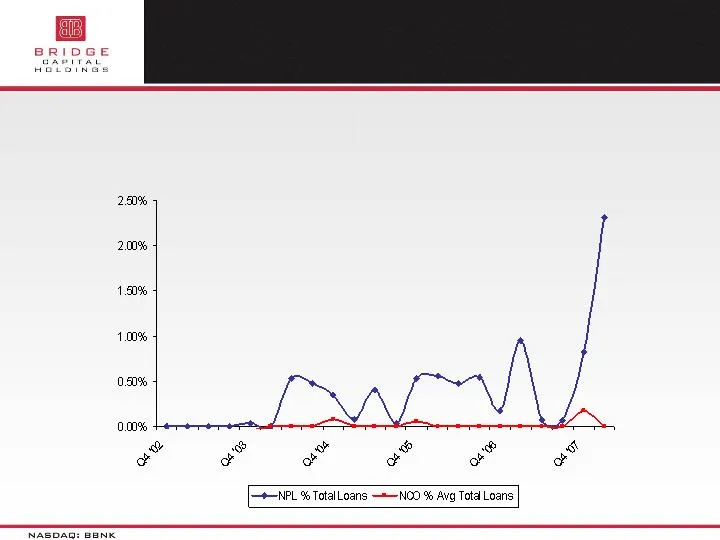
Slide 20: Proactive Credit Risk Management
Proactive Credit Risk Management Average Non-Performing Loans % of Average Total Loans NCO % Average Total Loans are FYE numbers
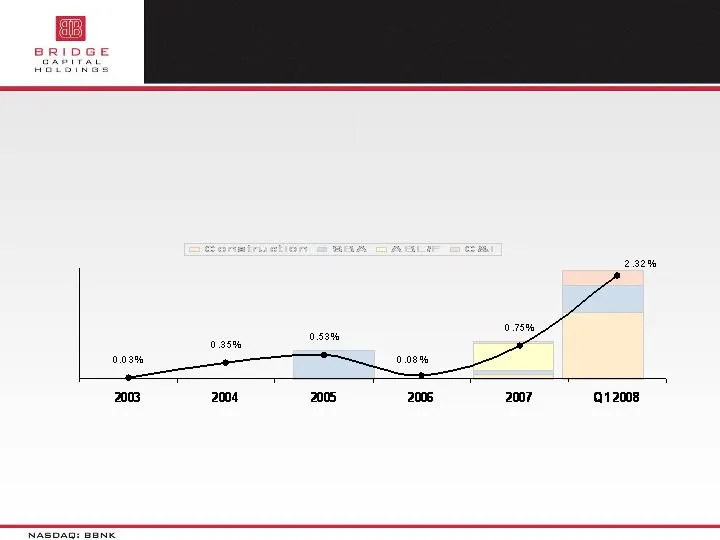
Slide 21: Proactive Credit Risk Management
Proactive Credit Risk Management Average Non-Performing Loans % of Average Total Loans
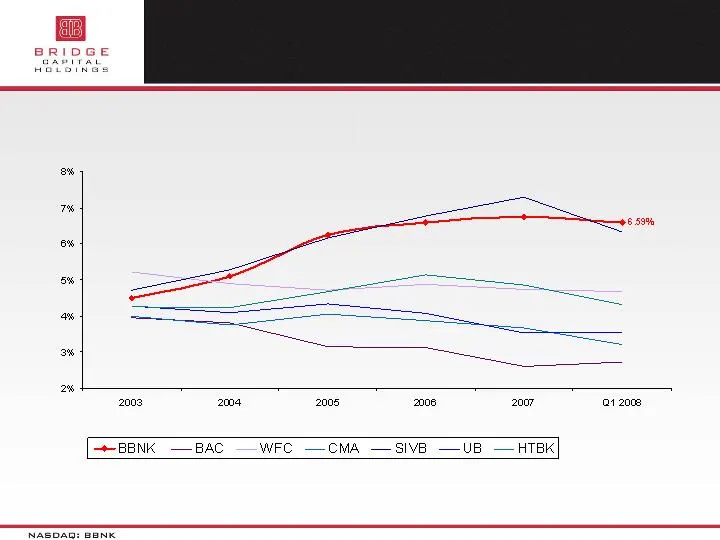
Slide 22: Favorable Comparables
Favorable Comparables Net Interest Margin
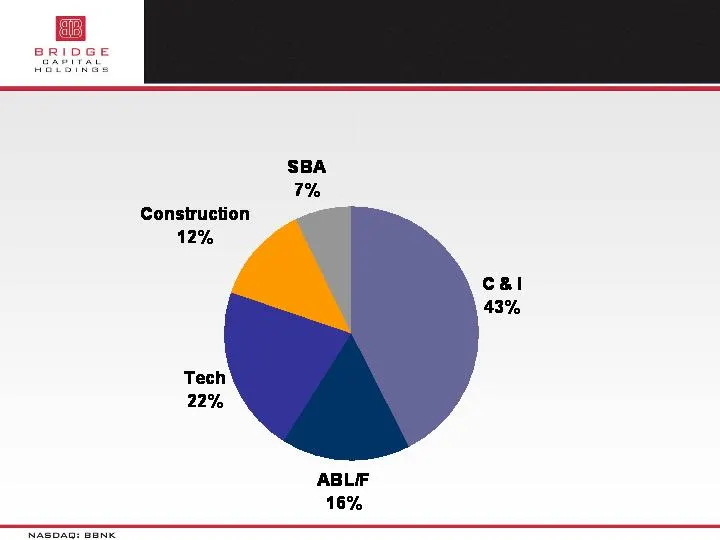
Slide 23: Diversified Revenue Sources
Diversified Revenue Sources Q1 ‘08
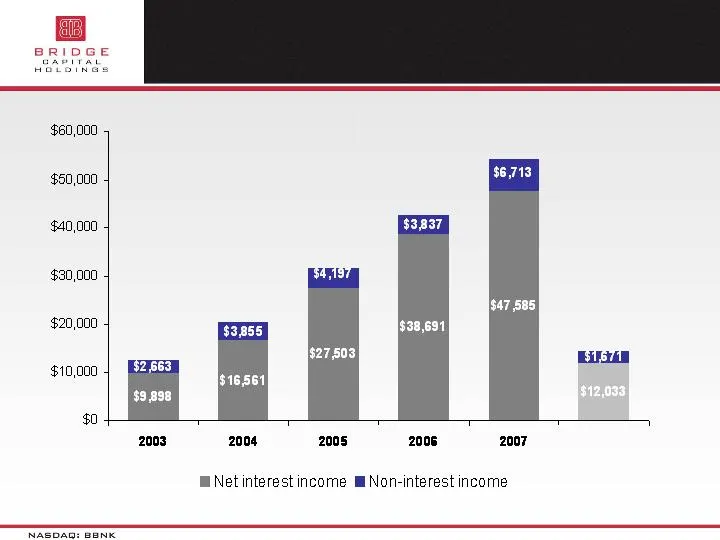
Slide 24: Revenue Growth
Revenue Growth ($ Thousands) Q1 ’08
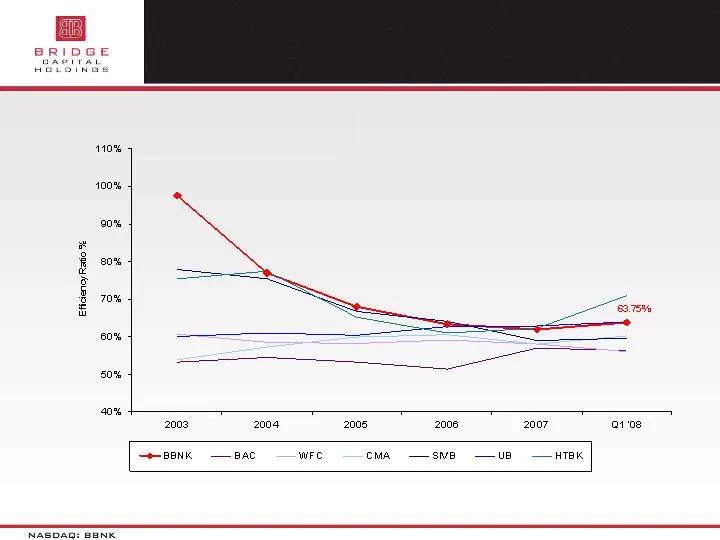
Slide 25: Favorable Comparables
Favorable Comparables Efficiency Ratio
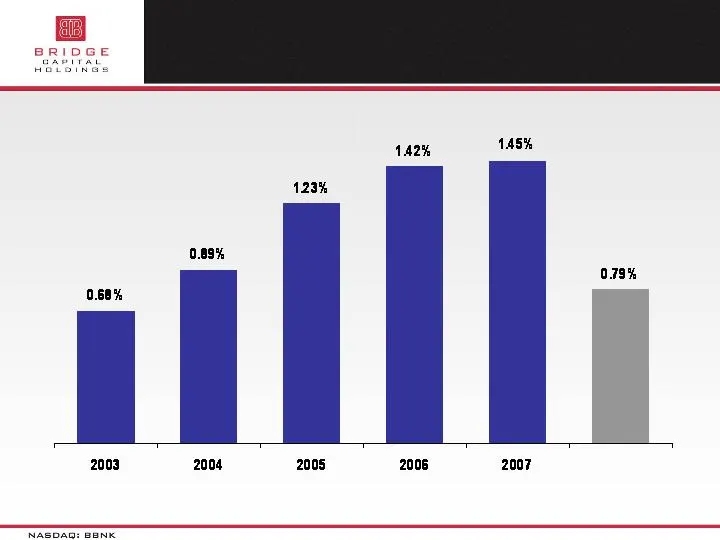
Slide 26: ROAA
ROAA Excludes Recognition of Deferred Tax Asset of $1.9M in FY 2003 Q1 ’08
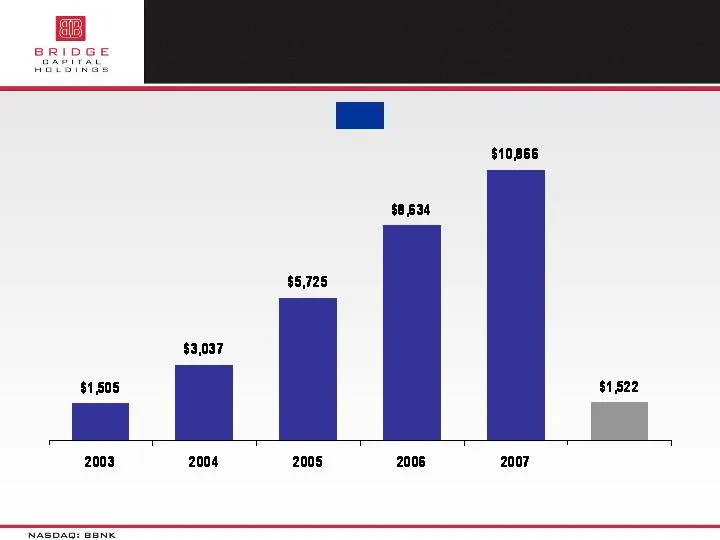
Slide 27: Net Income & EPS
Net Income & EPS $ 0.22 $1.27 $1.57 ($000, except per diluted share amounts) $0.85 $0.46 $0.24 EPS Excludes Recognition of Deferred Tax Asset of $1.9M in FY 2003 Q1 ’08
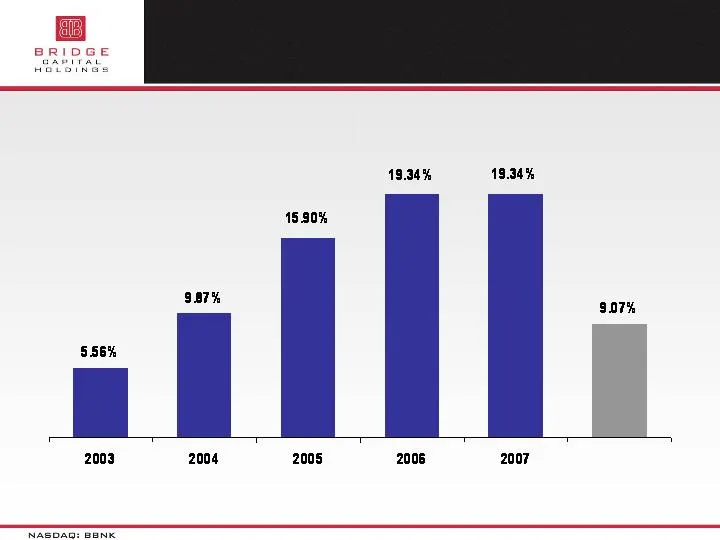
Slide 28: ROAE
ROAE Excludes Recognition of Deferred Tax Asset of $1.9M in FY 2003 Q1 ’08

Slide 29: Why Invest in BBNK?
Why Invest in BBNK? Strong Core Franchise Highly Focused Business Banking Strategy Attractive Silicon Valley Market + Opportunistic Growth True Business Line Diversification Experienced, Disciplined Board & Management All-Organic Growth to-Date Proactive Credit Risk Management Superior Net Interest
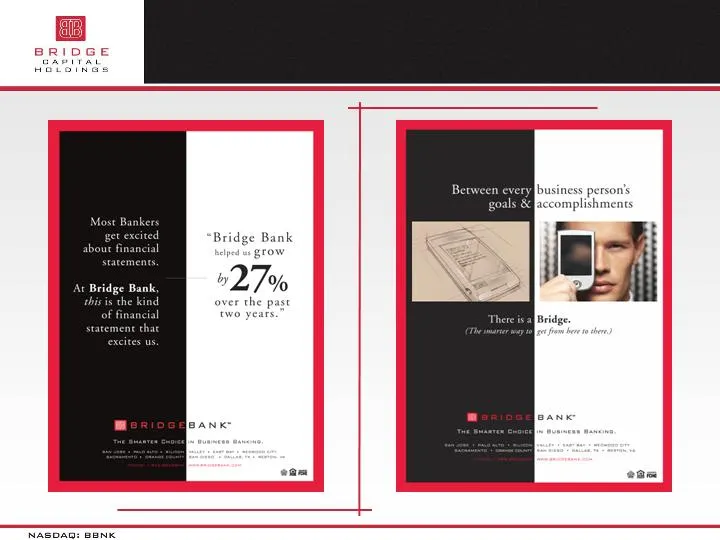
Slide 30: Thank You / Q & A
Thank You / Q & A
Source: SEC EDGAR · 8-K filed May 7, 2008
More decks from Bridge Capital Holdings
 Merger or Acquisition (March 2015)11 slides · Mar 9, 2015
 Q4 2014 Earnings Presentation22 slides · Feb 4, 2015
 Q2 2014 Earnings Presentation23 slides · Jul 29, 2014
 Shareholder Meeting (May 2014)19 slides · May 28, 2014
 Q1 2014 Earnings Presentation23 slides · May 13, 2014
 Q4 2013 Earnings Presentation24 slides · Feb 5, 2014